Article

Adaptive Abnormal Oil Temperature Diagnosis Method of Transformer Based on Concept Drift

School of Software, Nanchang University, Nanchang 330447, China
*
Author to whom correspondence should be addressed.
These authors contributed equally to this work.
Appl. Sci. 2021, 11(14), 6322; https://doi.org/10.3390/app11146322
Submission received: 31 May 2021 / Revised: 25 June 2021 / Accepted: 1 July 2021 / Published: 8 July 2021
(This article belongs to the Special Issue Machine Learning Techniques for the Study of Complex Systems)

Abstract

:
The diagnosis of abnormal transformer oil temperature is of great significance to guarantee the normal operation of the transformer. Due to concept drift, the oil temperature abnormal diagnosis of the oil-immersed main power transformer is usually unstable via the classic data mining method. Thus, this paper proposes an adaptive abnormal oil temperature diagnosis method (AAOTD) of the transformer based on concept drift. First, the bagging ensemble learning method was used to predict the oil temperature. Then, abnormal diagnosis was performed based on the difference between the predicted oil temperature and the actual measured oil temperature. At the same time, based on the concept drift detection strategy and Adaboost ensemble learning methods, adaptive update of the base classifier in the abnormal diagnosis model was realized. Experiments validated that the algorithm proposed in this paper can significantly reduce the influence of concept drift and has higher oil temperature prediction accuracy. Furthermore, since this method only utilizes the existing power grid data resources to realize abnormal oil temperature diagnosis without extra monitoring equipment, it is an economic and efficient solution for practical scenarios in the electric power industry.

1. Introduction

The transformer is a core piece of equipment in the power system [1]. If the transformer is overloaded for a long time, then the oil temperature of the transformer will be conspicuously higher than the normal standard, the components of the transformer will experience accelerated aging, and the working condition of the transformer will be unstable [2]. Therefore, the abnormal diagnosis of transformer’s oil temperature is a significant issue to maintain the stable and safe operation of the transformer.
In recent decades, there has been important progress in the field of transformer oil temperature abnormal diagnosis. However, traditional transformer oil temperature abnormal diagnosis is generally based on the thermal circuit model and oil chromatographic analysis [3]. Based on the monitoring and analysis of related parameters from the chromatographic method, it can be judged whether the top-level oil temperature of the transformer is abnormal or not. Although the accuracy of the chromatographic method is high, it still has many problems, such as complicated parameter adjustment, the expensive cost of deployment, equipment maintenance, etc. Those problems make it difficult to widely use this method in most practical scenarios.
With the development of artificial intelligence research, scholars have attempted to use machine learning technology to analyze historical working condition data of the transformer to diagnose the abnormal oil temperature of the transformer. He et al. [4] proposed a method based on the artificial neural network to predict the top-level oil temperature of the transformer. Pradhan et al. [5] proposed a method based on the ANN algorithm to predict the internal oil temperature of the transformer. Du et al. [6] applied the least squares support vector machine, integrated with the adaptive boost algorithm, to the transformer fault diagnosis. However, Galdi et al. [3] found that the method based on machine learning is more convenient and easier to realize, but the accuracy of this type of diagnosis method is generally not high. However, based on our research, we found that the reason leading to the low accuracy is always related to unpredictable fluctuations of transformer working condition data, which are caused by the continuous oxidation of the internal components of the transformer and the irregular fluctuation of the power load of the transformer [7]. It can be considered as a typical concept drift phenomenon.
Concept drift means that the performance of the previously trained classification model or regression model may experience irregular and sharp deterioration when the probabilistic distribution of data changes over time [8]. Since concept drift was proposed by Schlimmer in 1986 [9], it has remained a hot research topic in the field of machine learning.
To date, several researchers have obtained results regarding the problem of data concept drift. The existing processing methods can be roughly divided into incremental learning [10] and ensemble learning [11,12]. The incremental learning method uses a single classifier to learn from data and dynamically adjusts the model to achieve the characteristics of adapting to data changes. For example, the concept drift detection method based on a sliding window obtains new samples by continuously sliding the window forward for incremental learning and performs comparisons with the old distribution data to detect concept drift [13,14]. A common method is the concept drift detection method based on a single window (SWCDS), which detects the changes of data distribution by periodically detecting the change of the classification error rate in the sliding window [13]. Du L et al. [15] proposed a window adjustment method based on information entropy to determine the distribution of new and old instances of the window (ADDM) in 2014. Ali et al. [16] proposed an accelerated Hoeffding drift detection method (FHDDM). However, the forgetting mechanism of a single classifier still has many problems, such as difficulty in window selection, nonconvergence, unstable learning, and unsuitability for the detection of gradual concept drift.
Therefore, many researchers have constructed multiple simple classifiers, namely ensemble learning, to overcome the problem of data concept drift. Soares et al. [17] proposed an on-line weighted ensemble (OWE) method based on a regression model which can retain the old concept information when the concept recurs. The AWE [18] algorithm is improved on the basis of algorithm SEA, which sets weights according to the classification accuracy of each base classifier and directly replaces the base classifier with the smallest weight when updating the classifier. The CDOL algorithm [19] consists of two weighted base classifiers. After detecting the concept drift, the new base classifier is trained with new samples, and the one with the smaller weight in the original base classifier is removed. Song et al. [20] proposed a new ensemble model, namely dynamic clustering forest (DCF), which is used for the concept drift of text stream classification. However, the adaptive ensemble learning method only evaluates which base classifiers to delete based on the classification accuracy of each base classifier for the current data block, ignoring the historical importance of the base classifier. In addition, a small concept may cause historical importance base classifiers to be deleted by mistake, causing the retained base classifier to not be globally dominant. Thus, it is difficult to obtain good prediction results [21].
One of the mainstream ideas for detecting concept drift is to judge whether the drift has occurred based on the change trend of the classification model test accuracy [22,23]. This idea needs to ensure that the classification model decides on the new sample before it proceeds to the next training. The detector analyzes the change trend of classification accuracy in time [24]. Aiming at the problem of concept drift in the abnormal diagnosis of transformer oil temperature, this paper proposes an adaptive oil temperature abnormal diagnosis method based on concept drift. The main work is as follows:
1.
The diagnosis method of transformer abnormality is proposed. First, a series of base classifiers are generated in parallel using datasets randomly selected from a dataset of transformer historical operating conditions. Then an integrated decision is made with the help of a voting weighting mechanism to predict the oil temperature of the transformer. Finally, the abnormal diagnosis of the transformer is performed based on the relationship between the predicted oil temperature, the measured oil temperature and the time of the three judgment thresholds.
2.
A concept drift detection method based on three-branch decision and an adaptive update algorithm of classifier based on ensemble learning are proposed to judge which decision should be made through the test accuracy of the model. If the decision model is no longer applicable to the data at this stage, the base learners and weights are adjusted according to the learning effect of each base learner on the previous data. In this way, the poorly performing base learners in the model are continuously replaced to ensure that each base classifier in the model is optimized. The model converge quickly and achieves stable learning results, and the historical importance of the base classifier is not ignored. The model can be adapted to the concept drift data stream.
This paper is organized as follows. After the introduction in Section 1, Section 2 illustrates the dataset in this paper and explains the methodology of adaptive abnormal oil temperature diagnosis method (AAOTD). Section 3 analyzes and discusses the experimental results to validate the efficiency of AAOTD method. Section 4 summarizes the work of this paper and represents our perspective.

2. Materials and Methods

2.1. Dataset of the Transformer’s Working Condition and Oil Temperature

The oil temperature working condition dataset of the oil-immersed transformer recorded the parameters related to the operation of the oil-immersed transformer. These parameters included the timestamp of working condition data (OCCUR_TIME); active power of the high-voltage side, medium-voltage side, and low-voltage side (YG_YC_G/Z/D); reactive power of the high-voltage, medium-voltage, and low-voltage side (WG_YC_G/Z/D); power factor of the high-voltage, medium-voltage, and low-voltage side (COS_G/Z/D); AC current RMS value of the high-voltage, medium-voltage, and low-voltage side (I_YC_G); winding temperature of the A/B/C phase (RZWDA/B/C_YC); and the oil temperature of the A/B/C phase (YWA/B/C_YC). The sample period was 5 min. The specific explanation of the above parameters related to the transformer is shown in Table 1:
The external environment of the transformer can conspicuously influence the heat radiation of the transformer, such as the rise of the transform’s restraining temperature due to cold and windy weather. Therefore, in this paper, the weather data at the location of the transformer were also taken into consideration as important parameters, including the timestamp of weather data (OCCUR_TIME), local temperature (TEMPERATURE), highest temperature of the day (HIGH_TEMPERATURE), lowest temperature of the day (LOW_TEMPERATURETEM), rainfall capacity (RAIN), wind direction (WIND_DIRECTION), wind velocity (WIND_VELOCITY), pressure (PRESSURE), and humidity (HUMIDITY). The sample period was 5 min. The specific explanation of the above parameters related to the weather data is shown in Table 2:
The formal expression of the dataset for the abnormal oil temperature abnormal diagnosis of transformer in information system is IS = X , Y , where X are the attributes of working conditions with weather data and Y are the decision attributes, which are oil temperature from the sensors measurement at 1 phase of the transformer.

2.2. Abnormal Detection of Oil Temperature Based on Bagging Ensemble Learning

Based on background knowledge about the strong correlation between transformer working conditions and oil temperature, this paper proposes an abnormal detection approach of the transformer oil temperature based on bagging ensemble learning. According to bagging ensemble learning, the oil temperature prediction model is organized with a set of base classifiers and their power weights, which are trained in parallel by random sampling from historical working condition datasets and oil temperature datasets with replacements.
The steps of Algorithm 1 are described as follows:
Algorithm 1. Oil Temperature Prediction Based on Bagging Ensemble Learning.
  Input: Training dataset IS = X 1 , Y 1 , X 2 , Y 2 , , X n , Y n , which includes the historical working condition dataset of transformer X , historical oil temperature dataset Y, and initial base classifiers C = C 1 , C 2 , , C k .
  Output: Trained base classifiers C and their power weights w = w 1 , w 2 , , w k .
  The Steps of Algorithm 1:
Step 1. Sample k training datasets IS 1 ,   IS 2 , ,   IS k from IS independently from X with corresponding Y , where X j X and Y j Y .
Step 2. Train base classifier C j from training set IS j . Therefore, k training datasets from IS j   IS can independently construct k base classifiers C j C .
Step 3. The expected value of predicted oil temperature TY can be calculated as TY = i = 1 k w i Y i from k prediction results Y i of C i , according to C i C , and w i   w , where w i = 1 / k and i = 1 k w i = 1 .
Step 4. Algorithm ends.
According to trained base classifiers C and their power weights w from Algorithm 1, the present oil temperature can be predicted from the present working condition data.
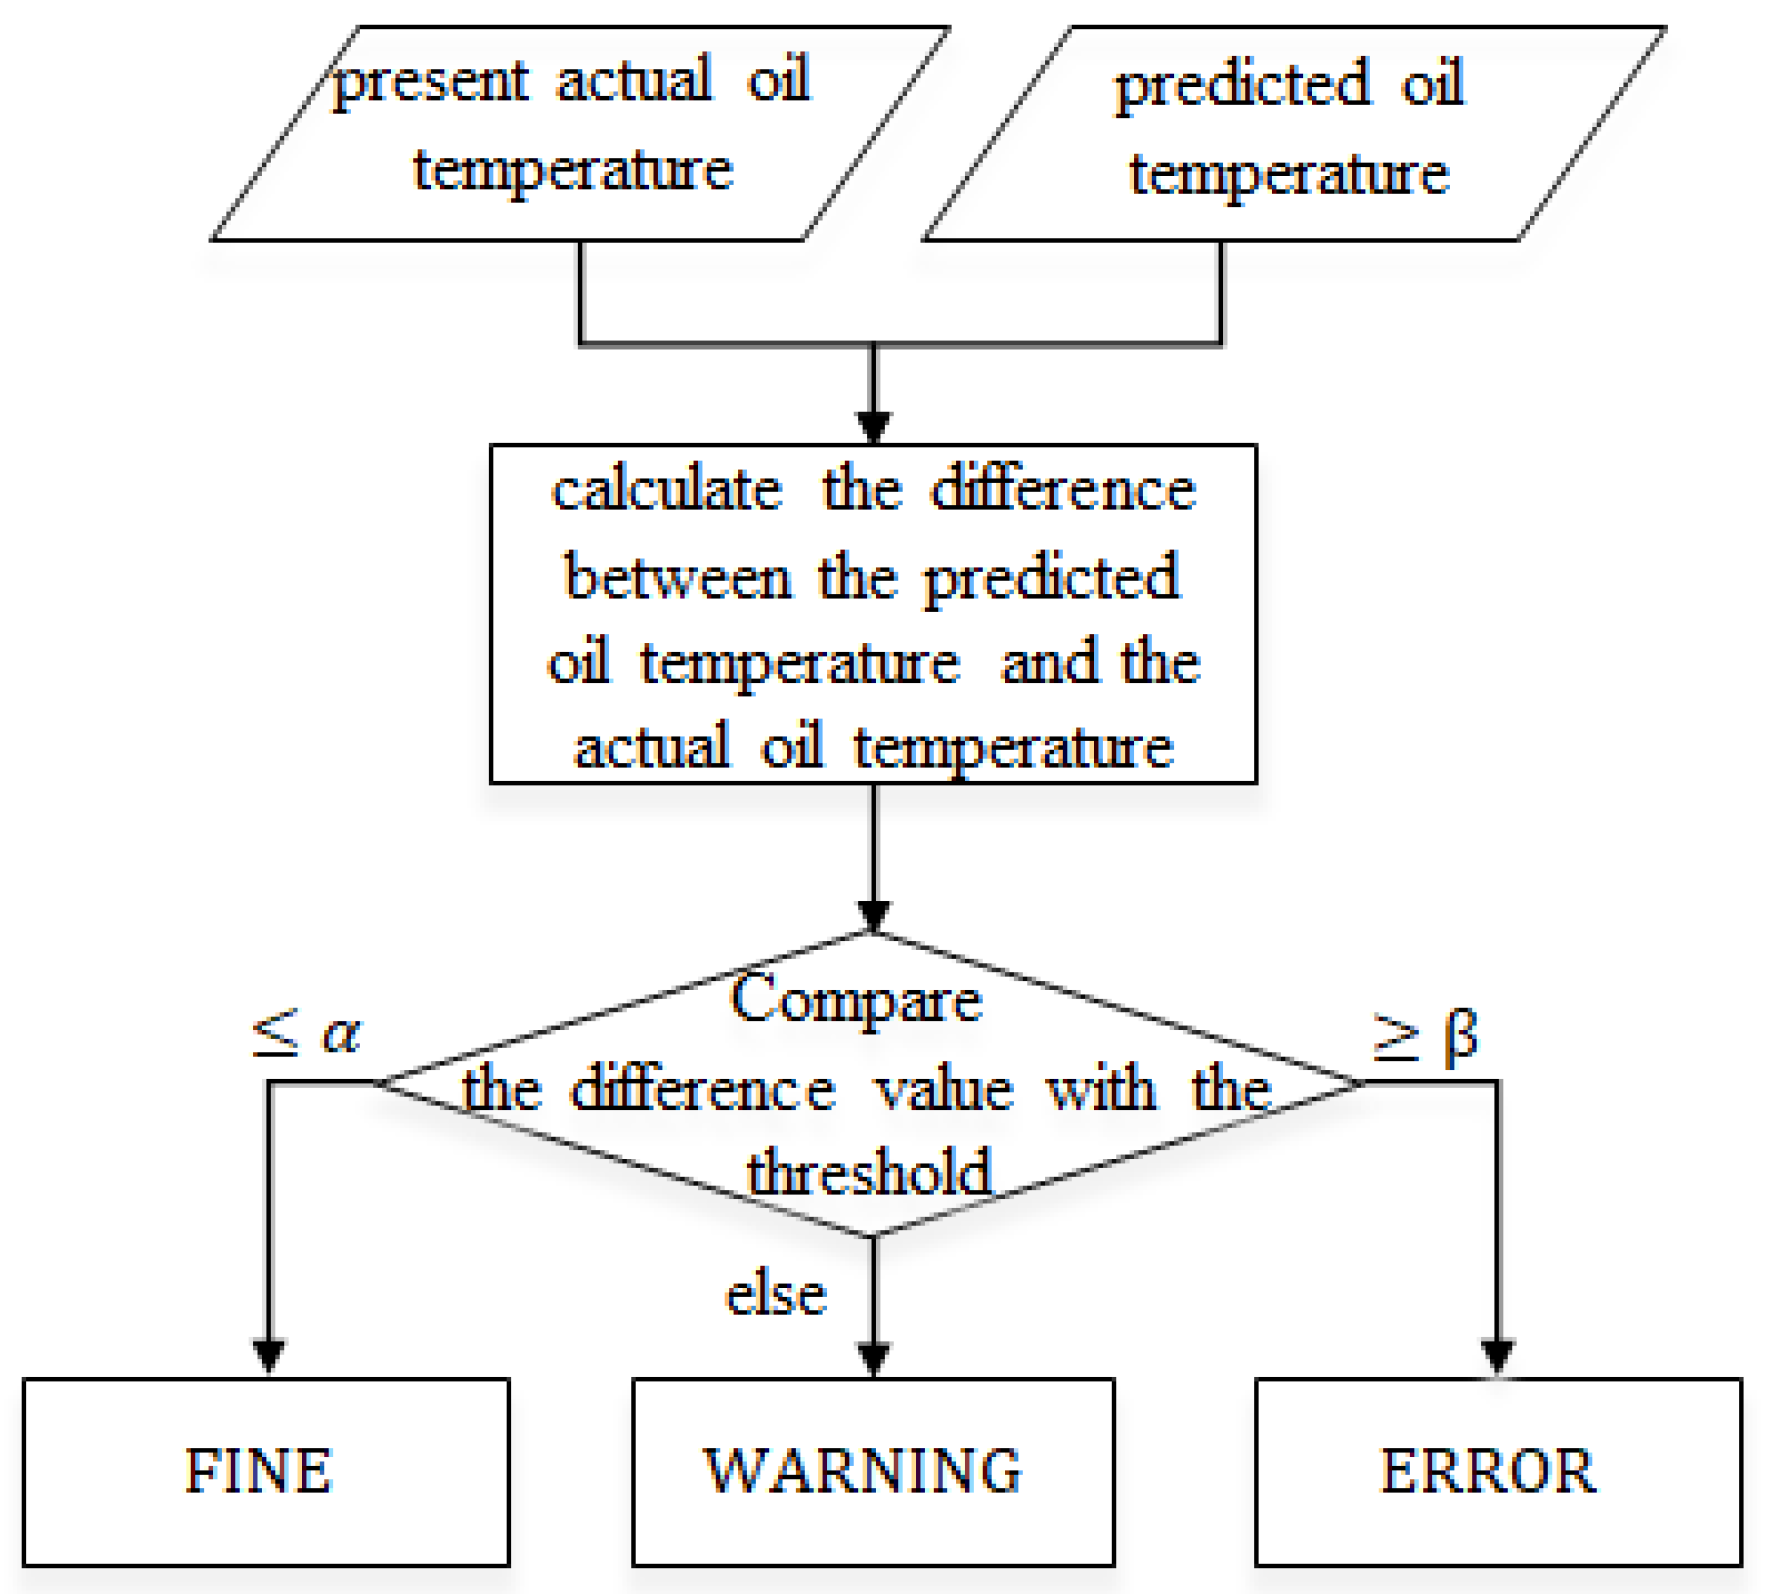
Furthermore, through 2 preset thresholds α , β , 0 < α < β < 1 , the deviation rates between the predicted oil temperature and actual oil temperature can be used to judge the present working state of the transformer using the 3-way decision-making rule. The flowchart of the 3-way decision-making rule is shown in Figure 1.
The detailed steps of Algorithm 2 are described as follows:
Algorithm 2. Abnormal Detection of the Transformer’s Working State.
  Input: Present working condition data TS , present actual oil temperature Y , k base classifiers C = C 1 , C 2 , , C k and their power weights w = w 1 , w 2 , , w k , and 2 preset thresholds α and β .
  Output: k base classifiers C and their power weights w , working state of transformer S .
  The Steps of Algorithm 2:
Step 1. Input the present transformer’s working condition data TS into k trained base classifiers C , respectively, and obtain k values of prediction Y 1 , Y 2 , , Y k .
Step 2. Calculate the expected value of k prediction results TY = i = 1 k w i Y i as the present predicted oil temperature.
  The steps of Algorithm 2 are described as follows:
  Step 2.1. If TY Y / Y α , then the working state of transformer S = FINE , and the algorithm ends. Otherwise, it goes to the next step.
  Step 2.2. If α < TY Y / Y < β , then the working state of transformer S = WARNING , which means the transformer has potential problems but can still work, and the algorithm ends. Otherwise, go to the next step.
  Step 2.3. If TY Y / Y β , then the working state of transformer S = ERROR , which means the transformer has serious problems and should stop to overhaul.
Step 3. Algorithm ends and outputs C , w , and S .
The above oil temperature prediction and abnormal detection model based on bagging ensemble learning is the foundation of the oil temperature abnormal diagnosis method in this paper. However, if concept drift occurs in the working condition dataset of the transformer, then the prediction and abnormal detection model will have obvious bias and inevitably lead to the incorrect diagnosis result.

2.3. Concept Drift Solution of Oil Temperature Prediction and Abnormal Detection Model

Given that the specified factors, such as the aging of the transformer’s components, cause the fluctuation of the transformer’s working condition feature, concept drift always influences the result of oil temperature prediction. Therefore, in this paper, a concept drift solution based on performance testing is proposed to reduce the influence of concept drift.
Suppose that, during timeseries t = t 1 , t 2 , , t n , there is transformer’s working condition data series V x = X t 1 , X t 2 , , X t n and the actual oil temperature data series V y = Y t 1 , Y t 2 , , Y t n , where X t i V x represents the working condition data at t i time, and Y t i V y represents the oil temperature data at t i time. According to the transformer’s working condition data series V x , the predicted oil temperature results V y = Y t 1 , Y t 2 , , Y t n can be obtained from the oil temperature prediction model.
Definition 1.
Relative Error Rate of Oil Temperature Prediction.
The relative error rate is the quotient of the absolute difference between the predicted oil temperature and actual oil temperature divided by actual oil temperature. The formal equation of relative error rate δ t i at time t i is as follows:
δ t i = Y t i Y t i Y t i × 100 %
Hence, the set of relative error rate during all time is δ = δ t 1 , δ t 2 , , δ t n .
The preset threshold γ of relative error rate is defined as the warning trigger. If the relative error rate δ t i is greater than threshold γ , then the prediction result considers that concept drift occurred. Otherwise, the prediction is considered without influence from concept drift.
Definition 2.
Three-Way Decision-Making Rule of Conceptual Drift Whether Influences Oil Temperature Predictionor not.
The thresholds of the 3-way decision-making rule were preset as μ and ν . Suppose that the set of relative error rate δ = δ t 1 , δ t 2 , , δ t n exists k elements δ t ,   which are less than the warning threshold γ defined in definition 1. If k is greater than or equal to the threshold   ν , then concept drift influences prediction model, and the detection result will be L = ‘With Influence of Concept Drift’. If k is less than or equal to the threshold μ , then there is no influence of concept drift on prediction model, and detection result will be L = ‘Without Influence of Concept Drift’. If k is less than the threshold ν but greater than the threshold μ , then the decision will be delayed, and detection result will be L = ‘Delay to Make Decision’.
According to Definition 2, the formal expression of 3-way decision-making rule is:
k ν , k μ , μ < k < ν , L = With   Influence   of   Concept   Drift L = Without   Influence   of   Concept   Drift   L = Delay   to   Make   Decision
Note: k is the number of δ t < γ .
Based on definition 2, a concept drift detection algorithm is proposed in this paper. When the relative error rates of a specified number of base classifiers are higher than the preset thresholds, the decision can be made that concept drift has occurred and has obviously influenced the result of the prediction model.
Moreover, to reduce the influence of concept drift on the prediction model, we designed a concept drift detection algorithm. The flowchart of concept drift adaptation is shown in Figure 2.
First, use the concept drift detection algorithm (see Algorithm 3 for details) to detect whether the current concept drift occurs. The process is to calculates the relative error rate on the prediction data using the oil temperature prediction algorithm, and then obtain the detection result through Definition 2. If the result is that the concept drift did not happen, the algorithm ends. If the result requires a delayed decision, then update the prediction data and redetect the concept drift. If the result is that the concept drift happens, the oil temperature prediction model must be adjusted (see Algorithm 4 below for details). The following is a detailed description of Algorithm 3, the detection algorithm of concept drift.
Algorithm 3. Concept Drift Detection Algorithm.
  Input: The present transformer’s working condition data series V x = X t 1 , X t 2 , , X t n , k base classifiers C = C 1 , C 2 , , C k and their power weights w = w 1 , w 2 , , w k , and the present actual oil temperature data series V y = Y t 1 , Y t 2 , , Y t n .
  Output: The prediction result matrix M of all base classifiers and the decision of concept drift detection result L .
  The Steps of Algorithm 3:
Step 1. Initialize the delay decision threshold λ = 0 and the count number of delay decision a = 0 .
Step 2. Input the transformer’s working condition data series V x into k base classifiers C , and, respectively, obtain the prediction results:   M = Y t 1 C 1 Y t 2 C 1 Y t n C 1 Y t 1 C 2 Y t 2 C 2 Y t n C 2 Y t 1 C k Y t 2 C k Y t n C k .
  Note:   Y t i C j M ,   i 1 , n and j 1 ,   k
Step 3. Calculate the expected value of prediction TY = TY t 1 ,   TY t 2 , , TY t n based on   M , where TY t i = j = 1 k w j Y t i C j , i 1 , n and j 1 ,   k .
Step 4. According to Definition 1, calculate relative error rate δ t i = TY t i Y t i / Y t i × 100 % and δ = δ t 1 , δ t 2 , , δ t n .
Step 5. According to the 3-way decision-making rule in Definition 2, the decision L , whether to use the concept drift influence prediction model or not, will be made by the count number m of relative error rate set δ , which are less than the warning threshold γ .
  Step 5.1. If the decision L = ‘With Influence of Concept Drift’, then go to Step 6 and output the decision L and the prediction result matrix M .
  Step 5.2. If the decision L = ‘Without Influence of Concept Drift’, then go to Step 6 and output the decision L .
  Step 5.3. If the decision L = ‘Delay to Make Decision’, then update the count number of delay decision a to a = a + 1 and compare a with the delayed decision threshold λ as following:
    Step 5.3.1. If a λ , then return to Step 5.1.
    Step 5.3.2. if a < λ , then update the transformer working condition data series V x and oil temperature data series V y and return to Step 2.
Step 6. Algorithm ends.
According to the decision from Algorithm 3, the update of prediction model will be executed only when the decision L is ‘With Influence of Concept Drift’.
Based on the decision L of the concept drift detection result and the prediction result matrix M of all base classifiers, the adaptive update algorithm of base classifiers tends to update each base classifier C i C and their power weight w to reduce the influence of concept drift the following Adaboost ensemble learning approach if the decision of concept drift L = ‘With Influence of Concept Drift’.
The Adaptive Update Algorithm of Base Classifiers is described as follows:
Algorithm 4. Adaptive Update Algorithm of Base Classifiers Based on Adaboost Ensemble Learning.
  Input: Prediction result matrix M , present transformer’s working condition data series V x = X t 1 , X t 2 , , X t n , k base classifiers C = C 1 , C 2 , , C k and their power weights w = w 1 , w 2 , , w k , present actual oil temperature data series V y = Y t 1 , Y t 2 , , Y t n , and historical training data set I S = X 1 , Y 1 , X 2 , Y 2 , , X n , Y n .
  Output: Updated base classifiers C and their updated power weights w .
  The Steps of Algorithm 4:
Step 1. Initialize the sample weight η i η 1 , η 2 , , η M , where η i = 1 / M , and i = 1 M η i = 1 , and j = 1 .
Step 2. Update the base classifiers C and their power weights w .
  Step 2.1. Sample M data from I S = X 1 , Y 1 ,   X 2 , Y 2 ,   ,   X n , Y n to obtain training dataset I S j = X 1 , Y 1 ,   X 2 , Y 2 ,   ,   X M , Y M
  Step 2.2. Train base classifier C j u p d a t e d based on I S j , and calculate total error rate e j = i = 1 M η i I Y i Y i , where Y i = C j u p d a t e d X i   is the predicted oil temperature.
  Step 2.3. Update the power weight w j   of base classifier C j .
w j u p d a t e d = 1 2 l o g 1 e j e j (3)
  Step 2.4. Update all sample weights η 1 , η 2 , , η M , and η i η 1 , η 2 , , η M .
η i u p d a t e d = η i o l d exp w j ,     i f   Y i = Y i   η i o l d exp w j ,     i f   Y i Y i (4)
  Step 2.5. Normalize the sample weights η 1 u p d a t e d , η 2 u p d a t e d , , η M u p d a t e d to make i = 1 M η i u p d a t e d = 1 .
  Step 2.6. Set j = j + 1   , and return to Step 2.1 until j = k .
  Step 2.7. Normalize the power weights w 1 u p d a t e d , w 2 u p d a t e d , , w k u p d a t e d to make j = 1 k w j u p d a t e d = 1 .
Step 3. Expected value of predicted oil temperature T Y can be calculated as:
T Y = j = 1 k w j u p d a t e d Y j (5)
where   Y j = C j u p d a t e d T X , C j u p d a t e d C 1 u p d a t e d , C 2 u p d a t e d , , C k u p d a t e d and w j u p d a t e d   w 1 u p d a t e d , w 2 u p d a t e d , , w k u p d a t e d .
Step 4. Algorithm ends.
In summary, Algorithm 1 (Oil Temperature Prediction Based on Bagging Ensemble Learning) was first utilized to construct k base classifiers and their power weights. Then, Algorithm 2 (Abnormal detection of the transformer’s working state) was utilized for the transformer’s abnormal oil temperature diagnosis. After a period of time, Algorithm 3 (Concept Drift Detection Algorithm) was used to evaluate the influence of concept drift. If the concept drift did not influence the prediction result of model such that L = ‘Without Influence of Concept Drift’, then the working state S of the transformer from Algorithm 2 was the final decision of diagnosis. If the concept drift happened and influenced the prediction of model such that L = ‘With Influence of Concept Drift’, then Algorithm 4 (Adaptive Update Algorithm of Base classifiers Based on Adaboost ensemble learning) was used to update the base classifiers and their power weight. Then, we returned to Algorithm 2 again to obtain the final working state S of the transformer.

3. Results Validation

3.1. Introduction of Experiment

The experimental data were collected from 4,110 kv main oil-immersed main transformers in China from January 2018 to July 2018, as well as the local weather data during the same period. These data were equally divided into 18 sections in order of time sequence, and there are the data of 15 days in each section.
In order to validate the efficiency of our proposed adaptive abnormal oil temperature diagnosis method (AAOTD) of the transformer based on concept drift, we utilized five other methods for comparison, including classification and regression tree (CART) [25], random forest (RF) [26], support vector machine (SVM) [27], accuracy weighted ensemble (AWE) [18], and basic abnormal transformer oil temperature diagnosis of the transformer based on ensemble learning without concept drift (BAOTD).
In terms of the advice from experts in the relative domain, the critical parameters of the abnormal oil temperature diagnosis of he transformer were preset as the thresholds α = 0.2 , β = 0.5 , which are the deviation rate between predicted oil temperature and actual oil temperature from Algorithm 2; γ = 0.5 , which is the warning threshold from Definition 1; μ = 3 and ν = 12 , which are the decision-making thresholds from Definition 2; and λ = 6 , which is the delay decision threshold from Algorithm 3.

3.2. Evaluation of Experiment

In this paper, two indicators were used to evaluate the efficiency of the algorithms: Oil temperature prediction accuracy rate P , and oil temperature abnormal warning rate R .
Oil temperature prediction accuracy rate P is illustrated as following:
P = i = 1 N × M A i / N × M
where N is the number of days in an evaluation period and M is the number of prediction procedure per day, so that N × M is the amount of all prediction procedure in one evaluation period. A represents the accuracy rate in one prediction procedure and is described as follows:
A = 1 Y Y Y × ε , ε 1
where Y is the predicted oil temperature, Y is the actual oil temperature, and ε is the factor to magnify the relative difference between the predicted oil temperature and actual oil temperature.
Oil temperature abnormal warning rate R is illustrated as following:
R = m N
where m is the number of days in which warning happened and N is the number of days per sections of dataset, such that N = 15 .

3.3. Result Analysis

Figure 3 shows the broken line graph of the transformer oil temperature prediction accuracy rate of the six algorithms (CART, RF, SVM, AWE, BAOTD, and AAOTD) on the prediction set. The four subgraphs (a), (b), (c), and (d) of Figure 3 represent the experimental results on transformers at four different locations (Xinyu, Gulu, Xuzhou, and Yanghang). Since these six algorithms were trained using historical working condition data before the prediction timepoint, in the initial stage of prediction, all algorithms already had accurate values for the transformer oil temperature (Figure 3).
However, as time passed, uninterrupted oxidation of the internal components of the transformer and irregular changes in the external load of the transformer were likely to cause unforeseen changes in the data of the transformer oil temperature. From the four subgraphs of Figure 3, after the algorithm predicted the transformers in Xinyu, Gulu, Xuzhou, and Yanghang through several prediction sets (after predicting the new data for about 2 months), the accuracy of the four algorithms (CART, RF, SVM, and BAOTD) in oil temperature prediction began to decline to varying degrees.
As the forecast continued, the model became increasingly inaccurate. After comparing with the original historical data, we found that the data distribution changed greatly when the prediction set was 3, 6, 8, 13, 16.
Therefore, the model trained with historical data did not perform well on the new data distribution, and the robustness of the model was poor. It can be seen from the red and brown lines in the four subgraphs (a), (b), (c), and (d) that the performance of algorithm AAOTD proposed in this paper and the commonly used concept drift adaptive algorithm AWE declined to a certain extent at the beginning. However, these two algorithms (AAOTD and AWE) can update themselves with the continuous arrival of new data, which is why the prediction accuracy of these two algorithms is better than the other four algorithms.
Both the AAOTD and AWE algorithms use an ensemble framework to build the algorithm model and use the regression tree model as the base classifier in the ensemble algorithm. The relevant parameter settings of the base classifier are also the same. However, it can be seen from the comparison of the red and brown lines in Figure 3 that the AAOTD algorithm had a higher prediction accuracy than the AWE algorithm. This is because the AWE algorithm only replaces the base classifier by judging whether the performance of the base classifier is lower than the minimum threshold. This update method ignores the historical importance of the base classifier, and a small conceptual fluctuation may cause historically important base classifiers to be deleted by mistake. The method proposed in this paper to detect concept drift based on the three-way decision-making rule is a decision model based on human cognition, which can effectively avoid the influence of false concept fluctuations caused by misjudgment. Moreover, in updating the base classifier, the AAOTD algorithm adopts the update strategy of Adaboost, which makes it possible to avoid ensemble learning to overcome the problem of concept drift in the data.
Given working condition of transformer in Xinyu, Table 3 lists the detail of various methods’ evaluations.
The AWE, AAOTD, and BAOTD algorithms had high accuracy in predicting oil temperature, reaching 98.98%, 99.42%, and 99.54% accuracy, respectively. This is because these three algorithms use an ensemble algorithm model. The final prediction result of the ensemble algorithm was obtained by the weighted average of the oil temperature prediction results of each base learner in the algorithm. Compared with a single complex classifier, this ensemble method has more stable accuracy, which also shows that using integrated algorithms is better in the context of transformer oil temperature prediction.
Table 3 shows the three significant declines in the accuracy of oil temperature prediction. Among them, the accuracy of the BAOTD, CART, RF, and SVM algorithms decreased because these algorithms themselves do not have the ability to adapt to concept drift. When the concept drift occurred in the oil temperature working condition data, the abovementioned algorithms (BALOTD, CART, RF, and SVM) did not use the latest oil temperature working condition data to update the algorithm model, but still used the algorithm model trained with historical oil temperature operating condition data to predict the oil temperature. So, with the continuous change of the concept drift in the oil temperature working condition data, the accuracy of the algorithm model will continue to decline, while the accuracy of the algorithms with self-renewal (AWE and AAOTD) will experience a smaller decline.
For the AAOTD algorithm, when the accuracy of the algorithm changes, the concept drift detection will be performed according to the Concept Drift Detection Algorithm mentioned in Section 2. Then, different decisions will be made according to the Adaptive Update Algorithm of Base Classifiers Based on Adaboost Ensemble Learning algorithm to update the base classifiers, so that the updated base classifier can adapt to the conceptual drift in the oil temperature working condition data. From the data in the table, the final accuracy rate of the oil temperature prediction of the AAOTD algorithm proposed in this paper only slightly decreased, still reaching 95.55%. This shows that the performance of the AAOTD algorithm is stronger than other algorithms used in this experiment.
Next, we input the predicted oil temperature values of the above six algorithms into Algorithm 2 (Abnormal detection of transformer’s working state) and calculated the changes in the warning rate of each algorithm in each prediction set according to Formula 8 to obtain Figure 4.
The four subgraphs (a), (b), (c), and (d) of Figure 4 plot the warning rate changes curves of the transformers in Xinyu, Gulu, Xuzhou, and Yanghang of the six algorithms. The yellow curve represents the abnormal rate of the transformer under real conditions. In real situations, there were fewer cases of warning and error in the transformer. The broken line of the AAOTD and AWE algorithm is more consistent with the broken line in the real situation, among which the AAOTD algorithm is the best.
It can be seen from Figure 4 that the other four algorithms also performed poorly in the early warning of the transformers. This is because they do not consider concept drift, so the accuracy of oil temperature prediction was not high, which led to poor diagnosis results of abnormal transformers.
Overall, the AAOTD algorithm proposed in this paper had a higher oil temperature prediction accuracy and more correct oil temperature abnormal warning rate in the oil-immersed transformer-related dataset. Compared with classic concept drift adaptation algorithms and other machine learning algorithms that do not consider that the transformer oil temperature working condition data is prone to concept drift, this algorithm has concept drift adaptation capability, better transformer abnormal diagnosis results, and is more robust.

4. Conclusions

In this study, an adaptive abnormal oil temperature diagnosis (AAOTD) method based on the concept drift was proposed. This method can significantly reduce the influence of concept drift from performance degradation of the transformer’s components. The contributions of this paper are as follows. First, a new concept drift detection model was developed using three-way decision-making theories, which can infer the influence level of concept drift based on changes of model accuracy. Then, ensemble learning algorithm was employed to adaptively adjust the base learners and their weights to reduce the influence of concept drift. The efficiency of AAOTD methods was validated via the experiments. In the experiments, the average oil temperature prediction accuracy of AAOTD in four regions reached 95.03% (Xinyu: 94.27%, Gulu: 93.58%, Xuzhou: 95.82%, Yanghang: 94.46%), which is 1.52% higher than the AWE algorithm and 20–40% higher than other traditional machine learning algorithms. Furthermore, since this method only utilizes the existing power grid data resources to realize abnormal oil temperature diagnosis without extra monitoring equipment, it is an economic and efficient solution for practical scenarios in the electric power industry.
However, due to the ensemble learning steps, the computational complexity of the algorithm proposed in this paper is higher than the traditional methods. Therefore, in the future work of this research, we will focus on reducing the computational complexity of the algorithm.

Author Contributions

Conceptualization, Y.Z. and Z.Z.; methodology, Y.Z., Z.Z., J.X. and R.H.; software, Z.Z., R.H. and J.X.; validation, Y.Z. and J.X.; formal analysis, Y.Z. and Z.Z.; investigation, Y.Z., J.X. and R.H.; resources, J.X. and R.H.; data curation, Z.Z. and J.X.; writing—original draft preparation, Y.Z. and Z.Z.; writing—review and editing, Y.Z., J.X. and R.H.; visualization, Z.Z. and Y.Z.; supervision, J.X. and R.H.; project administration, J.X. and R.H.; funding acquisition, J.X. and R.H. All authors have read and agreed to the published version of the manuscript.

Funding

This research was funded by the National Natural Science Foundation of China, grant number 61763031, and Jiangxi Provincial Natural Science Foundation, grant number 20202BAB202018.

Institutional Review Board Statement

Not applicable.

Informed Consent Statement

Not applicable.

Data Availability Statement

Not applicable.

Acknowledgments

We are grateful for the National Natural Science Foundation of China and the Jiangxi Provincial Natural Science Foundation.

Conflicts of Interest

The authors declare no conflict of interest.

References

  1. Wang, D.; Tian, J.; Mao, C.X.; Lu, J.M.; Duan, Y.P.; Qiu, J.; Cai, H.H. A 10-kV/400-V 500-kVA Electronic Power Transformer. IEEE Trans. Ind. Electron. 2016, 63, 6653–6663. [Google Scholar] [CrossRef]
  2. Liu, B.Y.; Lei, J.Y.; Geng, Y.B. Research on Fault Diagnosis of Oil-immersed Transformer. Control Instrum. Chem. Ind. 2018, 45, 69–72. [Google Scholar]
  3. Galdi, V.; Pierro, V.; Pinto, I.M. Evaluation of stochastic-resonance-based detectors of weak harmonic signals in additive white Gaussian noise. Phys. Rev. E Stat. Phys. Plasmas Fluids Relat. Interdiscip. Top. 1998, 57, 6470–6479. [Google Scholar] [CrossRef] [Green Version]
  4. He, Q.; Si, J.; Ryder, S.A.; Tylavsky, D.J. Prediction of top-oil temperature for transformers using neural networks. IEEE Trans. Power Deliv. 2000, 16, 825–826. [Google Scholar] [CrossRef]
  5. Pradhan, M.K.; Ramu, T.S. Online monitoring of temperature in power transformers using optimal linear combination of ANNs. In Proceedings of the Conference Record of the 2004 IEEE International Symposium on Electrical Insulation, Indianapolis, IN, USA, 19–22 September 2004; IEEE: New York, NY, USA; pp. 70–73. [Google Scholar]
  6. Du, W.X.; Zhao, X.P.; Lv, F.; Du, H.L. The Transformer Fault Diagnosis Based on AdaBoost Least Square Support Vector Machine. In Proceedings of the 2016 Chinese Intelligent Systems Conference, Xiamen, China, 22 September 2016; pp. 553–561. [Google Scholar]
  7. Widmer, G.; Kubat, M. Learning in the presence of concept drift and hidden contexts. Mach. Learn. 1996, 23, 69–101. [Google Scholar] [CrossRef] [Green Version]
  8. Gama, J.; Aguilar-Ruiz, J.S.; Klinkenberg, R. Knowledge discovery from data streams. Intell. Data Anal. 2008, 12, 251–252. [Google Scholar] [CrossRef] [Green Version]
  9. Schlimmer, J.C.; Granger, R.H. Incremental Learning from Noisy Data. Mach. Learn. 1986, 1, 317–354. [Google Scholar] [CrossRef]
  10. Ditzler, G.; Polikar, R. Incremental Learning of Concept Drift from Streaming Imbalanced Data. IEEE Trans. Knowl. Data Eng. 2003, 25, 2283–2301. [Google Scholar] [CrossRef]
  11. Minku, L.L.; Xin, Y. DDD: A New Ensemble Approach for Dealing with Concept Drift. IEEE Trans. Knowl. Data Eng. 2012, 24, 619–633. [Google Scholar] [CrossRef] [Green Version]
  12. Brzezinski, D.; Stefanowski, J. Reacting to Different Types of Concept Drift: The Accuracy Updated Ensemble Algorithm. IEEE Trans. Neural Netw. Learn. Syst. 2013, 25, 81–94. [Google Scholar] [CrossRef] [Green Version]
  13. Zhu, Q.; Hu, X.; Zhang, Y.; Li, P.P.; Wu, X. A Double-Window-Based Classification Algorithm for Concept Drifting Data Streams. In Proceedings of the 2010 IEEE International Conference on Granular Computing, San Jose, CA, USA, 14–16 August 2010. [Google Scholar]
  14. Núñez, M.; Fidalgo, R.; Morales, R. Learning in Environments with Unknown Dynamics: Towards more Robust Concept Learners. J. Mach. Learn. Res. 2007, 8, 2595–2628. [Google Scholar]
  15. Du, L.; Song, Q.B.; Jia, X.L. Detecting concept drift: An information entropy based method using an adaptive sliding window. Intell. Data Anal. 2014, 18, 337–364. [Google Scholar] [CrossRef]
  16. Pesaranghader, A.; Viktor, H.L. Fast Hoeffding Drift Detection Method for Evolving Data Streams; Springer: Cham, Switzerland, 2016; pp. 96–111. [Google Scholar]
  17. Symone, G.S.; Rui, A. An on-line weighted ensemble of regressor models to handle concept drift. Eng. Appl. Artif. Intell. 2015, 37, 392–406. [Google Scholar]
  18. Wang, H.; Fan, W.; Yu, P.S.; Han, J. Mining concept-drifting data streams using ensemble classifiers. In Proceedings of the Ninth ACM SIGKDD International Conference on Knowledge Discovery and Data Mining (KDD-2003), Washington, DC, USA, 24–27 August 2003. [Google Scholar]
  19. Zhao, P.; Hoi, S.; Wang, J.; Li, B. Online Transfer Learning. Artif. Intell. 2014, 216, 76–102. [Google Scholar] [CrossRef]
  20. Ye, Y.M.; Zhang, H.J.; Liu, F.; Xu, X.P.; Lau, R. Dynamic Clustering Forest: An ensemble framework to efficiently classify textual data stream with concept drift. Inf. Sci. 2016, 357, 125–143. [Google Scholar]
  21. Zhao, Q.L.; Jiang, Y.H.; Lu, Y.T. Ensemble Model and Algorithm with Recalling and Forgetting Mechanisms for Data Stream Mining. J. Softw. 2015, 26, 2567–2580. [Google Scholar]
  22. Gordon, J.R.; Niall, M.A.; Dimitris, K.T.; David, J.H. Exponentially weighted moving average charts for detecting concept drift. Pattern Recognit. Lett. 2012, 33, 191–198. [Google Scholar]
  23. Gonçalves, P.M.; De, C.; Barros, R.; Vieira, D. A comparative study on concept drift detectors. Expert Syst. Appl. 2014, 41, 8144–8156. [Google Scholar] [CrossRef]
  24. Ditzler, G.; Roveri, M.; Alippi, C.; Polikar, R. Learning in Nonstationary Environments: A Survey. IEEE Comput. Intell. Mag. 2015, 10, 12–25. [Google Scholar] [CrossRef]
  25. Breiman, L.; Friedman, J.; Olshen, R.; Stone, C.; Olsen, R.; Breimann, L.; Fried, J.H.; Breimain, L. Classification and Regression Trees. Encycl. Ecol. 1984, 40, 582–588. [Google Scholar]
  26. Tin, K.H. Random decision forests. In Proceedings of the 3rd International Conference on Document Analysis and Recognition, Montreal, QC, Canada, 14–16 August 1995. [Google Scholar]
  27. Cortes, C.; Vapnik, V. Support-vector networks. Mach. Learn. 1995, 20, 273–297. [Google Scholar] [CrossRef]
Figure 1. The flowchart of 3-way decision-making rule in Algorithm 2. According to the difference between the predicted oil temperature and actual oil temperature, the 3 transformer states FINE, ERROR, and WARNING were obtained.
Applsci 11 06322 g001
Figure 2. The flowchart of concept drift adaptation. According to the performance of the prediction algorithm on the test data, we can determine whether the algorithm needs to be adjusted.
Applsci 11 06322 g002
Figure 3. Chart of oil temperature prediction accuracy rate from various algorithms. The 4 subgraphs (ad) show the results of 6 algorithms for oil temperature prediction of transformers in 4 different regions (Xinyu, Gulu, Xuzhou, and Yanghang). The x-coordinate represents the serial number of the prediction set, and the y-coordinate represents the accuracy of the predicted oil temperature.
Applsci 11 06322 g003
Figure 4. Tendency of abnormal oil temperature warnings from various methods. The 4 subgraphs (ad) show the results of six algorithms for oil temperature prediction of the transformers in 4 different regions (Xinyu, Gulu, Xuzhou, and Yanghang). The x-coordinate represents the serial number of the prediction set, and the y-coordinate represents the early warning rate of the transformer.
Applsci 11 06322 g004
Table 1. Description of the transformer’s parameters.
LabelDescription
Transformer220 KV AC oil-immersed main power transformers with 3 windings; rated power: 120 MVA
OCCUR_TIMETimestamp ID of real-time working conditional record at specified timepoint
YG_YC_G/Z/D3 measured values of active power from power load monitoring equipment at the high-voltage side, medium-voltage side, and low-voltage side respectively
WG_YC_G/Z/D3 measured values of reactive power from power load monitoring equipment at the high-voltage side, medium-voltage side, and low-voltage side, respectively
COS_G/Z/D3 measured values of reactive power from power monitoring equipment at the high-voltage side, medium-voltage side, and low-voltage side, respectively
I_YC_G/Z/DRMS value of the AC current from power load monitoring equipment at the high-voltage side, medium-voltage side, and low-voltage side, respectively
RZWDA/B/C_YC3 values of temperature from the monitoring sensors at windings of the A phase, B phase, and C phase, respectively
YWA/B/C_YC3 values of temperature from the monitoring sensors at top-level oil of the A phase, B phase, and C phase, respectively
Table 2. Description of weather data.
LabelDescription
LocationSpecified districts that transformers located, China
OCCUR_TIMETimestamp ID of weather records at specified timepoint
TEMPERATUREValue of temperature at specified location
HIGH_TEMPERATURHighest value of temperature in whole-day records at specified location
LOW_TEMPERATURETEMLowest value of temperature in whole day records at specified location
RAINValue of rainfall capacity at specified date and specified location
WIND_DIRECTIONValue of wind direction at specified hour and specified location
WIND_VELOCITYValue of wind velocity at specified hour and specified location
PRESSUREValue of atmospheric pressure at specified hour and specified location
HUMIDITYValue of relative humidity at specified hour and specified location
Table 3. The results of the 6 algorithms on the transformer in the Xinyu area: The initial accuracy, the change of accuracy in the 3 conceptual drifts (a positive number represents an increase in accuracy, a negative number represents a decrease in accuracy), and the final accuracy.
AlgorithmInitial AccuracyAccuracy Rate after the Concept DriftFinal Accuracy
First TimeSecond TimeThird Time
BAOTD0.9954−0.2863−0.1963−0.82660.3376
CART0.9743−0.5079−0.1409−0.11070.0027
RF0.9845−0.2827−0.2008−0.83970.3439
SVM0.9896−0.3228−0.2498−0.76270.1895
AWE0.9898−0.0108+0.0235+0.12170.8515
AAOTD0.9942+0.0012+0.0598+0.15380.9555
Publisher’s Note: MDPI stays neutral with regard to jurisdictional claims in published maps and institutional affiliations.

