Article

Study on Solar Radiation and the Extreme Thermal Effect on Concrete Box Girder Bridges

School of Civil Engineering, Central South University, Changsha 410075, China
*
Authors to whom correspondence should be addressed.
Appl. Sci. 2021, 11(14), 6332; https://doi.org/10.3390/app11146332
Submission received: 26 April 2021 / Revised: 10 June 2021 / Accepted: 2 July 2021 / Published: 8 July 2021
(This article belongs to the Section Civil Engineering)

Abstract

:
Thermal effect is an essential factor in the durability and safety of concrete bridges. Therefore, this paper mainly studied the concrete bridge box girder temperature distribution and thermal effect under solar radiation and the thermal load. With a concrete rigid frame bridge as the engineering background, the temperature distribution of the box girder on a clear summer day was observed. Then, according to the solar physics and heat transfer theory, the different surfaces of the box girder cross-section are classified based on the heat transfer conditions, and the variation of solar radiation on different surfaces is investigated. The temperature field of the box girder is simulated by ANSYS. To obtain the extreme thermal condition, the meteorological data of the bridge site from 1990 to 2020 are collected. The data are fitted by generalized extreme value distribution to obtain the extreme temperature and average wind factors in the bridge design lifetime. Combined with the solar radiation, temperature, and wind factors, the extreme thermal condition of the concrete box girder is obtained. Lastly, the thermal effect of the box girder under the extreme condition is analyzed, and the thermal stress is compared with the allowable stress in the design code. The results show that the girder temperature difference is closely related to the solar radiation intensity and heat transfer conditions, and the solar radiation intensity is the more critical factor. The tensile stress caused by the extreme thermal load is more significant than the design strength value in the girder cross-section. The results also provide a method to obtain the extreme thermal condition and evaluate the impact of the thermal effect on concrete box girder bridges.

1. Introduction

Bridges in the natural environment are affected by solar radiation, air temperature variation, wind, and other factors. The temperature distribution in the bridge girder changes all the time. On the surfaces of an object, heat is transferred from the surrounding medium mainly in three ways as heat convection, heat conduction, and radiation. This heat transfer of the concrete bridge in the natural environment is related to solar radiation, air temperature, wind speed, material properties, and other factors [1,2]. The amount of solar radiation on the surfaces of the box girder mainly varies with seasons, time, weather, air quality, and other factors; it is also closely related to the geographical location, topography, and orientation of different surfaces of the girder [3]. Due to the low thermal conductivity and higher specific heat of concrete material, there will be an apparent thermal effect produced under solar radiation, which will affect the durability and even safety of concrete structures [4]. Therefore, many researchers studied solar radiation and the thermal effect, and field observation is a common and effective method. Sheng studied the time-varying sunlit–shaded areas of small radius curved concrete box girder bridges and presented a ray-tracing algorithm to analyze the thermal stress distribution of small radius curved bridges [5]. Dai studied the temperature distribution of a low-speed maglev concrete box girder and the solar effect of a high-speed rail bridge pier; he proposed a tail data-fitting method of temperature gradient based on the GPD distribution and obtained the bridge girder and pier’s temperature gradient fitting model with a 100-year return period [6,7]. Zhang worked on temperature actions in composite bridges by measuring for 15 months, proposed an accurate shadow recognition method, and developed a simulation model to study the long-term thermal actions of composite bridges [8]. Gottsäter observed long-term weather data for the portal frame bridge simulations and gave suggested values for design based on the statistical analyses; he pointed out that there is a gradual temperature change between different parts of the bridge, which could influence the thermal stress [9]. Tomé investigated a concrete cable-stayed bridge cross-section temperature field based on a 17-month continuous experiment and studied the structural response under thermal loads [10]. Westgate performed thermal-induced behavior of a suspension bridge under solar action and investigated the relationship between thermal expansion and contraction cycles of cables and the temperature distribution [11]. The temperature field of the girder cross-section is usually simulated by the two-dimensional finite element models. Many studies focus on the characterization of the cross-section temperature using a comprehensive heat transfer method and transient thermal analyses [12,13,14,15]. As a result of the regional difference in solar radiation, temperature, wind speed, and other factors, scholars also focus on the processes and coefficients of bridge heat transfer to improve the accuracy of the simulation. Tasysi investigated thermal conductivity coefficients, specific heat, solar absorptivity, and their combined effect on bridge temperature [16]. Lee studied the convective heat transfer coefficient between a concrete surface and ambient air [17]. Dilger proposed a formula of diurnal variation of the solar radiation to study the temperature stresses in composite box girder bridges [18]. Guo measured temperature data through experiments and worked on concrete thermal conductivity and heat transfer [19]. Lacis presented a rapid computing method for absorbing solar energy on the earth’s surface [20]. Wang analyzed the joint actions of wind and temperature on bridges [21]. Liu studied the relationship between the severe weather and the atmospheric transparency coefficient, the thickness of the deck covering layer, and the absorptivity of the concrete surface [22]. As climate factors significantly impacted the structures in the natural environment, the frequency and intensity of extreme climate events need to be considered in the study of meteorological factors on bridges. Xiao used the probability and statistics method to analyze the historical meteorological parameters and solar temperature field of concrete under different return periods [23]. Lucas and Ding studied the thermal effect under extreme meteorological parameters as thermal boundary conditions [24,25].
In this paper, a concrete rigid frame bridge in southwest China was taken as the engineering background. Temperature data of the box girder cross-section were observed on a clear summer day, and the temperature field distribution was obtained. Then, a numerical simulation was presented by transient thermal analysis in ANSYS. Based on the measured temperature and calculated results, the temperature difference and impact parameters were analyzed. With historical weather data of the bridge site, the probability distribution of the meteorological parameters and the extreme value in a return period of 100 years was obtained by generalized extreme value (GEV) distribution. Finally, the temperature effect under solar effect and the extreme thermal condition were analyzed.

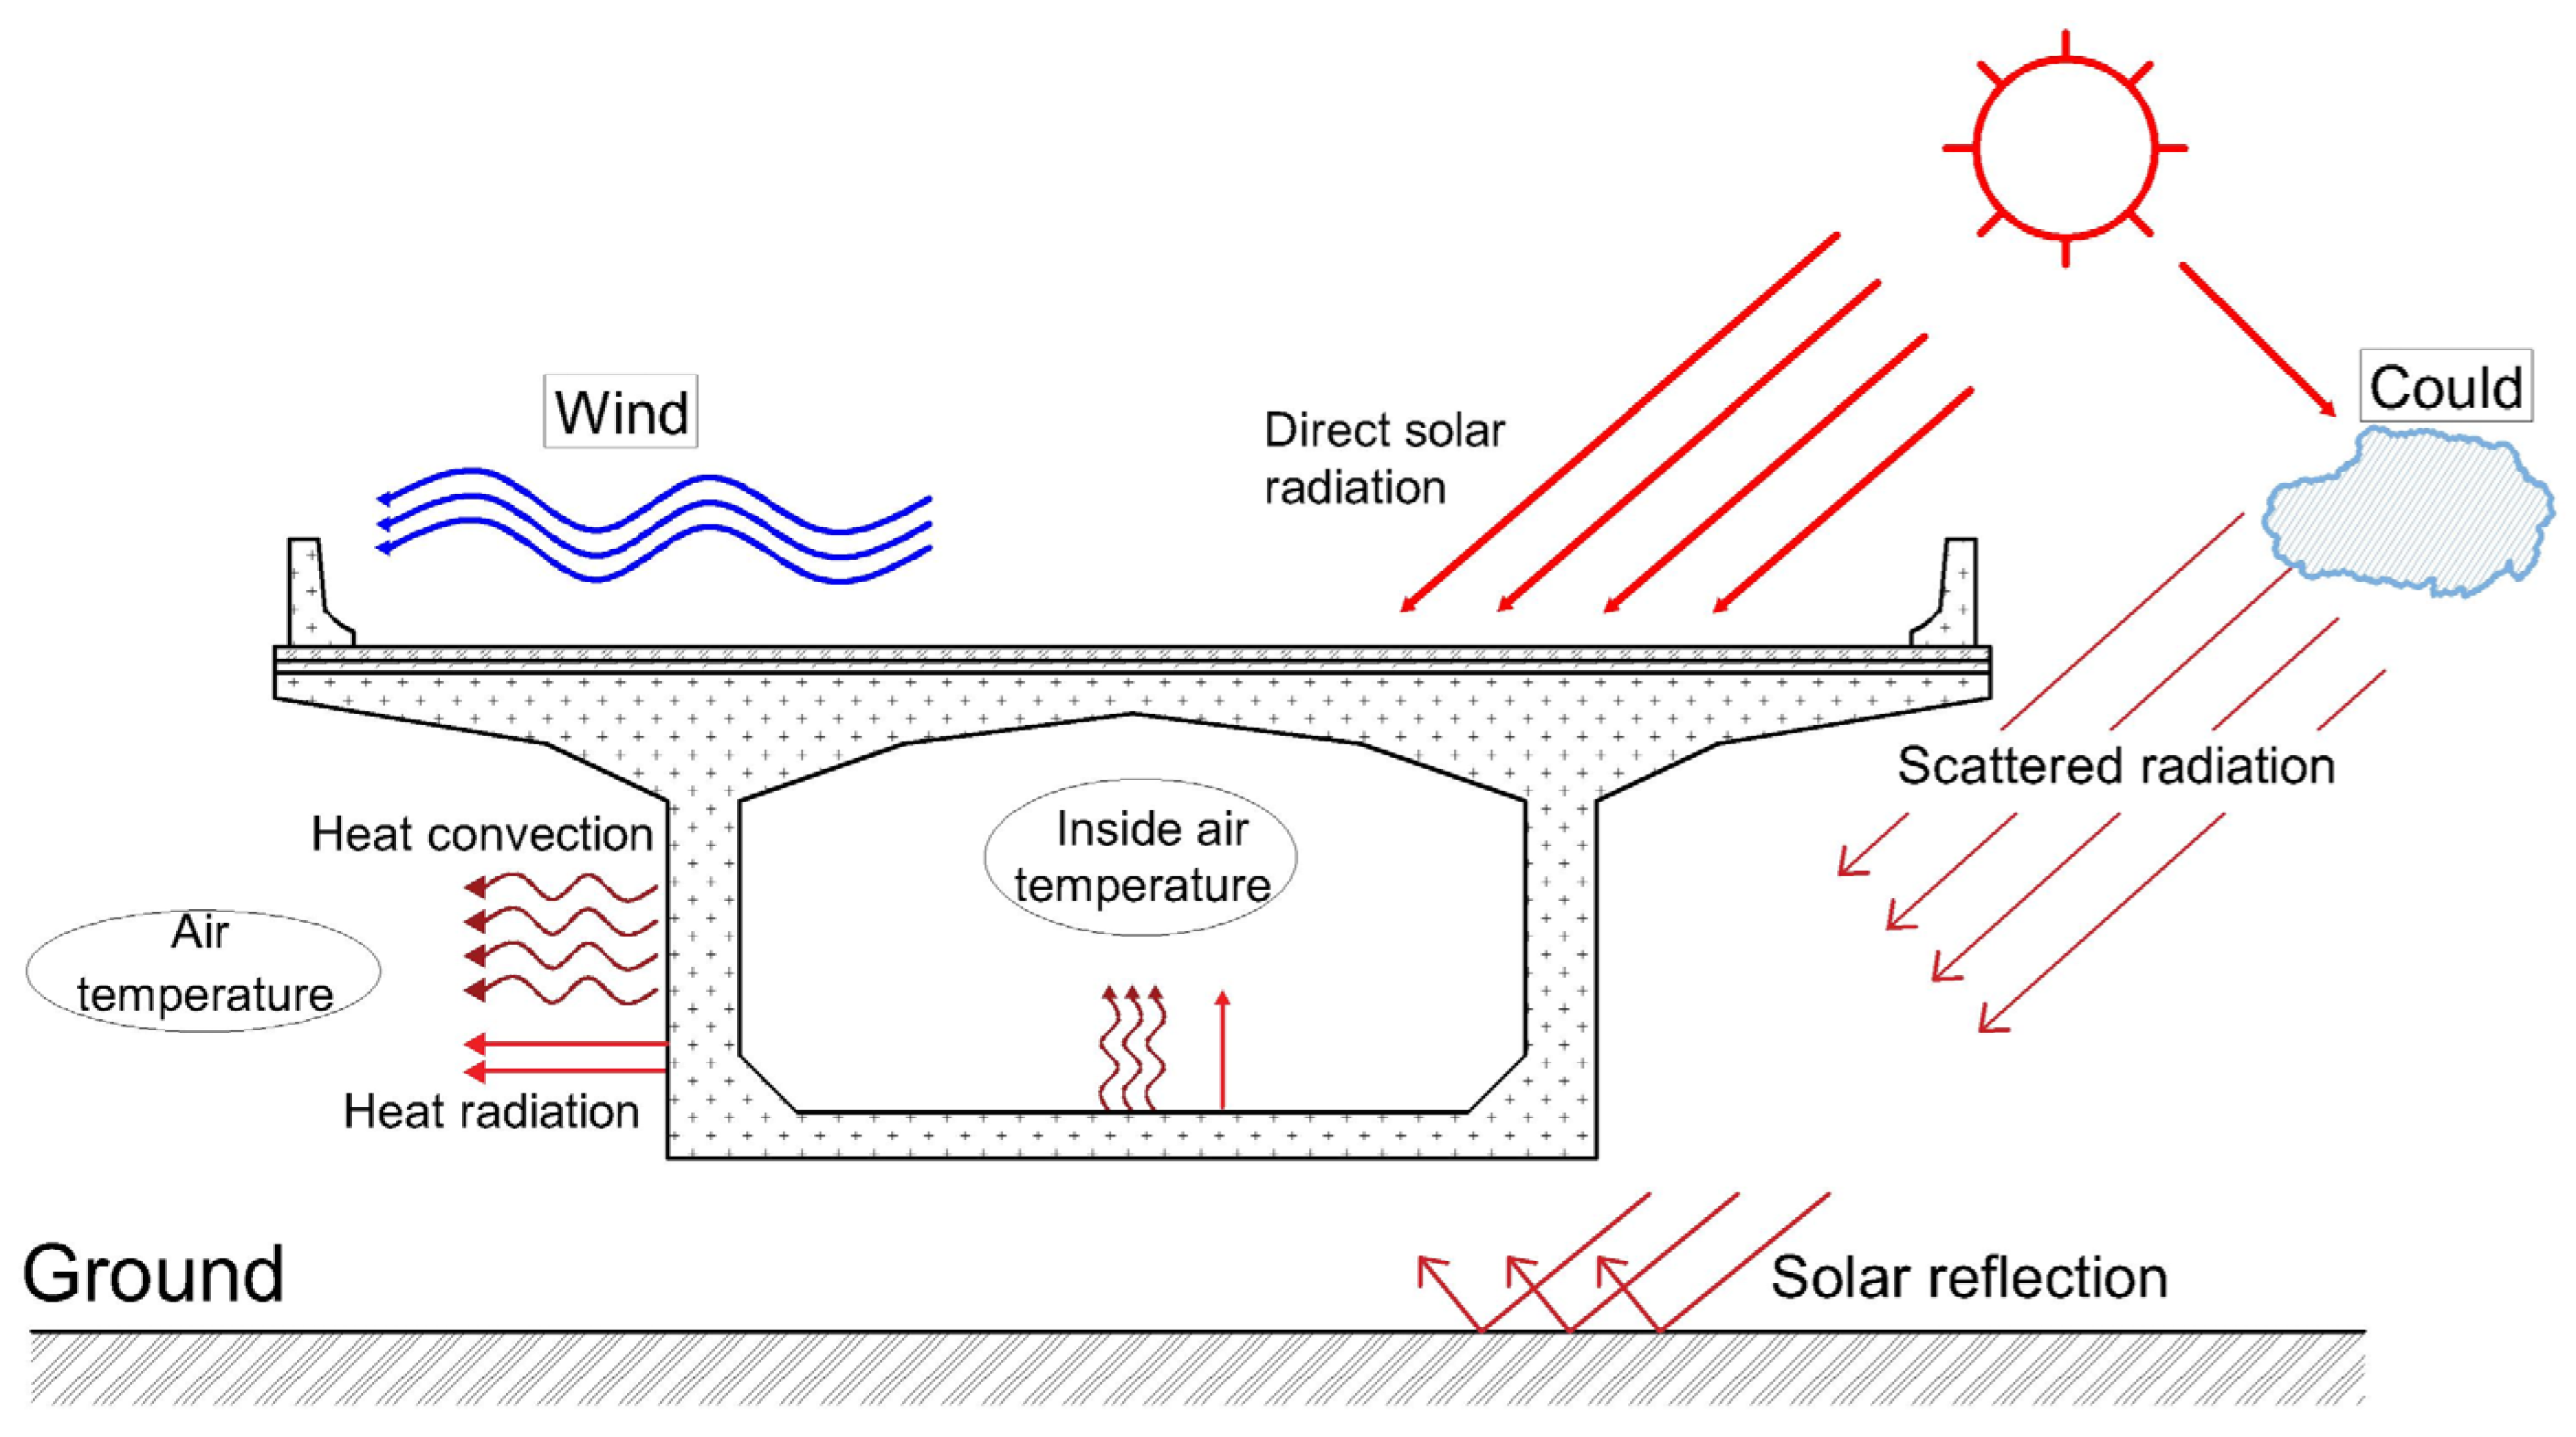
2. Calculation Method of Solar Radiation and Field Temperature Observing

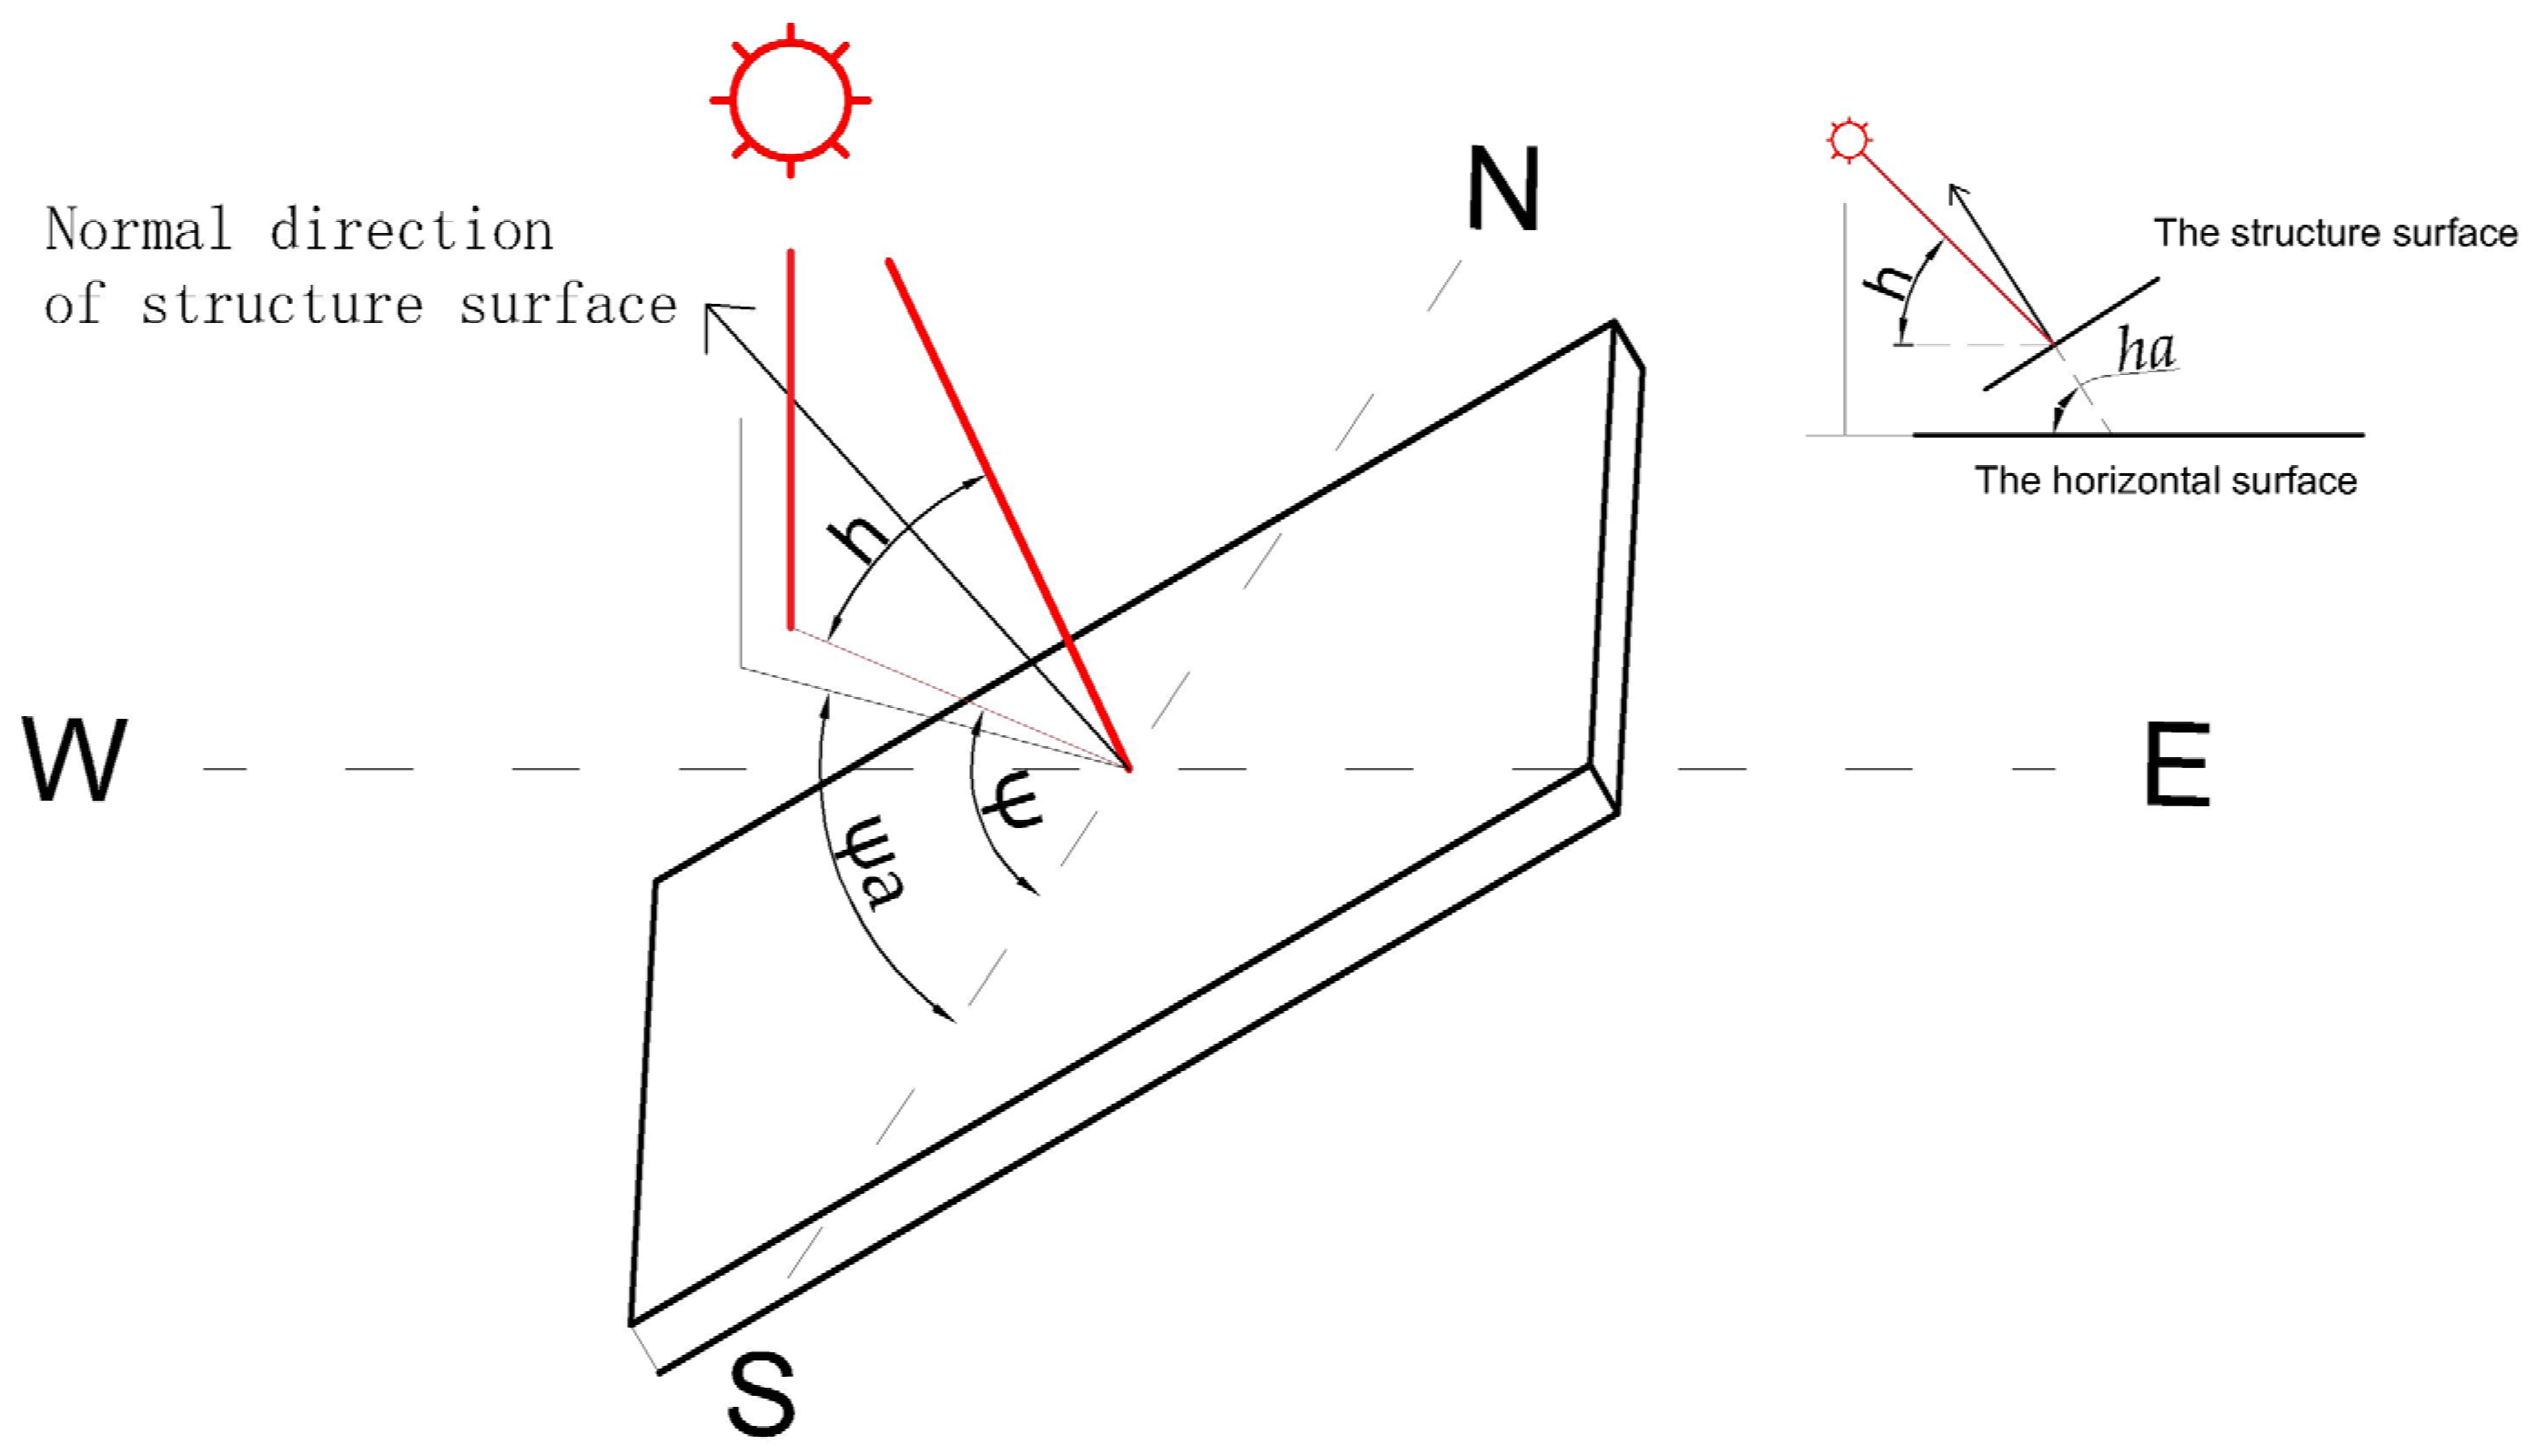
2.1. Determination of the Solar Radiation Parameters

On a clear day, the primary external heat source of the concrete box girder is solar radiation. Solar radiation consists of direct radiation, scattering radiation, and ground reflection. The intensity of solar radiation at the outer edge of the atmosphere is related to the solar constant, which changes slightly in a year, and it is calculated [26,27] as:
I 0 = 1368 × [ 1 + 0.033 c o s ( 360 N 365 ) ]
where N is the number of days (starts from 1 January).
Therefore, it changes slightly in summer (from July to August), about 1.2 % .
When passing through the atmosphere, solar radiation will be scatted, and the direct solar radiation I D n reaching the earth’s surface is determined as Formula (2). The scattering radiation I s on the structure’s surface is calculated as Formula (3):
I D n = I 0 · P m
I s = ( 0.271 I 0 0.294 I D n ) · s i n   h × ( 1 + c o s   β ) / 2
where P is coefficient of atmospheric transmission, valued as 0.807 in this paper, m = csc h , h is the solar altitude angle, β is the angle between the normal direction of the structure’s outside surface and the ground.
Since the earth’s surface can reflect direct radiation and scattering radiation, the reflection I f will affect the web and the bottom slab of the girder, and it is calculated as:
I f = [ I D n s i n   h + ( 0.271 I 0 0.294 I D n ) · s i n   h ] × r e · ( 1 c o s   β ) / 2
where r e is the ground shortwave radiation rate, which is valued as 0.2.
The total solar radiation on the surface of the girder is expressed as:
I = I D n + I s + I f .
To study solar radiation, 16 July 2018 was selected, which was a clear day, and the number of days N is 197. According to solar physics, the solar angle θ N at the bridge site of the day is 114.72°, and the solar declination δ is 21.35°. The time difference t d between the local true solar time and the standard time t s (UTC/GMT + 08:00) was calculated as Formula (6), and the local true solar time t t is calculated as Formula (7):
t d = 0.165 s i n   2 θ N 0.025 s i n   2 θ N 0.126 s i n   2 θ N
t t = t s 120 ° γ 15 ° + t d .
The solar altitude h and solar azimuth ψ were calculated as:
s i n   h =   s i n   w   s i n   δ +   c o s   w   c o s   δ   c o s   α
s i n   ψ = c o s   δ s i n   α c o s   h
where w is latitude, γ is longitude, and α is solar hour angle, which is calculated as
α = ( 12 t t ) × 15 °
where t t is the local true solar time.

2.2. Determination of the Heat Transfer Parameters

According to the heat transfer theory, the thermal boundary of the box girder belongs to the second boundary condition, in which the heat flux is known, and the third boundary condition, in which the heat exchange coefficient and the external ambient temperature are known. In engineering studies, it is usually unified as the third boundary condition for convenience of analysis. In many bridges, it is assumed that the temperature field is invariant along the bridge’s longitude direction. Therefore, the temperature field distribution of the cross-section can be simplified as a 2D problem, and the thermal conductivity sub-equation is expressed as:
λ ( 2 T x 2 + 2 T y 2 ) = ρ · c · T τ
where λ is the thermal conductivity, T is the temperature, ρ is the density, c is the specific heat, and τ is time.
The heat exchange between the box girder and the outside environment consists of solar radiation, heat exchange with the atmosphere, and atmospheric longwave radiation. The heat exchange between the box girder and the inter-space mainly includes the heat exchange with the interior air and the longwave radiation. The heat exchange diagram of the box girder is shown in Figure 1.
According to the unified comprehensive heat transfer method, the outside thermal boundary condition is expressed as
q c = ( h c + h r ) ( t c t )
where q c is the feat flux from the air to the box girder, h c is the convective heat coefficient, which is calculated as Formula (13), h r is the heat radiation coefficient, which is calculated as Formula (14) [1,27], t c is the comprehensive air temperature, which is calculated as Formula (15), and t is the girder surface temperature.
h c = 3.9   v + 5.53 , ( v 5   m / s )
h r = ε r · C 0 · [ K 2 + K a 2 ] ( K + K a )
t c = ε · I ( h c + h r ) + t a
where v is the wind speed, ε r is the radiation coefficient of girder surface, C 0 is the Stefan–Boltzmann constant, K is the thermodynamic temperature of the girder surface, K a is the thermodynamic temperature of the air, ε is the solar radiation absorption coefficient, and t a is the measured air temperature.
The inside thermal boundary condition is expressed as
q c i = ( h c + h r ) ( t a i t )
where t a i is the inside air temperature. It changes slightly in a day, around 1–3 °C, and it could be valued as average daily temperature plus 1.5 °C if there are no measured data [28].

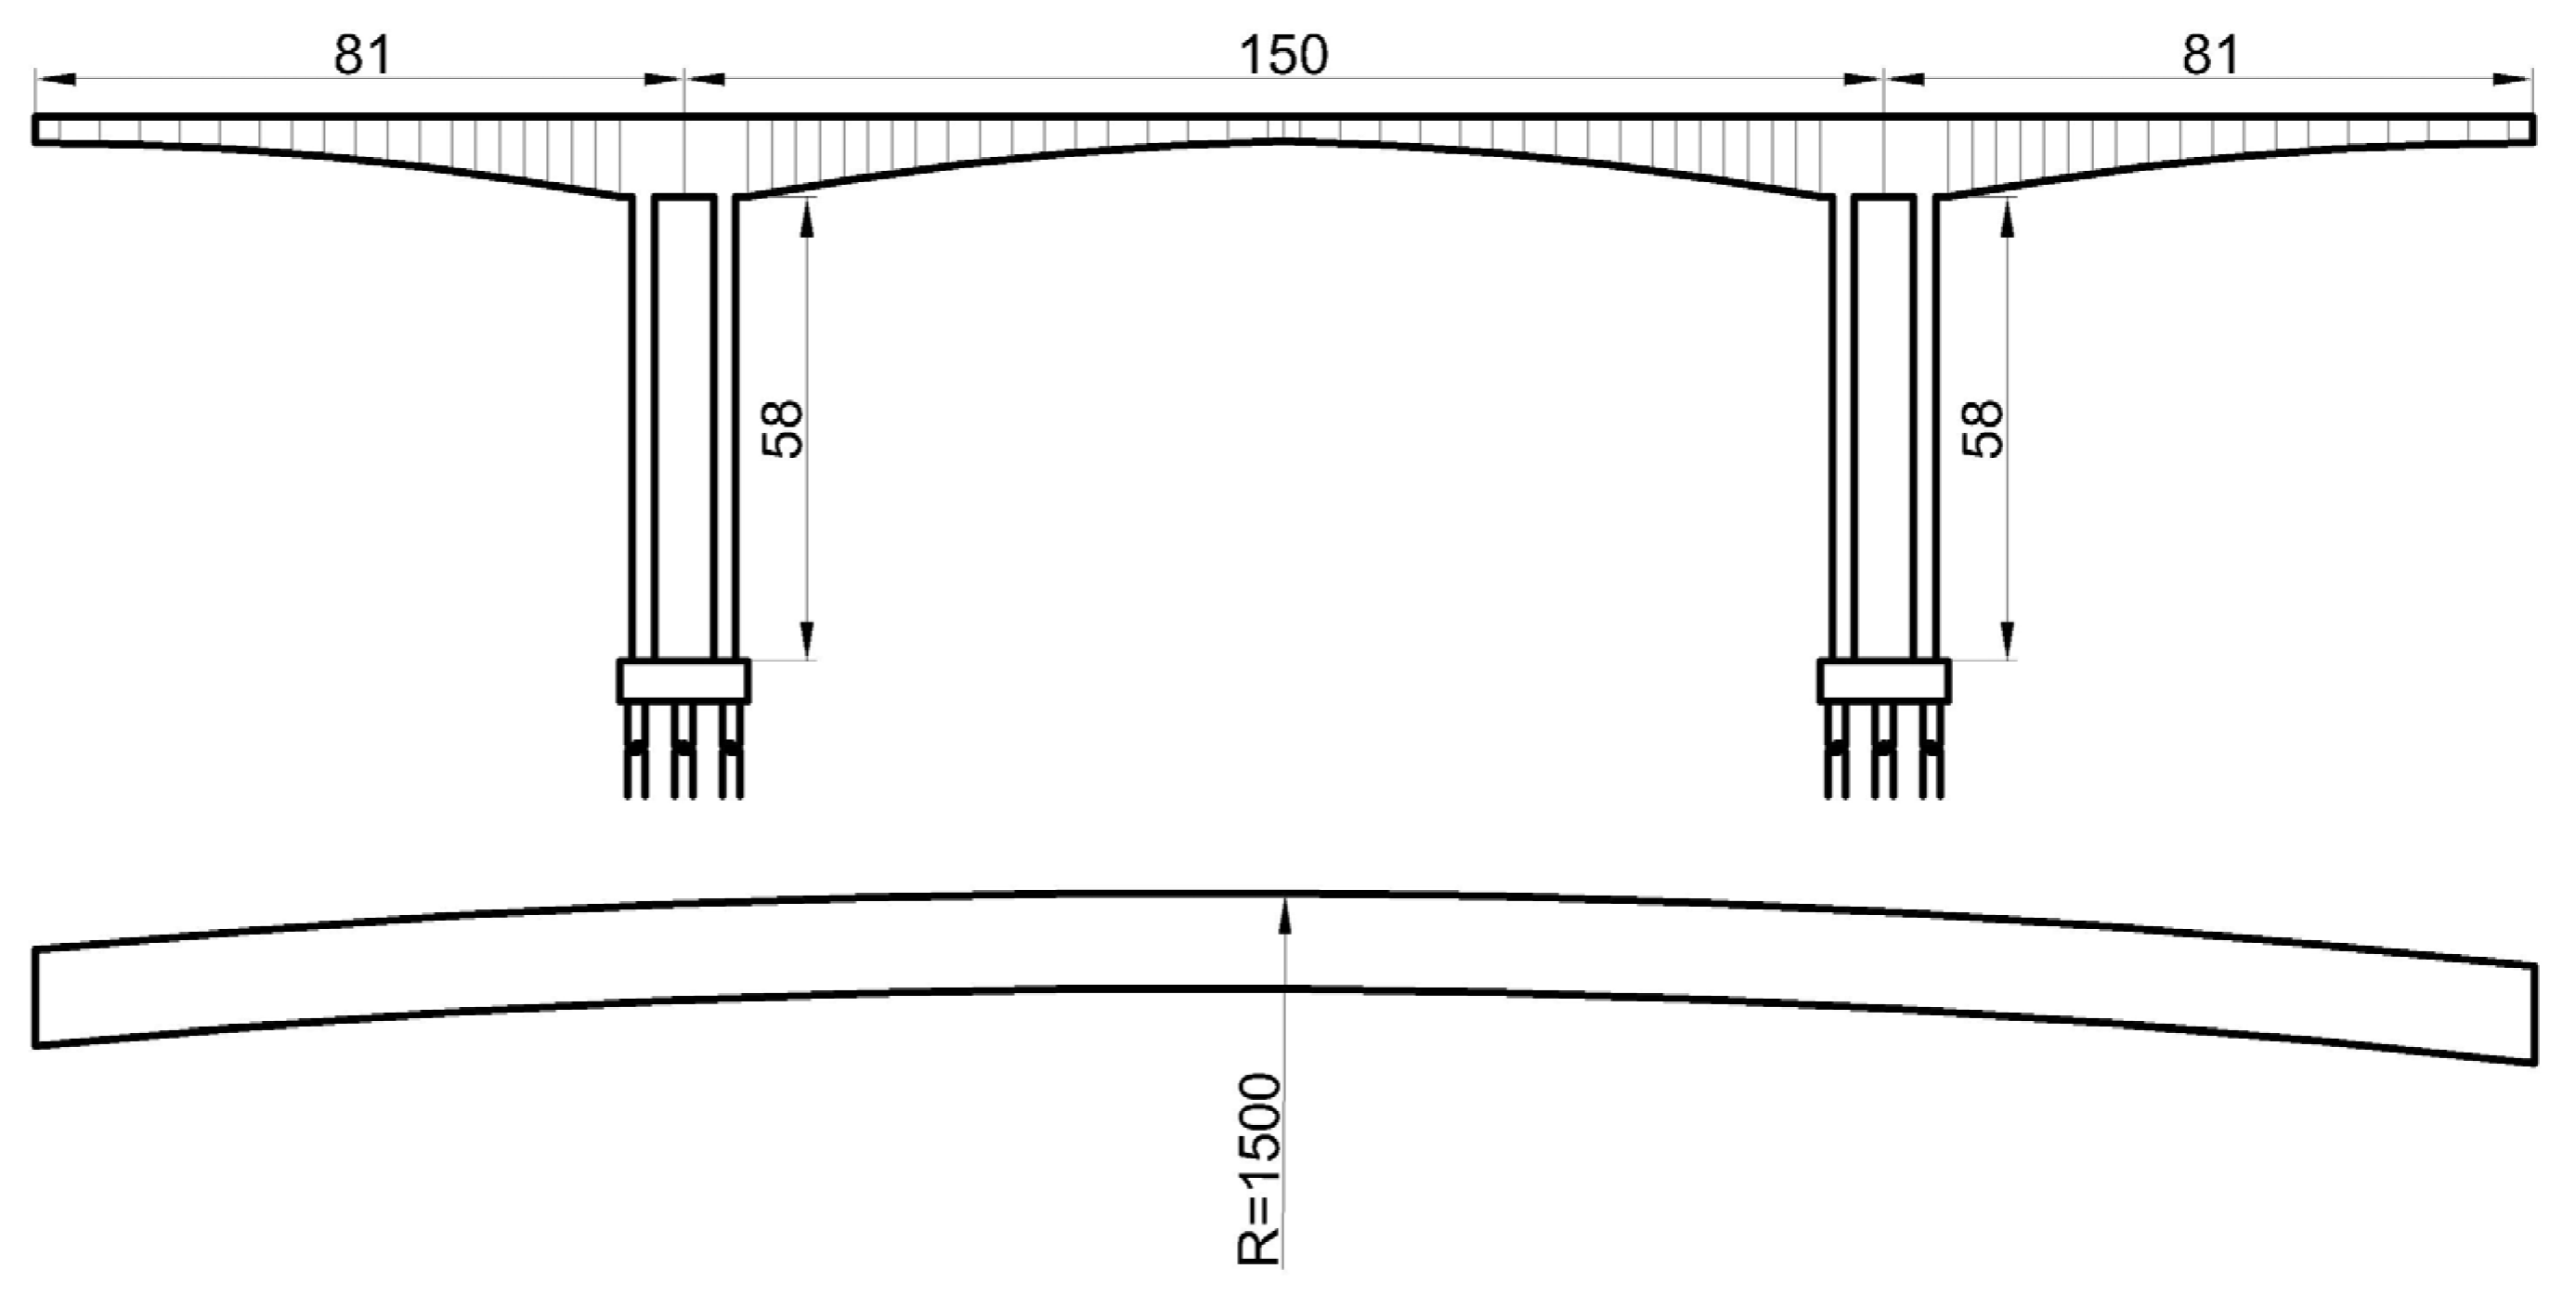
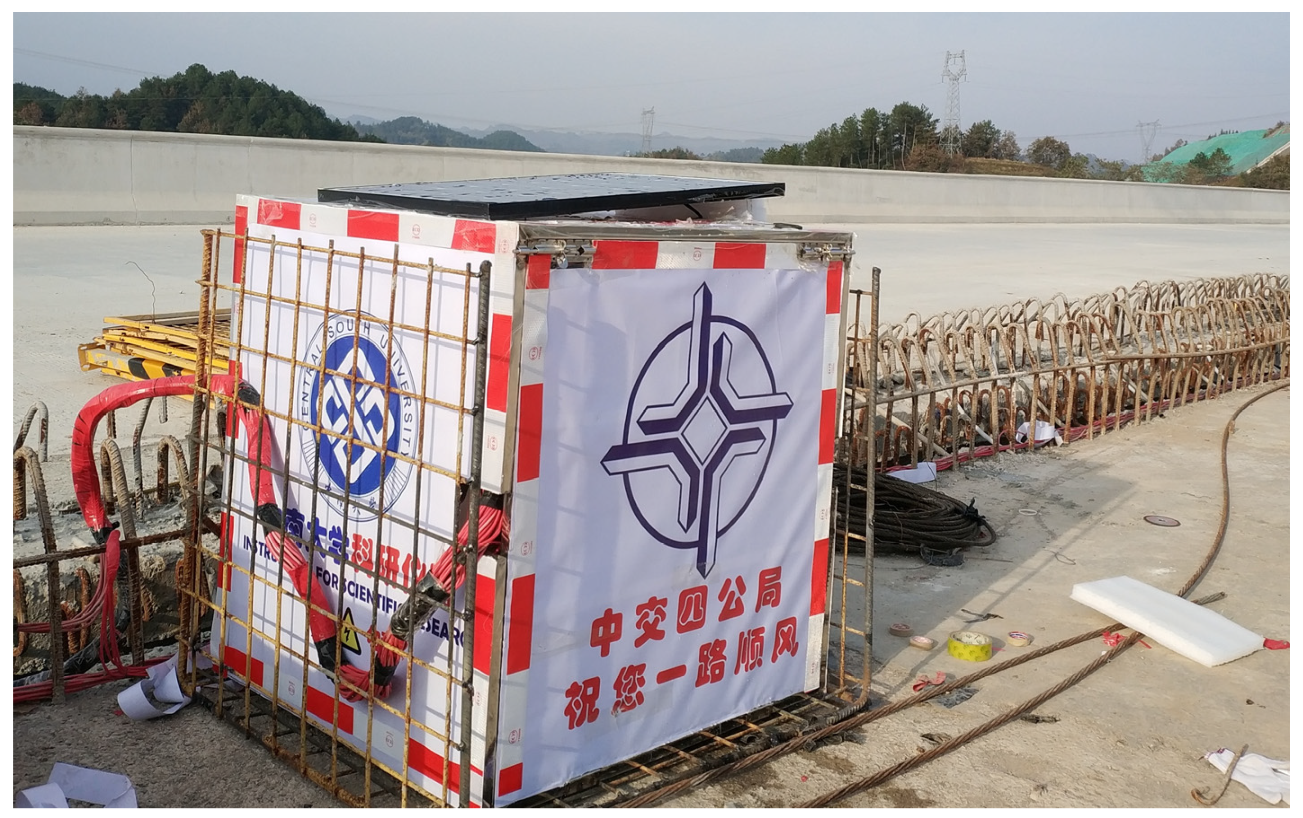
2.3. The Background Engineering and Field Temperature Observing

The background engineering is a concrete rigid frame bridge located at around 25.85° N and 107.32° E in southwest China, and its altitude is 710 m. According to the design information, the longitudinal direction of the bridge is 116.4° (from the south direction to the east is positive and to the west is negative), and the main bridge girder is a separation twin girder. The elevation of a single bridge is shown in Figure 2.
The monitoring section is selected at the mid-span section of the left main girder (the southern side) with an apparent solar effect. The section height is 340 cm, the width of the top slab is 1200 cm, the width of the bottom slab is 650 cm, and the deck pavement is 10 cm C50 concrete and 8 cm asphalt concrete. The cross-section and thermal measuring sensors layout are shown in Figure 3.
The temperature sensors were installed in the box girder while concrete pouring. The data acquisition equipment was set in the observation station, and the acquisition frequency is once every other hour with 4G wireless data transmission. The air temperature is measured by the sensor set in the observation station, and the sensors’ accuracy is 0.1 °C. The field observation station is shown in Figure 4.

3. The Variation and Impact of Solar Radiation

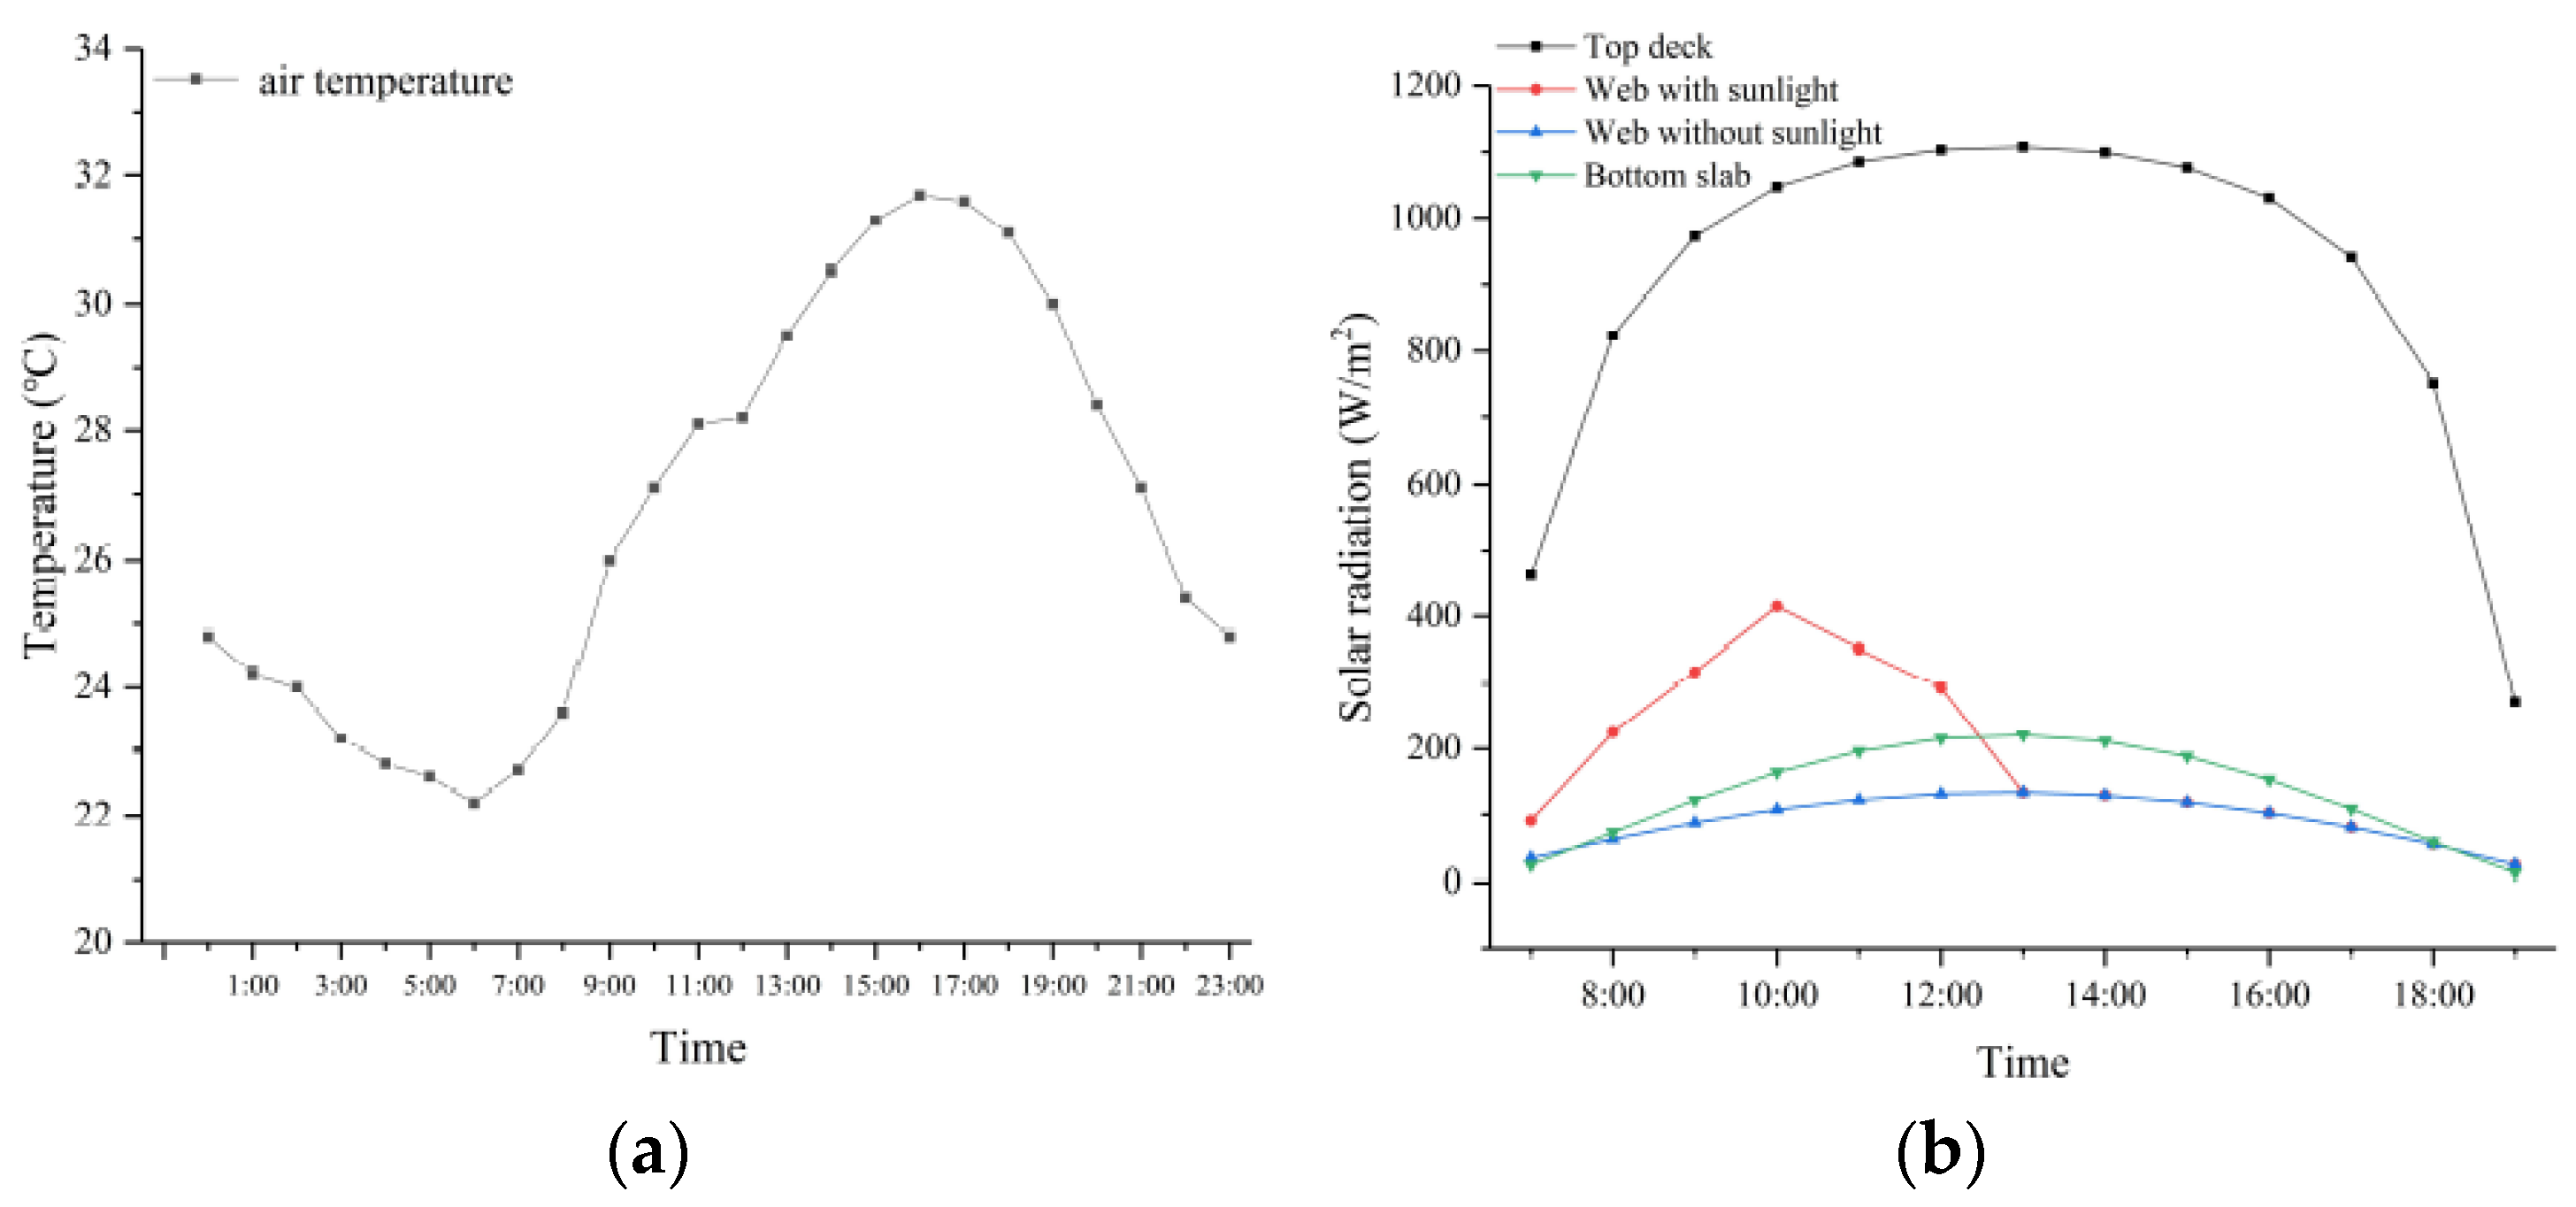
3.1. The Solar Radiation Variation

A clear day in summer (16 July) was selected as the research example, as the solar effect is obvious. On that day, the sunrise and sunset time are 06:07 and 19:44, respectively. Therefore, the sunshine period from 7:00 to 19:00 was chosen for the solar radiation variation study. Solar radiation changes with time, the total radiation is calculated as Formula (5), and it is also related to structural azimuth angle, solar altitude, and solar azimuth. According to the actual situation, the solar radiation boundary condition of the box girder surfaces can be considered as five types, shown in Table 1 and Figure 5.
The vertical solar radiation condition only exists at the sunny side of the web, and the area is changed with time as the wing plate shelters. The shadow area length at different moments is calculated as
l s = l w · t a n   h c o s ( ψ ψ a )
where h is the solar altitude, ψ is the solar azimuth, ψ a is the azimuth angle of the outer surface normal direction (from the south direction to the east is positive and to the west is negative), and l w is the length of the flange. The solar angles diagram is shown in Figure 6.
According to Formula (5), in addition to the solar radiation intensity, the solar radiation on the surface is also related to the solar incidence angle φ (the direction is the same as ψ and ψ a ). Based on the geometric theory, the solar incidence angles of the surfaces with different orientations are calculated as
c o s   φ = s i n   h s i n   h a + c o s ( ψ a ψ ) c o s   h c o s   h a
where h a is the angle between the normal direction of the sunshine surface and the horizontal surface.
Figure 7 illustrates the variation of the measured air temperature and the calculated solar radiation intensity in a day.
Figure 7 also shows that the solar radiation changes obviously with time and surface orientations. Solar radiation arrives at the maximum value and keeps stable from 10:00 to 16:00 on the top slab. On the sunlight side of the web, it reaches the maximum at 9:00 and begins to descend rapidly then. For the surfaces without direct sunlight, it changes slowly due to scattering radiation and reflection.

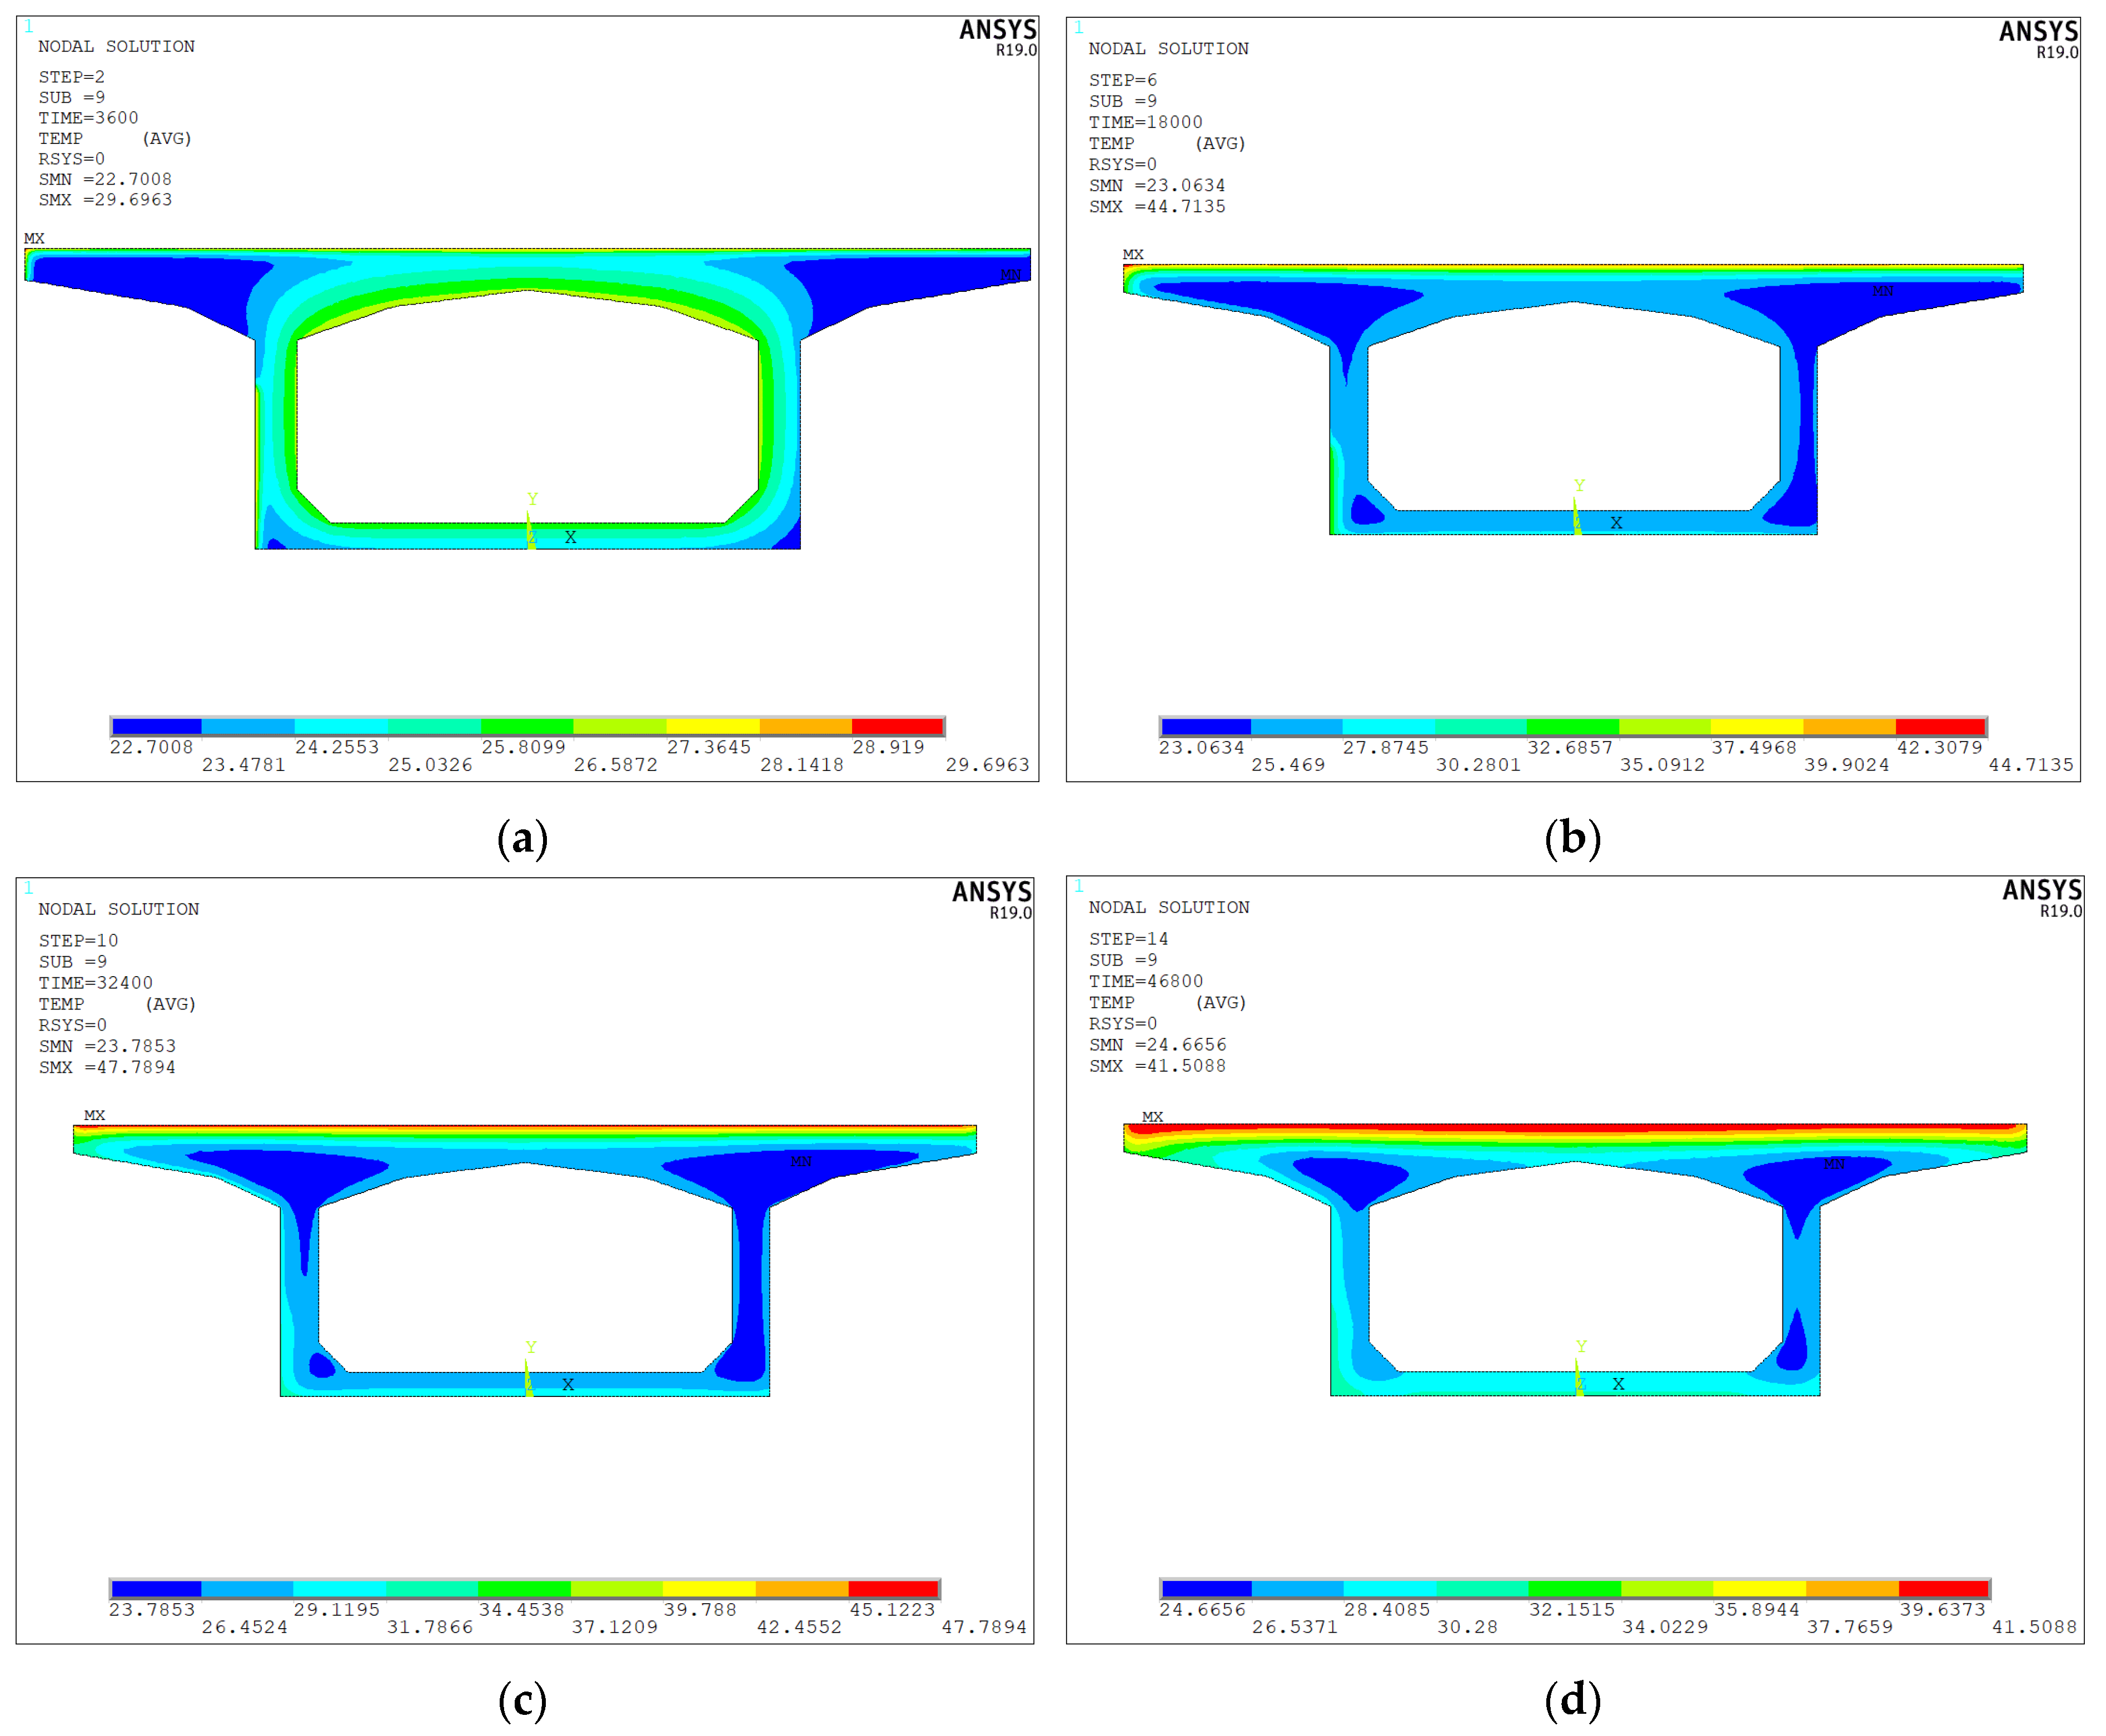
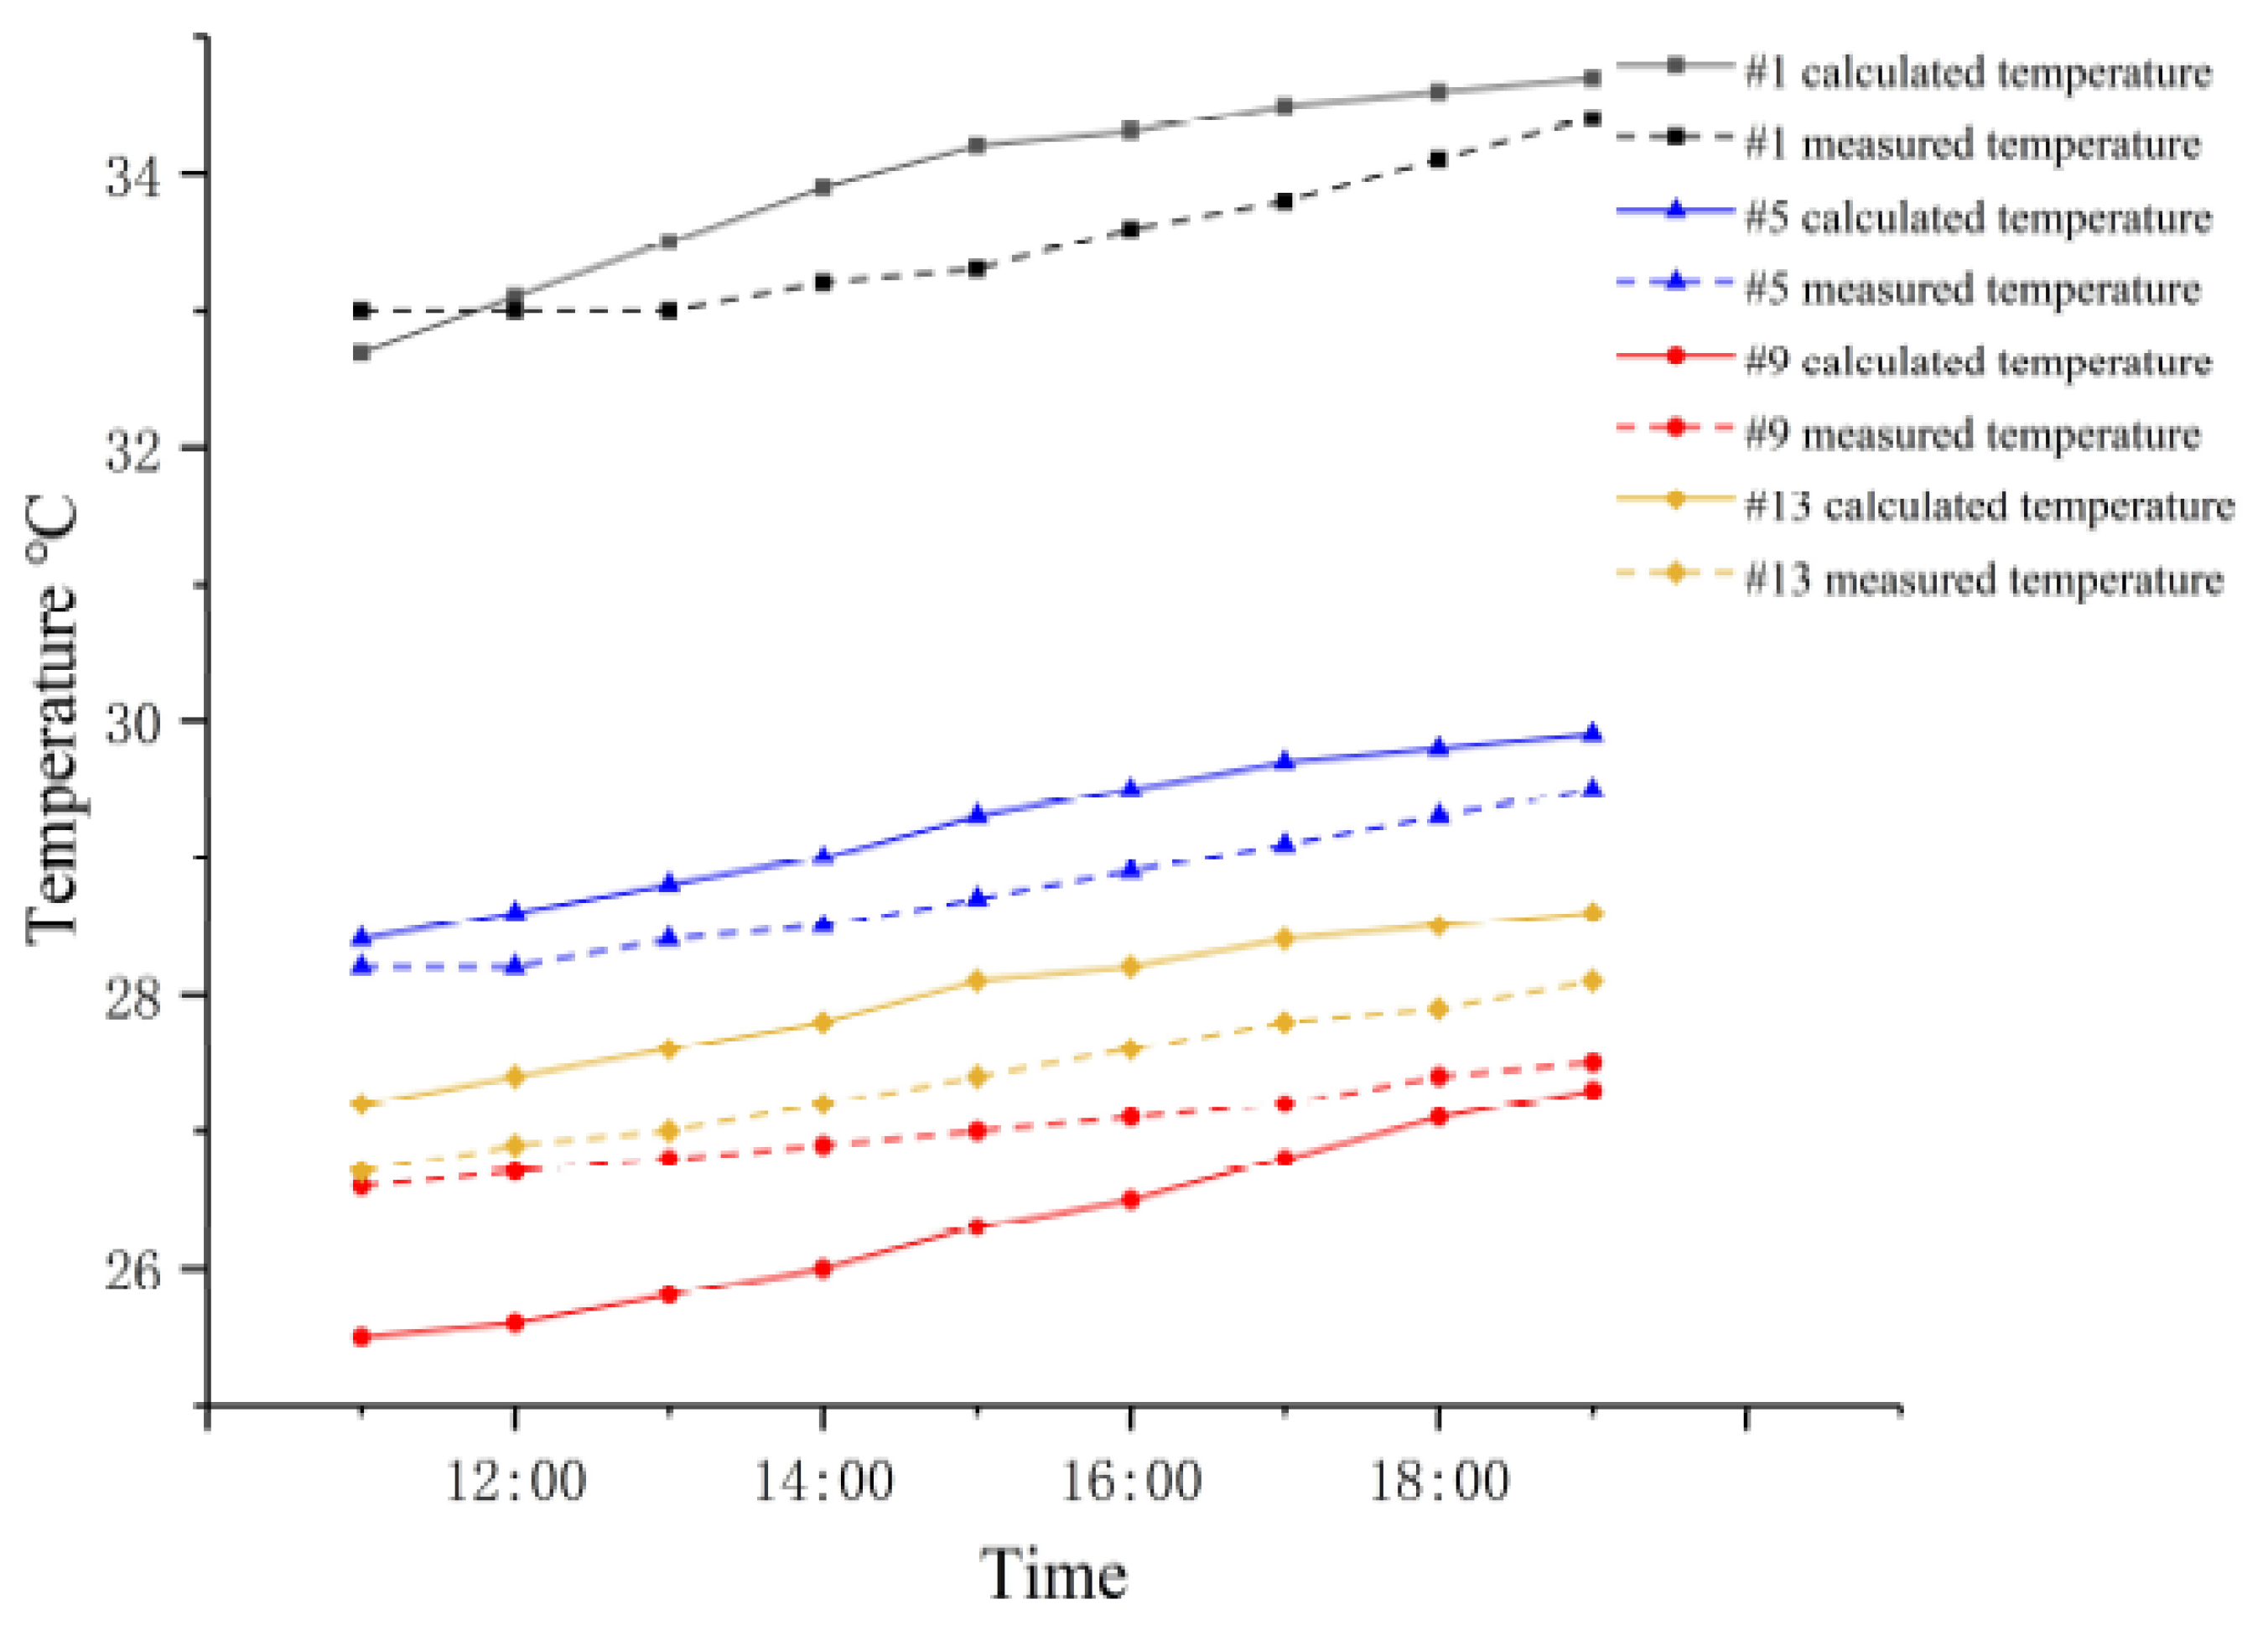
3.2. Temperature Field Analysis and the Finite Element Numerical Simulation

The measured time–temperature curves of each slab of the box girder are shown in Figure 8.
The temperature variations show the temperature distribution of the measuring points in four slabs in the day. The maximum temperature appears in the top slab. Due to the pavement influence, there is a delay between the rise of measured temperature and solar radiation. The overall temperature of the left web (sunshine side) is higher than that of the right web (sheltered side), and the temperature changing range is also more extensive. The overall temperature of the bottom slab is the lowest but changes more obviously. It also illustrates that direct solar radiation has the most significant influence on the temperature field, and the depth of practical impact is about 30 cm.
Since the temperature field distribution along the length of the bridge is almost consistent, 2D simulations of the temperature field at the mid-span section were carried. The simulation analysis of the solar effect is by ANSYS, the element size is 0.05 m, and the element type is used as PLANE 55/182, which is suitable for transient temperature analysis. The simulation time is selected from 6:00 to 19:00 according to the sunlight period, and the steady-state simulation result of the temperature field at 6:00 is as the initial condition. The load step was set as every other hour. After obtaining the temperature fields, the thermal-structure coupling method in ANSYS is used to calculate the temperature stress. According to the design information, the material properties of bridge girder concrete and the parameters of comprehensive heat convection are shown in Table 2 and Table 3.
According to the thermodynamic theory, the temperature boundary condition of the girder under solar radiant is unified as the third boundary condition. The integrated heat transfer coefficient h c + h r on the sunlight surfaces is calculated as Formula (13) and (14); the coefficient at different moments is shown in Table 4.
The temperature contours at partial moments of the day are shown in Figure 9.
The finite element calculation shows that the maximum temperature appears at the top deck under solar radiation, and the minimum temperature area appears inside the right part of the section. The comparison between the measured data and calculated results of some points in each slab is shown in Figure 10.
Through comparison, the overall trend of the measured temperature and the calculated value is the same. Due to the influence of the sensors’ installation accuracy and other environmental factors, there is a difference between the two results, but the difference between them is slight; most of the time, it is within 1°C. The result of finite element simulation could be considered accurate.

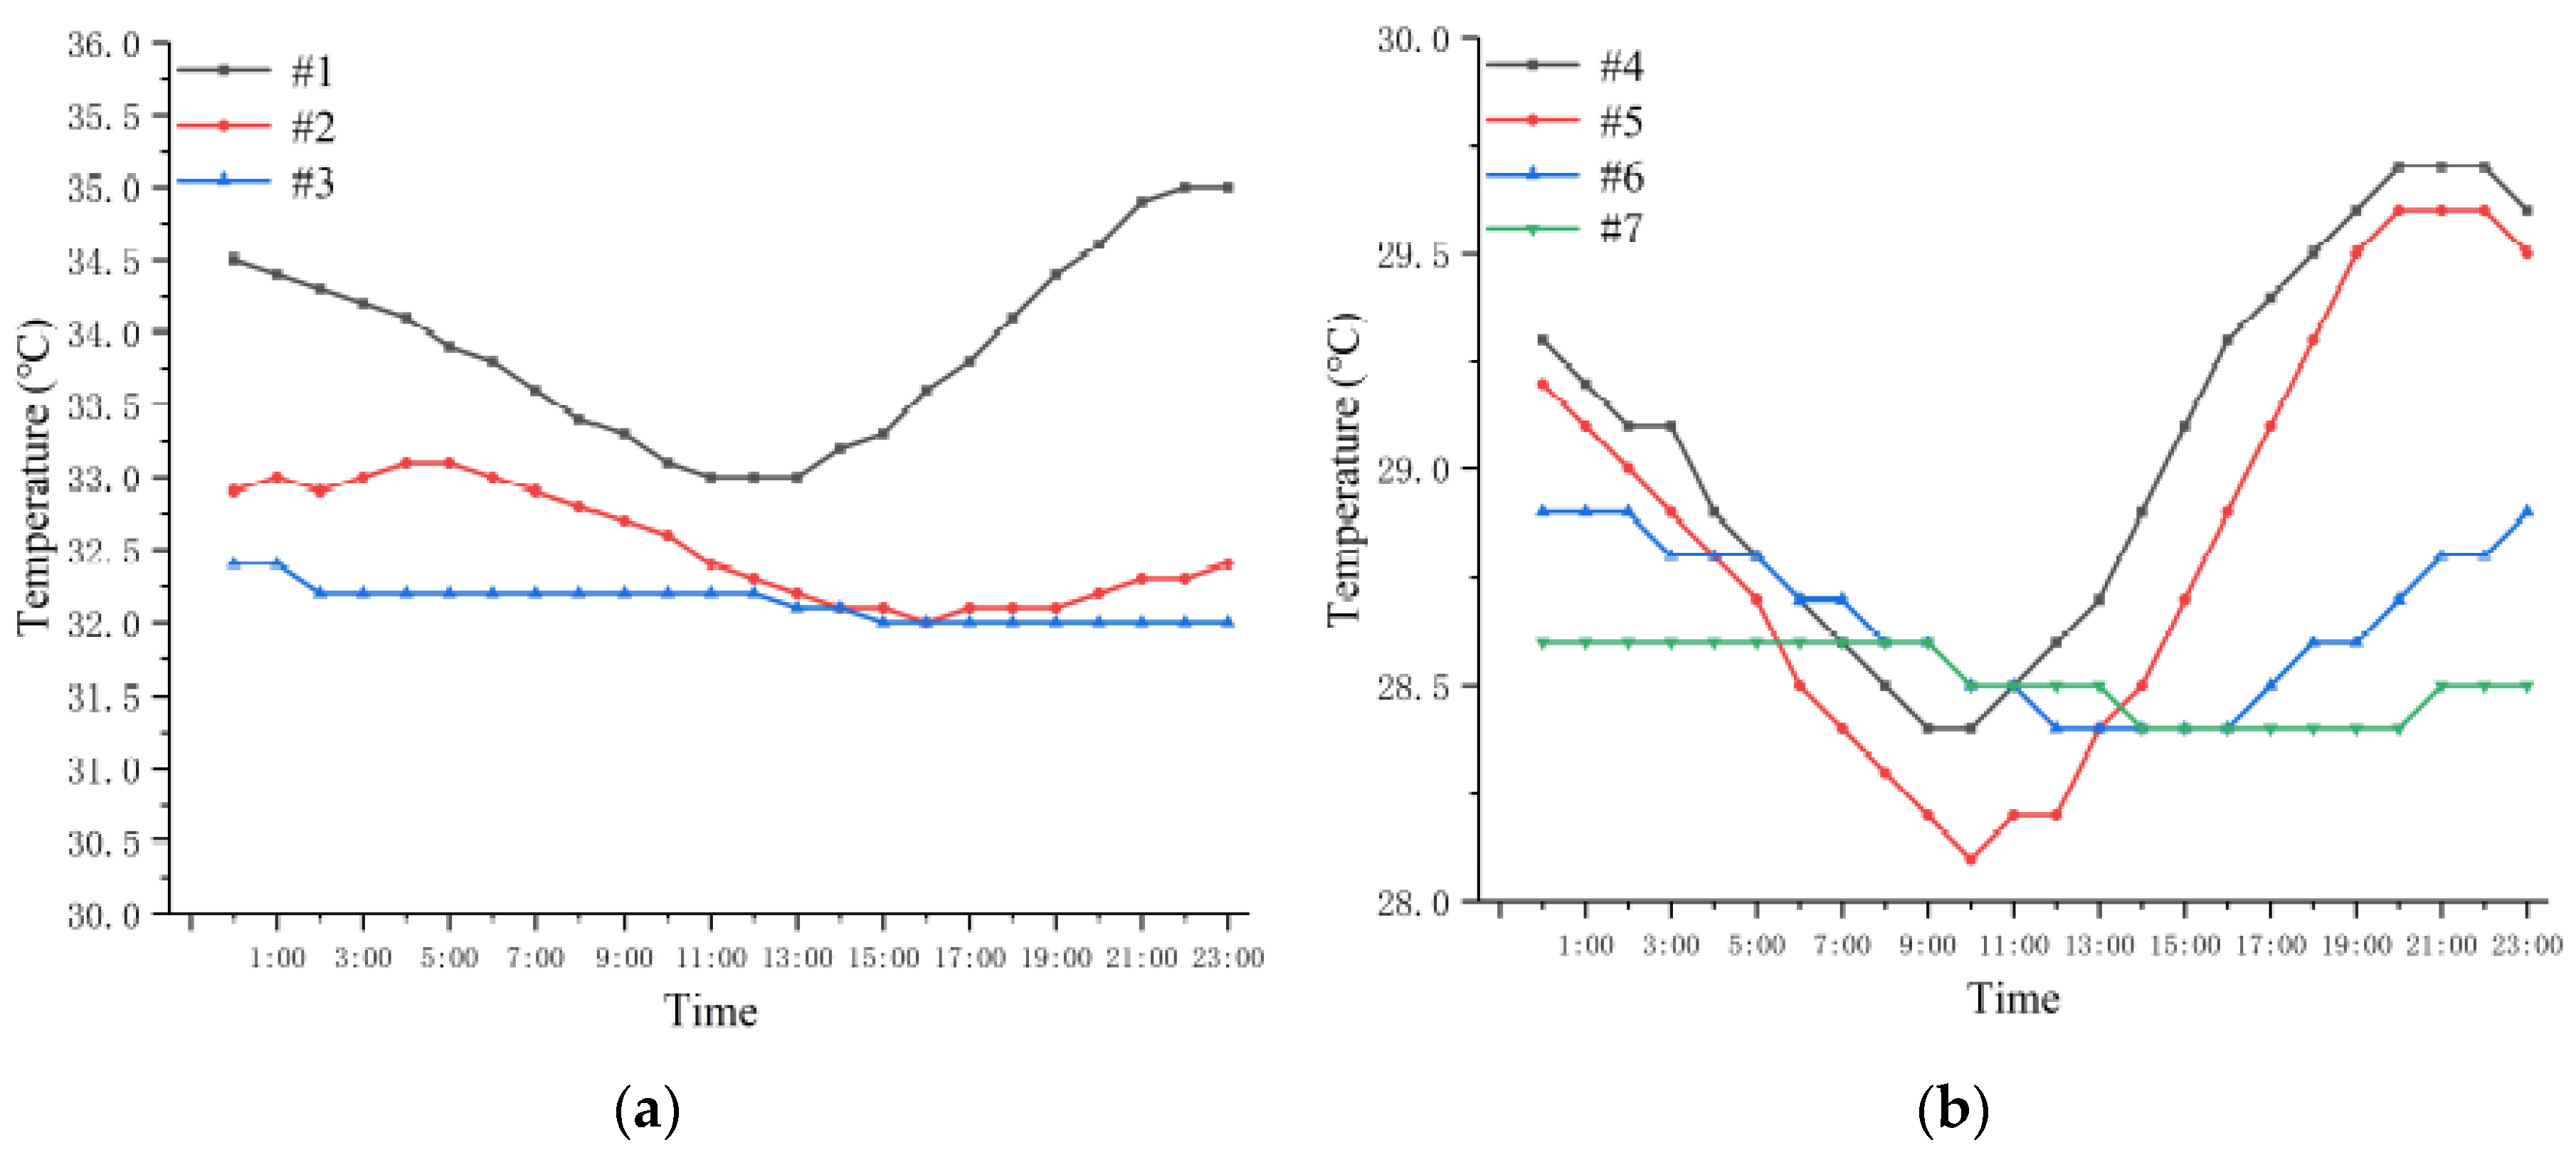
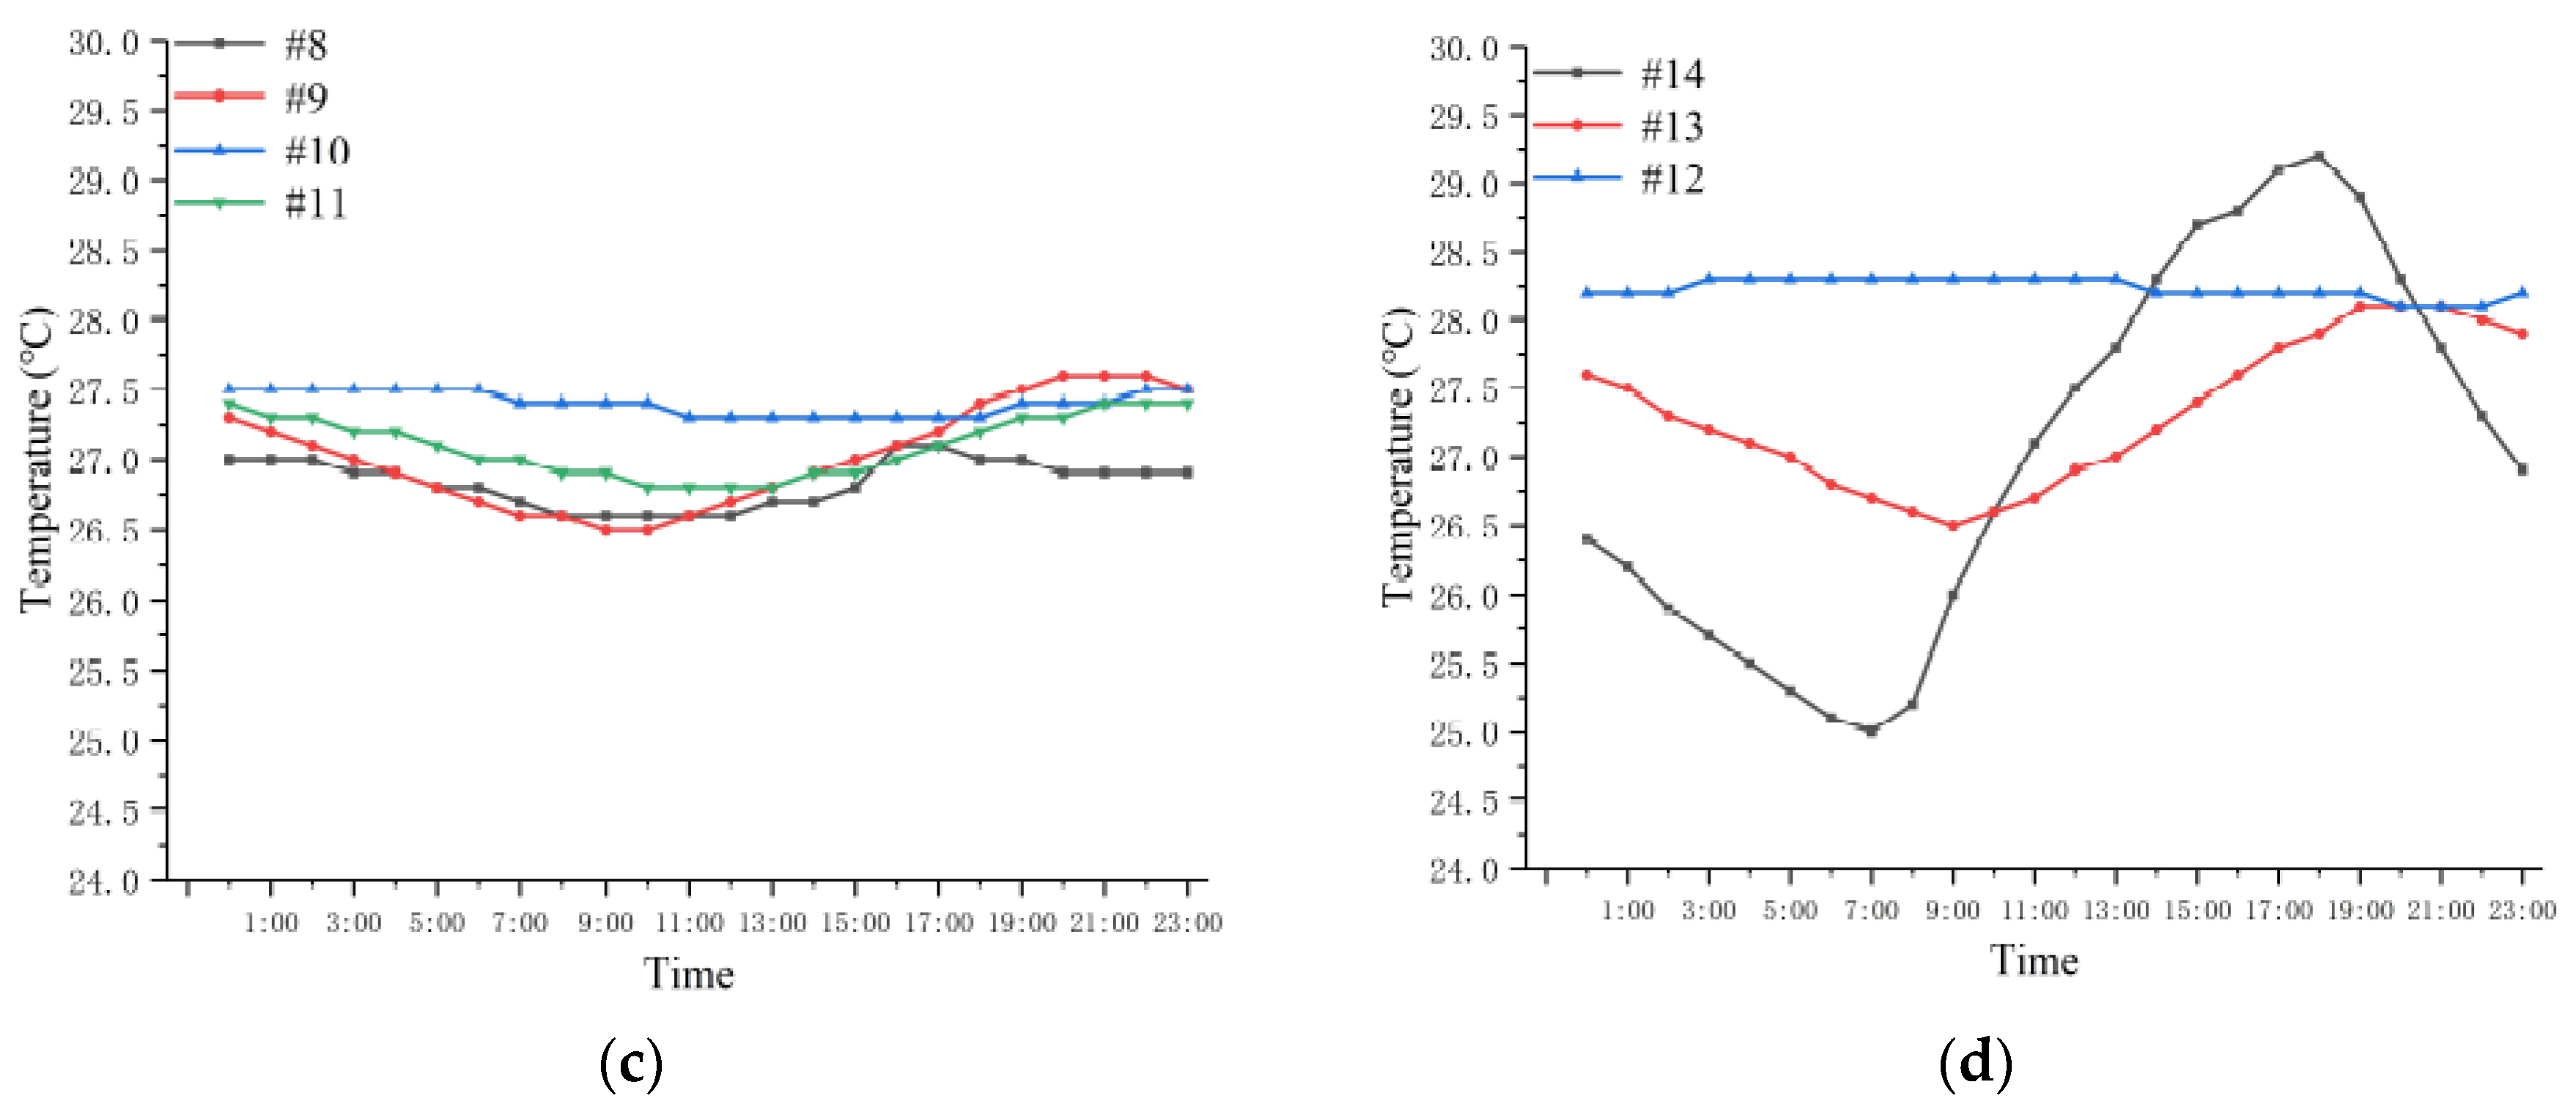
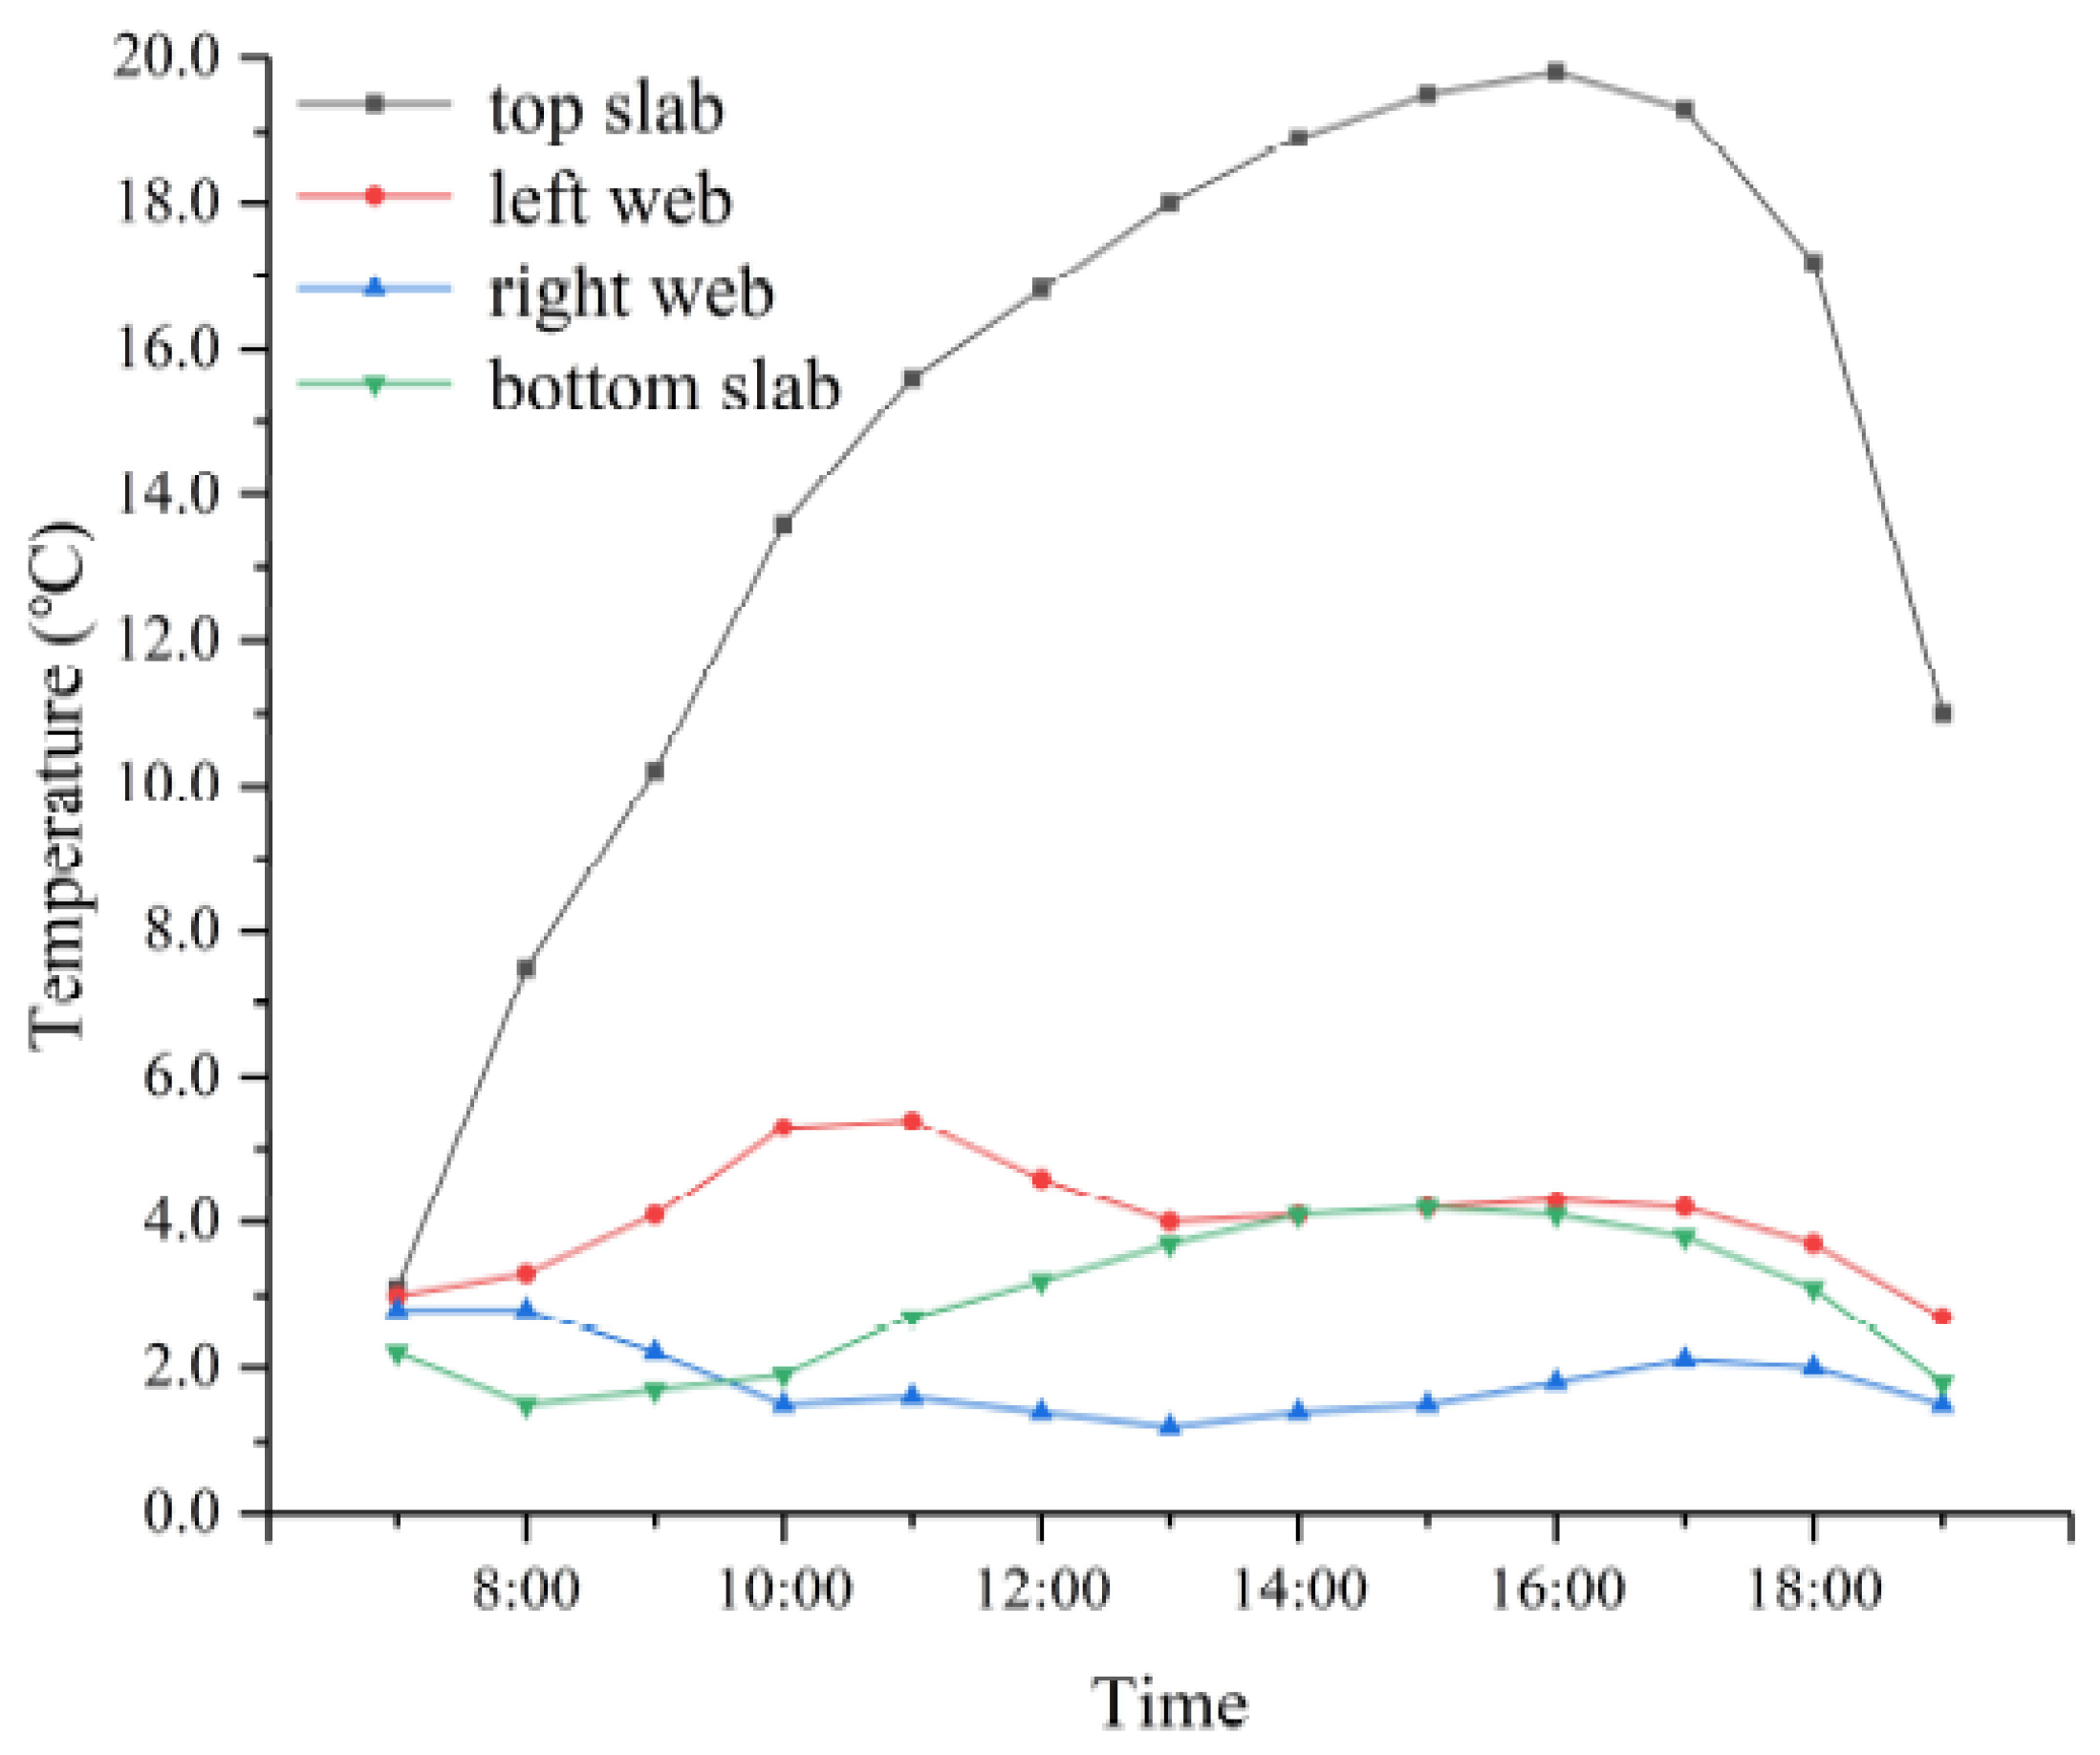
3.3. The Variation of Temperature Difference

The temperature difference of the girder will lead to thermal stress, which may cause concrete cracks and even influence the bridge’s safety. The maximum theoretical temperature difference between the outer and inner surfaces of the four slabs from 7:00 to 19:00 is shown in Figure 11.
It is shown in Figure 11 and Table 5 that the temperature difference of the top slab is the largest, and the variation range is 16.7 °C. It starts to rise from 7:00 and reaches the maximum value at 16:00, which is 19.8 °C, and then begins to decline rapidly. The maximum temperature differences of the sunlight web and the bottom slab are 5.4 °C (11:00) and 4.2 °C (15:00), respectively, and the variation ranges are both 2.7 °C. The maximum value of the sheltered web is 2.8 °C (6:00), and the variation range is 1.5 °C.

4. The Estimated Extreme Temperature Condition of the Bridge in the Design Lifetime

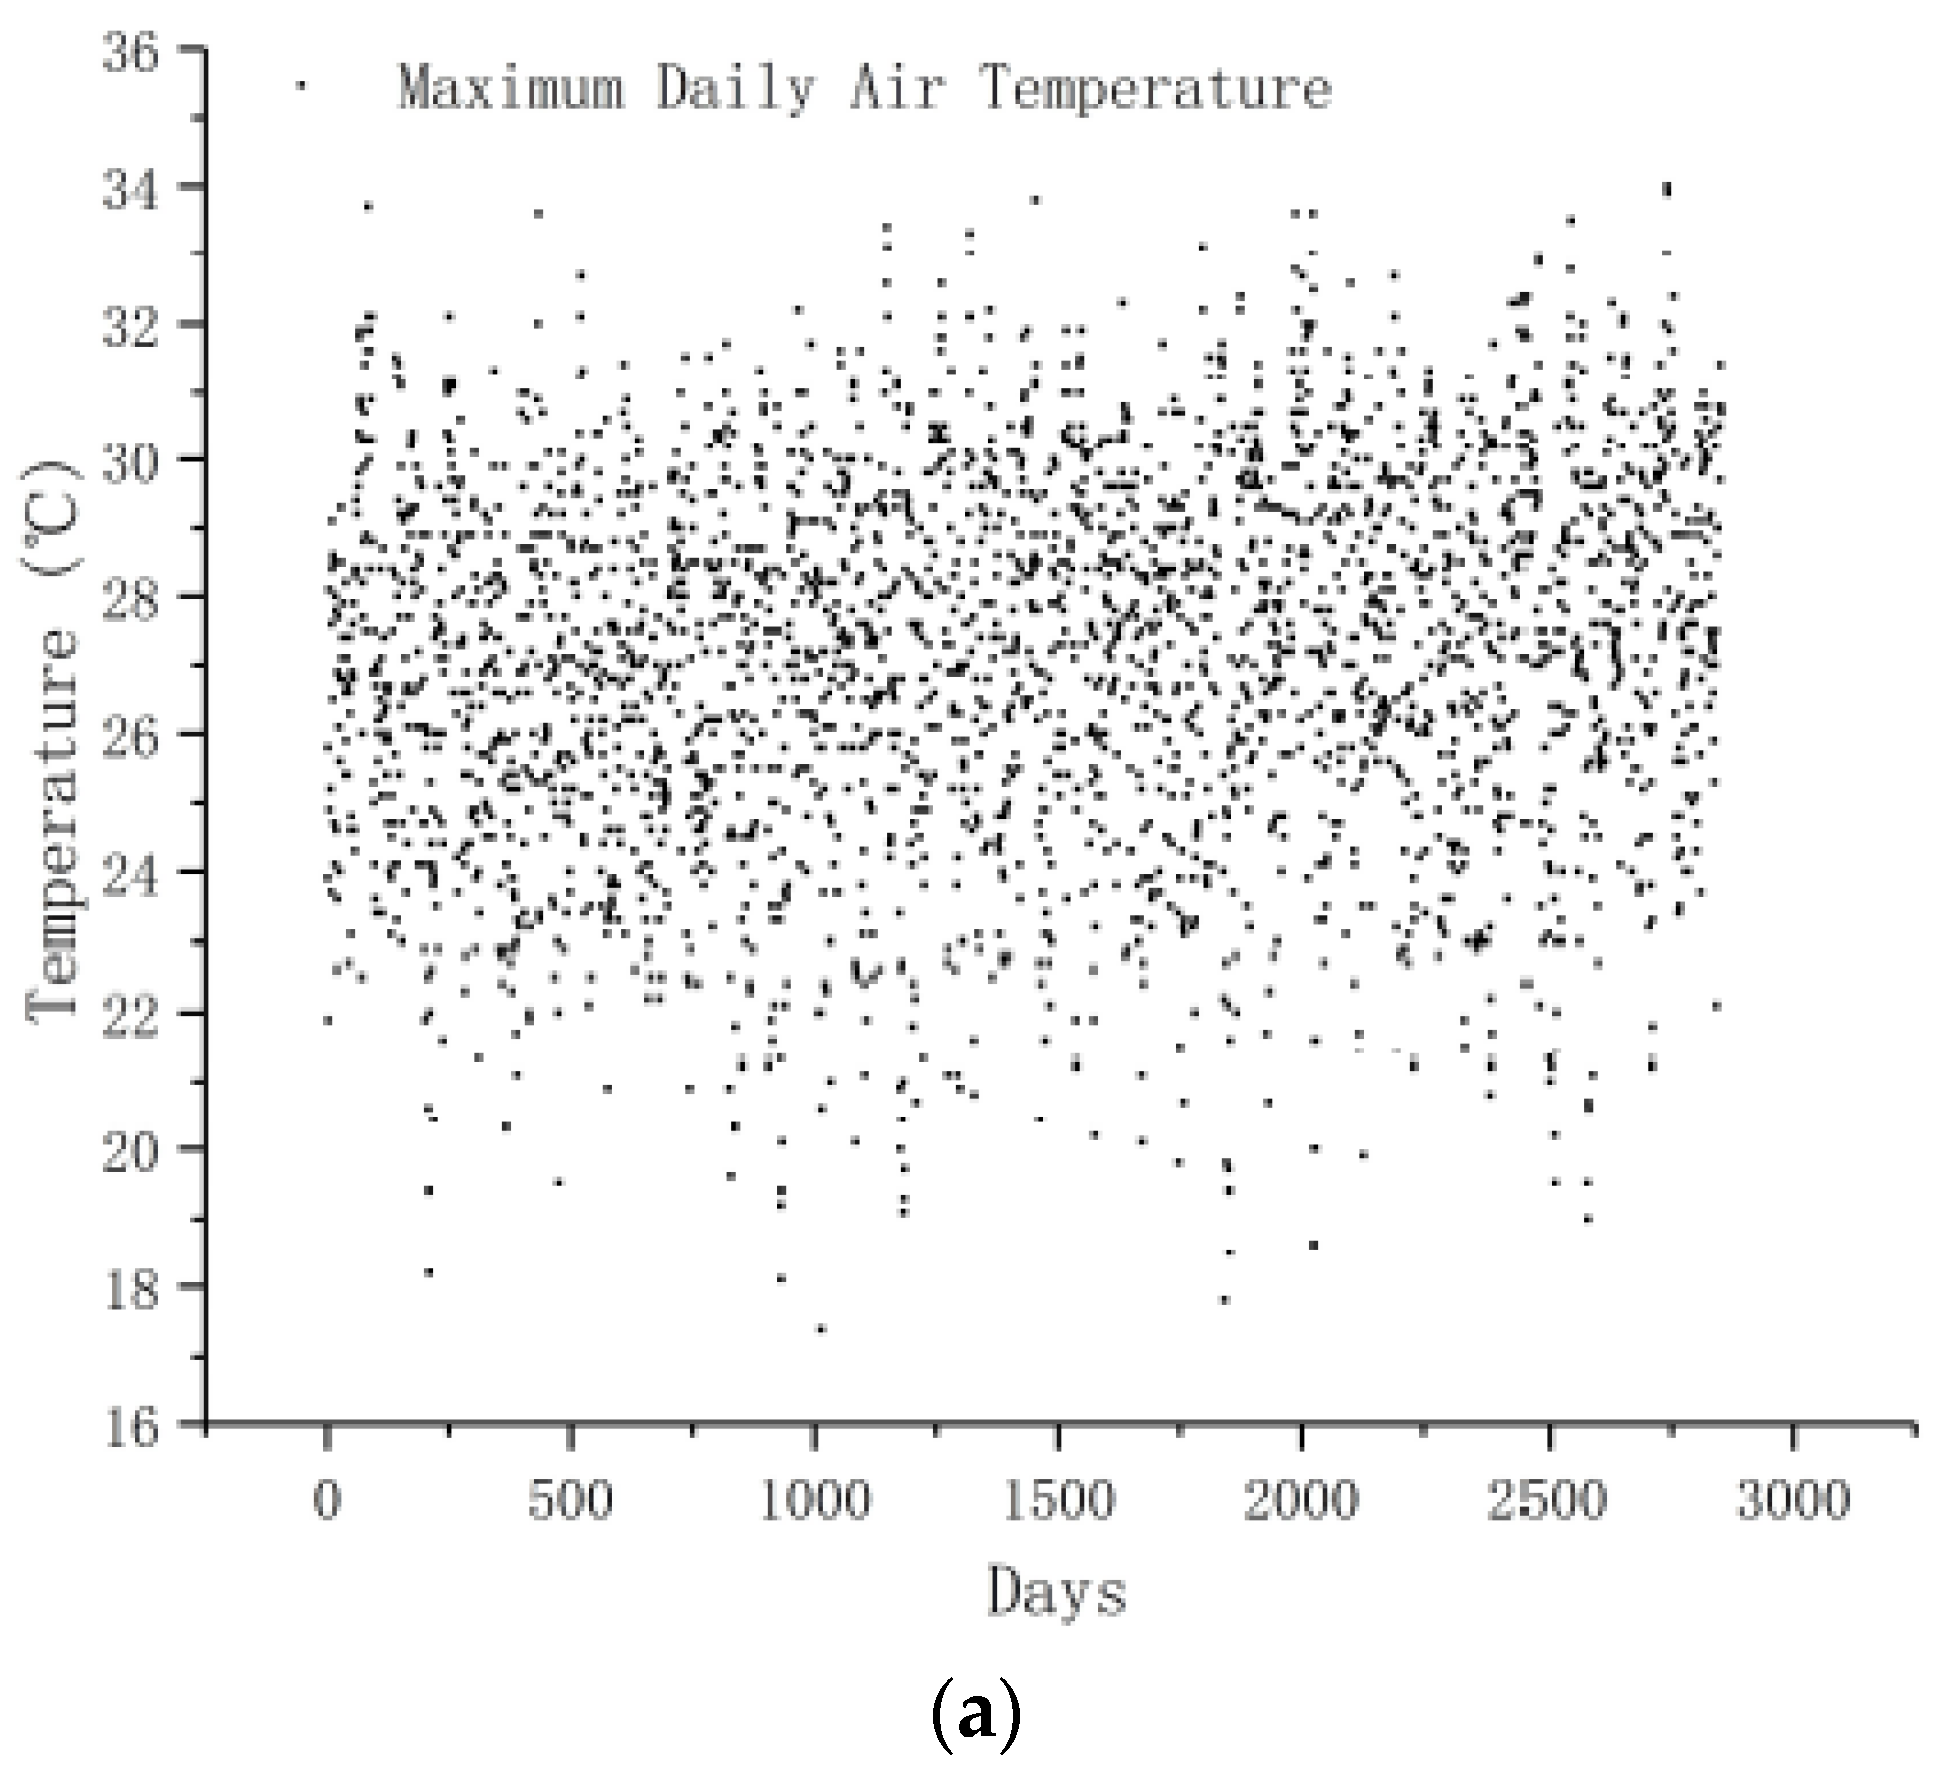
4.1. Historical Meteorological Data

The meteorological data are obtained from the nearest ground observation station (25.51° N and 107.33° E, altitude 980 m) of the bridge site. Summer (from June to August) air temperature data from 1990 to 2020 were collected and analyzed. The daily maximum air temperature T m a x , the daily maximum temperature difference Δ T m a x , and daily average wind speed w a in summer are shown in Figure 12.

4.2. Extreme Values of Meteorological Data Based on Generalized Extreme Value Distribution

The commonly used extreme value distributions are Gumbel, Fréchet, and Weibull models. In applications, it is usually not easy to determine which extreme value distribution model conforms to the known data and needs to face uncertainty when selecting the distribution model. Therefore, the above three extreme value distributions can be expressed as a unified form, generalized extreme value (GEV) distribution.
G ( x ; μ ; σ ; ξ ) = e x p { [ 1 + ξ ( x μ σ ) 1 / ξ ] } , 1 + ξ ( x μ ) σ > 0
where μ is the location parameter, σ is the scale parameter, and ξ is the shape parameter. ξ , μ R ,   σ > 0 .
The parameters of T m a x and Δ T m a x were estimated by MATLAB, and the values of parameters are as T a m a x :   ξ = 0.359 , σ = 2.814 , μ = 26.317 , Δ T m a x :   ξ = 0.157 , σ = 2.386 , μ = 5.958 . The distribution functions of daily maximum air temperature and daily maximum temperature difference G ( x ) t , G ( x ) Δ are as
G ( x ) t = e x p { [ 1 0.359 ( x 26.317 2.814 ) 1 / 0.359 ] }
G ( x ) Δ = e x p { [ 1 0.157 ( x 5.958 2.386 ) 1 / 0.157 ] } .
According to the Chinese code [30], a bridge structure’s design lifetime is 100 years, so the extreme temperature data in the return period ( T ) of 100 years are considered a severe load condition. The estimated extreme temperature with a return period of 100 years was estimated as x p when 1 f ( x ) = 1 / T .
x p = { [ log ( 1 p ) ] ξ 1 } σ ξ + μ
Based on Formula (15), the smaller the wind speed is, the more significant the temperature difference inside the concrete box girder. Therefore, it is necessary to obtain a small value of wind speed. Since the generalized extreme value distribution is generally used to fit the maximum value, set the parameter of the daily minimum average wind speed M i n { v 1 , v 2 , , v n } = M a x { v 1 , v 2 , , v n } . The parameters of the wind speed are as,   w a :   ξ = 0.479 , σ = 1.284 , μ = 2.560 ; then, the distribution function of the wind speed G ( x ) w a is as:
G ( x ) t = e x p { [ 1 0.479 ( x + 2.560 1.284 ) 1 / 0.479 ] } .
After calculation, when the regression period is more than 10 years, the daily minimum average wind speed variation is less than 0.4 m/s. As the wind speed on the girder surface changes rapidly and randomly, the probability of the minimum average wind speed appearing over a regression period of 100 years is too small, and the result will be too unfavorable. The return period of wind speed is taken as 10 years, and the minimum value is 0.49 m/s.
Therefore, the estimated value of summer’s daily maximum air temperature is obtained as 33.1 °C, the daily maximum temperature difference is 14.7 °C, and the wind speed is valued as is 0.5 m/s. As the solar radiation changes slight in summer, the extreme thermal condition is obtained by combining the same solar radiation in Section 3.1 and the temperature and wind factors above.

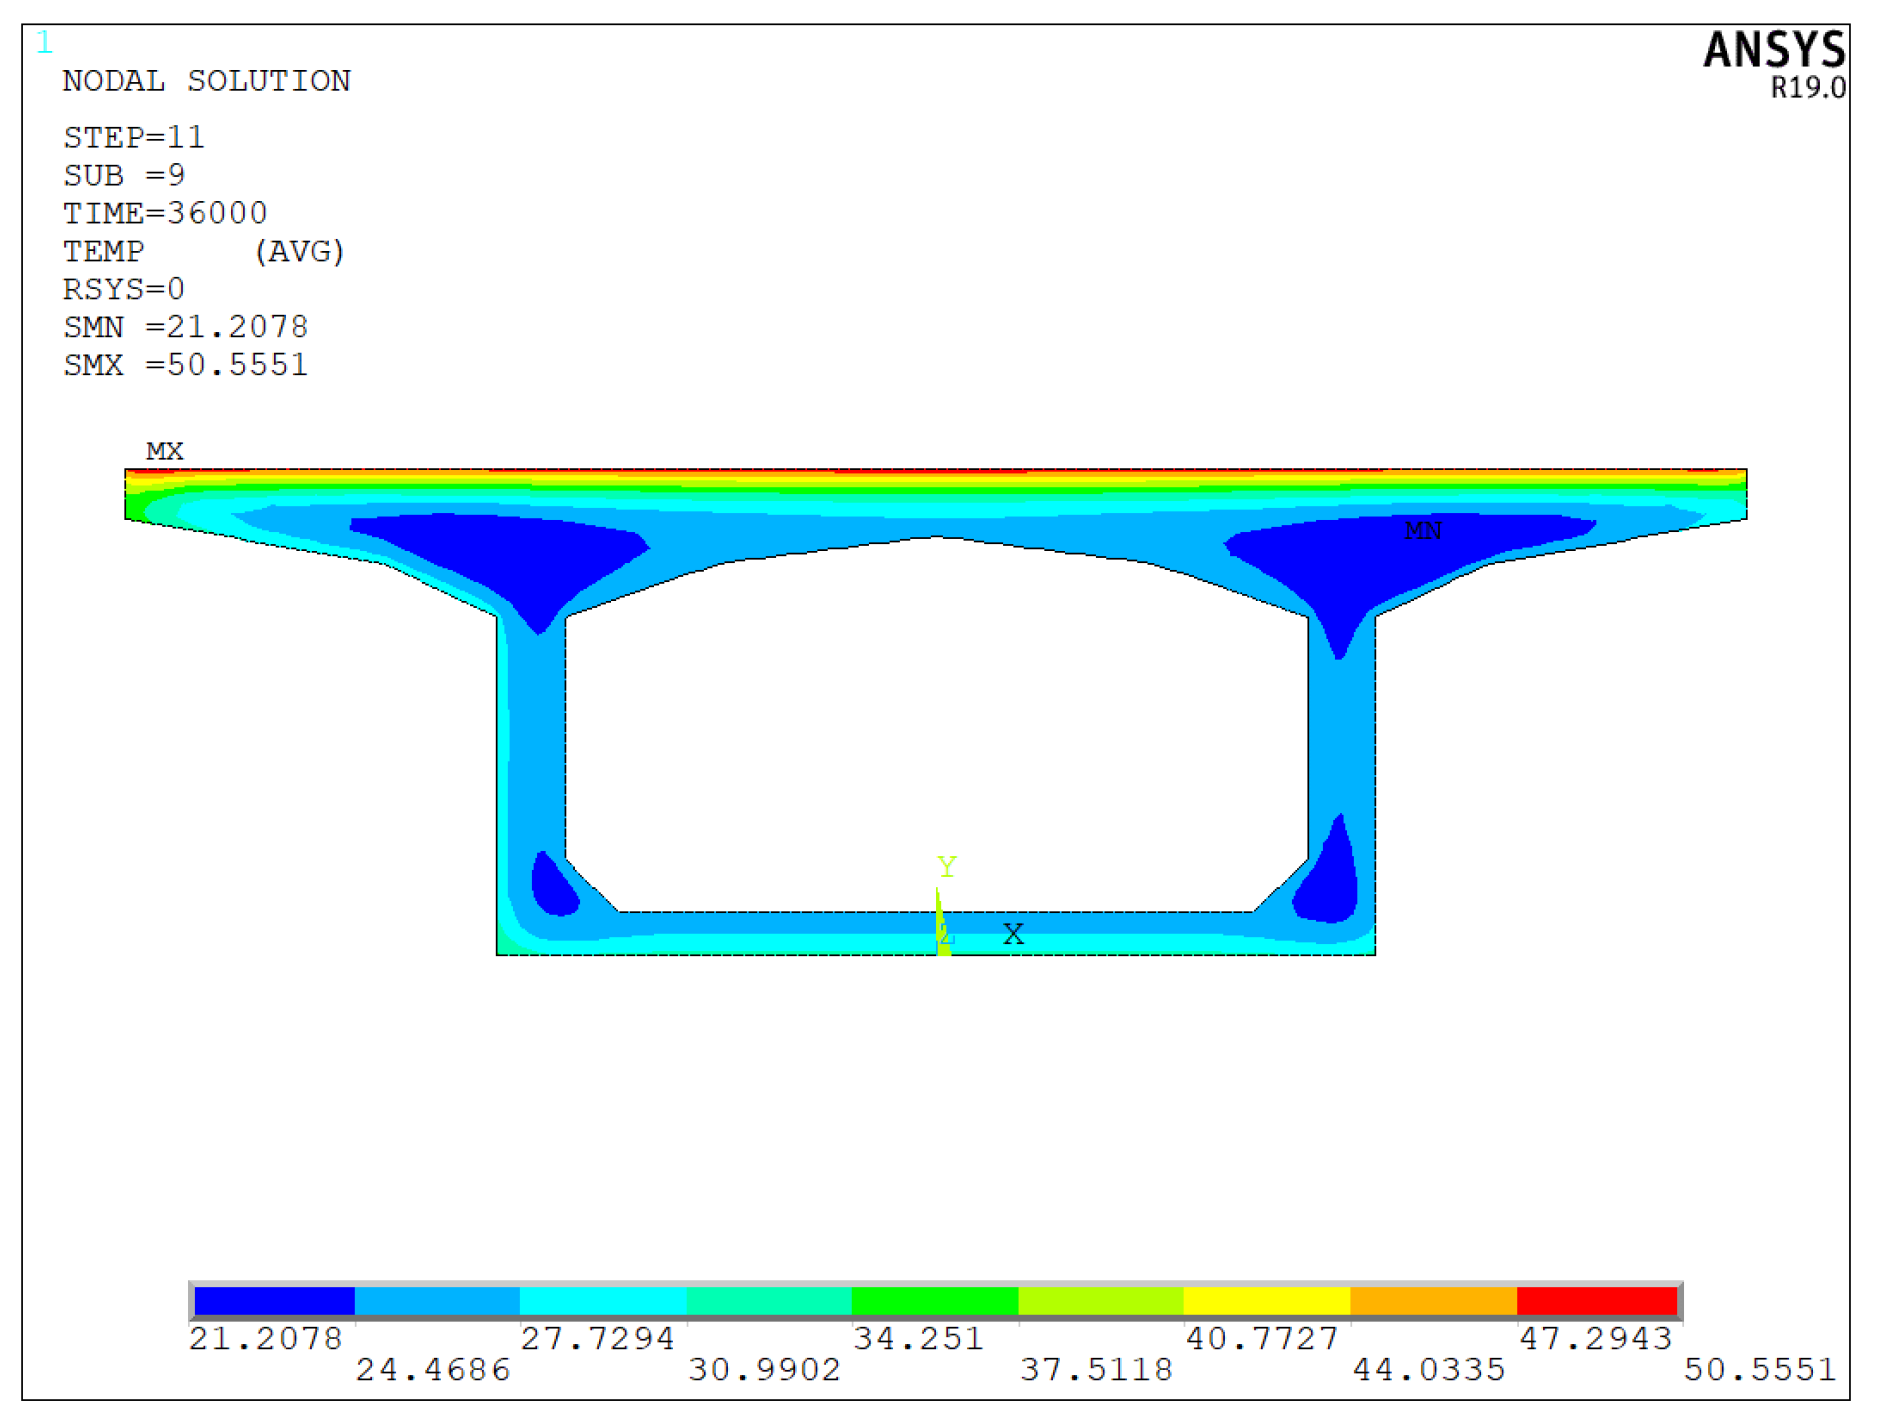
5. Numeral Example of the Box Girder Thermal Effect under Solar Radiation and the Extreme Temperature Condition

To study solar radiation and the extreme thermal effect on the concrete bridge girder, the temperature valve and wind speed obtained in the previous chapter were used for heat transfer process calculation. Since the solar radiation I o changes about 1.2 % in clear weather in summer, the solar condition remains the same. The hourly temperature of the day is calculated as Formula (22) [31]
T a ( t ) = 0.5 ( T a m a x T a m i n ) s i n [ ( t 9 ) 15 ° ] + 0.5 ( T a m a x + T a m i n )
where T a m a x is the maximum air temperature in a day, and T a m i n is the minimum air temperature in a day, which is valued as T a m a x Δ T m a x .
As there is a time difference t d between the true solar time at the bridge site and the standard time (calculated by Formula (6)), and the measured maximum air temperature appears at 17:00, one-hour adjustment was applied to obtain the hourly air temperature for the numeral example.
With the temperature field simulated in ANSYS, the maximum temperature difference between the outer and inner surface of the cross-section was obtained, and the maximum value is 24.2 °C, which is located at the top slab at 16:00. The temperature field contour at this moment is shown in Figure 13.
Then, the thermal stress coupling method was used to study the thermal effect. With the temperature field at 16:00 as the most unfavorable thermal load condition, the thermal stress of the box girder cross-section was obtained. After calculation, the transverse thermal stress (X-axis of the section) and the vertical thermal stress (Y-axis) of the cross-section are shown in Figure 14.
The results show that under solar radiation and the extreme thermal load, the temperature stress of the box girder section presents a nonlinear distribution along the thickness direction. The transversal compressive stress is distributed in most parts of the cross-section, especially on the top slab’s outer surface, and the minimum value is −7.6 MPa. The transversal tensile stress is distributed in the top slab, and the maximum value is 3.0 MPa. The minimum vertical compressive stress and the maximum vertical tensile stress are −2.4 MPa and 0.9 MPa. According to the design code [30], the design value of concrete compressive strength is −22.4 MPa, and the tensile strength is 1.83 MPa. Therefore, the tensile stress caused by extreme thermal load has exceeded the specified design value of the code, especially, the maximum transversal tensile stress is 50% larger than the allowable value. According to the stress contour, it could cause cracks at the inner surface of the top deck and the lower edge of the flange plate. It is necessary to add more regional reinforcements to resist the tensile stress caused by the thermal effect on these areas accordingly.

6. Conclusions

This paper investigated the impact of solar radiation and the extreme thermal effect on concrete box girder bridges. The solar radiation intensity and temperature distribution of the box girder were obtained by field observing and calculation. The impact parameters such as solar intensity, wind speed, air temperature, and shadow occlusion on temperature distribution were considered. With solar radiation and the estimated extreme temperature with a return period of 100 years as the load condition, the thermal effect of the concrete box girder is studied using the finite element method, and the thermal stress is compared with the design values. The main conclusions are as follows.
(1)
The solar radiation changes obviously with time on different surfaces of the box girder. It arrives at the maximum value and keeps stable from 10:00 to 16:00 on the top deck. For the surfaces without direct sunlight, it changes slowly due to scattering and reflection radiation.
(2)
The effective depth due to solar radiation is about 30 cm, and the sunlight side web overall temperature is higher than that of the sheltered web. The impact of the temperature difference factors shows that direct solar radiation has the most significant effect on the temperature difference. The maximum value of the top slab is 19.8 °C, which appears at 16:00.
(3)
A method of estimating the extreme thermal condition is presented. The extreme temperature is fitted by GEV distribution based on the historical meteorological data. The estimated highest air temperature with a return period of 100 years at the bridge site is 33.1 °C, the most significant daily temperature difference is 14.7 °C, and a minimum daily average wind speed with a 10-year return period is 0.5 m/s. Then, the extreme thermal condition is obtained by combining the above meteorological data and solar radiation.
(4)
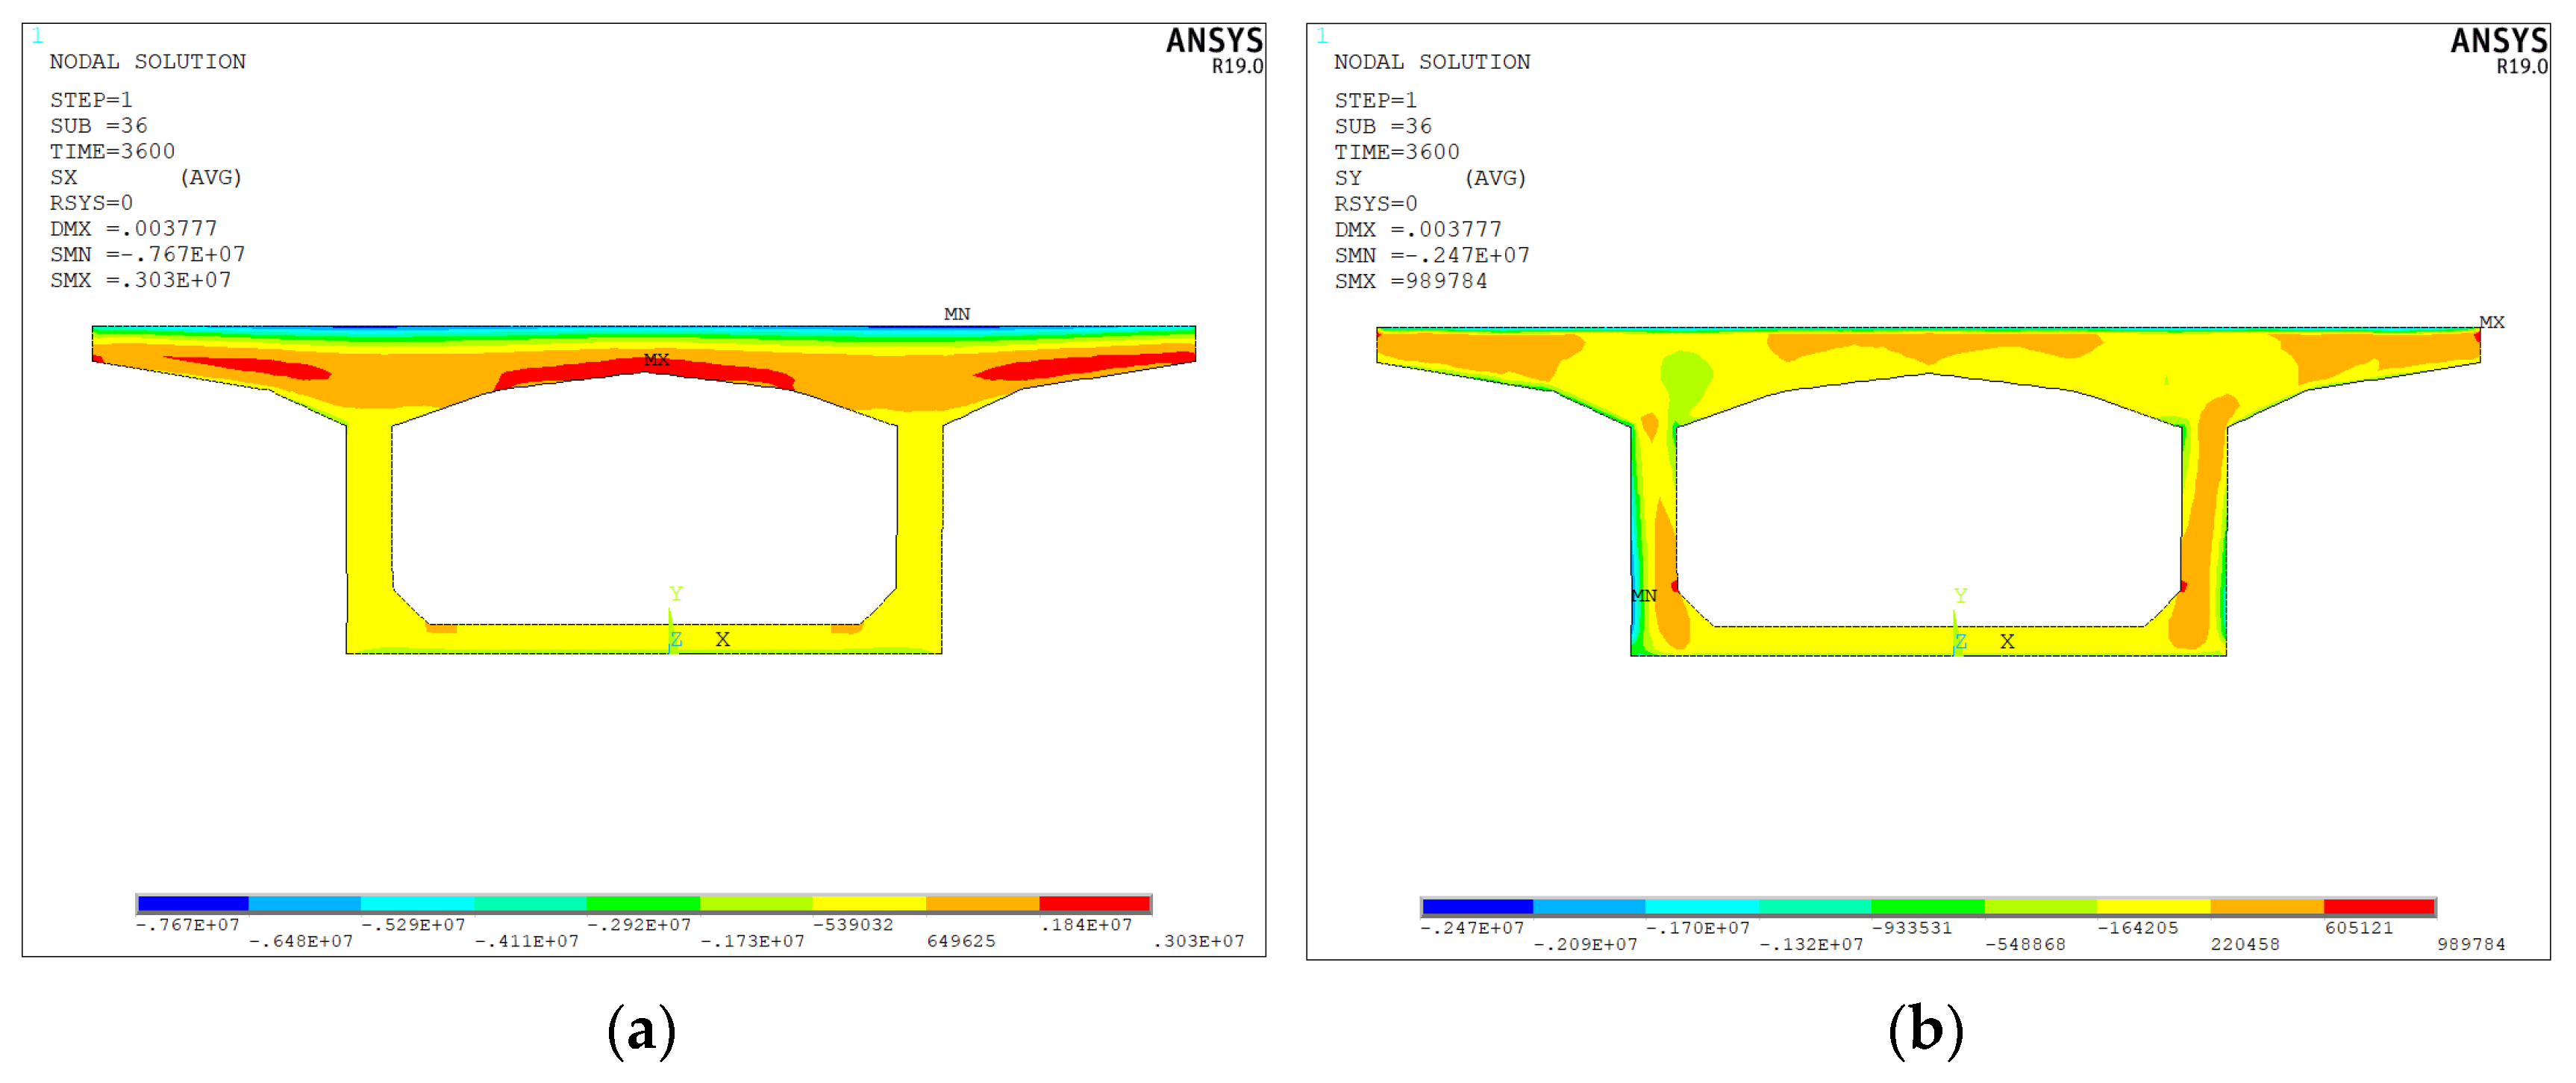
Under solar radiation and extreme thermal condition, the maximum temperature difference of the girder slab is 22.2% larger than that on the measured day. With it as the most unfavorable condition, the thermal stress of the cross-section was calculated. The maximum transversal tensile stress is 3.0 MPa, and the minimum compressive stress is −7.6 MPa; the maximum vertical tensile stress and the minimum compressive stress are 0.9 MPa and −2.4 MPa, respectively. The tensile stress has exceeded the specified design value of the code and could cause cracks, and the maximum tensile stress is 50% larger the design strength in the code. Therefore, in practical engineering, the structural reinforcements should be added on the inner surface of the top deck and the lower edge of the web plate according to the obtained tensile stress distribution.

Author Contributions

Conceptualization, Y.L. and D.L.; methodology, Y.L.; software, Y.L. and K.W.; validation, D.L.; formal analysis, Y.L. and S.J.; investigation, Y.L and D.L.; resources, D.L.; data curation, Y.L. and S.J.; writing—original draft preparation, Y.L.; writing—review andediting, Y.L.; supervision, D.L.; project administration, D.L.; funding acquisition, D.L. All authors have read and agreed to the published version of the manuscript.

Funding

This research received no external funding.

Institutional Review Board Statement

Not applicable.

Informed Consent Statement

Not applicable.

Data Availability Statement

Not applicable.

Conflicts of Interest

The authors declare no conflict of interest.

References

  1. Liu, Y.J.; Liu, J.; Zhang, N. Review on solar thermal actions of bridge structures. China Civ. Eng. J. 2019, 52, 59–78. [Google Scholar]
  2. Gottsäter, E.; Ivanov, O.L.; Molnár, M.; Crocetti, R.; Nilenius, F.; Plos, M. Simulation of thermal load distribution in portal frame bridges. Eng. Struct. 2017, 143, 219–231. [Google Scholar] [CrossRef]
  3. Lee, J.H.; Kalkan, I. Analysis of thermal environmental effects on precast, prestressed concrete bridge girders: Temperature differentials and thermal deformations. Adv. Struct. Eng. 2012, 15, 447–459. [Google Scholar] [CrossRef]
  4. Abou-Zeid, M.; Fowler, D.W.; Nawy, E.G.; Allen, J.H.; Halvorsen, G.T.; Poston, R.W.; Barlow, J.P.; Hansen, W.; Rhoads, R.J.; Brander, M.E.; et al. Control of cracking in concrete structures. Rep. ACI Comm. 2001, 224, 12–16. [Google Scholar]
  5. Sheng, X.; Yang, Y.; Zheng, W.; Zhou, B.; Li, S.; Huang, L. Study on the time-varying temperature field of small radius curved concrete box girder bridges. AIP Adv. 2020, 10, 105013. [Google Scholar] [CrossRef]
  6. Dai, G.; Tang, Y.; Liang, J.; Yang, L.; Chen, Y.F. Temperature monitoring of high-speed railway bridges in mountainous areas. Struct. Eng. Int. 2018, 28, 288–295. [Google Scholar] [CrossRef]
  7. Dai, G.L.; Tang, Y.; Chen, Y.F.; Liang, J.B.; Yang, L.H. Some issues on temperature model of box girder in HSR. In Proceedings of the 8th International Conference on Structural Health Monitoring of Intelligent Infrastructure (SHMII), Brisbane, Australia, 5–8 December 2017; pp. 1475–1484. [Google Scholar]
  8. Zhang, C.; Liu, Y.; Liu, J.; Yuan, Z.; Zhang, G.; Ma, Z. Validation of long-term temperature simulations in a steel-concrete composite girder. In Structures; Elsevier: Amsterdam, The Netherlands, 2020; Volume 27, pp. 1962–1976. [Google Scholar]
  9. Gottsäter, E.; Larsson Ivanov, O. Spatial temperature differences in portal frame bridges. Struct. Eng. Int. 2020, 30, 254–261. [Google Scholar] [CrossRef] [Green Version]
  10. Tomé, E.S.; Pimentel, M.; Figueiras, J. Structural response of a concrete cable-stayed bridge under thermal loads. Eng. Struct. 2018, 176, 652–672. [Google Scholar] [CrossRef]
  11. Westgate, R.; Koo, K.Y.; Brownjohn, J. Effect of solar radiation on suspension bridge performance. J. Bridge Eng. 2015, 20, 04014077. [Google Scholar] [CrossRef] [Green Version]
  12. Branco, F.A.; Mendes, P.A. Thermal actions for concrete bridge design. J. Struct. Eng. 1993, 119, 2313–2331. [Google Scholar] [CrossRef]
  13. Song, Z.; Xiao, J.; Shen, L. On temperature gradients in high-performance concrete box girder under solar radiation. Adv. Struct. Eng. 2012, 15, 399–415. [Google Scholar] [CrossRef]
  14. Kim, S.H.; Park, S.J.; Wu, J.; Won, J.-H. Temperature variation in steel box girders of cable-stayed bridges during construction. J. Constr. Steel Res. 2015, 112, 80–92. [Google Scholar] [CrossRef]
  15. Zhou, L.; Xia, Y.; Brownjohn, J.M.; Koo, K.Y. Temperature analysis of a long-span suspension bridge based on field monitoring and numerical simulation. J. Bridge Eng. 2016, 21, 04015027. [Google Scholar] [CrossRef]
  16. Tayşi, N.; Abid, S. Temperature distributions and variations in concrete box-girder bridges: Experimental and finite element parametric studies. Adv. Struct. Eng. 2015, 18, 469–486. [Google Scholar] [CrossRef]
  17. Lee, Y.; Choi, M.S.; Yi, S.T.; Kim, J.K. Experimental study on the convective heat transfer coefficient of early-age concrete. Cem. Concr. Compos. 2009, 31, 60–71. [Google Scholar] [CrossRef]
  18. Dilger, W.H.; Ghali, A.; Chan, M.; Cheung, M.S.; Maes, M.A. Temperature stresses in composite box girder bridges. J. Struct. Eng. 1983, 109, 1460–1478. [Google Scholar] [CrossRef]
  19. Guo, L.; Guo, L.; Zhong, L.; Zhu, Y. Thermal conductivity and heat transfer coefficient of concrete. J. Wuhan Univ. Technol.-Mater. Sci. Ed. 2011, 26, 791–796. [Google Scholar] [CrossRef]
  20. Lacis, A.A.; Hansen, J. A parameterization for the absorption of solar radiation in the earth’s atmosphere. J. Atmos. Sci. 1974, 31, 118–133. [Google Scholar] [CrossRef]
  21. Wang, Z.W.; Zhang, W.M.; Tian, G.M.; Liu, Z. Joint values determination of wind and temperature actions on long-span bridges: Copula-based analysis using long-term meteorological data. Eng. Struct. 2020, 219, 110866. [Google Scholar] [CrossRef]
  22. Liu, Y.; Su, H.T.; Dai, G. Study on Temperature Fields of Simply-supported Box Girder under Solar Radiation in Passenger Dedicated Lines Based on Meteorological Conditions. J. China Railw. Soc. 2019, 2, 154–159. [Google Scholar]
  23. Xiao, J.; Song, Z.; Zhao, Y. Analysis of solar temperature action for concrete structure based on meteorological parameters. China Civ. Eng. J. 2010, 43, 30–36. [Google Scholar]
  24. Lucas, J.M.; Virlogeux, M.; Louis, C. Temperature in the box girder of the normandy bridge. Struct. Eng. Int. 2005, 15, 156–165. [Google Scholar] [CrossRef]
  25. Ding, Y.L.; Wang, G.X. Estimating extreme temperature differences in steel box girder using long-term measurement data. J. Cent. South Univ. 2013, 20, 2537–2545. [Google Scholar] [CrossRef]
  26. Sayigh, A.A.M. (Ed.) Solar Energy Engineering; Elsevier: Amsterdam, The Netherlands, 2012. [Google Scholar]
  27. Kehlbeck, F. Einfluss der Sonnenstrahlung bei Brückenbauwerken; Werner-Verlag: Berlin, Germany, 1975. [Google Scholar]
  28. Froli, M.; Hariga, N.; Nati, G.; Orlandini, M. Longitudinal thermal behaviour of a concrete box girder bridge. Struct. Eng. Int. 1996, 6, 237–242. [Google Scholar] [CrossRef]
  29. GB 50010-2010. Code for Design of Concrete Structures; Ministry of House and Urban-Rural Development of People’s Republic of China: Beijing, China, 2010. [Google Scholar]
  30. JTG 3362–2018. Code for Design of Highway Reinforced Concrete and Pre-Stressed Concrete Bridges and Culverts; China Communications Press: Beijing, China, 2018. [Google Scholar]
  31. Elbadry, M.M.; Ghali, A. Temperature variations in concrete bridges. J. Struct. Eng. 1983, 109, 2355–2374. [Google Scholar] [CrossRef]
Figure 1. Heat exchange between the box girder and the environment.
Applsci 11 06332 g001
Figure 2. Elevation of the bridge (unit: m).
Applsci 11 06332 g002
Figure 3. The cross-section and measuring sensors layout (unit: cm).
Applsci 11 06332 g003
Figure 4. The field observation station.
Applsci 11 06332 g004
Figure 5. Heat transfer conditions and the web shadow area.
Applsci 11 06332 g005
Figure 6. Diagram of solar angles.
Applsci 11 06332 g006
Figure 7. (a) Diurnal variation of the measured air temperature; (b) Diurnal variation of solar radiation intensity.
Applsci 11 06332 g007
Figure 8. (a) The measured temperature variation of the top slab; (b) The measured temperature variation of the left web; (c) The measured temperature variation of the right web; (d) The measured temperature variation of the bottom slab.
Applsci 11 06332 g008aApplsci 11 06332 g008b
Figure 9. (a) Temperature contour at 7:00 (°C); (b) Temperature contour at 11:00 (°C); (c) Temperature contour at 15:00 (°C); (d) Temperature contour at 19:00 (°C).
Applsci 11 06332 g009
Figure 10. The comparison between the measured data and calculated values.
Applsci 11 06332 g010
Figure 11. The maximum temperature difference between the outer and inner surface of the girder.
Applsci 11 06332 g011
Figure 12. (a) The daily maximum air temperature; (b) The daily maximum temperature difference; (c) The average daily wind speed.
Applsci 11 06332 g012aApplsci 11 06332 g012b
Figure 13. Temperature contour under the extreme thermal condition (°C).
Applsci 11 06332 g013
Figure 14. (a) Transversal stress SX contour (Pa); (b) Vertical stress SY contour (Pa).
Applsci 11 06332 g014
Table 1. Solar radiation types of different surfaces.
Solar Radiation TypeNumber of Surfaces
Horizontal solar radiation7
Vertical solar radiation2,6
Only horizontal scattering and reflection1,4,5
Only vertical scattering and reflection3
No solar radiation8–11
Table 2. Material thermal properties [29].
Density ρ Specific Heat cThermal Conductivity λ Elastic ModuleLinear Expansion CoefficientPoisson’s Ratio
2600 kg/m3910 J/(kg·°C)2.7 W/(m·°C)3.45 × 104 MPa1 × 10−5 °C0.2
Table 3. Comprehensive heat convection parameters.
Surface Albedo r e Wind Speed, v Surface Emissivity ε r Radiation Absorption ε Inner Surface Integrated Heat Transfer Coefficient Stefan–Boltzmann Constant C 0
0.21.5 m/s0.880.511.05 W/(m2·°C)5.67 × 10−8 W/(m2·K4)
Table 4. The outer surface integrated heat transfer coefficient.
Time h c + h r Time h c + h r
6:0016.7313:0017.19
7:0016.8114:0017.24
8:0016.8615:0017.29
9:0016.9916:0017.31
10:0017.0517:0017.35
11:0017.1118:0017.31
12:0017.1119:0017.22
Table 5. The temperature difference of the girder.
PositionMaximum Temperature Difference (Time)Temperature Difference Variation Range
Top slab 119.8 °C (16:00)16.7 °C
Left web 25.4 °C (11:00)2.7 °C
Bottom slab 34.2 °C (15:00)2.7 °C
Right web 42.8 °C (6:00)1.7 °C
1 Thermal condition: Direct solar radiation, scatting radiation, reflection, and air temperature. 2 Direct solar radiation (7:00–9:00), scatting radiation, reflection, and air temperature. 3 Scatting radiation, reflection, and air temperature. 4 Air temperature and no wind.
Publisher’s Note: MDPI stays neutral with regard to jurisdictional claims in published maps and institutional affiliations.

