Abstract
Big Data has real value when the veracity of the collected data has been previously identified. However, data veracity for load monitoring in professional soccer players has not been analyzed yet. This systematic review aims to evaluate the current evidence from the scientific literature related to data veracity for load monitoring in professional soccer. Systematic searches through the PubMed, Scopus, and Web of Science databases were conducted for reports onthe data veracity of diverse load monitoring tools and the associated parameters used in professional soccer. Ninety-four studies were finally included in the review, with 39 different tools used and 578 associated parameters identified. The pooled sample consisted of 2066 footballers (95% male: 24 ± 3 years and 5% female: 24 ± 1 years). Seventy-three percent of these studies did not report veracity metrics for anyof the parameters from these tools. Thus, data veracity was found for 54% of tools and 23% of parameters. The current information will assist in the selection of the most appropriate tools and parameters to be used for load monitoring with traditional and Big Data approaches while identifying those still requiring the analysis of their veracity metrics or their improvement to acceptable veracity levels.
1. Introduction
Load monitoring is used to ensure the best workload that optimizes physical fitness and sports performance while preventing athletes from injury or illness in soccer [1]. In this context, a true individualization of all training factors in team sports is mandatory for a better fitness–fatigue equilibrium through an individualized monitoring approach [2]. Meanwhile, the number of injuries [3] and the physical performance of soccer players continue to increase over the years [4]. For instance, in a 13-year longitudinal analysis, it was found that hamstring injuries have annually increased by 4% in professional soccer players [3]. Factors associated with load monitoring, such as player load, match frequency, playing style, team management, and the continuity of technical staff, have also influenced these trends [3]. On the other hand, it is well accepted that physical performance in soccer matches has continuously improved over the past years. For instance, total distance covered, high-intensity running and sprinting distances, and number of sprints increased by 2% (effect size (ES): 0.22), 30% (ES: 0.82), 35% (ES: 0.93), and 85% (ES: 1.46), respectively, across 7 seasons of the English Premier League (i.e., 2006–2007 compared to 2012–2013) [4]. However, the VO2max of elite female [5] and male [6] soccer players has not changed between 1989 and 2007 for females and between 1989 and 2012 for males. This paradox of a similar aerobic fitness between decades, despite objectively increased match demands, highlights the need to select appropriate monitoring tools. Furthermore, considering that soccer is a complex sport in which players need to develop several physical capacities (e.g., acceleration, agility, endurance), the selection of the best tools to monitor the evolution of players’ physical fitness over the season is required for better managing the complex balance between training, competition, recovery, and evaluation [7,8,9,10].
We are living in a time where technology has experienced a fast evolution in the sports arena [11]. This technological growth has enabled the 24 h monitoring of athletes on an individual basis [12], thus allowing large data sets, i.e., Big Data, to be gathered in sport settings. Careful analyses of these large datasets can enhance our knowledge in sportsscience and medicine, thus supporting the making-decision process for designing appropriate training and competitive strategies [13,14]. However, some premises, which are known as the four Vs of Big Data, should be attained fromthese datasets for these purposes: (1) volume, (2) variety, (3) velocity, and (4) veracity [15]. Volume refers to the size of the datasets; variety refers to different data formats and data sources; velocity describes the speed at which data is generated and processed for analyses; and veracity refers to the accuracy, quality, relevance, uncertainty, reliability, and predictive values of the collected data [14,15,16,17]. Focusing on veracity to identify the best monitoring tools and parameters in soccer is mandatory to identify the “errors” [18]. Furthermore, veracity is a preliminary step to effectively meet all these premises and, thus, optimize the applicability of Big Data to soccer with the best cost-to-benefit ratio. For instance, according to IBM [15], poor data quality generates an economic cost of around USD 3.1 trillion per year in the USA. If this value were the gross domestic product (GDP) of any country, it would be placed in the top 6 GDPs in the world.
Therefore, this systematic review aims to evaluate data veracity for load monitoring in professional soccer. This information is important for a deep understanding of the tools and parameters used in load monitoring as well as the effective implementation of Big Data analyses in professional clubs.
2. Materials and Methods
We adopted the Preferred Reporting Items for Systematic Reviews and Meta-Analyses (PRISMA) guidelines [19].
2.1. Sources and Study Selection Process
Three electronic databases (PubMed, Scopus, and Web of Science) were systematically searched from inception to August 2020. The command line (“monitoring” OR “monitor”) AND (“training load” OR “load”) AND (“soccer” OR “football”) was used in the title, abstract, and keywords during the electronic searches. The selection process was completed by two authors (J.G.C. and C.A.C.F.). If some doubt was found during this step, a third author (D.B.) assisted in the decision. The quality appraisal was completed by one author (J.G.C.).
2.2. Eligibility Criteria
Initially, the articles reviewed were identified after reading the titles and abstracts based on the following inclusion criteria:
- (1)
- The study was written in English;
- (2)
- The study was published as original research in a peer-reviewed journal, and a full-text article was available;
- (3)
- Data were reported for soccer players;
- (4)
- The participants were professional soccer players;
- (5)
- Load monitoring parameters were included.
Then, after this first screening, the eligibility criteria according to PECO were applied in the remaining full manuscripts. (P)articipants: healthy, professional soccer players of any age and sex. (E)xposure: exposure to load monitoring in the training session and/or on match day. (C)omparators: control groups without load monitoring are accepted but not mandatory. (O)utcomes: load monitoring tools and parameters.
2.3. Data Extraction
Five authors (A.L.M., G.R.C., R.G., F.M.V., and S.D.R.) extracted the following information from the included full-text articles: authors, year, sample information (mean, age, sex, sample size, competitive level), study design, veracity data, and information on load monitoring tools and parameters. The parameters were classified according to the applied method (e.g., laboratory or portable methods; venous or capillary blood samples). Discrepancies were resolved through discussion until consensus was reached. A narrative synthesis of data was performed.
The median was used when a range of a veracity metric was reported in a manuscript. All veracity metrics of the reported parameters were used to determine the median and range (minimum–maximum) for each tool.
2.4. Quality Assessment
The quality of all studies was evaluated by one author (J.G.C.) using objective evaluation criteria (see supplementary material, Table S1) based on a previous study by Saw et al. [20]. Scores were assigned based on how well each criterion was met, assuming a maximum possible score of 8 (low risk of bias). Studies with a score of ≤4 were considered poor and were, therefore, subsequently excluded.
2.5. Veracity Analysis
Veracity analysis was performed based on the use of measures related to accuracy, uncertainty, reliability, and quality of data [18,21,22,23]. All these measures were only obtained when explicitly reported by the authors’own data. For the used instruments, accuracy was checked in the manufacturer’s official documentation or website. Accuracy is understood as the closeness of the agreement between the result of a measurement and the true value of the measurand [24]. Uncertainty and reliability were obtained by absolute and relative consistencies using the standard error of measurement (SEM) [25] (also known as the typical error of measurement (TEM) or typical error (TE) [26], beyond the measures generated from the SEM itself as the minimum difference (MD) or minimum detectable change (MDC)) and the intraclass correlation coefficient (ICC) [25,26,27]. The SEM is the measure of the amount of error variance in a set of obtained scores, different from the standard error of estimate (SEE), which is the standard deviation of true scores if the observed score is held constant [28]. Standard uncertainty is the uncertainty of the result of a measurement expressed as a standard deviation [29]. Precision is understood as the closeness of agreement between the results of successive measurements of the same measurand, carried out under the same conditions of measurement. Precision is also called repeatability [24]. Limits of agreement (LOAs) refer to the reference interval for the test–retest differences expected for 95% of the population [30]. The coefficient of variation (CV) refers to the variation around the average, expressed as a percentage; data quality by means of the CV is interpreted by the level of instability [31].
Some reference values are assumed to better understand the results. SEM results lower than 5% have been suggested [32,33] and classified as good (SEM = < 5.0%), moderate (SEM = 5.0–9.9%), or poor (SEM ≥ 10.0%) [34,35,36]. However, it is recommended to present the corresponding value with confidence intervals (CIs) [37,38] because this is a measure of how much the measured test scores are spread around a “true” score [37,38]. Although the SEM may be better than the ICC [25] to evaluate reliability, both are reported in the present manuscript. According to Koo and Li [39], ICC values < 0.50 = poor, between 0.50 and 0.75 = moderate, between 0.75 and 0.90 = good, and >0.90 =indicative of excellent reliability. For the CV, it has been suggested that CV > 30.0% = large, CV < 30.0% and >10.0% = medium, and CV < 10.0% = small [40]. These reference values were used in the figure to determine the traffic-light systems(i.e., red, amber or green). For accuracy, MDC, SEE, precision, uncertainty and LOAs, no reference values were found in the scientific literature.
3. Results
The initial search returned 1035 articles (see Figure 1). After the removal of duplicates (n = 461), a total of 574 studies were retained for full-text screening. Following the eligibility assessment, 479 studies were excluded as they did not meet the inclusion criteria, while one full-text manuscript was not found. Finally, 94 studies were included in this systematic review [41,42,43,44,45,46,47,48,49,50,51,52,53,54,55,56,57,58,59,60,61,62,63,64,65,66,67,68,69,70,71,72,73,74,75,76,77,78,79,80,81,82,83,84,85,86,87,88,89,90,91,92,93,94,95,96,97,98,99,100,101,102,103,104,105,106,107,108,109,110,111,112,113,114,115,116,117,118,119,120,121,122,123,124,125,126,127,128,129,130,131,132,133,134].
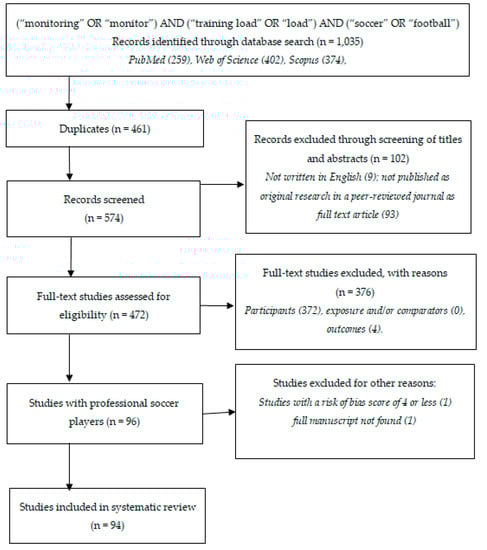
Figure 1.
Study selectionin a PRISMA flow diagram.
3.1. Characteristics of the Studies and Risk of Bias
The pooled sample size and age included 2066 participants aged 24 ± 3 years, being composed mostly of male athletes (95%). The average duration of the load monitoring interventions was 168 days (range: 1–1034). The athletes were all professional soccer players from first divisions (81%), second divisions (12%), or third divisions (1%), andnational teams (6%). A single study (1%) did not report the athletes’ level. Regarding the nationality of the soccer players, they were from England (16%), Spain (15%), Brazil (9%), Australia (7%), Portugal (7%), Netherlands (6%) Italy (6%), France (4%), Denmark (2%), Qatar (2%), Tunisia (2%), Russia (2%), Iran (2%), Austria (1%), Belgium (1%), Chile (1%), Colombia (1%), Czech Republic (1%), Germany (1%), Latvia (1%), Norway (1%), Singapore (1%), Switzerland (1%), and Wales (1%). Seven studies did not report the nationality of the athletes but reported the continent (Europe = 7%).
The average bias score for the studies was 6.6 (range: 4–8). Only one study had a high risk of bias, with a score ≤4 (see Table S1). There were 88 observational studies (i.e., 94%), with 82 prospective cohort studies [41,43,44,45,46,47,48,49,51,52,54,55,56,59,60,61,63,64,65,66,67,68,69,70,71,72,73,74,75,76,77,78,79,80,81,82,83,84,86,87,88,90,92,93,94,95,96,97,98,99,100,101,102,103,104,105,106,107,108,109,111,112,113,114,116,117,118,119,120,121,122,123,125,126,127,128,129,130,131,132,133,134], 3 retrospective cohort studies [85,110,115], 2 cross-sectional studies [50,62], and one diagnostic accuracy study [124]. There were six experimental studies (i.e., 6%), with three pre–post interventional studies [42,58,89], two cross-over randomized controlled trials [53,91], and one non-randomized trial [57] (see Table S2).
3.2. Main Findings
Most studies, i.e., 73%, did not report any veracity metric for all the identified parameters (n = 69). At least one veracity metric was reported in 18% of studies (n = 17), with a veracity metric for all parameters reported in 9% of studies (n = 8; see Figure 2). Thirty-nine different tools were used for load monitoring: electronic performance tracking systems (EPTS) = 64% (n = 60), rating of perceived exertion (RPE) = 48% (n = 45), heart rate monitoring (HR) = 29% (n = 27), countermovement jump test (CMJ) = 12% (n = 11), psychometric questionnaire with Likert scale = 12% (n = 11), blood samples = 6% (n = 6), maximal running test = 6% (n = 6), salivary imunoglobulina A (s-IgA) = 6% (n = 6), blood lactate concentration = 5% (n = 5), video-computerized systems = 5% (n = 5), watch = 5% (n = 5), body composition = 3% (n = 3), integrative tool of training load assessment = 3% (n = 3), repeated sprint ability = 3% (n = 3), salivary cortisol = 3% (n = 3), salivary testosterone = 3% (n = 3), submaximal running test = 3% (n = 3), sprint test = 3% (n = 3), anaerobic speed reserve = 2% (n = 2), creatine kinase (CK) = 2% (n = 2), maximal oxygen uptake = 2% (n = 2), Visual Analog Scale Questionnaire = 2% (n = 2), total quality recovery (TQR) = 2% (n = 2), training planning = 2% (n = 2), actigraphy = 1% (n = 1), blood ammonia concentration = 1% (n = 1), coach rating of performance = 1% (n = 1), Edinburgh Mental Well-being Scale = 1% (n = 1), infrared thermography = 1% (n = 1), isometric force testing = 1% (n = 1), Neuromuscular Efficiency Index = 1% (n = 1), oxidative stress = 1% (n = 1), Physical Activity Enjoyment Scale = 1% (n = 1), Profile of Mood State Questionnaire (POMS) = 1% (n = 1), RESTQ-Sport Scale = 1% (n = 1), sit-and-reach test = 1% (n = 1), squat jump test (SJ) = 1% (n = 1), tensiomyography = 1% (n = 1), and urine metabolomic = 1% (n = 1).
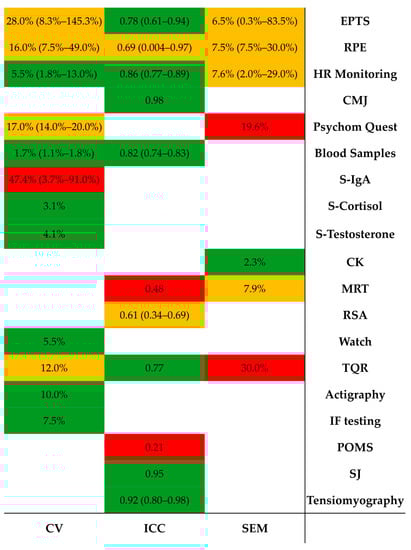
Figure 2.
Veracity metrics classifications.Median (minimum–maximum) and result (i.e., median) without range (i.e., minimum and maximum) because it was found just for one value (n = 1). Based on the current method, the respective reference values were used in this figure to determine the traffic-light systems (i.e., red, amber, or green). The median was used to determine the color, and blank cells are due to the lack of veracity metrics for that case. CV = coefficient of variation (standard deviation divided by the mean, expressed as a percentage, %); ICC = intraclass correlationcoefficient; SEM = standard error of measurement; EPTS = electronic performance tracking system; RPE = rating of perceived exertion; HR = heart rate; CMJ = countermovement jump; Psychom Quest = Psychometric Questionnaire with Likert scale; S-IgA = salivary imunoglobulina A; S-Cortisol = salivary cortisol; S-Testosterone = salivary testosterone; CK = creatine kinase; MRT = maximal running test; RSA = repeated sprint ability; TQR = total quality recovery; IF = isometric force; POMS = Profile of Mood State Questionnaire; SJ = squat jump; Watch = wristwatch.
A total of 578 parameters were used to monitor the load from these 39 tools. Data veracity was reported for 54% of the tools in at least one parameter, which resulted in 23% of these parameters. Thus, most studies did not report metrics of veracity for their tools and parameters (see details in Figure 2, Table 1 and Table S2). Specifically, Table S2 presents a summary of all the selected studies, with further information on study design (and duration), sample level (n; sex; age; country of sample), tools (brand and model or reference), accuracy reported by the company, and parameters as well as veracity analyses (metrics).

Table 1.
Veracity metrics ranking.
4. Discussion
The purpose of this systematic review is to evaluate data veracity for load monitoring in professional soccer. We describe here the metrics reported for tools and their associated parameters in a sample with 87% of athletes playing at top-level divisions or in their national teams. Thirty-nine different tools were found in the included studies; however, 73% of these studies did not report any veracity metric. Thus, data veracity was found for 54% of tools and 23% of associated parameters. Of note, some veracity metrics present a great variability in the obtained metrics. The SEM and MDC ratings were between 0.3–89.7% (good–poor) and 48.0–305.0%, respectively. The ICC ratings were between poor and excellent reliability levels (i.e., 0.004–0.98), with the CV ratings from poor to great (i.e., 1.1–193.5%). For the remaining metrics, the results were between 2.0–10.0% for bias, 4.0–22.0% for SEE, and 3.0–10.0% for precision. In addition, some tools were used without the required accuracy. All this information provides a precise state of the art regarding the potential of current monitoring tools to be used with Big Data approaches.
4.1. The Impact of Accuracy and CV on the Practical Application of Tools and Parameters
The need for reporting accuracy can be better understood following an example reported by the United Nations Industrial Development Organization [24]. Thus, in practical terms, if the accuracy of a tool is ±3, this means that if 100 would be the reading displayed on a tool during a measurement, then the actual value could be anywhere between 97 and 103, including 97 and 103. In this regard, it is important to note that some tools did not present the required accuracy for the experimental design performed in each study. For example, the accuracy of an infrared camera is ±2 °C, and the applied protocol in the study provided for changes in body temperature ranged between 0.3 and 1.5 °C [98]. Moreover, in EPTS with a sampling rate of 10 Hz, the accuracy for high accelerations (>4 m/s2) is compromised, which may have an impact on the interpretation of results [79] because of the poor estimation of instantaneous velocity when performing these very high accelerations (>4 m/s2) during player tracking in team sports [135]. Therefore, tools with inadequate accuracy for the required interventions need to improve their accuracy or else they willgenerate an input noise, thus compromising the outputs of a Big Data approach.
A common concern of sports scientists as well as strength and conditioning coaches of high-level soccer clubs when using monitoring tools refers to reliability, which is one of the main factors related to the discrepancy between the expected and actual effectiveness of monitoring, thus representing a potential barrier for successful interventions [136]. For this purpose, the classic classification of the CV is considered for the decision-making process: >30% = large, <30% and >10% = medium, and <10% = small [40]. In the present systematic review, extremely large CVs, such as 193.5% for sprinting at speeds ≥25.2 km/h, are measured with EPTS [129]. Moreover, 137% for the time between peak power and peak force during a CMJ [137] and 679% for the variance from mean bedtime assessed by Actigraphy [138] have been found in the scientific literature. Large CVs make it extremely difficult to detect the real differences between moments after an intervention unless these differences were also very large [139]. Therefore, caution should be taken when using parameters with a CV greater than 30%.
4.2. ICC and SEM Should Always Be Reported Together
The ICC is probably the most popular reliability metric in the literature. Our analysis showed that the ICC was often included as a reliability metric but with large variability, ranging from poor = 0.004 (i.e., strain from session-RPE) [131] to excellent = 0.98 (i.e., contraction time measured with tensiomyography or jump height of a CMJ) [57,131]. Particularly, in the case of tensiomyography, although there is sufficient data in favor of its good-to-excellent relative reliability in the scientific literature (i.e., ICC = 0.70–0.99) [140] in agreement with our findings (i.e., ICC = 0.80–0.98), more evidence is necessary for identifying the accuracy of this tool, according to a current systematic review with meta-analysis [141], mainly because reliability based only on the ICC cannot be recommended [142]. This is because there is a relationship between the ICC and between-subjects variability, where the heterogeneity of the subjects is a determinant for the ICC obtained [25]. An excellent ICC can mask poor trial-to-trial consistency when between-subjects variability is high. Conversely, a poor ICC can be found even when trial-to-trial variability is low when the between-subjects variability is low. In this case, the homogeneity of the subjects’ means will make it difficult to differentiate between subjects even though the absolute measurement error is small. In other words, if individuals differ little from each other, the ICC may be poor, even if the trial-to-trial variability is small [25]. Thus, an examination of the ICC in conjunction with the SEM is, therefore, recommended [142]. For example, anaverage HR, with ICC = 0.77 (good) and SEM = 3.0% (good), in one case [127] would be preferable than the same parameter with ICC = 0.89 (good) and SEM = 27% (poor) [124].
On the other hand, the SEM is not affected by between-subjects variability, as occurs with the ICC. The SEM has been used to define the boundaries in which a subject’s true score lies, and it can be calculated as both absolute and relative scores [25,26,37,38]. However, the range of variation of this veracity metric for the found parameters was high (i.e., between good = 0.3% for total distance covered, as measured with EPTS, and poor = 89.7% for accelerations >4 m/s2, measured with EPTS) [64,73]. This would suggest that for the same tool, some parameters could be more recommended than others. In this regard, some researchers are using a limit of 10% of the SEM to determine which parameters can be used in subsequent analyses [35,87,143]. Although its use is strongly recommended by the specialized literature [25,26], some points of confusion can be highlighted. The first is that it is called either standard error of measurement (SEM), typical error of measurement (TEM), or typical error (TE), even with the same form of calculation. The second point, which is most impactful, is that the SEM is commonly referred to as the coefficient of variation (CV) and reported as a percentage, but the calculation is not performed by dividing the standard deviation by the mean and subsequently multiplied by 100 [144]. These facts can easily drive researchers and practitioners to misinterpretations. Furthermore, the SEM can also be used in the interpretation of individual scores as the minimum difference (MD) or minimum detectable change (MDC) [25,26]. In the present study, the MDC ranged from 48.0% for the distance at maximal sprint speed recorded with EPTS to 305.0% for the very high-speed running time obtained with EPTS [76] with regards to the group average. This extremely high variability could hinder the verification of real changes in an individual’s performance. Of note, the MDC in professional soccer players is not easily found in scientific literature. Apart from the included study in the current systematic review, another study reported an MDC between 1.0% and 30.0% for performance in a new agility test [145]. Therefore, the SEM is highly recommended for determining the reliability of any tool and parameter, while its interpretation can be facilitated when reported in both relative and absolute terms.
4.3. Needs, Limitations, and Potential of Big Data in Professional Soccer
There is limited information regarding the last three metrics of veracity. Bias was reported as absolute values in only two studies [127,129], and, in one study, it was reported as relative values ranging between 2.0–10.0%, with the SEE ranging between 4.0–22.0% for total and sprint distances between 19.8–25.2 and above 25.2 km/h, recorded with EPTS [133]. Precision ranged between 3.0–10.0% for urine metabolomic parameters in a single study [128]. In view of the definition itself, these three metrics are important for appropriately understanding veracity. Therefore, more studies with the use of these metrics in professional soccer athletes are warranted as well as more studies with professional female soccer players, who represented only 5% of the samples in the included studies. Moreover, 94% of the included articles are observational studies, and among the experimental study designs, none were randomized controlled trials. Despite the difficulty of carrying out experimental studies in professional soccer settings, we suggest that more of these studies are warranted to increase the veracity of monitoring tools and their associated parameters. The approach applied in this systematic review is based on one of the 4 Vs of Big Data. However, the other Vs also have an impact on soccer and should be the focus of future research. In this regard, the volume that describes the magnitude of the data [14] and is usually measured in terabytes (i.e., 1012), petabytes (i.e., 1015), zettabytes (i.e., 1021), and even yottabytes (i.e., 1024) [15] has increased exponentially, with a 300-fold increase in the last 15 years, from 2005 to 2020, reaching 40 zettabytes (i.e., 37.3 trillion gigabytes; 109) [15]. Therefore, this unprecedented volume of data is overwhelming, thus increasing the risks of it not being fully used to inform the practice [13]. For example, a dataset from a Bundesliga season resulted in 400 gigabytes of tracking data [14]. Regarding this, variety refers to the heterogeneity of data, i.e., to different data formats and sources distinguished, which can be differentiated among structured (e.g., relational data), semi-structured, (e.g., XML data), and unstructured data (e.g., emails, pictures, videos, or social networking data) [14,15,16,17]. Thus, in soccer, data variety refers to position, video, fitness, training, skill performance, and health data [14]. Moreover, velocity describes the speed at which novel data is generated, processed, and analyzed [14,15,16,17]. Specifically for soccer, the velocity may vary between real-time streams from physiological and positional data to stored data tonotational analyses during training and competition [14]. All these three key concepts characterizing Big Data are highly relevant and should be considered with the suggestion by Lukoianova and Rubin [23], who have stated that Big Data can only have value when its veracity can be established and, thereby, the information quality confirmed.
To date, Big Data has been reported in the scientific literature of soccer in relation to tactical analysis only [14,146] but not in relation to load monitoring. Although data can be considered big based on the number of V2019s, there are no universal benchmarks for the number of Vs [14,15,16,17,18,21,22,23,146,147]. Therefore, the current systematic review establishes the initial basis for the implementation of Big Data approaches for load monitoring in professional soccer while identifying the strengths and limitations of the current evidence before moving on to the real applications of Big Data: data management, which involves processes and supporting technologies to acquire and store data and to prepare and retrieve it for analysis, and analytics, which refers to the techniques used to analyze and acquire intelligence from Big Data [146,147]).
Finally, we would like to make a brief statement and endorse an editorial on the current trend of having extreme positions in sportsscience, which is not recommended [148]. Thus, this review highlights the importance of data veracity analysis for objectively using tools and their associated parameters for load monitoring in professional soccer, considering equally traditional approaches and the forefront of technological advances.
5. Conclusions
In conclusion, a wide diversity of tools and parameters are used to monitor loads in elite professional soccer. However, it is not common to find data veracity for these tools and parameters in scientific literature. The reported veracity metrics will assist in the selection and use of the best monitoring tools and their associated parameters for load monitoring in professional soccer. Before looking for new tools and parameters, the current ones need to present adequate levels of data veracity (accuracy, reliability, and quality of data). Therefore, this information is warranted when aiming to use predictive analytics for structured Big Data in professional soccer.
Practical Applications
- The use of Big Data approaches without appropriate data veracity can undermine the precision of the predictive analytics models and generate fatal errors with a high economic cost;
- Up to the moment, data veracity is not commonly reported in scientific studies using tools and parameters for load monitoring in professional soccer;
- It is necessary to more frequently analyze and share data veracity to perform the best data management and analytics when applying Big Data.
Supplementary Materials
The following are available online at https://www.mdpi.com/article/10.3390/app11146479/s1, Table S1: Risk of bias score; Table S2: Summary of the selected studies. Reference [149] is cited in supplementary materials.
Author Contributions
Conceptualization, J.G.C., C.A.C.F., D.B., and J.C.S.; methodology, J.G.C., C.A.C.F., D.B., A.L.-A., G.R.C., R.L.d.S.G., R.d.S.G., F.M.V., A.L.C.A., S.D.R., and J.C.S.; formal analysis, J.G.C., C.A.C.F., D.B., A.L.-A., G.R.C., R.L.d.S.G., R.d.S.G., F.M.V., A.L.C.A., S.D.R., J.A., and J.C.S.; writing—original draft preparation, J.G.C., C.A.C.F., D.B., A.L.-A., G.R.C., R.L.d.S.G., R.d.S.G., F.M.V., A.L.C.A., S.D.R., J.A., and J.C.S.; writing—review and editing, J.G.C., C.A.C.F., D.B., A.L.-A., S.D.R., J.A., and J.C.S.; supervision, J.C.S. All authors have read and agreed to the published version of the manuscript.
Funding
This research received no external funding.
Institutional Review Board Statement
Not applicable.
Informed Consent Statement
Not applicable.
Data Availability Statement
After publication, all data necessary to understand and assess the conclusions of the manuscript are available to any reader of Applied Sciences.
Acknowledgments
We would like to thank the “Coordenação de Aperfeiçoamento de Pessoal de Nível Superior/ Programa de ExcelênciaAcadêmica” (CAPES/PROEX).
Conflicts of Interest
The authors declare no conflict of interest.
References
- Jaspers, A.; Brink, M.S.; Probst, S.G.M.; Frencken, W.G.P.; Helsen, W.F. Relationships between training load indicators and training outcomes in professional soccer. Sports Med. 2017, 47, 533–544. [Google Scholar] [CrossRef]
- Boullosa, D.; Casado, A.; Claudino, J.G.; Jiménez-Reyes, P.; Ravé, G.; Castaño-Zambudio, A.; Lima-Alves, A.; de Oliveira, S.A.J.; Dupont, G.; Granacher, U.; et al. Do you play or do you train? Insights from individual sports for training load and injury risk management in team sports based on individualization. Front. Physiol. 2020, 11, 995. [Google Scholar] [CrossRef]
- Ekstrand, J.; Waldén, M.; Hägglund, M. Hamstring injuries have increased by 4% annually in men’s professional football, since 2001: A 13-year longitudinal analysis of the UEFA Elite Club injury study. Br. J. Sports Med. 2016, 50, 731–737. [Google Scholar] [CrossRef]
- Barnes, C.; Archer, D.T.; Hogg, B.; Bush, M.; Bradley, P.S. The evolution of physical and technical performance parameters in the english premier league. Int. J. Sports Med. 2014, 35, 1095–1100. [Google Scholar] [CrossRef]
- Haugen, T.A.; Tønnessen, E.; Hem, E.; Leirstein, S.; Seiler, S. VO2max characteristics of elite female soccer players, 1989–2007. Int. J. Sports Physiol. Perform. 2014, 9, 515–521. [Google Scholar] [CrossRef] [PubMed]
- Tønnessen, E.; Hem, E.; Leirstein, S.; Haugen, T.; Seiler, S. Maximal aerobic power characteristics of male professional soccer players, 1989–2012. Int. J. Sports Physiol. Perform. 2013, 8, 323–329. [Google Scholar] [CrossRef] [PubMed]
- Alves, A.L.; Garcia, E.S.; Morandi, R.F.; Claudino, J.G.; Pimenta, E.M.; Soares, D.D. Individual analysis of creatine kinase concentration in Brazilian elite soccer players. Rev. Bras. Med. Esporte 2015, 21, 112–116. [Google Scholar] [CrossRef][Green Version]
- Stølen, T.; Chamari, K.; Castagna, C.; Wisløff, U. Physiology of soccer: An update. Sports Med. 2005, 35, 501–536. [Google Scholar] [CrossRef] [PubMed]
- Moreira, A.; Bradley, P.; Carling, C.; Arruda, A.; Spigolon, L.M.P.; Franciscon, C.; Aoki, M.S. Effect of a congested match schedule on immune-endocrine responses, technical performance and session-RPE in elite youth soccer players. J. Sports Sci. 2016, 34, 2255–2261. [Google Scholar] [CrossRef] [PubMed]
- Bourdon, P.C.; Cardinale, M.; Murray, A.; Gastin, P.; Kellmann, M.; Varley, M.; Gabbett, T.J.; Coutts, A.J.; Burgess, D.J.; Gregson, W.; et al. Monitoring athlete training loads: Consensus statement. Int. J. Sports Physiol. Perform. 2017, 12, S2–S161. [Google Scholar] [CrossRef] [PubMed]
- Claudino, J.G.; Capanema, D.D.O.; De Souza, T.V.; Serrão, J.C.; Pereira, A.C.M.; Nassis, G.P. Current approaches to the use of artificial intelligence for injury risk assessment and performance prediction in team sports: A systematic review. Sports Med. Open 2019, 5, 28. [Google Scholar] [CrossRef] [PubMed]
- Düking, P.; Achtzehn, S.; Holmberg, H.-C.; Sperlich, B. Integrated Framework of Load Monitoring by a Combination of smartphone applications, wearables and point-of-care testing provides feedback that allows individual responsive adjustments to activities of daily living. Sensors 2018, 18, 1632. [Google Scholar] [CrossRef] [PubMed]
- Passfield, L.; Hopker, J.G. A mine of information: Can sports analytics provide wisdom from your data? Int. J. Sports PhysiolPerform. 2017, 12, 851–855. [Google Scholar] [CrossRef] [PubMed]
- Rein, R.; Memmert, D. Big data and tactical analysis in elite soccer: Future challenges and opportunities for sports science. SpringerPlus 2016, 5, 1410. [Google Scholar] [CrossRef] [PubMed]
- IBM. The Four V’s of Big Data. Available online: https://www.ibmbigdatahub.com/infographic/four-vs-big-data (accessed on 9 August 2020).
- Ristevski, B.; Chen, M. Big Data Analytics in Medicine and Healthcare. J. Integr. Bioinform. 2018, 15. [Google Scholar] [CrossRef]
- Kalid, N.; Zaidan, A.A.; Zaidan, B.B.; Salman, O.; Hashim, M.; Muzammil, H. Based Real Time Remote Health Monitoring Systems: A Review on Patients Prioritization and Related “Big Data” Using Body Sensors information and Communication Technology. J. Med Syst. 2017, 42, 30. [Google Scholar] [CrossRef]
- Reimer, A.; A Madigan, E. Veracity in big data: How good is good enough. Health Inform. J. 2019, 25, 1290–1298. [Google Scholar] [CrossRef]
- Moher, D.; Liberati, A.; Tetzlaff, J.; Altman, D.G.; The PRISMA Group. Preferred reporting items for systematic reviews and meta-analyses: The PRISMA statement. PLoS Med. 2009, 6, e1000097. [Google Scholar] [CrossRef]
- Saw, A.E.; Main, L.C.; Gastin, P.B. Monitoring the athlete training response: Subjective self-reported measures trump commonly used objective measures: A systematic review. Br. J. Sports Med. 2016, 50, 281–291. [Google Scholar] [CrossRef] [PubMed]
- Ramachandramurthy, S.; Subramaniam, S.; Ramasamy, C. Distilling Big Data: Refining quality information in the Era of Yottabytes. Sci. World J. 2015, 2015, 453597. [Google Scholar] [CrossRef] [PubMed]
- Bellazzi, R. Big data and biomedical informatics: A challenging opportunity. Yearb. Med. Inform. 2014, 23, 8–13. [Google Scholar] [CrossRef] [PubMed]
- Lukoianova, T.; Rubin, V.L.; Vashchilko, T. Veracity Roadmap: Is big data objective, truthful and credible? Adv. Classif. Res. Online 2014, 24, 4. [Google Scholar] [CrossRef]
- United Nations Industrial Development Organization (UNIDO). Role of Measurement and Calibration in the Manufacture of Products for the Global Market: A Guide for Small and Medium-Sized Enterprises. Available online: https://www.unido.org/sites/default/files/2009-04/Role_of_measurement_and_calibration_0.pdf (accessed on 9 August 2020).
- Weir, J.P. Quantifying test-retest reliability using the intraclass correlation coefficient and the sem. J. Strength Cond. Res. 2005, 19, 231–240. [Google Scholar] [CrossRef]
- Hopkins, W.G. Measures of reliability in sports medicine and science. Sports Med. 2000, 30, 1–15. [Google Scholar] [CrossRef]
- Tanner, R.K.; Gore, C.J. Quality assurance in australian exercise-physiology laboratories—In quest of excellence. Int. J. Sports Physiol. Perform. 2006, 1, 58–60. [Google Scholar] [CrossRef]
- Charter, R.A. Revisiting the standard errors of measurement, estimate, and prediction and their application to test scores. Percept. Mot. Ski. 1996, 82, 1139–1144. [Google Scholar] [CrossRef]
- Farrance, I.; Frenkel, R. Uncertainty of measurement: A review of the rules for calculating uncertainty components through functional relationships. Clin. Biochem. Rev. 2012, 33, 49–75. [Google Scholar]
- Currell, K.; Jeukendrup, A.E. Validity, reliability and sensitivity of measures of sporting performance. Sports Med. 2008, 38, 297–316. [Google Scholar] [CrossRef]
- Sokal, R.R.; Braumann, C.A. Significance tests for coefficients of variation and variability profiles. Syst. Zool. 1980, 29, 50–66. [Google Scholar] [CrossRef]
- Hopkins, W.G. A New View of Statistics. 1997. Available online: http://www.sportsci.org/resource/stats/effectmag.html (accessed on 7 May 2021).
- Dugdale, J.H.; Sanders, D.; Hunter, A.M. Reliability of change of direction and agility assessments in youth soccer players. Sports 2020, 8, 51. [Google Scholar] [CrossRef]
- McInnes, S.; Carlson, J.; Jones, C.; McKenna, M.; McInnes, S.; Carlson, J.; Jones, C.; McKenna, M. The physiological load imposed on basketball players during competition. J. Sports Sci. 1995, 13, 387–397. [Google Scholar] [CrossRef]
- Duthie, G.; Pyne, D.; Hooper, S. The reliability of video based time motion analysis. J. Hum. Mov. Stud. 2003, 44, 259–271. [Google Scholar]
- Delaney, J.A.; Cummins, C.J.; Thornton, H.; Duthie, G. Importance, Reliability, and Usefulness of Acceleration Measures in Team Sports. J. Strength Cond. Res. 2018, 32, 3485–3493. [Google Scholar] [CrossRef] [PubMed]
- Patterson, C.H. The Interpretation of the Standard Error of Measurement. J. Exp. Educ. 1955, 23, 247–252. [Google Scholar] [CrossRef]
- Harvill, L.M. Standard error of measurement. Educ. Meas. 1991, 10, 33–41. [Google Scholar] [CrossRef]
- Koo, T.K.; Li, M.Y. A Guideline of Selecting and Reporting Intraclass Correlation Coefficients for Reliability Research. J. Chiropr. Med. 2016, 15, 155–163. [Google Scholar] [CrossRef] [PubMed]
- Lande, R. On comparing coefficients of variation. Syst. Zool. 1977, 26, 214–217. [Google Scholar] [CrossRef]
- Little, T.; Williams, A.G. Measures of exercise intensity during soccer training drills with professional soccer players. J. Strength Cond. Res. 2007, 21, 367–371. [Google Scholar] [CrossRef]
- Moreira, A.; Arsati, F.; Cury, P.R.; Franciscon, C.; de Oliveira, P.; Araújo, V. Salivary Immunoglobulin A Response to a Match in Top-Level Brazilian Soccer Players. J. Strength Cond. Res. 2009, 23, 1968–1973. [Google Scholar] [CrossRef]
- Gomez-Piriz, P.T.; Reyes, P.J.; Ruiz-Ruiz, C. Relation Between Total Body Load and Session Rating of Perceived Exertion in Professional Soccer Players. J. Strength Cond. Res. 2011, 25, 2100–2103. [Google Scholar] [CrossRef]
- Akubat, I.; Patel, E.; Barrett, S.; Abt, G. Methods of monitoring the training and match load and their relationship to changes in fitness in professional youth soccer players. J. Sports Sci. 2012, 30, 1473–1480. [Google Scholar] [CrossRef]
- Bara-Filho, M.G.; Freitas, D.S.; Moreira, D.; Matta, M.D.O.; De Lima, J.R.P.; Nakamura, F.Y. Heart rate variability and soccer training: A case study. Motriz Revista Educação Física 2013, 19, 171–177. [Google Scholar] [CrossRef]
- Heisterberg, M.F.; Fahrenkrug, J.; Krustrup, P.; Storskov, A.; Kjær, M.; Andersen, J.L. Extensive Monitoring Through Multiple Blood Samples in Professional Soccer Players. J. Strength Cond. Res. 2013, 27, 1260–1271. [Google Scholar] [CrossRef] [PubMed]
- Bujnovsky, D.; Maly, T.; Zahalka, F.; Mala, L. Analysis of physical load among professional soccer players during matches with respect to field position. J. Phys. Educ. Sport 2015, 15, 569–576. [Google Scholar]
- Gaudino, P.; Iaia, F.M.; Strudwick, A.J.; Hawkins, R.D.; Alberti, G.; Atkinson, G.; Gregson, W. Factors Influencing Perception of Effort (Session Rating of Perceived Exertion) during Elite Soccer Training. Int. J. Sports Physiol. Perform. 2015, 10, 860–864. [Google Scholar] [CrossRef] [PubMed]
- Arcos, A.L.; Martinez-Santos, R.; Yanci, J.; Mendiguchia, J.; Méndez-Villanueva, A. Negative Associations between Perceived Training Load, Volume and Changes in Physical Fitness in Professional Soccer Players. J. Sports Sci. Med. 2015, 14, 394–401. [Google Scholar]
- Morcillo, J.A.; Reyes, P.J.; Cuadrado-Peñafiel, V.; Lozano, E.; Ortega-Becerra, M.; Párraga, J. Relationships Between Repeated Sprint Ability, Mechanical Parameters, and Blood Metabolites in Professional Soccer Players. J. Strength Cond. Res. 2015, 29, 1673–1682. [Google Scholar] [CrossRef]
- Morgans, R.; Owen, A.; Doran, D.; Drust, B.; Morton, J.P. Prematch Salivary Secretory Immunoglobulin A in Soccer Players from the 2014 World Cup Qualifying Campaign. Int. J. Sports Physiol. Perform. 2015, 10, 401–403. [Google Scholar] [CrossRef]
- Thorpe, R.T.; Strudwick, A.J.; Buchheit, M.; Atkinson, G.; Drust, B.; Gregson, W. Monitoring Fatigue During the In-Season Competitive Phase in Elite Soccer Players. Int. J. Sports Physiol. Perform. 2015, 10, 958–964. [Google Scholar] [CrossRef]
- Torres-Ronda, L.; Gonçalves, B.; Marcelino, R.; Torrents, C.; Vicente, E.; Sampaio, J. Heart Rate, Time-Motion, and Body Impacts When Changing the Number of Teammates and Opponents in Soccer Small-Sided Games. J. Strength Cond. Res. 2015, 29, 2723–2730. [Google Scholar] [CrossRef]
- Buchheit, M.; Cholley, Y.; Lambert, P. Psychometric and Physiological Responses to a Preseason Competitive Camp in the Heat With a 6-Hour Time Difference in Elite Soccer Players. Int. J. Sports Physiol. Perform. 2016, 11, 176–181. [Google Scholar] [CrossRef] [PubMed]
- Coelho, D.B.; Cabido, C.E.T.; Ciminelli, V.A.L.; Coelho, L.G.M.; Becker, L.K.; De Oliveira, E.C.; Pereira, E.R.; Marins, J.C.B.; Garcia, E.S. Comparison of different ways of expressing creatine kinase concentration of soccer players during a competitive season. Motriz Revista Educação Física 2016, 22, 160–165. [Google Scholar] [CrossRef][Green Version]
- Ehrmann, F.E.; Duncan, C.S.; Sindhusake, D.; Franzsen, W.N.; Greene, D. GPS and Injury Prevention in Professional Soccer. J. Strength Cond. Res. 2016, 30, 360–367. [Google Scholar] [CrossRef]
- García-García, O.; Serrano-Gómez, V.; Hernández-Mendo, A.; Tapia-Flores, A. Assessment of the in-season changes in mechanical and neuromuscular characteristics in professional soccer players. J. Sports Med. Phys. Fit. 2015, 56, 714–723. [Google Scholar]
- Maya, J.; Marquez, P.; Peñailillo, L.; Contreras-Ferrat, A.; Deldicque, L.; Zbinden-Foncea, H. Salivary Biomarker Responses to Two Final Matches in Women’s Professional Football. J. Sports Sci. Med. 2016, 15, 365–371. [Google Scholar] [PubMed]
- Moalla, W.; Fessi, M.S.; Farhat, F.; Nouira, S.; Wong, D.P.; Dupont, G. Relationship between daily training load and psychometric status of professional soccer players. Res. Sports Med. 2016, 24, 387–394. [Google Scholar] [CrossRef]
- Owen, A.L.; Wong del, P.; Dunlop, G.; Groussard, C.; Kebsi, W.; Dellal, A.; Morgans, R.; Zouhal, H. High-intensity training and salivary immunoglobulin A responses in professional top-level soccer players: Effect of training intensity. J. Strength Cond. Res. 2016, 30, 2460–2469. [Google Scholar] [CrossRef]
- Rago, V.; Leo, I.; Pizzuto, F.; Costa, J.; Angeicchio, G.; Tafuri, D.; Raiola, G. Variation of oxidative stress of elite football players during pre-season and in- season. J. Phys. Educ. Sport 2016, 16, 326–329. [Google Scholar]
- Romagnoli, M.; Sanchis-Gomar, F.; Alis, R.; Risso-Ballester, J.; Bosio, A.; Graziani, R.L.; Rampinini, E. Changes in muscle damage, inflammation, and fatigue-related parameters in young elite soccer players after a match. J. Sports Med. Phys. Fit. 2015, 56, 1198–1205. [Google Scholar]
- Bacon, C.S.; Mauger, A.R. Prediction of Overuse Injuries in Professional U18-U21 Footballers Using Metrics of Training Distance and Intensity. J. Strength Cond. Res. 2017, 31, 3067–3076. [Google Scholar] [CrossRef]
- Barrett, S. Monitoring Elite Soccer Players’ External Loads Using Real-Time Data. Int. J. Sports Physiol. Perform. 2017, 12, 1285–1287. [Google Scholar] [CrossRef]
- Clemente, F.M.; Mendes, B.; Nikolaidis, P.; Calvete, F.; Carriço, S.; Owen, A.L. Internal training load and its longitudinal relationship with seasonal player wellness in elite professional soccer. Physiol. Behav. 2017, 179, 262–267. [Google Scholar] [CrossRef]
- Los Arcos, A.; Martínez-Santos, R.; Yanci, J.; Mendez-Villanueva, A. Monitoring perceived respiratory and muscular exertions and physical fitness in young professional soccer players during a 32-week period. Kinesiology 2017, 49, 153–160. [Google Scholar] [CrossRef]
- Mara, J.; Thompson, K.G.; Pumpa, K.L.; Morgan, S. Quantifying the High-Speed Running and Sprinting Profiles of Elite Female Soccer Players during Competitive Matches Using an Optical Player Tracking System. J. Strength Cond. Res. 2017, 31, 1500–1508. [Google Scholar] [CrossRef]
- Muñoz-López, A.; Cruz, B.; Naranjo, J. TOM-Scale: A new method to programme training sessions loads in football. Arch. Med. Deporte 2017, 34, 280–286. [Google Scholar]
- Owen, A.L.; Djaoui, L.; Newton, M.; Malone, S.; Mendes, B. A contemporary multi-modal mechanical approach to training monitoring in elite professional soccer. Sci. Med. Footb. 2017, 1, 216–221. [Google Scholar] [CrossRef]
- Owen, A.L.; Lago-Peñas, C.; Gómez, M.Á.; Mendes, B.; Dellal, A. Analysis of a training mesocycle and positional quantification in elite European soccer players. Int. J. Sports Sci. Coach. 2017, 12, 665–676. [Google Scholar] [CrossRef]
- Rowell, A.E.; Aughey, R.J.; Hopkins, W.G.; Stewart, A.M.; Cormack, S.J. Identification of Sensitive Measures of Recovery after External Load from Football Match Play. Int. J. Sports Physiol. Perform. 2017, 12, 969–976. [Google Scholar] [CrossRef] [PubMed]
- Abbott, W.; Brickley, G.; Smeeton, N. An individual approach to monitoring locomotive training load in English Premier League academy soccer players. Int. J. Sports Sci. Coach. 2018, 13, 421–428. [Google Scholar] [CrossRef]
- Al Haddad, H.; Méndez-Villanueva, A.; Torreño, N.; Munguía-Izquierdo, D.; Suárez-Arrones, L. Variability of GPS-derived running performance during official matches in elite professional soccer players. J. Sports Med. Phys. Fit. 2018, 58, 1439–1445. [Google Scholar]
- Barrett, S.; McLaren, S.; Spears, I.; Ward, P.; Weston, M. The Influence of Playing Position and Contextual Factors on Soccer Players’ Match Differential Ratings of Perceived Exertion: A Preliminary Investigation. Sports 2018, 6, 13. [Google Scholar] [CrossRef]
- Bendala, F.J.T.; Vázquez, M.A.C.; Suarez-Arrones, L.J.; Sánchez, F.J.N. Comparison of external load in high speed actions between friendly matches and training sessions. Retos 2018, 33, 54–57. [Google Scholar]
- Fitzpatrick, J.F.; Hicks, K.; Hayes, P. Dose–Response Relationship Between Training Load and Changes in Aerobic Fitness in Professional Youth Soccer Players. Int. J. Sports Physiol. Perform. 2018, 13, 1365–1370. [Google Scholar] [CrossRef] [PubMed]
- Casamichana-Gómez, D.; Gómez-Díaz, A.J.; Cos Morera, F.; Martín-García, A. Wildcard players during positional games. Apunts 2018, 133, 85–97. [Google Scholar]
- Jaspers, A.; De Beéck, T.O.; Brink, M.S.; Frencken, W.G.; Staes, F.; Davis, J.; Helsen, W.F. Relationships Between the External and Internal Training Load in Professional Soccer: What Can We Learn From Machine Learning? Int. J. Sports Physiol. Perform. 2018, 13, 625–630. [Google Scholar] [CrossRef]
- Jaspers, A.; Kuyvenhoven, J.P.; Staes, F.; Frencken, W.G.P.; Helsen, W.F.; Brink, M.S. Examination of the external and internal load indicators’ association with overuse injuries in professional soccer players. J. Sci. Med. Sport 2018, 21, 579–585. [Google Scholar] [CrossRef]
- Lacome, M.; Simpson, B.; Broad, N.; Buchheit, M. Monitoring Players’ Readiness Using Predicted Heart-Rate Responses to Soccer Drills. Int. J. Sports Physiol. Perform. 2018, 13, 1273–1280. [Google Scholar] [CrossRef]
- Malone, S.; Mendes, B.; Hughes, B.; Roe, M.; Devenney, S.; Collins, K.; Owen, A. Decrements in Neuromuscular Performance and Increases in Creatine Kinase Impact Training Outputs in Elite Soccer Players. J. Strength Cond. Res. 2018, 32, 1342–1351. [Google Scholar] [CrossRef]
- Malone, J.J.; Jaspers, A.; Helsen, W.F.; Merks, B.; Frencken, W.G.; Brink, M.S. Seasonal Training Load and Wellness Monitoring in a Professional Soccer Goalkeeper. Int. J. Sports Physiol. Perform. 2018, 13, 672–675. [Google Scholar] [CrossRef]
- Malone, S.; Owen, A.; Newton, M.; Mendes, B.; Tiernan, L.; Hughes, B.; Collins, K. Wellbeing perception and the impact on external training output among elite soccer players. J. Sci. Med. Sport 2018, 21, 29–34. [Google Scholar] [CrossRef]
- McCall, A.; Jones, M.; Gelis, L.; Duncan, C.; Ehrmann, F.; Dupont, G.; Duffield, R. Monitoring loads and non-contact injury during the transition from club to National team prior to an international football tournament: A case study of the 2014 FIFA World Cup and 2015 Asia Cup. J. Sci. Med. Sport 2018, 21, 800–804. [Google Scholar] [CrossRef]
- Osorio, J.J.; A Méndez, E.; Aguirre-Acevedo, D.; Osorio-Ciro, J.; Calderón, J.C.; Gallo-Villegas, J. Creatine Phosphokinase and Urea as Biochemical Markers of Muscle Injuries in Professional Football Players. Asian J. Sports Med. 2018, 9, 60386. [Google Scholar] [CrossRef]
- Owen, A.L.; Morgans, R.; Kavanagh, R.; Djaoui, L. Salivary IgA and pre-training wellness status across an international soccer qualifying and finals campaign (Euro 2016). Int. J. Sports Sci. Coach. 2018, 13, 794–803. [Google Scholar] [CrossRef]
- Rowell, A.E.; Aughey, R.J.; Clubb, J.; Cormack, S.J. A Standardized Small Sided Game Can Be Used to Monitor Neuromuscular Fatigue in Professional A-League Football Players. Front. Physiol. 2018, 9, 1011. [Google Scholar] [CrossRef] [PubMed]
- Rowell, A.E.; Aughey, R.J.; Hopkins, W.G.; Esmaeili, A.; Lazarus, B.H.; Cormack, S. Effects of Training and Competition Load on Neuromuscular Recovery, Testosterone, Cortisol, and Match Performance During a Season of Professional Football. Front. Physiol. 2018, 9, 668. [Google Scholar] [CrossRef] [PubMed]
- Selmi, O.; Gonçalves, B.; Ouergui, I.; Sampaio, J.; Bouassida, A. Influence of well-being variables and recovery state in physical enjoyment of professional soccer players during small-sided games. Res. Sports Med. 2018, 26, 199–210. [Google Scholar] [CrossRef] [PubMed]
- Silva, P.; Dos Santos, E.; Grishin, M.; Rocha, J.M. Validity of Heart Rate-Based Indices to Measure Training Load and Intensity in Elite Football Players. J. Strength Cond. Res. 2018, 32, 2340–2347. [Google Scholar] [CrossRef] [PubMed]
- Tang, R.; Murtagh, C.; Warrington, G.; Cable, T.; Morgan, O.; O’Boyle, A.; Burgess, D.; Morgans, R.; Drust, B. Directional Change Mediates the Physiological Response to High-Intensity Shuttle Running in Professional Soccer Players. Sports 2018, 6, 39. [Google Scholar] [CrossRef]
- Vigh-Larsen, J.F.; Dalgas, U.; Andersen, T.B. Position-Specific Acceleration and Deceleration Profiles in Elite Youth and Senior Soccer Players. J. Strength Cond. Res. 2018, 32, 1114–1122. [Google Scholar] [CrossRef] [PubMed]
- Abbott, W.; Brownlee, T.E.; Harper, L.D.; Naughton, R.J.; Richardson, A.; Clifford, T. A season long investigation into the effects of injury, match selection and training load on mental wellbeing in professional under 23 soccer players: A team case study. Eur. J. Sport Sci. 2019, 19, 1250–1256. [Google Scholar] [CrossRef]
- Clemente, F.M.; Seerden, G.; van der Linden, C.M. Quantifying the physical loading of five weeks of pre-season training in professional soccer teams from Dutch and Portuguese leagues. Physiol. Behav. 2019, 209, 112588. [Google Scholar] [CrossRef]
- Clemente, F.M.; Rabbani, A.; Conte, D.; Castillo, D.; Afonso, J.; Clark, C.C.T.; Nikolaidis, P.T.; Rosemann, T.; Knechtle, B. Training/Match External Load Ratios in Professional Soccer Players: A Full-Season Study. Int. J. Environ. Res. Public Health 2019, 16, 3057. [Google Scholar] [CrossRef] [PubMed]
- Constantine, E.; Taberner, M.; Richter, C.; Willett, M.; Cohen, D.D. Isometric Posterior Chain Peak Force Recovery Response Following Match-Play in Elite Youth Soccer Players: Associations with Relative Posterior Chain Strength. Sports 2019, 7, 218. [Google Scholar] [CrossRef] [PubMed]
- Coppalle, S.; Rave, G.; Ben Abderrahman, A.; Ali, A.; Salhi, I.; Zouita, S.; Zouita, A.; Brughelli, M.; Granacher, U.; Zouhal, H. Relationship of Pre-season Training Load With In-Season Biochemical Markers, Injuries and Performance in Professional Soccer Players. Front. Physiol. 2019, 10, 409. [Google Scholar] [CrossRef] [PubMed]
- Côrte, A.C.; Pedrinelli, A.; Marttos, A.; Souza, I.F.G.; Grava, J.; Hernandez, A.J. Infrared thermography study as a complementary method of screening and prevention of muscle injuries: Pilot study. BMJ Open Sport Exerc. Med. 2019, 5, e000431. [Google Scholar] [CrossRef]
- Costa, J.; Figueiredo, P.; Nakamura, F.; Rago, V.; Rebelo, A.; Brito, J. Intra-individual variability of sleep and nocturnal cardiac autonomic activity in elite female soccer players during an international tournament. PLoS ONE 2019, 14, e0218635. [Google Scholar] [CrossRef]
- Figueiredo, P.; Nassis, G.P.; Brito, J. Within-Subject Correlation Between Salivary IgA and Measures of Training Load in Elite Football Players. Int. J. Sports Physiol. Perform. 2019, 14, 847–849. [Google Scholar] [CrossRef]
- Geurkink, Y.; Vandewiele, G.; Lievens, M.; De Turck, F.; Ongenae, F.; Matthys, S.P.; Boone, J.; Bourgois, J.G. Modeling the Prediction of the Session Rating of Perceived Exertion in Soccer: Unraveling the Puzzle of Predictive Indicators. Int. J. Sports Physiol. Perform. 2019, 14, 841–846. [Google Scholar] [CrossRef]
- Grünbichler, J.; Federolf, P.; Gatterer, H. Workload efficiency as a new tool to describe external and internal competitive match load of a professional soccer team: A descriptive study on the relationship between pre-game training loads and relative match load. Eur. J. Sport Sci. 2020, 20, 1034–1041. [Google Scholar] [CrossRef]
- Haller, N.; Ehlert, T.; Schmidt, S.; Ochmann, D.; Sterzing, B.; Grus, F.; Simon, P. Circulating, Cell-Free DNA for Monitoring Player Load in Professional Football. Int. J. Sports Physiol. Perform. 2019, 14, 718–726. [Google Scholar] [CrossRef]
- Izzo, R.; Giovannelli, M.; Raiola, G. Training load in elite goalkeepers with K-Track for monitoring performance. J. Phys. Educ. Sport 2019, 19, 1890–1896. [Google Scholar]
- De Beéck, T.O.; Jaspers, A.; Brink, M.S.; Frencken, W.G.; Staes, F.; Davis, J.; Helsen, W.F. Predicting Future Perceived Wellness in Professional Soccer: The Role of Preceding Load and Wellness. Int. J. Sports Physiol. Perform. 2019, 14, 1074–1080. [Google Scholar] [CrossRef] [PubMed]
- Jatene, P.; Pereira, G.B.; Chaperuto, É.C.; Fukushima, A.R.; Doro, M. Training sessions’ RPE in professional football is influenced by playing position. J. Phys. Educ. Sport 2019, 19, 1398–1406. [Google Scholar]
- Lee, M.; Mukherjee, S. Relationship of Training Load with High-intensity Running in Professional Soccer Players. Endoscopic 2019, 40, 336–343. [Google Scholar] [CrossRef] [PubMed]
- Morales, J.; Roman, V.; Yáñez, A.; Solana-Tramunt, M.; Álamo, J.; Fíguls, A. Physiological and Psychological Changes at the End of the Soccer Season in Elite Female Athletes. J. Hum. Kinet. 2019, 66, 99–109. [Google Scholar] [CrossRef] [PubMed]
- Moreno-Pérez, V.; Malone, S.; Sala-Pérez, L.; Lapuente-Sagarra, M.; Campos-Vazquez, M.A.; Del Coso, J. Activity monitoring in professional soccer goalkeepers during training and match play. Int. J. Perform. Anal. Sport 2019, 20, 19–30. [Google Scholar] [CrossRef]
- Noor, D.; McCall, A.; Jones, M.; Duncan, C.; Ehrmann, F.; Meyer, T.; Duffield, R. Transitioning from club to national teams: Training and match load profiles of international footballers. J. Sci. Med. Sport 2019, 22, 948–954. [Google Scholar] [CrossRef]
- Rabbani, A.; Kargarfard, M.; Castagna, C.; Clemente, F.M.; Twist, C. Associations Between Selected Training-Stress Measures and Fitness Changes in Male Soccer Players. Int. J. Sports Physiol. Perform. 2019, 14, 1050–1057. [Google Scholar] [CrossRef]
- Rabbani, A.; Clemente, F.M.; Kargarfard, M.; Chamari, K. Match Fatigue Time-Course Assessment Over Four Days: Usefulness of the Hooper Index and Heart Rate Variability in Professional Soccer Players. Front. Physiol. 2019, 10, 109. [Google Scholar] [CrossRef]
- Rago, V.; Silva, J.; Mohr, M.; Barreira, D.; Krustrup, P.; Rebelo, A.N. Variability of activity profile during medium-sided games in professional soccer. J. Sports Med. Phys. Fit. 2019, 59, 547–554. [Google Scholar] [CrossRef]
- Rossi, A.; Perri, E.; Pappalardo, L.; Cintia, P.; Iaia, F.M. Relationship between External and Internal Workloads in Elite Soccer Players: Comparison between Rate of Perceived Exertion and Training Load. Appl. Sci. 2019, 9, 5174. [Google Scholar] [CrossRef]
- Sangnier, S.; Cotte, T.; Brachet, O.; Coquart, J.; Tourny, C. Planning Training Workload in Football Using Small-Sided Games’ Density. J. Strength Cond. Res. 2019, 33, 2801–2811. [Google Scholar] [CrossRef]
- Bowen, L.; Gross, A.S.; Gimpel, M.; Bruce-Low, S.; Li, F.-X. Spikes in acute:chronic workload ratio (ACWR) associated with a 5–7 times greater injury rate in English Premier League football players: A comprehensive 3-year study. Br. J. Sports Med. 2020, 54, 731–738. [Google Scholar] [CrossRef]
- Clemente, F.M.; Silva, R.; Castillo, D.; Arcos, A.L.; Mendes, B.; Afonso, J. Weekly Load Variations of Distance-Based Variables in Professional Soccer Players: A Full-Season Study. Int. J. Environ. Res. Public Health 2020, 17, 3300. [Google Scholar] [CrossRef] [PubMed]
- Enes, A.; Oneda, G.; Alves, D.L.; Palumbo, D.D.P.; Cruz, R.; Junior, J.V.M.M.; Novack, L.F.; Osiecki, R. Determinant Factors of the Match-Based Internal Load in Elite Soccer Players. Res. Q. Exerc. Sport 2021, 92, 63–70. [Google Scholar] [CrossRef] [PubMed]
- Gonçalves, L.; Kalva-Filho, C.; Nakamura, F.; Rago, V.; Afonso, J.; Bedo, B.; Aquino, R. Effects of Match-Related Contextual Factors on Weekly Load Responses in Professional Brazilian Soccer Players. Int. J. Environ. Res. Public Health 2020, 17, 5163. [Google Scholar] [CrossRef]
- Granero-Gil, P.; Bastida-Castillo, A.; Rojas-Valverde, D.; Gómez-Carmona, C.D.; Sánchez, E.D.L.C.; Pino-Ortega, J. Influence of Contextual Variables in the Changes of Direction and Centripetal Force Generated during an Elite-Level Soccer Team Season. Int. J. Environ. Res. Public Health 2020, 17, 967. [Google Scholar] [CrossRef]
- Houtmeyers, K.C.; Jaspers, A.; Brink, M.S.; Vanrenterghem, J.; Varley, M.C.; Helsen, W.F. External load differences between elite youth and professional football players: Ready for take-off? Sci. Med. Footb. 2021, 5, 1–5. [Google Scholar] [CrossRef]
- Ibáñez, S.J.; Pérez-Goye, E.; García-Rubio, J.; Courel-Ibáñez, J. Effects of task constraints on training workload in elite women’s soccer. Int. J. Sports Sci. Coach. 2019, 15, 99–107. [Google Scholar] [CrossRef]
- Lolli, L.; Bahr, R.; Weston, M.; Whiteley, R.; Tabben, M.; Bonanno, D.; Gregson, W.; Chamari, K.; Di Salvo, V.; Van Dyk, N. No association between perceived exertion and session duration with hamstring injury occurrence in professional football. Scand. J. Med. Sci. Sports 2019, 30, 523–530. [Google Scholar] [CrossRef]
- Morandi, R.F.; Pimenta, E.M.; Andrade, A.G.P.; Serpa, T.K.F.; Penna, E.M.; Costa, C.O.; Júnior, M.N.S.O.; Garcia, E.S. Preliminary Validation of Mirrored Scales for Monitoring Professional Soccer Training Sessions. J. Hum. Kinet. 2020, 72, 265–278. [Google Scholar] [CrossRef]
- Muñoz-López, A.; Nakamura, F.; Orellana, J.N. Soccer Matches but Not Training Sessions Disturb Cardiac-Autonomic Regulation During National Soccer Team Training Camps. Res. Q. Exerc. Sport 2021, 92, 43–51. [Google Scholar] [CrossRef] [PubMed]
- Oliva-Lozano, J.M.; Rojas-Valverde, D.; Gómez-Carmona, C.D.; Fortes, V.; Pino-Ortega, J. Impact of contextual variables on the representative external load profile of Spanish professional soccer match-play: A full season study. Eur. J. Sport Sci. 2021, 21, 497–506. [Google Scholar] [CrossRef] [PubMed]
- Owen, A.L.; Newton, M.; Shovlin, A.; Malone, S. The Use of Small-Sided Games as an Aerobic Fitness Assessment Supplement within Elite Level Professional Soccer. J. Hum. Kinet. 2020, 71, 243–253. [Google Scholar] [CrossRef] [PubMed]
- Quintas, G.; Reche, X.; Sanjuan-Herráez, J.D.; Martínez, H.; Herrero, M.; Valle, X.; Masa, M.; Rodas, G. Urine metabolomic analysis for monitoring internal load in professional football players. Metabolomics 2020, 16, 1–11. [Google Scholar] [CrossRef] [PubMed]
- Rago, V.; Brito, J.; Figueiredo, P.; Krustrup, P.; Rebelo, A. Application of Individualized Speed Zones to Quantify External Training Load in Professional Soccer. J. Hum. Kinet. 2020, 72, 279–289. [Google Scholar] [CrossRef] [PubMed]
- Rago, V.; Krustrup, P.; Martín-Acero, R.; Rebelo, A.; Mohr, M. Training load and submaximal heart rate testing throughout a competitive period in a top-level male football team. J. Sports Sci. 2020, 38, 1408–1415. [Google Scholar] [CrossRef]
- Saidi, K.; Ben Abderrahman, A.; Boullosa, D.; Dupont, G.; Hackney, A.C.; Bideau, B.; Pavillon, T.; Granacher, U.; Zouhal, H. The interplay between plasma hormonal concentrations, physical fitness, workload and mood state changes to periods of congested match play in professional soccer players. Front. Physiol. 2020, 11, 835. [Google Scholar] [CrossRef]
- Springham, M.; Williams, S.; Waldron, M.; Strudwick, A.J.; Mclellan, C.; Newton, R.U. Prior workload has moderate effects on high-intensity match performance in elite-level professional football players when controlling for situational and contextual variables. J. Sports Sci. 2020, 38, 2279–2290. [Google Scholar] [CrossRef]
- Taberner, M.; O’Keefe, J.; Flower, D.; Phillips, J.; Close, G.; Cohen, D.D.; Richter, C.; Carling, C. Interchangeability of position tracking technologies; can we merge the data? Sci. Med. Footb. 2019, 4, 76–81. [Google Scholar] [CrossRef]
- Wiig, H.; Andersen, T.E.; Luteberget, L.S.; Spencer, M. Individual Response to External Training Load in Elite Football Players. Int. J. Sports Physiol. Perform. 2020, 15, 696–704. [Google Scholar] [CrossRef] [PubMed]
- Scott, M.T.; Scott, T.J.; Kelly, V.G. The validity and reliability of global positioning systems in team sport: A brief review. J. Strength Cond. Res. 2016, 30, 1470–1490. [Google Scholar] [CrossRef] [PubMed]
- Akenhead, R.; Nassis, G.P. Training Load and Player Monitoring in High-Level Football: Current Practice and Perceptions. Int. J. Sports Physiol. Perform. 2016, 11, 587–593. [Google Scholar] [CrossRef] [PubMed]
- Claudino, J.G.; Cronin, J.; Mezêncio, B.; McMaster, D.; McGuigan, M.; Tricoli, V.; Amadio, A.C.; Serrão, J. The countermovement jump to monitor neuromuscular status: A meta-analysis. J. Sci. Med. Sport 2017, 20, 397–402. [Google Scholar] [CrossRef]
- Claudino, J.G.; Gabbett, T.J.; Souza, H.D.S.; Simim, M.; Fowler, P.; Borba, D.D.A.; Melo, M.; Bottino, A.; Loturco, I.; D’Almeida, V.; et al. Which parameters to use for sleep quality monitoring in team sport athletes? A systematic review and meta-analysis. BMJ Open Sport Exerc. Med. 2019, 5, e000475. [Google Scholar] [CrossRef]
- Kraufvelin, P. Model ecosystem replicability challenged by the “soft” reality of a hard bottom mesocosm. J. Exp. Mar. Biol. Ecol. 1998, 222, 247–267. [Google Scholar] [CrossRef]
- Martín-Rodríguez, S.; Loturco, I.; Hunter, A.; Rodríguez-Ruiz, D.; Izquierdo, D.M. Reliability and Measurement Error of Tensiomyography to Assess Mechanical Muscle Function: A Systematic Review. J. Strength Cond. Res. 2017, 31, 3524–3536. [Google Scholar] [CrossRef] [PubMed]
- Lohr, C.; Schmidt, T.; Medina-Porqueres, I.; Braumann, K.-M.; Reer, R.; Porthun, J. Diagnostic accuracy, validity, and reliability of Tensiomyography to assess muscle function and exercise-induced fatigue in healthy participants. A systematic review with meta-analysis. J. Electromyogr. Kinesiol. 2019, 47, 65–87. [Google Scholar] [CrossRef]
- Looney, M.A. When Is the Intraclass Correlation Coefficient Misleading? Meas. Phys. Educ. Exerc. Sci. 2000, 4, 73–78. [Google Scholar] [CrossRef]
- Jennings, D.; Cormack, S.; Coutts, A.J.; Boyd, L.; Aughey, R.J. The Validity and Reliability of GPS Units for Measuring Distance in Team Sport Specific Running Patterns. Int. J. Sports Physiol. Perform. 2010, 5, 328–341. [Google Scholar] [CrossRef]
- Lewontin, R.C. On the measurement of relative variability. Syst. Zool. 1966, 15, 141–142. [Google Scholar] [CrossRef]
- Rago, V.; Brito, J.; Figueiredo, P.; Ermidis, G.; Barreira, D.; Rebelo, A. The Arrowhead Agility Test: Reliability, Minimum Detectable Change, and Practical Applications in Soccer Players. J. Strength Cond. Res. 2020, 34, 483–494. [Google Scholar] [CrossRef]
- Goes, F.; Meerhoff, L.; Bueno, M.; Rodrigues, D.; Moura, F.; Brink, M.; Elferink-Gemser, M.; Knobbe, A.; Cunha, S.; Torres, R.; et al. Unlocking the potential of big data to support tactical performance analysis in professional soccer: A systematic review. Eur. J. Sport Sci. 2021, 21, 481–496. [Google Scholar] [CrossRef]
- Gandomi, A.; Haider, M. Beyond the hype: Big data concepts, methods, and analytics. Int. J. Inf. Manag. 2015, 35, 137–144. [Google Scholar] [CrossRef]
- McGuigan, M.M. Extreme Positions in Sport Science and the Importance of Context: It Depends? Int. J. Sports Physiol. Perform. 2016, 11, 841. [Google Scholar] [CrossRef]
- Thiese, M.S. Observational and interventional study design types; an overview. Biochem. Medica 2014, 24, 199–210. [Google Scholar] [CrossRef]


Publisher’s Note: MDPI stays neutral with regard to jurisdictional claims in published maps and institutional affiliations. |
© 2021 by the authors. Licensee MDPI, Basel, Switzerland. This article is an open access article distributed under the terms and conditions of the Creative Commons Attribution (CC BY) license (https://creativecommons.org/licenses/by/4.0/).