1. Introduction
Transport infrastructures need continuous maintenance due to deteriorations that may harm their serviceability and safety. These effects are the result of the combination of several factors, e.g., construction materials, quality of construction, traffic loads, and environmental factors. For this reason, it is necessary to carry out persistent monitoring of infrastructure health conditions in order to guarantee maximum safety at all times and support effective and economically sustainable maintenance.
In the next few years, the problem of the resilience of the built environment will become increasingly important as the buildings and infrastructures built in reinforced concrete in the 20th century are going to reach the end of their life.
Accordingly, the monitoring activities will acquire increasing importance for the early identification of critical situations and the prioritization and planning of the interventions.
In recent years, new technologies have been developed (mainly in the field of electromagnetic sensing and ICT) able to complement the analysis methods of civil engineering.
This has led to the development of integrated systems for early warning, monitoring and quick damage assessment of the built environment and critical infrastructures [
1,
2], able to achieve several aims, such as:
- -
The implementation of a multi-disciplinary approach able to integrate different kinds of sensing/diagnostics technologies (including new concept of operation, such as the citizen as a sensor [
3,
4] where personal smart devices collect and send information from all over the world in near real-time) with spatial data infrastructure and ICT architectures;
- -
The capability to assimilate monitoring data and indicators coming from the sensing in civil engineering analysis with the aim of assessing the loss of performance of structures. This knowledge is important to identify actions and strategies for an effective and economically sustainable management of the infrastructure;
- -
The possibility to couple current monitoring with early warning and quick damage assessment capabilities, in order to drive and plan remedial solutions in crisis situations.
Several examples of the exploitation of this approach are in [
5,
6], where the focus was mainly on its suitability for the long-term monitoring of the transport infrastructures.
Anyway, in order to allow for the sustainability of such an integrated approach, it is crucial to design smart observational chains, which activate more sophisticated surveys only when necessary. An example of this “smartness” concept is reported in [
2,
5], where different levels of observations of increasing complexity are identified. This means that the choice of the sensing technologies is made on the basis of the specific scenario (structure, territory, risks, etc.) and more sophisticated sensing techniques are activated only after criticalities are detected by cheaper and easier to deploy sensors. The first level of these observational chains is characterized by the integration of the technologies allowing to activate an almost entirely automated long-term monitoring and early warning strategy. In this way, it is possible to follow the life of an infrastructure continuously over time, by limiting the exploitation of personnel to a minimum, just for periodic inspections, and traffic interruptions. Therefore, this level has to be characterized by the use of technologies that require an extremely simplified logistics with no interruption of the operativity of the structure, by ensuring monitoring results at a large scale and in a fast way. The results deriving by the use of this level are exploited to decide whether to activate more complex analysis stages focused on the detailed diagnostics of the structure (or of the single elements of it), by means of in situ technologies, such as ground penetrating radar, infrared cameras, etc.
In this paper, we focus on the above described first level of the observational chain, which combines the Differential Synthetic Aperture Radar (SAR) interferometry (DInSAR) measurements and accelerometer based data for the monitoring of strategic infrastructure located in Rome; this activity falls within the WP6 “Structural Health Monitoring and Satellite Data” 2019-21 Reluis Project developed under the framework of the Italian Civil Protection Department agreement.
In this first stage of observation, the DInSAR measurements provide information about the long-term deformation status both of the structure and of the surrounding soil. This twofold point of views has been introduced in order to tentatively distinguish between generalized deformation trend induced by independent large scale geological processes such as, for example, subsidence or landslide affecting the area, and localized deformation trends mainly related to the structure or to the soil–structure interaction.
The vibrational-based data (accelerometric and/or velocimetric data) provide information about the frequencies of structural vibration and their possible variation over time. Several studies demonstrate the possibility to use changing in modal characteristics of a monitored structure to detect damages and criticalities on both structural and non-structural components, see [
7,
8,
9,
10,
11,
12,
13,
14,
15,
16,
17,
18,
19,
20,
21,
22,
23]). These in situ data have been provided by the Italian Civil Protection Department (DPC), through the Seismic Observatory of Structures (OSS) [
24], a network of permanent seismic monitoring systems installed on public buildings, bridges and dams [
25].
Moreover, the in situ observations have been completed with a visual survey of the building and several ambient vibration measurements, which have been performed on October 2020. The overall analysis has the aim of evaluating the condition of the structure, assess any already existing or potential defects and identify possible anomalies.
The paper is organized as follows:
Section 2 briefly summarizes the main aspects and applications of the exploited DInSAR technique; in
Section 3 the case study is illustrated;
Section 4 reports the main geological characteristics of the investigated area where the case study is located; in
Section 5 data processing and results are displayed;
Section 6 provides a discussion about the advantages and limits of different methods.
Section 7 reports the main findings together with the conclusions.
2. Differential Synthetic Aperture Radar Interferometry (DInSAR) for Structural Deformation Monitoring
Remote sensing can provide valuable information in a large variety of natural and anthropic hazard scenarios thanks to its synoptic capability, for instance when a seismic event occurs in remote regions, or the main communication systems are damaged [
26]. In this framework, the Synthetic Aperture Radar (SAR) satellite sensors have been widely used in the last decades for analyzing the surface displacements, uplifts and subsidence phenomena caused by earthquakes [
27,
28,
29,
30], since they provide high spatial resolution images relevant to very large areas on the Earth’s surface, with all weather and continuous (night and day) imaging capabilities.
Research outputs have been already published regarding post-seismic building damage assessment performed by combining pre- and post-seismic images [
31,
32,
33], using SAR simulations or combining radar and optical remote-sensing data [
26,
34]. The satellite DInSAR technique is one of the most innovative methodologies for ground and structures displacement monitoring in urban areas.
DInSAR is based on the exploitation of the phase difference (i.e., interferogram) between two temporally separated SAR images that, following the phase unwrapping operation [
35,
36], permits information on the detected displacements to be retrieved, projected along the radar sensor Line of Sight (LOS), that occurred between the two acquisition times, with centimeter accuracy [
30]. Furthermore, the use of advanced DInSAR approaches [
37,
38,
39,
40,
41,
42], based on the exploitation of SAR acquisition sequences collected over large time spans, allows the provision of useful information on both the spatial and the temporal patterns of the detected displacements through the generation of time series, with centimeter to millimeter accuracy [
43,
44,
45].
The advanced DInSAR techniques allow to map and measure deformation phenomena due to both natural and anthropic causes [
46,
47,
48,
49,
50,
51,
52,
53,
54] with limited monitoring costs compared to the traditional in situ surveys.
Furthermore, these techniques represent a non-invasive tool to remotely detect, map and monitor deformation phenomena affecting urban areas by providing velocity maps and displacement time-series, for a large number of measurement points and long observation periods [
55]. DInSAR techniques have also demonstrated the capability to provide valuable information on the displacements affecting single buildings (see, for instance [
56,
57]). Thanks to their capability to extend backwards by exploiting the SAR data archives available since the early ERS-1 ESA mission in 1992, the DInSAR investigations allow comparisons of pre- with post-event conditions and contribute to the implementation of damage assessment analyses and to the evaluation of risk scenarios [
56,
57,
58,
59,
60].
The multi-temporal Small Baseline Subset (SBAS) DInSAR technique allows the investigation and mapping of ground movements through the generation of mean deformation velocity maps and corresponding displacement time series [
38,
39,
40]. It relies on a proper selection of a large number of SAR image pairs characterized by short spatial and temporal separations (referred to as baseline) between the acquisition orbits, in order to mitigate decorrelation phenomena and to maximize the number of reliable (coherent) SAR measure points [
61]. In particular, the deformation time series are computed by searching for a least square solution with a minimum norm energy constraint [
38]. Moreover, by contrast with other advanced multi-temporal DInSAR techniques, the SBAS approach does not need any
a priori information on the investigated ground deformation phenomena, thus representing a valuable method to detect and measure non-linear LOS displacements over time. The SBAS-DInSAR technique is able to work at two different spatial resolution scales, referred to as regional and local scale analyses. In the regional scale, the algorithm is able to produce deformation maps of wide areas (up to 250 × 250 km
2) with a ground spatial resolution ranging from about 30 to 100 m, suitable to natural wide-area deformation events. At the local (full resolution) scale, the SBAS approach exploits single-look interferograms, generated at the full sensor spatial resolution (down to a few meters), to study local deformation that may affect buildings and man-made features [
39,
40]. The SBAS approach allows generation of LOS displacement maps and associated time series spanning very long periods (decades), thus guaranteeing the continuity in the monitoring of the Earth’s surface deformation phenomena, as well as providing unprecedented information for studying long-term ground movements at different spatial scales. At the local scale, these measurements can contribute to the evaluation of the structural conditions of the single constructions.
3. Description of the Case Study
Ponte della Musica-Armando Trovajoli is a shallow arch bridge for pedestrians/cyclists crossing the River Tiber in Rome in a single span (
Figure 1). The bridge is almost 190 m long and is 20 m wide, so that it is one of the widest pedestrian bridges ever built.
The bridge has a main span of approximately 130 m and two side spans of about 30 m (
Figure 2). The bridge comprises two outwardly inclined arches made of fabricated ‘tear drop’-shaped tubular steel supporting stiff transverse frames positioned at 8.5 m intervals. The arches rise 10.6 m above the crown of the deck at midspan, giving a span-to-rise ratio of about 12:1 [
62]. Construction began in 2008 and it was inaugurated in May 2011.
A pile foundation has been adopted due to the local geological and geotechnical setting of the subsoil which is specifically addressed in
Section 4. This foundation is composed by 54 piles (Φ600) 55 m deep inserted into two concrete plinths, 1620 m
3 the right one and 2785 m
3 the left one (
Figure 2).
As described in [
62], during design development, a fundamental change to the structural scheme of the bridge was defined, from a true arch to a tied arch, in order to avoid the inclined mini-piles solution (
Figure 3).
4. Geological Setting
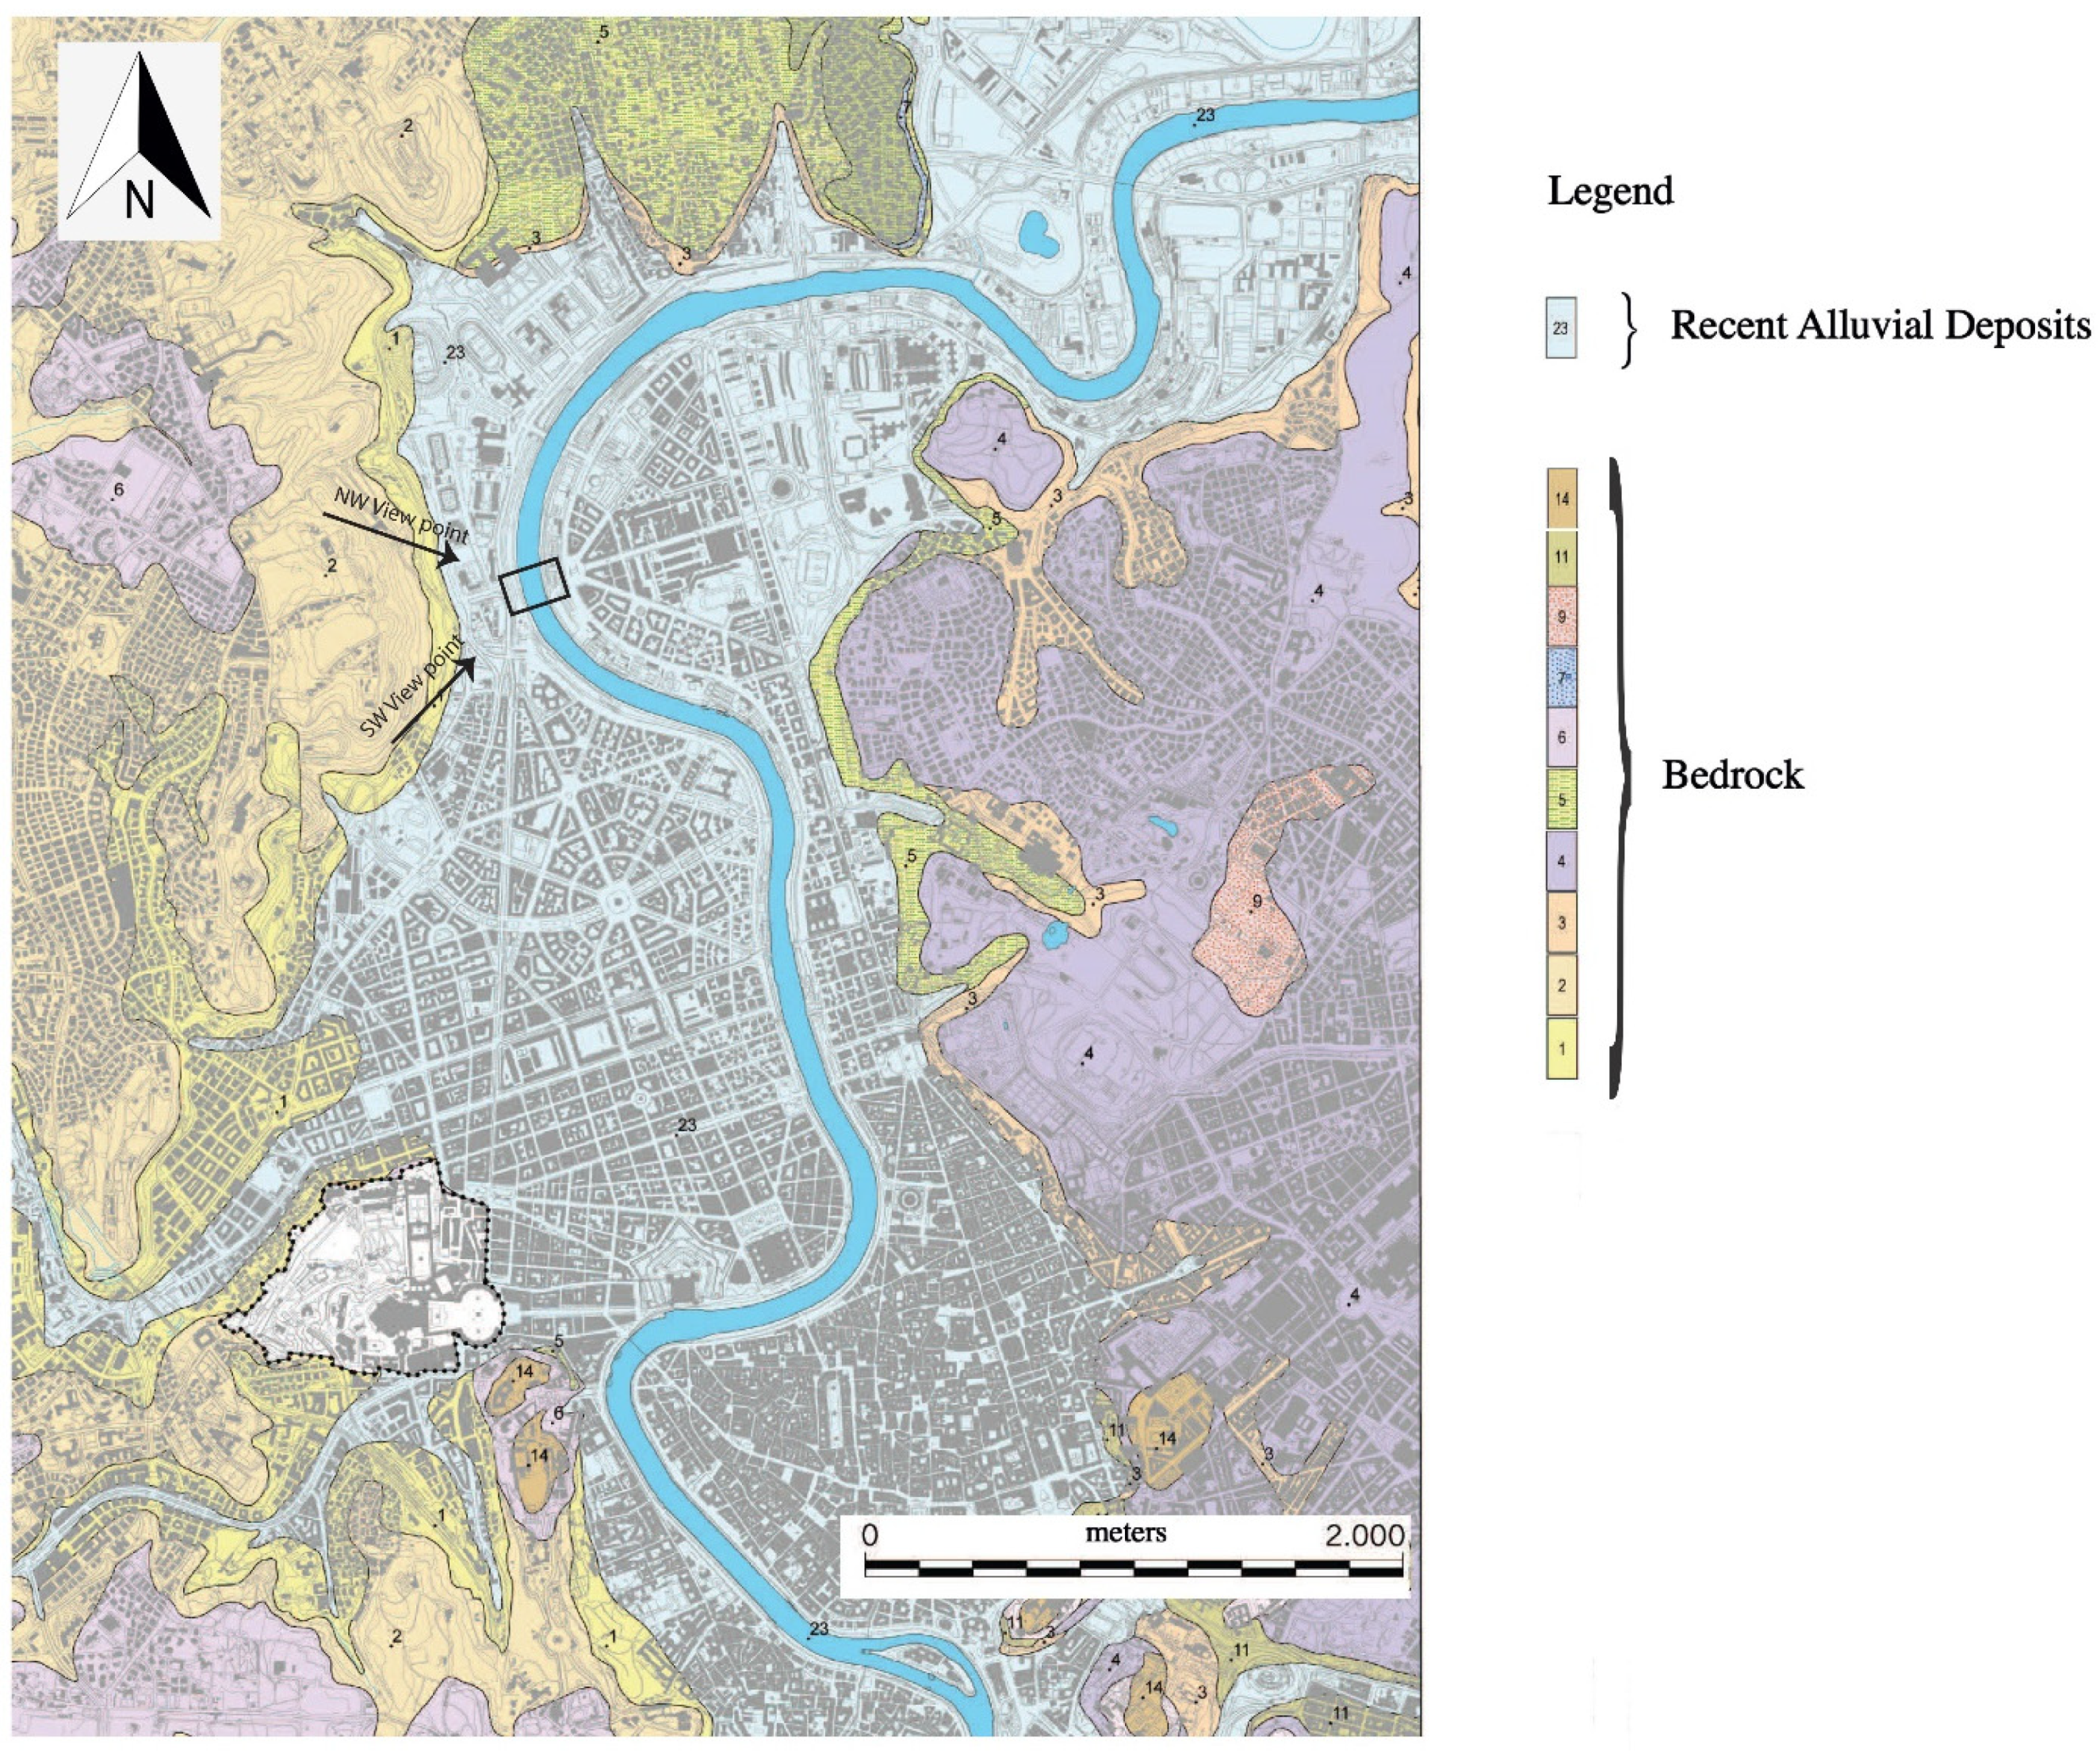
Ponte della Musica bridge is located in the alluvial plain of the Tiber River. It crosses the river in the central part of the meander characterizing the northern part of the urban route of the river.
The west abutment of the bridge is near the right boundary between the Tiber recent alluvial deposits marked in light blue color in
Figure 4 and the geological bedrock locally marked in yellow color outcropping along the slope of the Monte Mario hill, while the east abutment is much farther from the left boundary of the alluvial deposits.
Figure 5 depicts a 3D geological reconstruction of the Ponte della Musica subsoil, which has been realized by the software ROCKWORKS [
63] using as input data for the model the stratigraphies of 10 deep boreholes performed for the plan of the bridge. Below a stratum of man-made fill (R in
Figure 5), the subsoil of the bridge is constituted by more than 50 m of recent alluvial deposits (upper Pleistocene and Holocene aged). They rest on Pliocene stiff clay (blue color in
Figure 4) acting as a geological bedrock and locally named the Marne Vaticane formation.
A complex internal architecture of the recent alluvial deposits is shown (
Figure 5): in addition to the vertical lithological variations, horizontal heteropies are recorded. In
Figure 5, the bridge, the plinths and the piles are approximately sketched.
From the bottom to the top, the recent alluvial deposits are constituted by a stratum of gravels (G in
Figure 5), followed by a bank some tens of meters thick of fine grained deposits, mainly silt and clay (C in
Figure 5) with some peat layers not distinguished and some sandy silt thin lenses (D), then a level of sand (B1 and B2 in
Figure 5) and, finally, in the shallowest part a stratum of silty clay and sandy silt (respectively, A1 and A2 in
Figure 5).
As a matter of fact, the main part of the Tiber alluvial body is characterized by soft compressible fine grained soils with low shear-strength parameters, whereas the local geological bedrock (the “Marne Vaticane” formation) is significantly more consistent and with higher shear strength parameters. For this reason, the piles of the Ponte della Musica foundation overpass the alluvial soils and their base was driven into the Marne Vaticane formation.
It has been largely documented by the literature [
54,
56,
57,
64,
65,
66] that the part of the Rome urban area resting on the Tiber alluvial deposits suffers some subsidence related to the high compressibility of the alluvial soils. In the recently urbanized area [
64], the rate of subsidence recorded for some structures and infrastructures could be high, while in the ancient part of the urban area the subsidence rate of the historic buildings is generally very low.
In recently urbanized urban areas, extremely different situations distinguish two types of building. On the one hand, we have buildings with shallow foundations, resting on the compressible alluvial soil. On the other, we find buildings that are founded on deep piles driven in the basal bank of gravel or in the underlying bedrock [
67].
5. Results
5.1. Remote Sensing Data
To perform infrastructure monitoring analysis related to Ponte della Musica, the multi-temporal full resolution SBAS-DInSAR technique [
39,
40] has been exploited. In particular, we exploited long sequences of satellite SAR acquisitions collected from ascending and descending orbits by the Italian COSMO-SkyMed (CSK) constellation over the wide urban area of Rome. The acquisition mode of the exploited radar images is the standard Stripmap one, characterized by a ground spatial resolution of about 3 m in both azimuth (flight direction) and range (perpendicular to azimuth) directions, which is particularly suitable to urban and single structures DInSAR analyses. The two datasets are composed of 129 ascending and 107 descending Single Look Complex (SLC) acquisitions collected along the March 2011–March 2019 time interval, with a look angle at the scene center of about 34° and 29°, respectively. Thanks to the large overlapping area between ascending and descending acquisitions, it was possible to perform extensive comparative analyses of the spatial and temporal evolution of the achieved displacements, aimed to retrieve further information useful for deformation signal detection and interpretation relevant to single infrastructures and bridges.
The geocoded SBAS-DInSAR results (i.e., full resolution deformation time series and mean deformation velocity maps for each coherent pixel) were provided through datasheets including several unique pixel identifiers for which several parameters are defined, namely: latitude; longitude; topography; mean deformation velocity; interferometric temporal coherence [
40] (a value between 0 and 1); directive cosine, corresponding to the components of Line of Sight (LOS) unit vector along the North, East, vertical directions; and LOS displacement Time Series (TS).
The available data were analyzed in a GIS software and categorized according to mean deformation velocity values. After, several measurement points were selected and their displacement time series were analyzed.
Figure 6 and
Figure 7 show the mean deformation velocity maps of the area under investigation and of the infrastructure associated to ascending and descending orbit, respectively.
Figure 7 clearly shows that the points detected by the satellite are present only on the bridge abutments and foundation but not on the deck. The deformation velocity ranges from −0.4 to 0 cm/year. It should be noted that the exploited multi-temporal coherence (defined in [
40]) values of the represented points relating to both the ascending and descending orbit range from 0.35 to 0.55.
Figure 8 and
Figure 9 report the displacement time-series relating to the measurement points located on the bridge abutments and associated to ascending and descending orbits, respectively.
As for foundation-points, their displacements are almost linear and no evident thermal dilation effects were observed. The displacements of abutment-points seemed to be temperature dependent.
5.2. In Situ Testing
In October 2020, an experimental campaign of ambient vibration measurements was carried out to evaluate the main frequencies of the structure. Velocimetric stations were installed on the span at L/2, both at the center and on the east edge, at L/4 on the east edge and on the abutment (
Figure 10).
Experimental campaign has been performed using velocimetric stations characterized by a dynamic range equal to 144 dB, a digitizer characterized by a resolution equal to 24 bit, a sensor characterized by a frequency equal to 0.5 Hz. Velocimetric recordings have been acquired using a sampling frequency equal to 200 Hz for a total length of each acquisition equal to 900s.
Figure 11 and
Figure 12 show the displacement time series recorded on the bridge at different points. It is possible to appreciate the difference in terms of level amplitudes among the span and the abutment for both horizontal and vertical components. During the experimental campaign, the structure exhibits a linear-elastic behavior characterized by the transfer functions [
68] depicted on
Figure 13.
In order to evaluate the transfer function of the monitored bridge, the acquired recordings have been firstly corrected for baseline and filtered between 0.1–30 Hz using a band-pass filter. Secondly, the Welch spectra have been evaluated for each channel of each velocimetric recording and, finally, the transfer functions have been evaluated considering the station located at zero as the reference station. The first three eigenfrequencies characterizing the dynamic behavior of the monitored bridge are the following:
I Mode: 0.92 ± 0.01 Hz—vertical direction;
II Mode: 1.01 ± 0.01 Hz—transversal direction;
III Mode: 1.33 ± 0.01 Hz—vertical direction.
6. Discussion
The analysis of the LOS displacement time series, retrieved through the multi-temporal SBAS-DInSAR technique, shows a substantially stable behavior of the bridge structural elements. This stable behavior is confirmed by results retrieved from vibrational analyses in terms of eigenfrequencies and mode shapes.
The more marked linear trends of lowering of the foundations observed over the time interval 2011–2019 (time series of
Figure 8 and
Figure 9) are thought to be caused mainly by the overlapping of the settlement involving the underlying soft alluvial deposits and of the settlement of the stiff blue clay (Marne Vaticane formation) around the base of the piles. These settlements were triggered by the load of the bridge finished building only 2 years before the starting of the DInSAR monitoring. According to the well-known model of the consolidation process, for the near future a decrease of the maximum displacement rate is expected.
The analysis of radar data relating to both the ascending and descending orbits shows that there are no measuring points detected by the satellite on the deck. To investigate on this issue, the map of the measurement points detected on a larger area, including different infrastructures, was analyzed (
Figure 14).
Figure 15 and
Figure 16 show that bridges with high stiffness and with the piles in the riverbed (Ponte Matteotti, Ponte Pietro Nenni, Ponte Flaminio and Ponte Milvio) are almost covered by the satellite measurement points. By contrast, at Ponte Risorgimento and Ponte Duca d’Aosta the points detected by the satellite are not located on the deck, similar to the case of Ponte della Musica.
7. Conclusions
An experimental campaign has been planned within the 2019–2021 DPC-Reluis Project with the aim of setting up new protocols to merge information retrieved from satellite data and on-site vibrational measurements. The “Ponte della Musica–Armando Trovajoli” bridge has been selected as test site.
With reference to the satellite data, analyses of LOS displacement time series, retrieved through the multi-temporal SBAS-DInSAR technique, show a substantially stable behavior of the bridge structural elements. The deformation trends of the foundations observed in the 2011–2019 time interval reflect the response in term of small settlement of the subsoil due to the load of bridge itself imposed not before of 2009.
During the experimental campaign velocimetric acquisitions were also performed on the bridge. Collected data allowed us to observe that the monitored structure exhibits, in the considered time interval, a stable behavior. The main structural eigenfrequencies were estimated: the first mode is characterized by a frequency equal to 0.92 Hz, the second mode is characterized by a frequency equal to 1.01 Hz, and the third one is characterized by a frequency equal to 1.33 Hz. These values could be used in future as a reference to detect possible anomalous dynamic behavior.
The analysis of satellite data relating to both the ascending and descending orbits showed that there are no measuring points detected by the satellite on the deck. Same measurements performed on masonry arch bridges located close to the Ponte della Musica show data both on the support and on along the deck. Bridges with high stiffness and with the piles in the riverbed (Ponte Matteotti, Ponte Pietro Nenni, Ponte Flaminio and Ponte Milvio) are completely covered by the satellite measurement points whereas on Ponte Risorgimento and Ponte Duca d’Aosta the points detected by the satellite are not located on the deck, as observed for Ponte della Musica.
In the case of bridge monitoring, the associated displacements are on the order of magnitude of millimeters and are continuously varying in time due to temperature and traffic loads. However, heavy traffic loads, strong wind, temperature changes and other second-order events may lead to large unexpected vibration effects on the bridge, which sometimes jeopardize the correct retrieval of displacements associated to the investigated bridge or some parts of it. In the specific case of Ponte della Musica, some further investigations to detect the possible causes (for instance, sudden temperature variations, strong winds) that led to the observed lack of coherent DInSAR measurements on the bridge deck need to be further investigated.
Accordingly, future numerical and experimental studies are envisaged to correlate structural eigenfrequencies with temperature, displacements and satellite data, with the aim to: (i) update protocols to merge information retrieved by using different techniques, on site and remote-sensing data; (ii) define structural behavior thresholds to identify and locate damages on structural and non-structural components.
Finally, it must be remarked that the combination of SAR satellite and in situ techniques represents a monitoring level able on the one hand to follow the trend of the infrastructure over time, identifying variations that may herald criticalities, and on the other hand to identify, in the presence of a seismic event, infrastructures that do not present critical issues that require further investigation.
Author Contributions
Conceptualization, C.I., R.D., F.C.P., M.B., R.L., F.S., V.C. and F.B.; experimental campaign of ambient vibration measurements, C.I., R.D. and F.C.P.; velocimetric data acquisition and processing, C.I., R.D. and F.C.P.; satellite data acquisition and processing, M.B., R.L., F.S. and V.C.; geological analysis, F.B., P.C. and M.R.; writing original draft, C.I., R.D. and F.C.P.; writing review and editing, all authors; funding acquisition, F.C.P. All authors have read and agreed to the published version of the manuscript.
Funding
This research was partially funded by the Italian Civil Protection Department within the project RELUIS 2019–2021 WP6 “Structural Health Monitoring and Satellite Data”; the manuscript contents reflect authors’ positions that could be different from the DPC official statements. Project carried out using CSK® Products, © of the Italian Space Agency (ASI), delivered under a license to use by ASI.
Institutional Review Board Statement
Not applicable.
Informed Consent Statement
Not applicable.
Data Availability Statement
The data presented in this study are available on request from the corresponding author.
Acknowledgments
We would like to thank “Roma Capitale-Sovrintendenza Capitolina ai Beni Culturali-Direzione Interventi su Edilizia Monumentale” for the stratigraphies of the boreholes used for the 3D geological model. The Digital Elevation Model of the analyzed area was acquired through the SRTM archive.
Conflicts of Interest
The authors declare no conflict of interest.
References
- Cuomo, V.; Soldovieri, F.; Bourquin, F.; El Faouzi, N.E.; Dumoulin, J. The necessities and the perspectives of the monitoring/surveillance systems for multi-risk scenarios of urban areas including COVID-19 pandemic. In Proceedings of the 2020 TIEMS Conference, Citizens and Cities Facing New Hazards and Threats, Oslo, Norway, 30 November–4 December 2020. [Google Scholar]
- Cuomo, V.; Soldovieri, F.; Ponzo, F.C.; Ditommaso, R. A holistic approach to long term SHM of transport infrastructures. Int. Emerg. Manag. Soc. (TIEMS) 2018, 33, 67–84. [Google Scholar]
- Goodchild, M.F. Citizens as sensors: The world of volunteered geography. GeoJournal 2007, 69, 211–221. [Google Scholar] [CrossRef] [Green Version]
- De Faria, M.L.L.; Da Silva, R.F.; Cugnasca, C. A Framework for Implementing the Concept of Citizen as a Sensor. In Proceedings of the 2016 IEEE 13th International Conference on Mobile Ad Hoc and Sensor Systems (MASS), Brasilia, Brazil, 10–13 October 2016; Institute of Electrical and Electronics Engineers (IEEE): Piscataway, NJ, USA, 2016; pp. 370–372. [Google Scholar]
- Soldovieri, F.; Dumoulin, J.; Ponzo, F.C.; Crinière, A.; Bourquin, F.; Cuomo, V. Association of sensing techniques with a designed ICT architecture in the ISTIMES project: Application example with the monitoring of the Musmeci bridge. In Proceedings of the EWSHM 2014, 7th European Workshop on Structural Health Monitoring, Nantes, France, 8–11 July 2014. [Google Scholar]
- Proto, M.; Bavusi, M.; Bernini, R.; Bigagli, L.; Bost, M.; Bourquin, F.; Cottineau, L.-M.; Cuomo, V.; Della Vecchia, P.; Dolce, M.; et al. Transport Infrastructure Surveillance and Monitoring by Electromagnetic Sensing: The ISTIMES Project. Sensors 2010, 10, 10620–10639. [Google Scholar] [CrossRef] [Green Version]
- Rytter, A. Vibrational Based Inspection of Civil Engineering Structures. Ph.D. Thesis, University of Aalborg, Aalborg, Denmark, 1993. [Google Scholar]
- Doebling, S.W.; Farrar, C.R.; Prime, M. A Summary Review of Vibration-Based Damage Identification Methods. Shock. Vib. Dig. 1998, 30, 91–105. [Google Scholar] [CrossRef] [Green Version]
- Stubbs, N.; Perk, S.; Sikorsky, C.; Choi, S. A global non-distructive damage assesment methodology for civil engineering structures. Int. J. Syst. Sci. 2000, 31, 1361–1373. [Google Scholar] [CrossRef]
- Ponzo, F.C.; Ditommaso, R.; Auletta, G.; Mossucca, A. A fast method for structural health monitoring of Italian reinforced concrete strategic buildings. Bull. Earthq. Eng. 2010, 8, 1421–1434. [Google Scholar] [CrossRef]
- Ditommaso, R.; Ponzo, F.C.; Auletta, G. Damage detection on framed structures: Modal curvature evaluation using Stockwell Transform under seismic excitation. Earthq. Eng. Eng. Vib. 2015, 14, 265–274. [Google Scholar] [CrossRef]
- Ditommaso, R.; Iacovino, C.; Auletta, G.; Parolai, S.; Ponzo, F.C. Damage Detection and Localization on Real Structures Subjected to Strong Motion Earthquakes Using the Curvature Evolution Method: The Navelli (Italy) Case Study. Appl. Sci. 2021, 11, 6496. [Google Scholar] [CrossRef]
- Devin, A.; Fanning, P. The Evolving Dynamic Response of a Four Storey Reinforced Concrete Structure during Construction. Shock. Vib. 2012, 19, 1051–1059. [Google Scholar] [CrossRef]
- Devin, A.; Fanning, P.J. Effect of Non-structural elements on the Dynamic Response of floors. In Topics on the Dynamics of Civil Structures; Springer: New York, NY, USA, 2012; Volume 1, pp. 415–421. [Google Scholar] [CrossRef]
- Ditommaso, R.; Mucciarelli, M.; Ponzo, F.C. Analysis of non-stationary structural systems by using a band-variable filter. Bull. Earthq. Eng. 2012, 10, 895–911. [Google Scholar] [CrossRef]
- Ditommaso, R.; Ponzo, F.C. Automatic evaluation of the fundamental frequency variations and related damping factor of reinforced concrete framed structures using the Short Time Impulse Response Function (STIRF). Eng. Struct. 2015, 82, 104–112. [Google Scholar] [CrossRef]
- Iacovino, C.; Ditommaso, R.; Ponzo, F.; Limongelli, M. The Interpolation Evolution Method for damage localization in structures under seismic excitation. Earthq. Eng. Struct. Dyn. 2018, 47, 2117–2136. [Google Scholar] [CrossRef]
- Picozzi, M.; Ditommaso, R.; Parolai, S.; Mucciarelli, M.; Milkereit, C.; Sobiesiak, M.; Di Giacomo, D.; Gallipoli, M.R.; Pilz, M.; Vona, M.; et al. Real time monitoring of structures in task force missions: The example of the Mw = 6.3 Central Italy Earthquake, 6 April 2009. Nat. Hazards 2009, 52, 253–256. [Google Scholar] [CrossRef]
- Mucciarelli, M.; Gallipoli, M.; Ponzo, F.; Dolce, M. Seismic waves generated by oscillating buildings: Analysis of a release test. Soil Dyn. Earthq. Eng. 2003, 23, 255–262. [Google Scholar] [CrossRef]
- Laurenzano, G.; Priolo, E.; Gallipoli, M.R.; Mucciarelli, M.; Ponzo, F.C. Effect of vibrating buildings on free-field motion and on adjacent structures: The Bonefro (Italy) case history. Bull. Seismol. Soc. Am. 2010, 100, 802–818. [Google Scholar] [CrossRef]
- Ditommaso, R.; Vona, M.; Gallipoli, M.; Mucciarelli, M. Evaluation and considerations about fundamental periods of damaged reinforced concrete buildings. Nat. Hazards Earth Syst. Sci. 2013, 13, 1903–1912. [Google Scholar] [CrossRef] [Green Version]
- Gerardi, V.; Ditommaso, R.; Auletta, G.; Ponzo, F.C. Reinforced concrete framed structures: Numerical validation of two physical models capable to consider the stiffness contribution of infill panels on framed structures in operative conditions. Int. J. Earthq. Eng. 2018, 35, 1–21. [Google Scholar]
- Serlenga, V.; Gallipoli, M.R.; Ditommaso, R.; Ponzo, C.F.; Tragni, N.; Perrone, A.; Stabile, T.A.; Calamita, G.; Vignola, L.; Carso, R.F.; et al. An integrated approach for structural behavior characterization of the Gravina Bridge (Matera, Southern Italy). Struct. Heal. Monit. 2021. [Google Scholar] [CrossRef]
- Lamonaca, B.G.; Nicoletti, M.; Spina, D. Permanent monitoring of the seismic response of civil structures in Italy: The Seismic Observatory of Structure Project (in Italian). Ing. Sismica 2001, 1. [Google Scholar]
- Dolce, M.; Nicoletti, M.; De Sortis, A.; Marchesini, S.; Spina, D.; Talanas, F. Osservatorio sismico delle strutture: The Italian structural seismic monitoring network. Bull. Earthq. Eng. 2015, 15, 621–641. [Google Scholar] [CrossRef] [Green Version]
- Stramondo, S.; Bignami, C.; Chini, M.; Pierdicca, N.; Tertulliani, A. Satellite radar and optical remote sensing for earthquake damage detection: Results from different case studies. Int. J. Remote Sens. 2006, 27, 4433–4447. [Google Scholar] [CrossRef]
- Tizzani, P.; Castaldo, R.; Solaro, G.; Pepe, S.; Bonano, M.; Casu, F.; Manunta, M.; Manzo, M.; Pepe, A.; Samsonov, S.; et al. New insights into the 2012 Emilia (Italy) seismic sequence through advanced numerical modeling of ground deformation InSAR measurements. Geophys. Res. Lett. 2013, 40, 1971–1977. [Google Scholar] [CrossRef]
- Mroueh, H.; Shahrour, I. A full3-Dfinite element analysis of tunnelling adjacent structures interaction. Comput. Geotech. 2003, 30, 245–253. [Google Scholar] [CrossRef]
- Cheloni, D.; De Novellis, V.; Albano, M.; Antonioli, A.; Anzidei, M.; Atzori, S.; Avallone, A.; Bignami, C.; Bonano, M.; Calcaterra, S.; et al. Geodetic model of the 2016 Central Italy earthquake sequence inferred from InSAR and GPS data. Geophys. Res. Lett. 2017, 44, 6778–6787. [Google Scholar] [CrossRef]
- Massonnet, D.; Rossi, M.; Carmona, C.; Adragna, F.; Peltzer, G.; Feigl, K.; Rabaute, T. The displacement field of the Landers earthquake mapped by radar interferometry. Nature 1993, 364, 138–142. [Google Scholar] [CrossRef]
- Gamba, P.; Dell’acqua, F.; Trianni, G. Rapid damage detection in the Bam area using multitemporal SAR and exploiting ancillary Data. IEEE Trans. Geosci. Remote Sens. 2007, 45, 1582–1589. [Google Scholar] [CrossRef]
- Matsuoka, M.; Yamazaki, F.; Ohkura, H. Damage mapping for the 2004 Niigata-ken Chuetsu earthquake using Radarsat images. In Proceedings of the 2007 Urban Remote Sensing Joint Event, Institute of Electrical and Electronics Engineers (IEEE), Paris, France, 11–13 April 2007; pp. 1–5. [Google Scholar]
- Yonezawa, H.A.; Takeuchi, S. Decorrelation of SAR data by urban damage caused by the 1995 Hoyogoken-Nanbu earthquake. Int. J. Remote Sens. 2001, 22, 1585–1600. [Google Scholar] [CrossRef]
- Chini, M.; Pierdicca, N.; Emery, W. Exploiting SAR and VHR Optical Images to Quantify Damage Caused by the 2003 Bam Earthquake. IEEE Trans. Geosci. Remote Sens. 2008, 47, 145–152. [Google Scholar] [CrossRef]
- Fornaro, G.; Franceschetti, G.; Lanari, R.; Rossi, D.; Tesauro, M. Interferometric SAR phase unwrapping using the finite element method. IEE Proc. Radar Sonar Navig. 1997, 144, 266–274. [Google Scholar] [CrossRef]
- Fornaro, G.; Franceschetti, G.; Lanari, R.; Sansosti, E.; Tesauro, M. Global and local phase-unwrapping techniques: A comparison. J. Opt. Soc. Am. Part A 1997, 14, 2702–2708. [Google Scholar] [CrossRef]
- Ferretti, A.; Fumagalli, A.; Novali, F.; Prati, C.; Rocca, F.; Rucci, A. A new algorithm for processing interferometric data-stacks: SqueeSAR. IEEE Trans. Geosci. Remote Sens. 2011, 49, 3460–3470. [Google Scholar] [CrossRef]
- Berardino, P.; Fornaro, G.; Lanari, R.; Sansosti, E. A new algorithm for surface deformation monitoring based on small baseline differential SAR interferograms. IEEE Trans. Geosci. Remote Sens. 2002, 40, 2375–2383. [Google Scholar] [CrossRef] [Green Version]
- Lanari, R.; Mora, O.; Manunta, M.; Mallorquí, J.J.; Berardino, P.; Sansosti, E. A small baseline approach for investigating deformations on full resolution differential SAR interferograms. IEEE Trans. Geosci. Remote Sens. 2004, 42, 1377–1386. [Google Scholar] [CrossRef]
- Bonano, M.; Manunta, M.; Marsella, M.; Lanari, R. Long-term ERS/ENVISAT deformation time-series generation at full spatial resolution via the extended SBAS technique. Int. J. Remote Sens. 2012, 33, 4756–4783. [Google Scholar] [CrossRef]
- Werner, C.; Wegmuller, U.; Strozzi, T.; Wiesmann, A. Interferometric point target analysis for deformation mapping. In Proceedings of the IEEE Geoscience and Remote Sensing Symposium (IGARSS), Toulouse, France, 21–25 July 2003; Volume 7, pp. 4362–4364. [Google Scholar]
- Mora, O.; Mallorquí, J.J.; Broquetas, A. Linear and nonlinear terrain deformation maps from a reduced set of interferometric SAR images. IEEE Trans. Geosci. Remote Sens. 2003, 41, 2243–2253. [Google Scholar] [CrossRef]
- Casu, F.; Manzo, M.; Lanari, R. A quantitative assessment of the SBAS algorithm performance for surface deformation retrieval from DInSAR data. Remote Sens. Environ. 2006, 102, 95–210. [Google Scholar] [CrossRef]
- Bonano, M.; Manunta, M.; Pepe, A.; Paglia, L.; Lanari, R. From previous C-band to new X-band SAR systems: Assessment of the DInSAR mapping improvement for deformation time-series retrieval in urban areas. IEEE Trans. Geosci. Remote Sens. 2013, 51, 1973–1984. [Google Scholar] [CrossRef]
- Manzo, M.; Fialko, Y.; Casu, F.; Pepe, A.; Lanari, R. A quantitative assessment of DInSAR measurements of interseismic deformation: The Southern San Andreas Fault case study. Pure Appl. Geophys. 2012, 169, 1463–1482. [Google Scholar] [CrossRef]
- Lanari, R.; Casu, F.; Manzo, M.; Lundgren, P. Application of the SBAS-DInSAR technique to fault creep: A case study of the Hayward fault, California. Remote Sens. Environ. 2007, 109, 20–28. [Google Scholar] [CrossRef]
- Burgmann, R.; Rosen, P.A.; Fielding, E.J. Synthetic aperture radar interferometry to measure Earth’s surface topography and its deformation. Annu. Rev. Earth Planet. Sci. 2000, 28, 169–209. [Google Scholar] [CrossRef]
- Gabriel, K.; Goldstein, R.M.; Zebker, H.A. Mapping small elevation changes over large areas: Differential interferometry. J. Geophys. Res. 1989, 94, 9183–9191. [Google Scholar] [CrossRef]
- Tesauro, M.; Berardino, P.; Lanari, R.; Sansosti, E.; Fornaro, G.; Franceschetti, G. Urban subsidence inside the city of Napoli (Italy) observed by satellite radar interferometry. Geophys. Res. Lett. 2000, 27, 1961–1964. [Google Scholar] [CrossRef]
- Solari, L.; Ciampalini, A.; Raspini, F.; Bianchini, S.; Zinno, I.; Bonano, M.; Manunta, M.; Moretti, S.; Casagli, N. Combined Use of C- and X-Band SAR Data for Subsidence Monitoring in an Urban Area. Geosciences 2017, 7, 21. [Google Scholar] [CrossRef] [Green Version]
- Lanari, R.; De Natale, G.; Berardino, P.; Sansosti, E.; Ricciardi, G.P.; Borgstrom, S.; Capuano, P.; Pingue, F.; Troise, C. Evidence for a peculiar style of ground deformation inferred at Vesuvius volcano. Geophys. Res. Lett. 2002, 29, 6-1–6-4. [Google Scholar] [CrossRef]
- D’Auria, L.; Pepe, S.; Castaldo, R.; Giudicepietro, F.; Macedonio, G.; Ricciolino, P.; Tizzani, P.; Casu, F.; Lanari, R.; Manzo, M.; et al. Magma injection beneath the urban area of Naples: A new mechanism for the 2012–2013 volcanic unrest at Campi Flegrei caldera. Sci. Rep. 2015, 5, 13100. [Google Scholar] [CrossRef] [PubMed] [Green Version]
- Lavecchia, G.; Castaldo, R.; Nardis, R.; De Novellis, V.; Ferrarini, F.; Pepe, S.; Brozzetti, F.; Solaro, G.; Cirillo, D.; Bonano, M.; et al. Ground deformation and source geometry of the 24 August 2016 Amatrice earthquake (Central Italy) investigated through analytical and numerical modeling of DInSAR measurements and structural-geological data. Geophys. Res. Lett. 2016, 43, 12389–12398. [Google Scholar] [CrossRef]
- Scifoni, S.; Bonano, M.; Marsella, M.; Sonnessa, A.; Tagliafierro, V.; Manunta, M.; Lanari, R.; Ojha, C.; Sciotti, M. On the joint exploitation of long-term DInSAR time series and geological information for the investigation of ground settlements in the town of Roma (Italy). Remote Sens. Environ. 2016, 182, 113–127. [Google Scholar] [CrossRef]
- Sansosti, E.; Berardino, P.; Bonano, M.; Calo, F.; Castaldo, R.; Casu, F.; Manunta, M.; Manzo, M.; Pepe, A.; Pepe, S.; et al. How second generation SAR systems are impacting the analysis of ground deformation. Int. J. Appl. Earth Obs. Geoinf. 2014, 28, 1–11. [Google Scholar] [CrossRef] [Green Version]
- Arangio, S.; Calò, F.; Di Mauro, M.; Bonano, M.; Marsella, M.; Manunta, M. An application of the SBAS-DInSAR technique for the assessment of structural damage in the city of Rome. Struct. Infrastruct. Eng. Maint. Manag. Life-Cycle Des. Perform. 2013, 10, 1469–1483. [Google Scholar] [CrossRef]
- Manunta, M.; Marsella, M.; Zeni, G.; Sciotti, M.; Atzori, S.; Lanari, R. Two-scale surface deformation analysis using the SBAS-DInSAR technique: A case study of the city of Rome, Italy. Int. J. Remote Sens. 2008, 29, 1665–1684. [Google Scholar] [CrossRef]
- Sanabria, M.P.; Guardiola-Albert, C.; Tomás, R.; Herrera, G.; Prieto, A.; Sánchez, H.; Tessitore, S. Subsidence activity maps derived from DInSAR data: Orihuela case study. Nat. Hazards Earth Sci. Syst. 2014, 14, 1341–1360. [Google Scholar] [CrossRef] [Green Version]
- Cascini, L.; Ferlisi, S.; Peduto, D.; Fornaro, G.; Manunta, M. Analysis of a subsidence phenomenon via DInSAR data and geotechnical criteria. Ital. Geotech. J. 2007, 41, 50–67. [Google Scholar]
- Cascini, L.; Ferlisi, S.; Fornaro, G.; Lanari, R.; Peduto, D.; Zeni, G. Subsidence monitoring in Sarno urban area via multi-temporal DInSAR technique. Int. J. Remote Sens. 2006, 27, 1709–1716. [Google Scholar] [CrossRef]
- Zebker, H.; Villasenor, J. Decorrelation in interferometric radar echoes. IEEE Trans. Geosci. Remote Sens. 1992, 30, 950–959. [Google Scholar] [CrossRef] [Green Version]
- Liaghat, D. Ponte della Musica: A landmark bridge in Rome. Proc. Inst. Civ. Eng. Bridg. Eng. 2015, 168, 112–122. [Google Scholar] [CrossRef]
- RockWorks17 (Revision 2016.2.18) [Software]; RockWare, Inc.: Golden, CO, USA, 2019; Available online: https://www.rockware.com/product/rockworks/ (accessed on 17 May 2021).
- Stramondo, S.; Bozzano, F.; Marra, F.; Wegmuller, U.; Cinti, F.R.; Moro, M.; Saroli, M. Subsidence induced by urbanisation in the city of Rome detected by advanced InSAR technique and geotechnical investigations. Remote Sens. Environ. 2008, 112, 3160–3172. [Google Scholar] [CrossRef]
- Raspini, F.; Bianchini, S.; Moretti, S.; Loupasakis, C.; Rozos, D.; Duro, J.; Garcia, M. Advanced interpretation of interferometric SAR data to detect, monitor and model ground subsidence: Outcomes from the ESA-GMES Terrafirma project. Nat. Hazards 2016, 83, 155–181. [Google Scholar] [CrossRef]
- Cigna, F.; Lasaponara, R.; Masini, N.; Milillo, P.; Tapete, D. Persistent Scatterer Interferometry Processing of COSMO-SkyMed StripMap HIMAGE Time Series to Depict Deformation of the Historic Centre of Rome, Italy. Remote Sens. 2014, 6, 12593–12618. [Google Scholar] [CrossRef] [Green Version]
- Bozzano, F.; Esposito, C.; Mazzanti, P.; Patti, M.; Scancella, S. Imaging multi-age construction settlement behaviour by advanced SAR interferometry. Remote Sens. 2018, 10, 1137. [Google Scholar] [CrossRef] [Green Version]
- Clough, R.W.; Penzien, J. Dynamics of Structures, 2nd ed.; McGraw-Hill: New York, NY, USA, 1993; p. 738. [Google Scholar]
| Publisher’s Note: MDPI stays neutral with regard to jurisdictional claims in published maps and institutional affiliations. |
© 2021 by the authors. Licensee MDPI, Basel, Switzerland. This article is an open access article distributed under the terms and conditions of the Creative Commons Attribution (CC BY) license (https://creativecommons.org/licenses/by/4.0/).


 ,
, 
