
Hydrothermal Carbonization of Spent Coffee Grounds

Department of Environmental Engineering, Kongju National University, 1223-24 Cheonan-Daero, Seobuk, Cheonan 31080, Chungcheongnam-do, Korea
*
Author to whom correspondence should be addressed.
Appl. Sci. 2021, 11(14), 6542; https://doi.org/10.3390/app11146542
Submission received: 1 July 2021
/
Revised: 11 July 2021
/
Accepted: 12 July 2021
/
Published: 16 July 2021
Abstract
:With increasing coffee production and consumption, the amount of coffee by-product is also increasing. Therefore, there is growing worldwide interest in using these by-products as a renewable energy source. In this study, hydrothermal carbonization was conducted with subcritical water to improve the fuel characteristics of spent coffee grounds. The water content was varied, with the mass ratio between the dry sample and water set to 1:1.5 and 1:4. The reaction temperature was increased by 10 °C from 180 to 250 °C. The fuel and thermal characteristics of the reaction products were investigated through mass and energy yields, elemental, proximate, and heating value analysis. In analysis results, as the reaction temperature increased, carbon and fixed carbon content increased, and oxygen and volatile matter content decreased, resulting in an increase in calorific value. Thermogravimetric analysis, derivative thermogravimetry, and Fourier transform infrared spectroscopy were also conducted on the reaction products. To investigate their storage characteristics, chemical oxygen demand analysis was conducted. The results showed that with increasing reaction temperature, the fixed carbon content and heating value increased; also, the fuel characteristics became similar to those of coal. In addition, the reaction products became more hydrophobic as the reaction temperature increased.

1. Introduction
The production and consumption of coffee is increasing worldwide. Since the 2000s, the popularization of coffee-drinking culture has contributed to the significant growth of the coffee shop market, and there has been a growing demand for various types of coffee products. As shown in Figure 1, the annual coffee imports of South Korea have tended to increase each year, with a total of more than 700,000 tons imported over the last five years [1]. Accordingly, the amount of spent coffee grounds (SCGs), the by-products generated after coffee extraction, has also continuously increased. Although some SCGs are used as compost, most are disposed of through incineration and landfills [2]. Therefore, there has been a growing interest in technologies that use SCGs as a renewable energy source [3].
In particular, the high lipid content and heating value of SCGs have attracted attention in the field of pyrolysis. Thus, studies have been conducted on converting SCGs into fuel, through biodiesel extraction using transesterification, as well as torrefaction, hydrothermal carbonization, and pelletizing [4,5,6]. Among them, the biodiesel extraction process requires various pretreatment steps, such as sample homogenization, drying, and extraction, and the typical carbonization method has a low yield of high-efficiency fuel because of the time and energy required for the drying process. To overcome these shortcomings, there is growing interest in wet processes, that do not require a separate pre-drying process, and hydrothermal carbonization, which is performed at lower temperatures than the typical carbonization process [7,8,9]. Hydrothermal reactions use the strong dissolution property of subcritical water in a high-pressure reactor to produce finer particles by converting organic polymers into low-molecular-weight compounds [10,11]. Subcritical water, in particular, has stronger dissolution characteristics than typical solvents due to the increased ionization of H+ and OH− [12]. In addition, to enhance fuel characteristics, the reaction in which the physical properties of subcritical water depolymerize organic polymers and refine particles by breaking the bonds of elements other than carbon is referred to as a hydrothermal carbonization [8]. The experimental conditions that determine the reaction mechanism include the sample type, reaction temperature, and water content. In particular, the reaction temperature determines the main reaction atmosphere, and hydrothermal reactions are known to be the most active at reaction temperatures between 180 and 250 °C [8,13]. The water content is known to affect the determination of the main reaction among various hydrothermal reactions, such as decomposition and polycondensation reactions, but it is not exactly known which reaction mechanisms are formed by quantitative factors [14,15,16]. According to previous studies, however, sufficient water to submerge samples must be added for the uniform hydrothermal reaction of biomass inside a reactor [8]. As such, in this study, experiments were performed in the 180–250 °C temperature range with only the undried raw material and sufficient water to submerge the sample added to the reactor. These experiments were conducted to compare and investigate the fuel and material characteristics of the hydrothermal carbonization reaction products of SCGs, and their variation with temperature and water content. In addition, elemental analysis, proximate analysis, heating value analysis, thermogravimetric analysis (TGA), derivative thermogravimetry (DTG), and Fourier transform infrared spectroscopy (FT-IR) were conducted. To investigate their storage characteristics, the reaction products were steeped in water for a period of time. The resulting solution was sampled and subjected to chemical oxygen demand (COD) analysis.
2. Materials and Methods
2.1. Experimental Apparatus
Figure 2 shows the reactor used in this study. The reaction temperature was controlled using a PID controller (Parr Instrument Co., Moline, IL, USA), and stirring was performed using a stirrer at the top of the reactor. In addition, a coolant circulation device was installed at the rear end of the reactor to prevent motor overheating during the stirring process. The reactor was a high-pressure reactor (Parr Instrument Co., Moline, IL, USA) with a capacity of 500 mL, maximum temperature of 350 °C, maximum pressure of 20,340 kPa, and maximum stirring speed of 1700 rpm.
2.2. Materials
Table 1 shows the results of proximate analysis, elemental analysis, and heating value analysis for the dry SCG samples used in this study. As shown in Table 1, SCGs were mainly composed of carbon and oxygen, and no sulfur component was detected. This appears to be because SCGs are lignocellulosic biomass. In addition, the proportion of ”other” elements, which were mostly interpreted as inorganic components, was low compared to other types of biomass [7,17]. The proximate analysis results confirmed that the ash content was also low. Moreover, the volatile matter (VM) content was very high compared to that of fixed carbon (FC), and the higher heating value (HHV) was found to be 22.6 MJ/kg.
2.3. Experimental Methods
In hydrothermal reactions, the fuel and material characteristics of the reaction products vary depending on the experimental conditions, such as the sample type, reaction temperature, pressure, and water content [8]. Therefore, in this study, the reaction temperature was increased by 10 °C in the 180–250 °C range, in which hydrothermal reactions are generally known to exhibit high efficiency. For the water content, experiments were performed with only the raw SCGs (40 g) with a water content of 60% (mass ratio between the dry sample and water = 1:1.5) and 40 g of additional water, to sufficiently submerge the sample (mass ratio between the dry sample and water = 1:4). For the reaction pressure, the internal pressure of the high-pressure reactor was measured as the temperature varied.
In addition, to ensure sufficient stirring and reaction time, a residence time of 30 min was provided after each target temperature was reached, and the stirring speed was set to 180 rpm. Each experiment was repeated three times to ensure the reliability of the experimental results. Upon completion of each experiment, the pressure was released through the shut-off valve, and for the reactor was cooled for ten min using the water tank to prevent further reactions. The reaction products were then collected to investigate the changes in the characteristics of SCGs under each experimental conditions. These products were dried at 105 °C for 24 h before elemental analysis, proximate analysis, heating value analysis, TGA, DTG, COD, and FT-IR analysis was conducted. For the heating value analysis, the HHV was measured using a bomb calorimeter (6100 Compensated Jacket Calorimeter, Parr Instrument Co., Moline, IL, USA). Proximate analysis was conducted using an electric furnace in accordance with ASTM D 3175-89 and ASTM 3174-89 [18]. For elemental analysis, C, H, N, O, and S were analyzed using an elemental analyzer (Flash 2000, Thermo Fisher Scientific K.K, Waltham, MA, USA). IR analysis was conducted at room temperature in the 500–4000 cm−1 range at 2 cm−1 intervals using an FT-IR analyzer (Spectrum 100, PerkinElmer, Buckinghamshire, UK) to investigate changes in the chemical structure of the reaction products under each experimental condition. In addition, to investigate the thermal characteristics the thermal characteristics of the reaction products under each experimental condition, TGA/DTG analysis was then conducted with a thermogravimetric analyzer (Pyris 1 TGA, PerkinElmer, Buckinghamshire, UK). The reactor was heated from room temperature to 700 °C at a rate of 5 °C/min in a nitrogen atmosphere, with a flow rate of 20 mL/min. To investigate changes in the storage characteristics of the SCGs’ reaction products under each hydrothermal carbonization condition, the reaction products generated under each experimental condition were steeped in water for approximately 10 min, after which the resulting solution was collected and subjected to COD analysis. After the hydrothermal reactions, the mass and energy yields of the reactant were calculated using the following equations [19]:
3. Results and Discussion
3.1. Mass and Energy Yields
Figure 3 shows the mass and energy yields of SCGs subjected to hydrothermal reactions with varying reaction temperatures and water contents. These values were calculated using Equations (1) and (2) and the heating value analysis results. For both water content conditions, the mass yield decreased as the reaction temperature increased, while the HHV increased. This appears to be because the volatile organic components contained in the SCGs were decomposed in stages as the reaction temperature increased. The energy yield decreased as the reaction temperature increased, because the rate of decrease in mass yield was higher than the rate of increase in HHV, as shown in Figure 3. In particular, changes in mass yield, energy yield, and HHV at a reaction temperature of 250 °C were larger than those at 220–240 °C. This appears to be because the hydrothermal carbonization reaction occurred more rapidly near 250 °C. Because a sharp reduction in mass and energy yields may not be desirable in terms of energy recovery, a reaction temperature between 220 and 240 °C is considered desirable for SCGs’ hydrothermal carbonization.
Figure 3 also shows that slightly higher HHVs and lower mass yield values were obtained with an SCG–water ratio of 1:1.5 than with a ratio of 1:4. The changes in HHV and mass yield indicate changes in the material properties of the sample due to the hydrothermal carbonization reaction. Therefore, the hydrothermal carbonization reaction was judged as more active with a ratio of 1:1.5 than with a ratio of 1:4. However, this is likely due to the temperature control of the reactor rather than the gap of water content. Figure 4 shows the variation in the maximum temperature and pressure with the reaction temperature under each water content condition. Different maximum reaction temperatures and pressures occurred with each water content condition, even though the same stirrer and PID controller were used to maintain a constant temperature in this study. This is likely due to the influence of stirring under each water content condition. In other words, the water content was sufficient for uniform stirring when the SCG–water ratio was 1:4, whereas uniform stirring could not be achieved with a ratio of 1:1.5, owing to the insufficient water content. This caused the actual reaction temperature to be higher than the target value PID controller that was unable to control the temperature sufficiently. Therefore, it appears that with ratio of 1:1.5, the sharp increase in heating value and decrease in mass yield around 250 °C resulted from insufficient temperature control during the reaction.
3.2. Fuel Characteristics
To investigate fuel characteristic changes in hydrothermal carbonized samples [11,20], Figure 5 and Figure 6 and Table 2 and Table 3 show the results of elemental and proximate analysis of the SCGs raw material and reaction products under different conditions. While the carbon and FC contents increased as the reaction temperature increased, as shown in Figure 4, the oxygen and VM contents decreased (Figure 5). This confirmed that the decomposition of volatile oxygen-bearing components during the hydrothermal carbonization of SCGs led to a relative increase in the carbon content. On the other hand, Table 2 and Table 3 show that there was almost no change (less than 1%) in the amount of nitrogen and ash components. The products obtained with a 1:1.5 water content exhibited higher carbon and FC contents than those obtained with the 1:4 condition, but showed lower oxygen and VM contents. In particular, when the SCG–water ratio was 1:1.5, the VM content decreased sharply, while the amount of FC was significantly higher at 250 °C compared to when the ratio was 1:4. This is likely because the maximum reaction temperature was more influenced by the reaction temperature control process rather than by the water content, as mentioned previously. Table 2 and Table 3 show that similar to the reaction temperature, the water content had no effect on the nitrogen and ash contents.
To investigate changes in the fuel characteristics of the SCGs reaction products subjected to hydrothermal reactions, the O/C and H/C ratios were determined for the reaction products produced with different reaction temperatures and water content (Figure 7). At both water contents, the O/C and H/C ratios decreased as the reaction temperature increased, with the 1:1.5 condition resulting in lower values than the 1:4 condition under most temperature conditions. In particular, the O/C ratio was more affected by the water content than the H/C ratio. This is likely, as the elemental analysis results in Table 2 and Table 3 show, because there was hardly any change in the hydrogen content with increasing reaction temperature, at both water content conditions, while the increase in carbon content and the decrease in oxygen content.
Figure 8 shows the Van Krevelen diagram [21], in which the properties of H/C and O/C ratios of the raw material used in this study were compared with those of the hydrothermally carbonized reaction products and coal that the properties of the SCGs reaction products gradually became more similar to those of coal as the reaction temperature increased, owing to a reduction in both the O/C and H/C ratios. Figure 9 shows the correlations between the carbon and hydrogen contents and the HHV of the hydrothermally carbonized SCGs reaction products. From Figure 9, the coefficient of determination (R2) for the linear regression analysis of the correlations between the carbon and hydrogen contents and HHV was found to be 0.6356 for carbon and 0.2396 for hydrogen at an SCG–water ratio of 1:1.5, and 0.8025 for carbon and 0.1466 for hydrogen at a ratio of 1:4. This indicates that the HHV of the reaction product is more affected by the carbon content than by the hydrogen content [22].
3.3. TGA/DTG, FT-IR, and COD Analysis
To investigate how hydrothermal reactions change the thermal characteristics of SCGs reaction products, TGA and DTG analysis was performed on the raw material and hydrothermally carbonized reaction products. The results are shown in Figure 10. The TGA results in Figure 10a,b show an increase in the amount of residue after analysis with increasing reaction temperature. This appears to be because the components that decompose at high temperatures became concentrated, as the components that decompose at low temperatures were decomposed and removed by subcritical water. The DTG results in Figure 10a,b, as well as TGA/DTG analysis of lignocellulosic biomass in previous studies, indicate that at both water content conditions, the DTG cellulose peak between 300 and 350 °C decreased as the temperature increased, while the hemicellulose peak near 200 °C tended to increase [23,24]. Therefore, it was confirmed that as the reaction temperature increased, the proportion of the hemicellulose component increased as the cellulose component was decomposed.
Figure 11 shows the FT-IR spectra of the raw materials and the hydrothermally carbonized reaction products. In Figure 11a,b, the peak in the 3500–3200 cm−1 range that represents O-H bond stretching inside cellulose [25] tended to decrease as the reaction temperature increased. This appears to be because the OH-containing components inside the SCGs were decomposed and removed by subcritical water as the reaction temperature increased. In particular, the peak representing OH was more clearly reduced when the SCG–water ratio was 1:1.5, probably because the decomposition of OH-containing components increased as the maximum reaction temperature was significantly higher with the reduced water content, due to the process insufficient reactor temperature control, as mentioned in Section 2.1. The peaks in the 2900 and 2800 cm−1 regions, which represent the stretching of aliphatic C-H bonds in cellulose and hemicellulose, and the peaks in the 1700 and 1600 cm−1 regions, which represent the C=C and C=O stretching of lignin series, hardly changed. This is because the hemicellulose content, which is the main component of SCGs, was relatively increased due to the pyrolysis of cellulose, and the hydrothermal carbonization temperature set in this study was too low for the sufficient pyrolysis of the lignin component [4,26,27].
In this study, COD analysis was performed to investigate changes in the storage characteristics of the hydrothermally carbonized reaction products, and the results are shown in Figure 12. Samples of the solution were recovered after steeping the reaction products in water. With an SCG–water ratio of 1:1.5, this solution exhibited very low COD compared to the solution obtained with a ratio of 1:4. Thus, the reaction products hydrothermally carbonized with the 1:1.5 ratio were less affected by the reaction temperature than those produced with a ratio of 1:4 in terms of storage characteristics. From Figure 11, it was confirmed that the 1:1.5 condition resulted in a larger reduction in the OH component, which is closely related to reactions involving water, than the 1:4 condition. In addition, the COD decreased as the reaction temperature increased under the 1:4 condition. This confirmed that under uniform stirring, the reaction products of hydrothermally carbonized SCGs gradually changed from hydrophilic to hydrophobic, as the reaction temperature increased. In addition, as with previous research results, this occurrence verified that slightly soluble macromolecular organic matters in sludge gradually hydrolyzed micromolecular organic matters with increasing temperature and pressure [28].
4. Conclusions
In this study, hydrothermal carbonization experiments were performed at various reaction temperatures and with two different water contents, using SCGs as the raw material. The reaction temperature was increased by 10 °C from 180 to 250 °C. An SCG to water ratio of 1:1.5 was used in the first test, in which SCG with a water content of approximately 60% was used without being dried. A second water ratio of 1:4, in which samples were sufficiently submerged, was also tested. As the reaction temperature increased, the mass and energy yields decreased, but the HHV increased. This is probably because the volatile organic components that constitute SCGs were decomposed in stages as the reaction temperature increased. Reaction products produced with an SCG–water ratio of 1:1.5 exhibited slightly higher HHVs and lower mass yields than those produced with a ratio of 1:4. This indicates that the hydrothermal carbonization reaction was more active when the SCG–water ratio was 1:1.5 than when the ratio was 1:4. However, this appears to be due to the influence of the temperature control of the reactor rather than the influence of the water content. In addition, the elemental and proximate analysis showed that the oxygen and VM contents decreased, but the carbon and FC contents increased as the reaction temperature increased, with both the 1:1.5 and 1:4 water contents. This confirmed that the carbon content became concentrated, as volatile components containing oxygen were decomposed first during the hydrothermal carbonization of SCGs. The O/C and H/C ratios were examined to investigate changes in fuel characteristics under each condition. With both water content ratios, the O/C and H/C ratios decreased as the reaction temperature increased, indicating that the fuel characteristics were becoming similar to those of coal. In addition, the carbon and hydrogen contents and heating values were found to be more affected by the carbon content than by the hydrogen content. The results of TGA and DTG analysis results showed that the high-temperature components in the SCGs became concentrated as the low-temperature components were decomposed by hydrothermal reactions and removed with the discharge of water vapor as the reaction temperature increased. It was also confirmed that hemicellulose became concentrated as the cellulose components decomposed. FT-IR and COD analysis confirmed that the properties of the hydrothermally carbonized reaction products gradually changed from hydrophilic to hydrophobic as the reaction temperature increased, due to the decomposition and removal of OH-containing components.
Author Contributions
S.-C.O. (corresponding author) and H.-J.K. are responsible for the idea formulation, project development, and research preparation. H.-J.K. is responsible for the experimental work, while all authors are equally responsible for data analysis, manuscript preparation, proofreading, and submission of the manuscript. S.-C.O. is the corresponding author of the manuscript. All authors have read and agreed to the published version of the manuscript.
Funding
This research was funded by the Technology Innovation Program (No.20015401) funded by the Ministry of Trade, Industry, and Energy (MOTIE, Korea), and the research grant of the Waste to Energy Recycling Human Resource Development Project of Korea Ministry of Environment (ME).
Institutional Review Board Statement
Not applicable.
Informed Consent Statement
Not applicable.
Data Availability Statement
Not applicable.
Acknowledgments
This work was supported by the Technology Innovation Program (No.20015401) funded by the Ministry of Trade, Industry, and Energy (MOTIE, Korea), and the research grant of the Waste to Energy Recycling Human Resource Development Project of Korea Ministry of Environment (ME).
Conflicts of Interest
The authors declare no conflict of interest.
Abbreviations
| SCGs | Spent coffee grounds |
| TGA | Thermogravimetric analysis |
| DTG | Derivative thermogravimetry |
| FT-IR | Fourier transform infrared spectroscopy |
| HHV | Higher heating value |
| VM | Volatile matter |
| FC | Fixed carbon |
| COD | Chemical oxygen demand |
References
- Korea Customs Service. Coffee Market in South Korea with Coffee Trade; Korea Customs Service: Daejeon, Korea, 2021.
- Bok, J.P.; Choi, H.S.; Choi, Y.S.; Park, H.C.; Kim, S.J. Fast Pyrolysis of Coffee Grounds: Characteristics of Product Yields and Biocrude Oil Quality. Energy 2012, 47, 17–24. [Google Scholar] [CrossRef]
- Campos-Vega, R.; Loarca-Piña, G.; Vergara-Castañeda, H.A.; Oomah, B.D. Spent Coffee Grounds: A Review on Current Research and Future Prospects. Trends Food Sci. Technol. 2015, 45, 24–36. [Google Scholar] [CrossRef]
- Kondamudi, N.; Mohapatra, S.K.; Misra, M. Spent Coffee Grounds as a Versatile Source of Green Energy. J. Agric. Food Chem. 2008, 56, 11757–11760. [Google Scholar] [CrossRef] [PubMed]
- Vakalis, S.; Moustakas, K.; Benedetti, V.; Cordioli, E.; Patuzzi, F.; Loizidou, M.; Baratieri, M. The “COFFEE BIN” Concept: Centralized Collection and Torrefaction of Spent Coffee Grounds. Environ. Sci. Pollut. Res. Int. 2019, 26, 35473–35481. [Google Scholar] [CrossRef] [PubMed]
- Li, X.; Strezov, V.; Kan, T. Energy Recovery Potential Analysis of Spent Coffee Grounds Pyrolysis Products. J. Anal. Appl. Pyrol. 2014, 110, 79–87. [Google Scholar] [CrossRef]
- Afolabi, O.O.D.; Sohail, M.; Cheng, Y.L. Optimisation and Characterisation of Hydrochar Production from Spent Coffee Grounds by Hydrothermal Carbonisation. Renew. Energy 2020, 147, 1380–1391. [Google Scholar] [CrossRef]
- Funke, A.; Ziegler, F. Hydrothermal Carbonization of Biomass: A Summary and Discussion of Chemical Mechanisms for Process Engineering. Biofuels Bioprod. Bioref. 2010, 4, 160–177. [Google Scholar] [CrossRef]
- Wang, Y.; Qiu, L.; Zhu, M.; Sun, G.; Zhang, T.; Kang, K. Comparative Evaluation of Hydrothermal Carbonization and Low Temperature Pyrolysis of Eucommia Ulmoides Oliver for the Production of Solid Biofuel. Sci. Rep. 2019, 9, 5535. [Google Scholar] [CrossRef] [Green Version]
- Yang, T.; Liu, X.; Li, R.; Li, B.; Kai, X. Hydrothermal Liquefaction of Sewage Sludge to Produce Bio-Oil: Effect of Co-Pretreatment with Subcritical Water and Mixed Surfactants. J. Supercrit. Fluids 2019, 144, 28–38. [Google Scholar] [CrossRef]
- Lynam, J.G.; Coronella, C.J.; Yan, W.; Reza, M.T.; Vasquez, V.R. Acetic Acid and Lithium Chloride Effects on Hydrothermal Carbonization of Lignocellulosic Biomass. Bioresour. Technol. 2011, 102, 6192–6199. [Google Scholar] [CrossRef]
- Toor, S.S.; Rosendahl, L.; Rudolf, A. Hydrothermal Liquefaction of Biomass: A Review of Subcritical Water Technologies. Energy 2011, 36, 2328–2342. [Google Scholar] [CrossRef]
- Siskin, M.; Katritzky, A.R. Reactivity of Organic Compounds in Hot Water: Geochemical and Technological Implications. Science 1991, 254, 231–237. [Google Scholar] [CrossRef]
- Henge, M.H.; Macko, S.A. (Eds.) Organic. Geochemistry; Plenum Press: New York, NY, USA, 1993; Volume 23, pp. 72–419. [Google Scholar]
- Bobleter, O. Hydrothermal Degradation of Polymers Derived from Plants. Prog. Polym. Sci. 1994, 19, 797–841. [Google Scholar] [CrossRef]
- Mok, W.S.L.; Antal, M.J.; Szabo, P.; Varhegyi, G.; Zelei, B. Formation of Charcoal from Biomass in a Sealed Reactor. Ind. Eng. Chem. Res. 1992, 31, 1162–1166. [Google Scholar] [CrossRef]
- Kim, H.J.; Park, C.; Nepal, R.; Oh, S.C. Hydrothermal Treatment of Empty Fruit Bunches to Enhance Fuel Characteristics. Energies 2021, 14, 1467. [Google Scholar] [CrossRef]
- Parikh, J.; Channiwala, S.A.; Ghosal, G.K. A Correlation for Calculating Elemental Composition from Proximate Analysis of Biomass Materials. Fuel 2007, 86, 1710–1719. [Google Scholar] [CrossRef]
- Kim, D.; Lee, K.; Park, K. Hydrothermal Carbonization of Sewage Sludge for Solid Recovered Fuel and Energy Recovery. J. Korean Soc. Water Wastewater 2015, 29, 57–63. [Google Scholar] [CrossRef]
- Kabakcı, S.B.; Baran, S.S. Hydrothermal Carbonization of Various Lignocellulosics: Fuel Characteristics of Hydrochars and Surface Characteristics of Activated Hydrochars. Waste Manag. 2019, 100, 259–268. [Google Scholar] [CrossRef]
- Park, D.K.; Song, E. Pressurized Pyrolysis Characteristics of Two Ranks of Coal in a Thermogravimetric Analyzer. J. Energy Eng. 2017, 143, 04017017. [Google Scholar] [CrossRef]
- Uemura, Y.; Matsumoto, R.; Saadon, S.; Matsumura, Y. A Study on Torrefaction of Laminaria Japonica. Fuel Process. Technol. 2015, 138, 133–138. [Google Scholar] [CrossRef]
- Yang, H.; Yan, R.; Chen, H.; Zheng, C.; Lee, D.H.; Liang, D.T. In-Depth Investigation of Biomass Pyrolysis Based on Three Major Components: Hemicellulose, Cellulose and Lignin. Energy Fuels 2006, 20, 388–393. [Google Scholar] [CrossRef]
- Gan, M.J.; Lim, W.S.; Ng, H.X.; Ong, M.H.; Gan, S.; Lee, L.Y.; Thangalazhy-Gopakumar, S. Enhancement of Palm Kernel Shell Fuel Properties via Wet Torrefaction: Response Surface, Optimization, and Combustion Studies. Energy Fuels 2019, 33, 11009–11020. [Google Scholar] [CrossRef]
- Stevanic, J.S.; Salmén, L. Characterizing Wood Polymers in the Primary Cell Wall of Norway Spruce (Picea abies (L.) Karst.) Using Dynamic FT-IR Spectroscopy. Cellulose 2008, 15, 285–295. [Google Scholar] [CrossRef]
- Wang, P.; Zhang, J.; Shao, Q.; Wang, G. Physicochemical Properties Evolution of Chars from Palm Kernel Shell Pyrolysis. J. Therm. Anal. Calorim. 2018, 133, 1271–1280. [Google Scholar] [CrossRef]
- Park, J.; Meng, J.; Lim, K.H.; Rojas, O.J.; Park, S. Transformation of Lignocellulosic Biomass During Torrefaction. J. Anal. Appl. Pyrol. 2013, 100, 199–206. [Google Scholar] [CrossRef]
- Xu, X.; Jiang, E. Treatment of urban sludge by hydrothermal carbonization. Bioresour. Technol. 2017, 238, 182–187.26. [Google Scholar] [CrossRef]
Figure 1.
Coffee imports from 2015 to 2020 in South Korea.
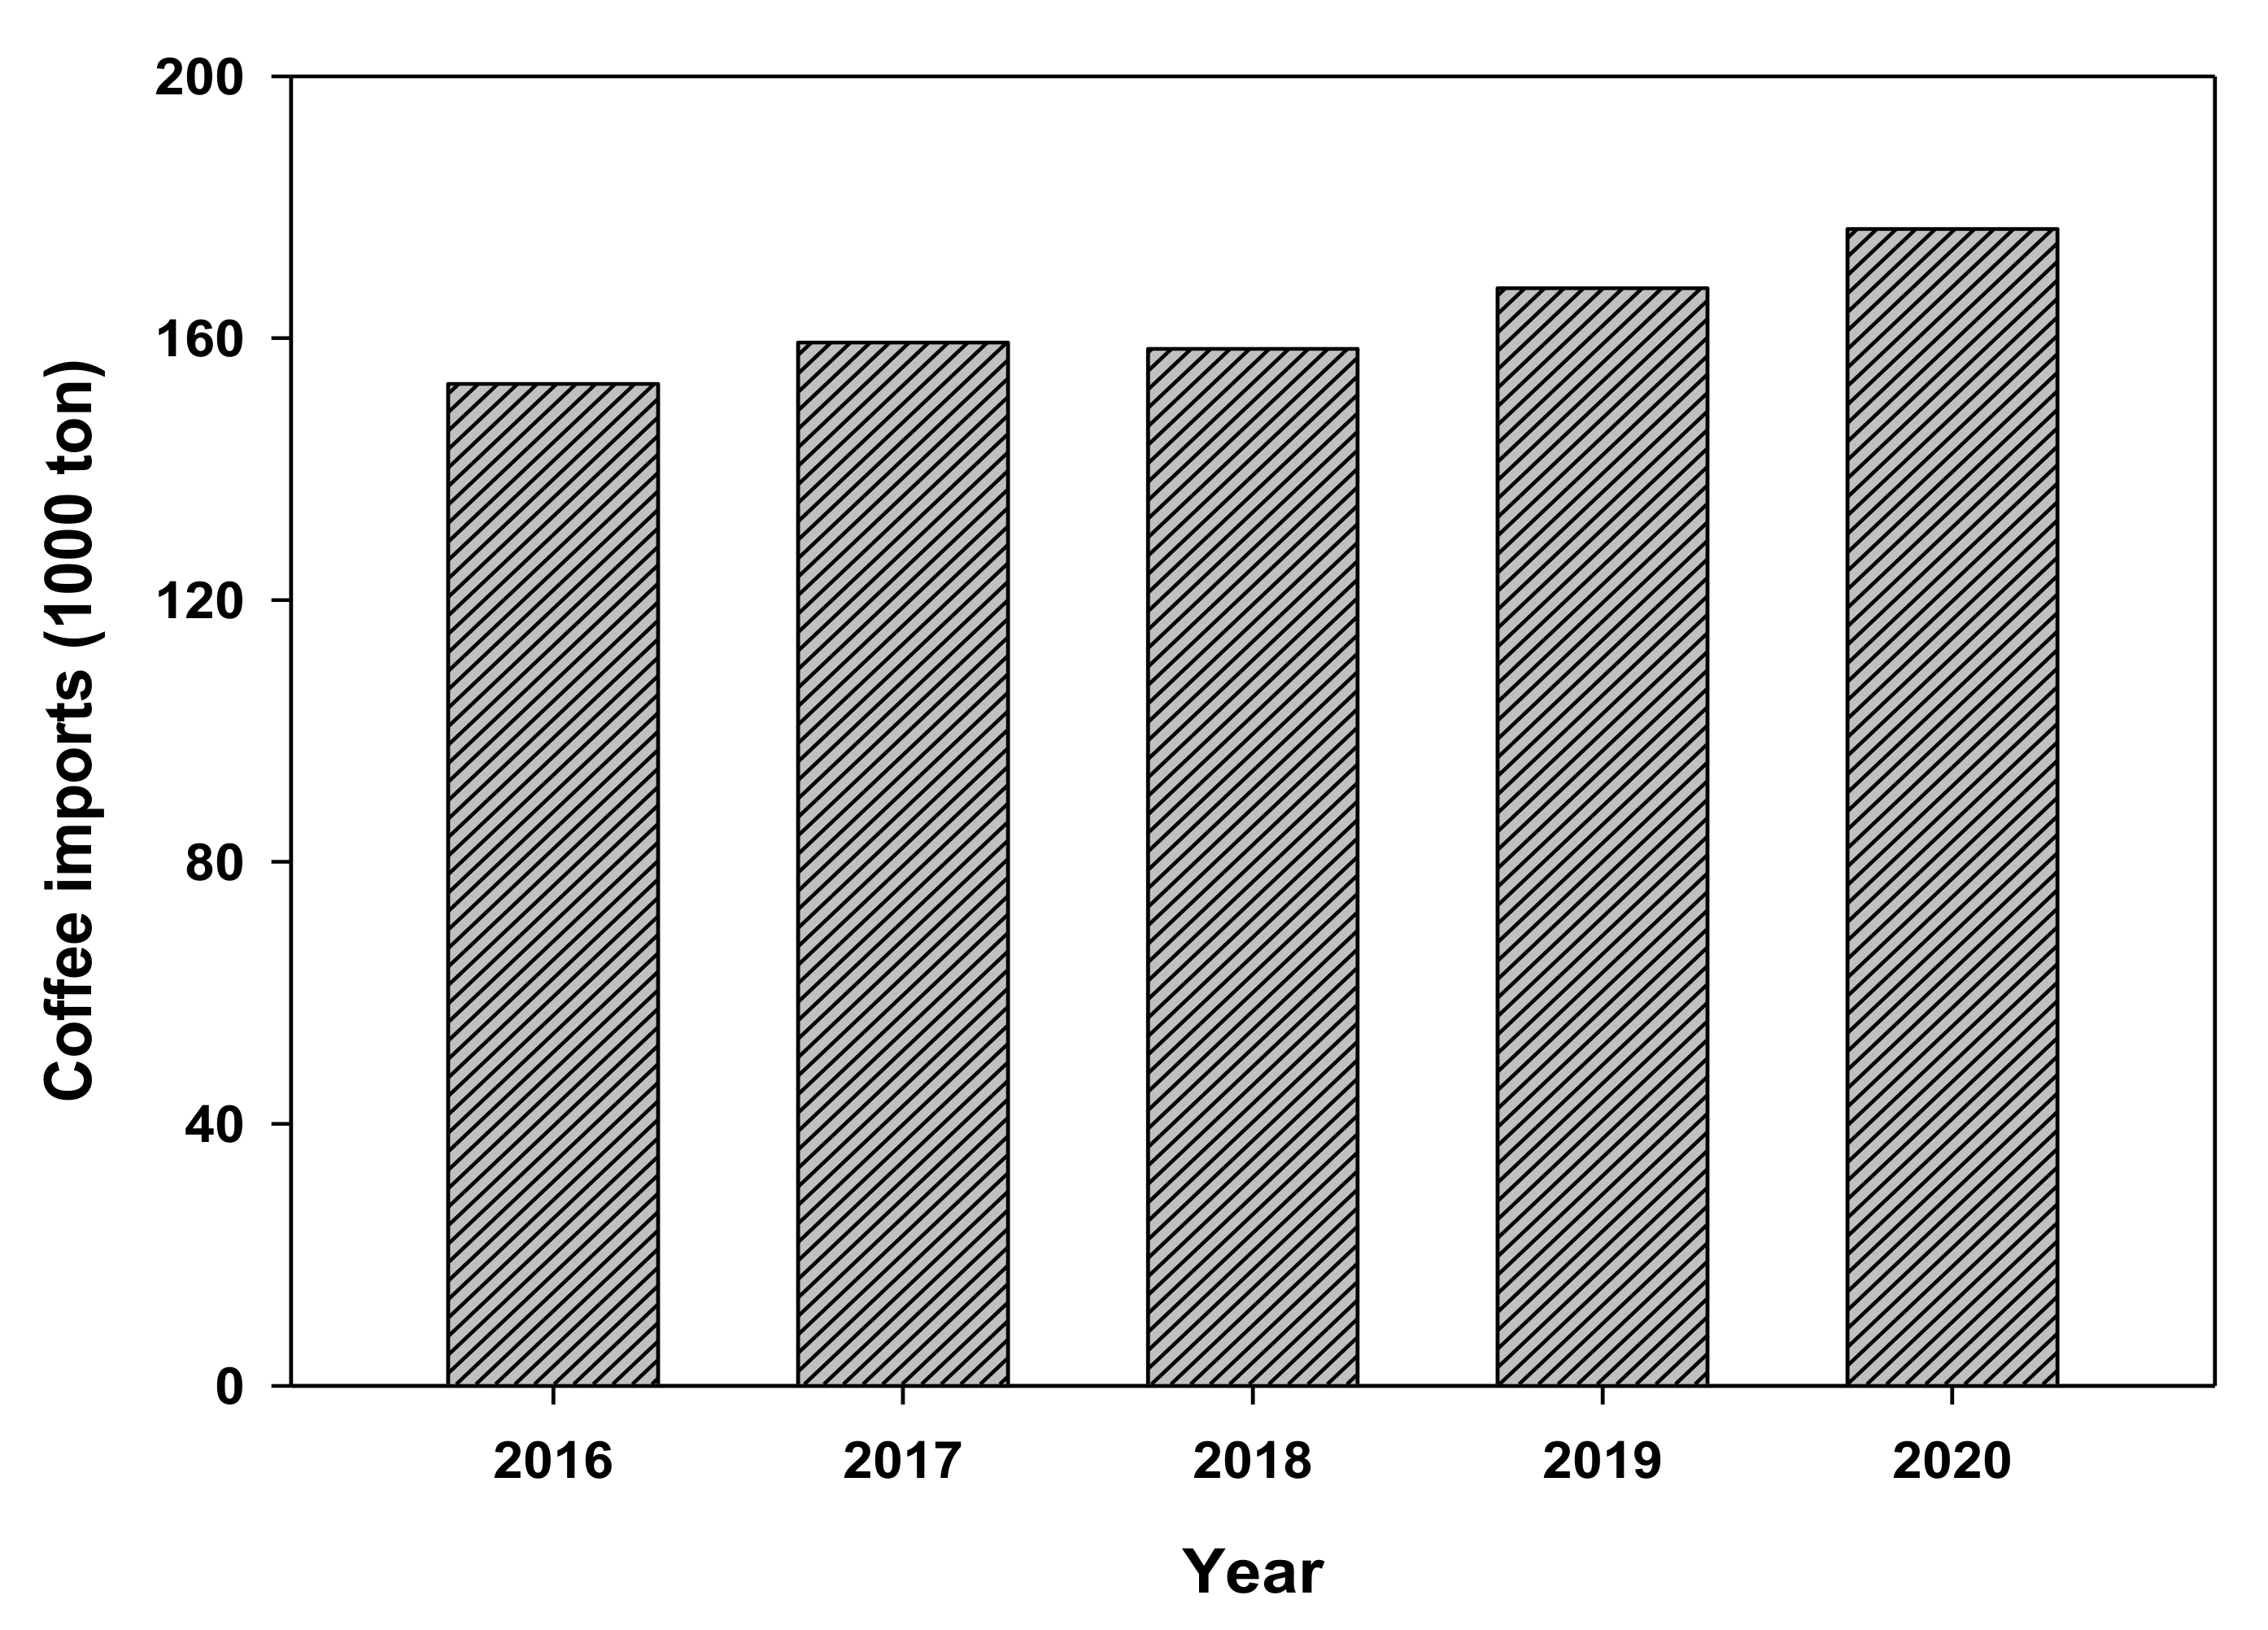
Figure 2.
Schematic diagram of the hydrothermal carbonization experimental apparatus used in this study.
Figure 2.
Schematic diagram of the hydrothermal carbonization experimental apparatus used in this study.

Figure 3.
Variation of mass yield (MY), energy yield (EY), and higher heating value (HHV) of solid coffee grounds (SCGs) with different reaction temperatures and water contents.
Figure 3.
Variation of mass yield (MY), energy yield (EY), and higher heating value (HHV) of solid coffee grounds (SCGs) with different reaction temperatures and water contents.
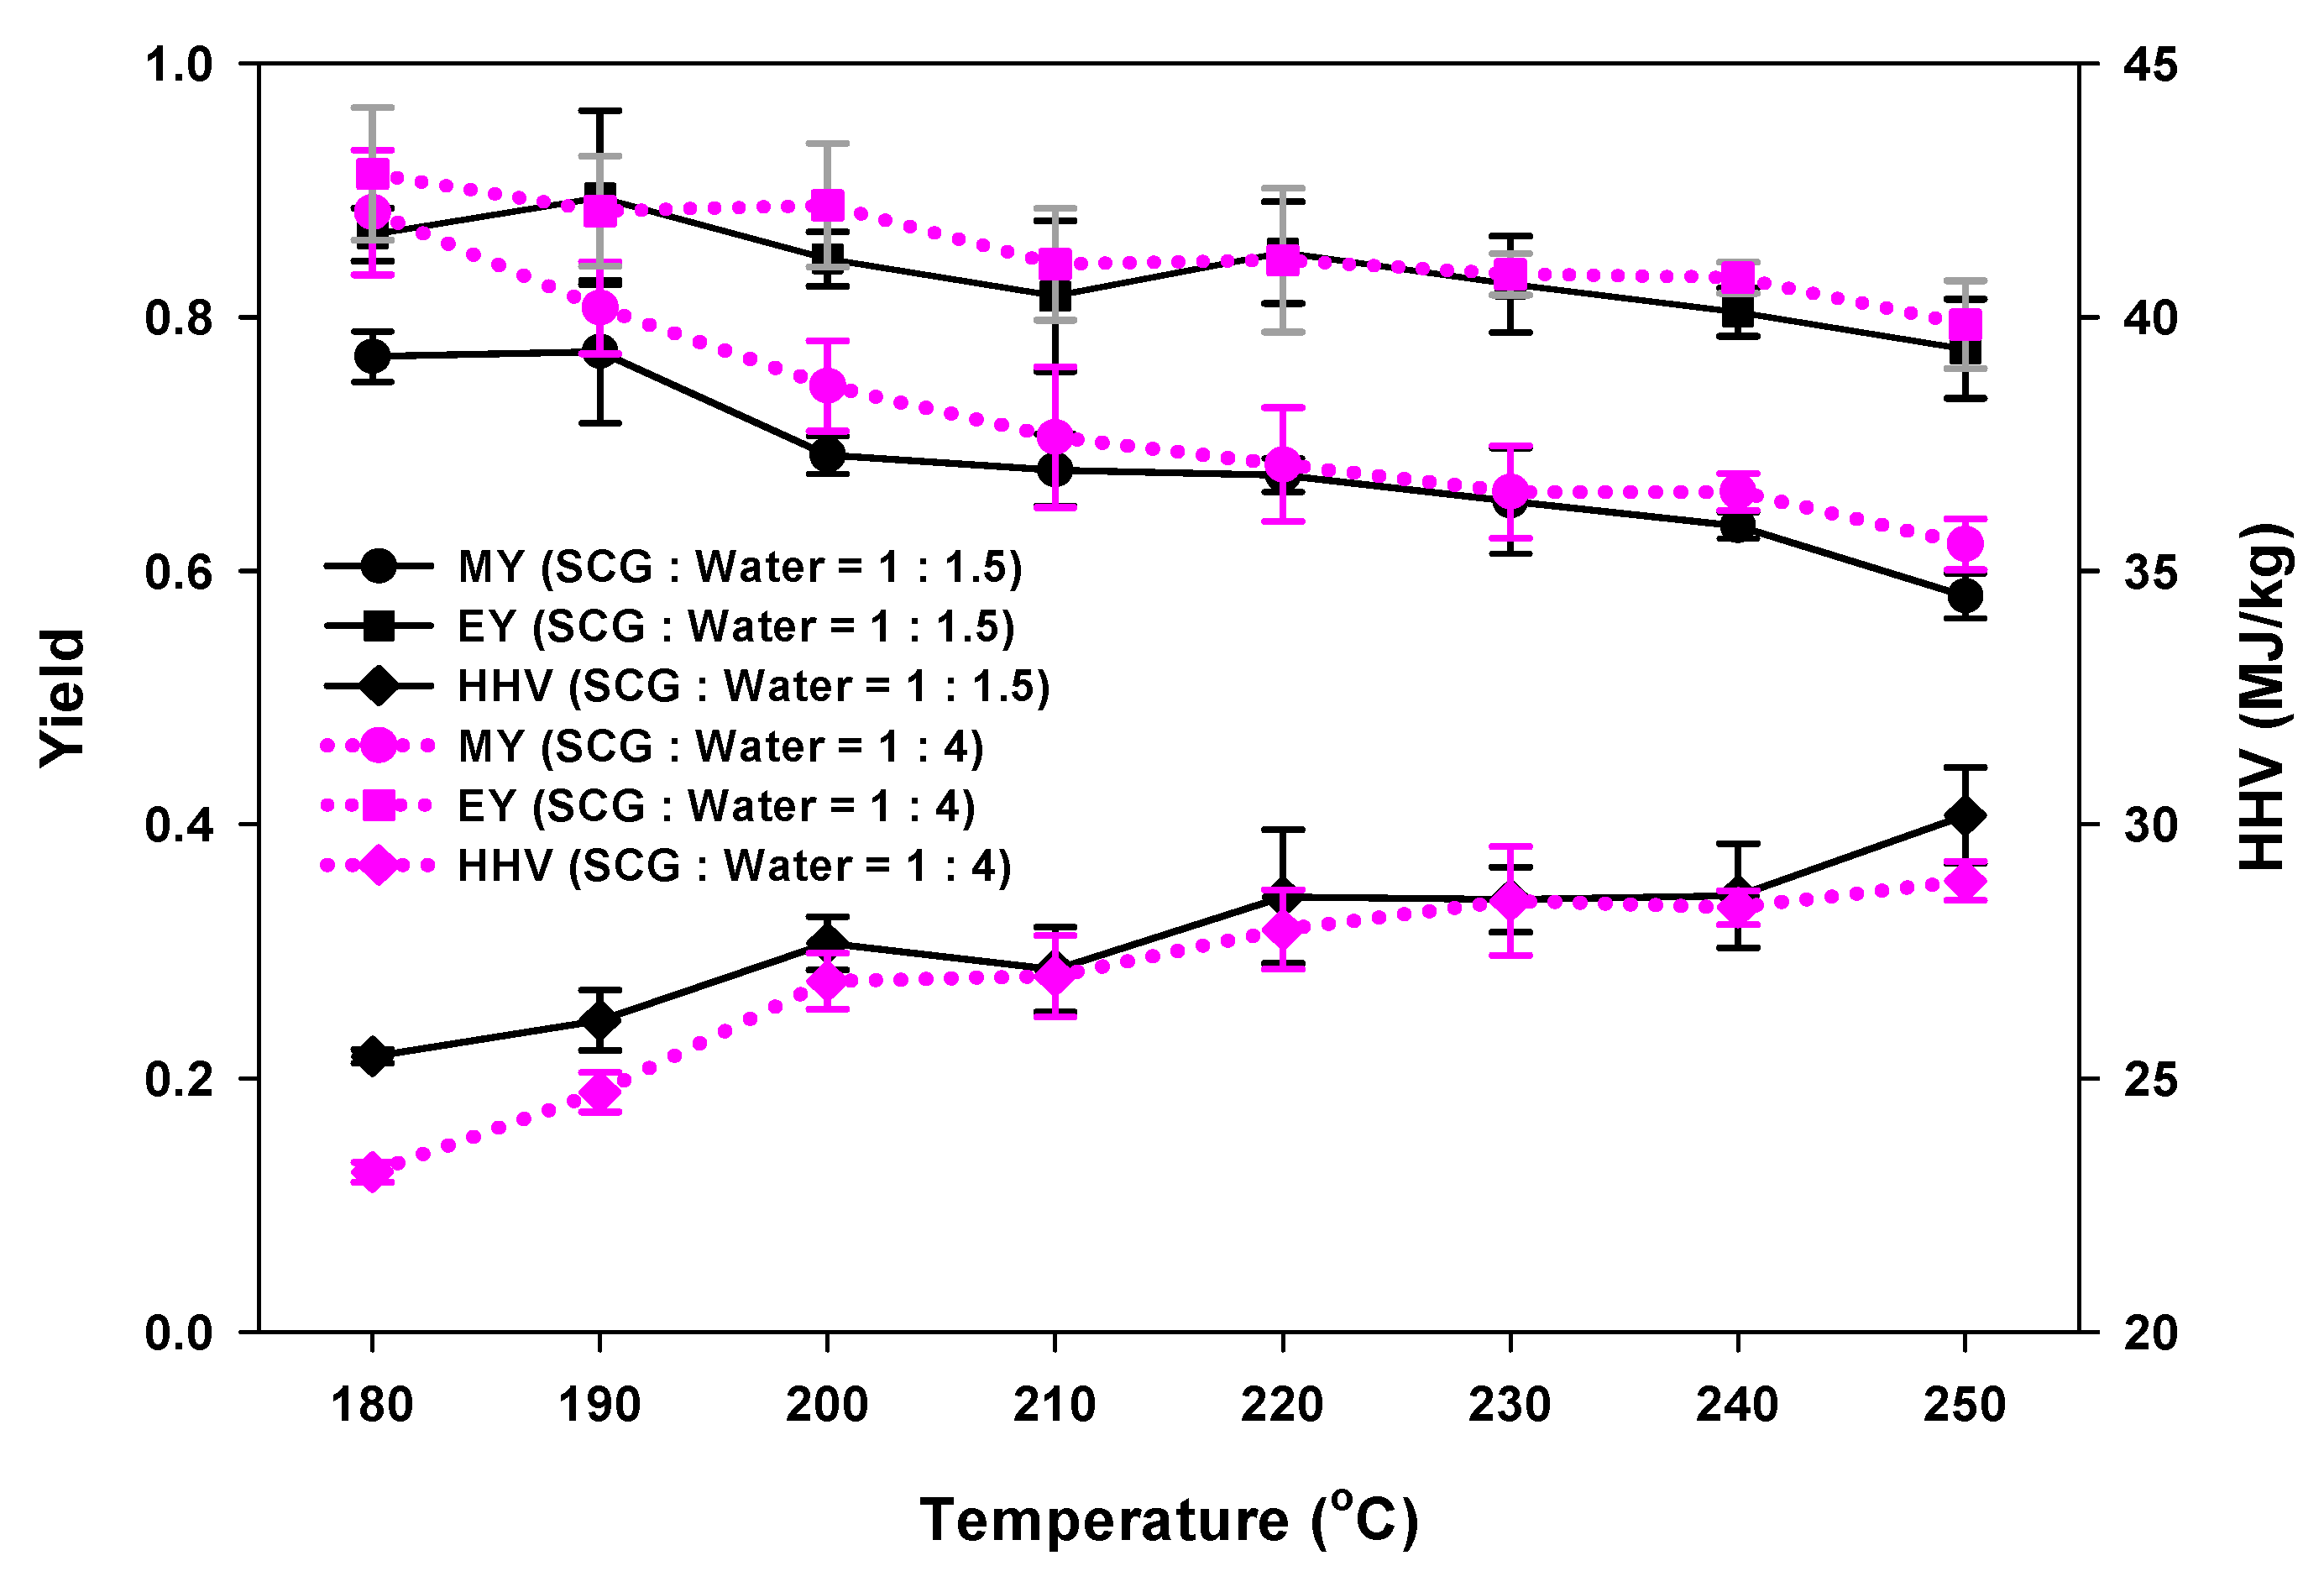
Figure 4.
Change in pressure with reaction temperature for different water contents.
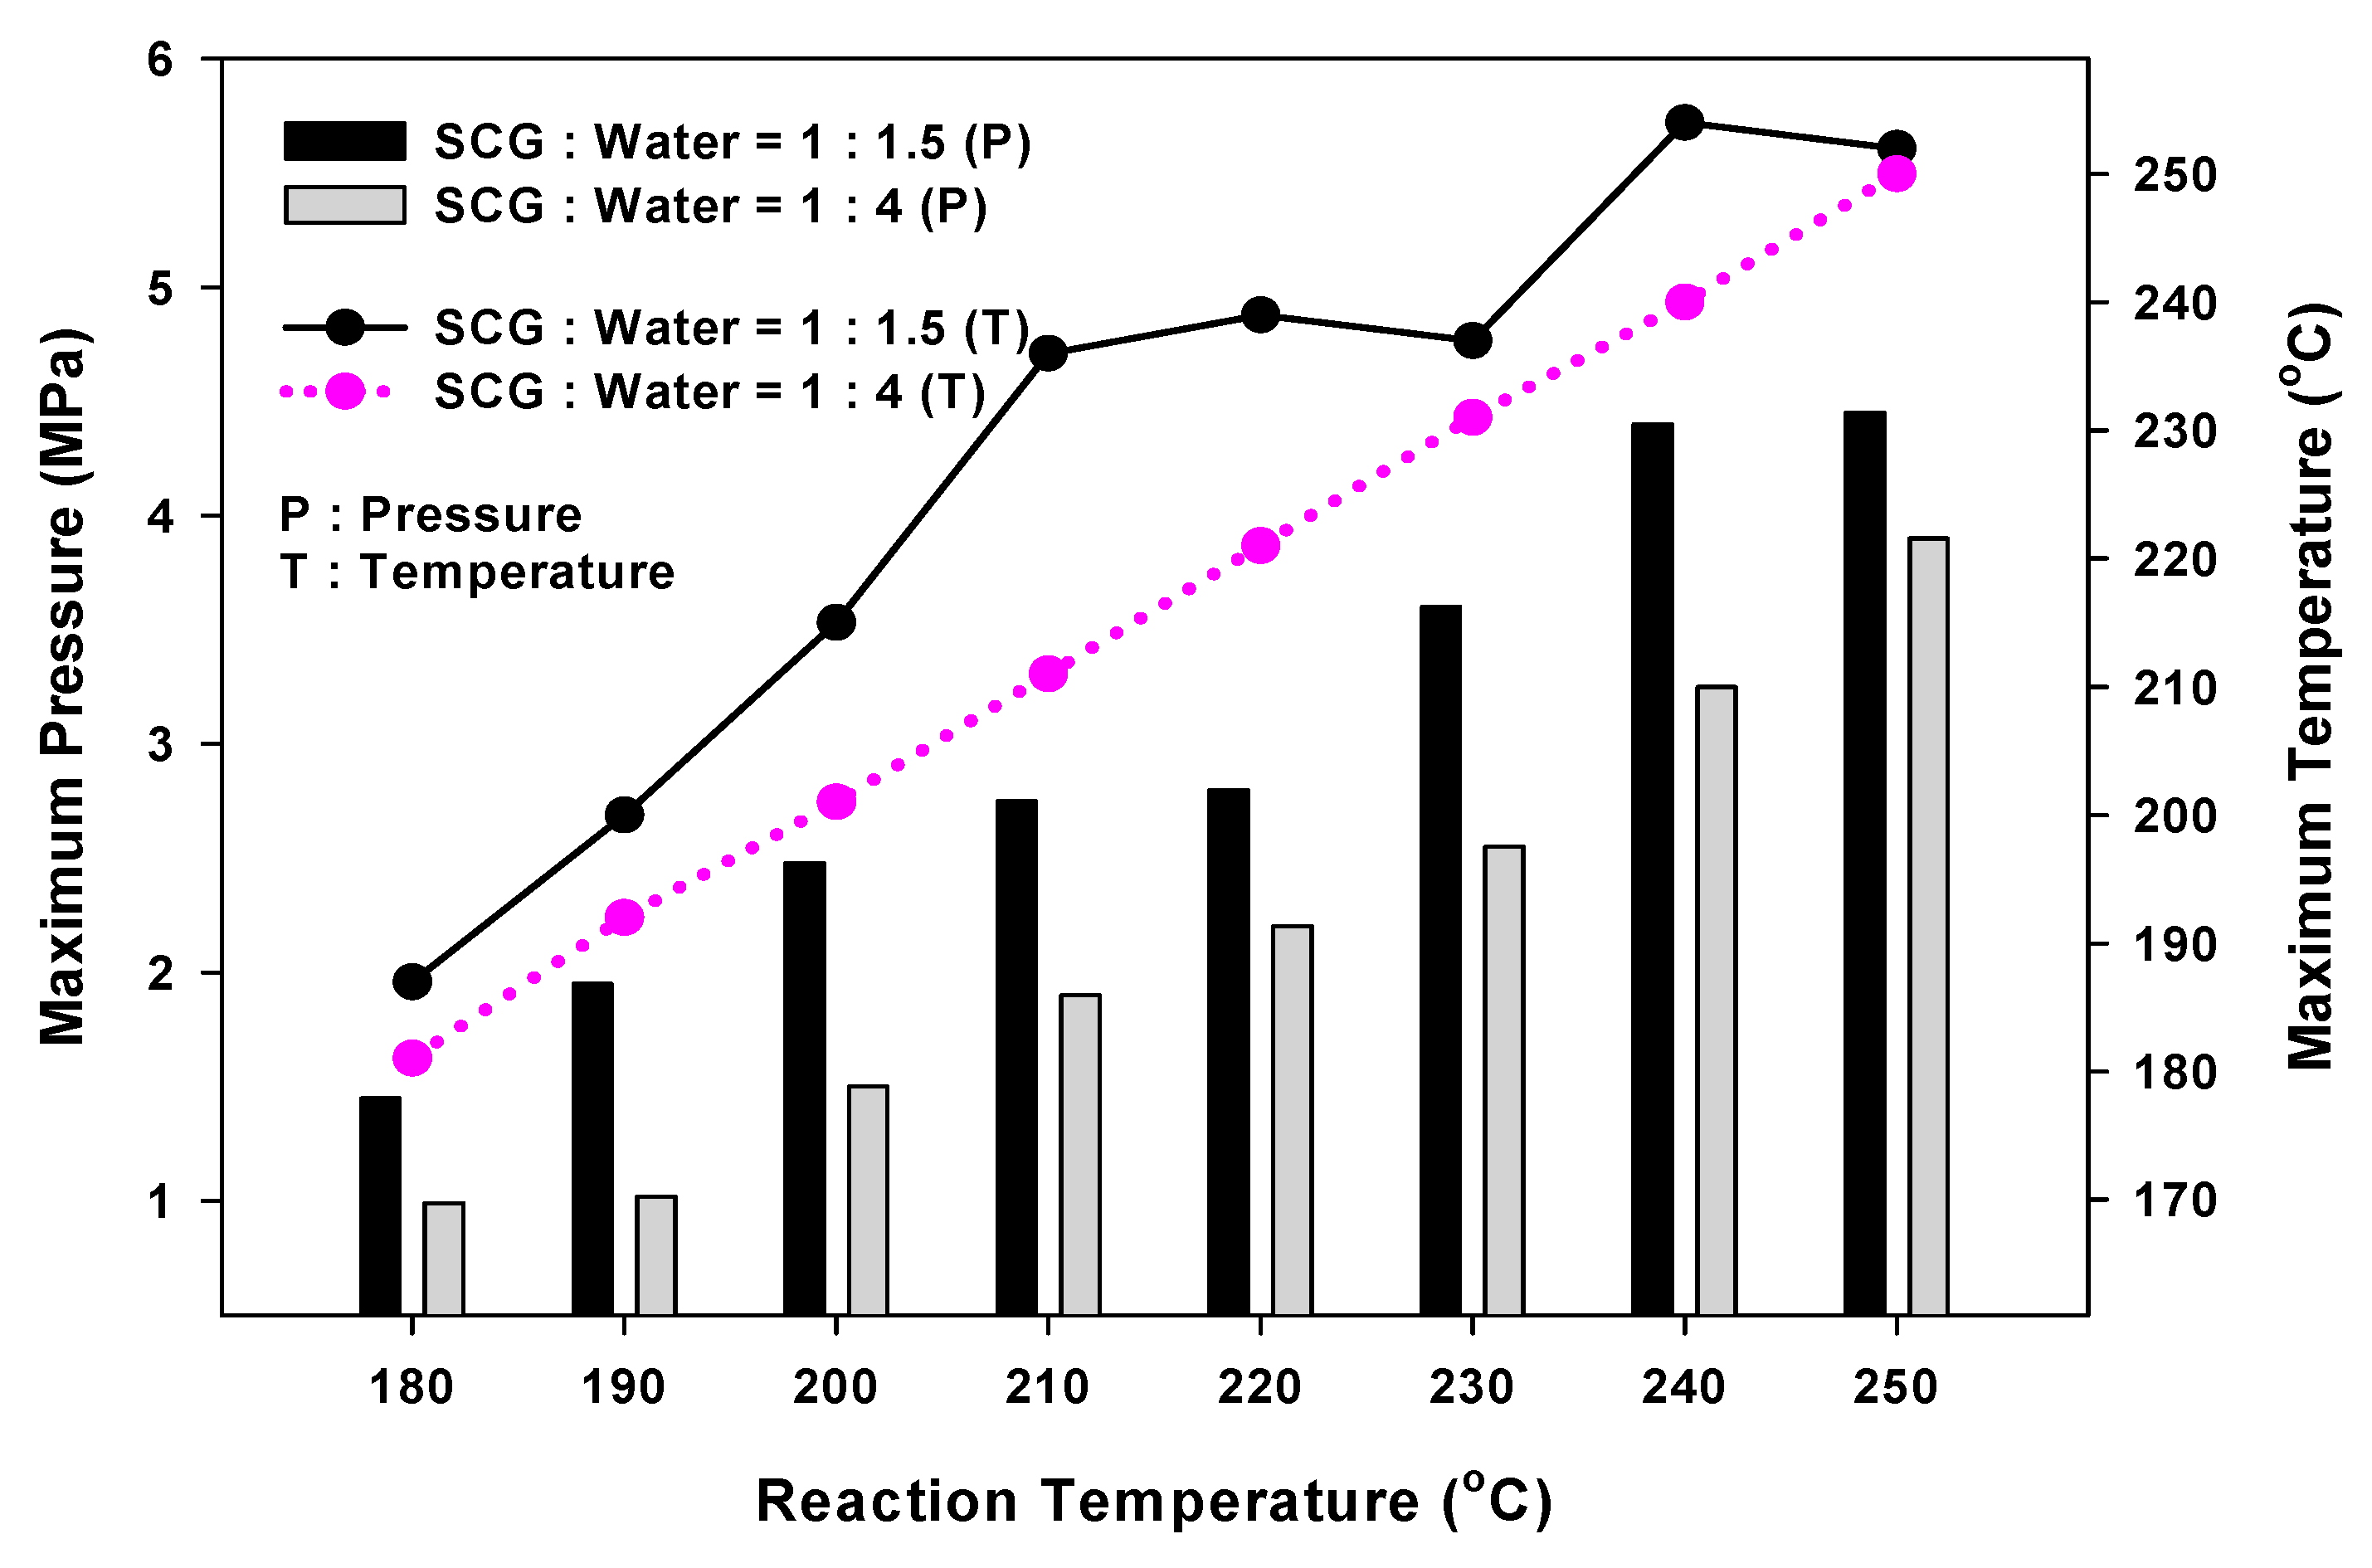
Figure 5.
Amount of carbon and fixed carbon compounds in SCGs produced with different reaction temperatures and water contents.
Figure 5.
Amount of carbon and fixed carbon compounds in SCGs produced with different reaction temperatures and water contents.
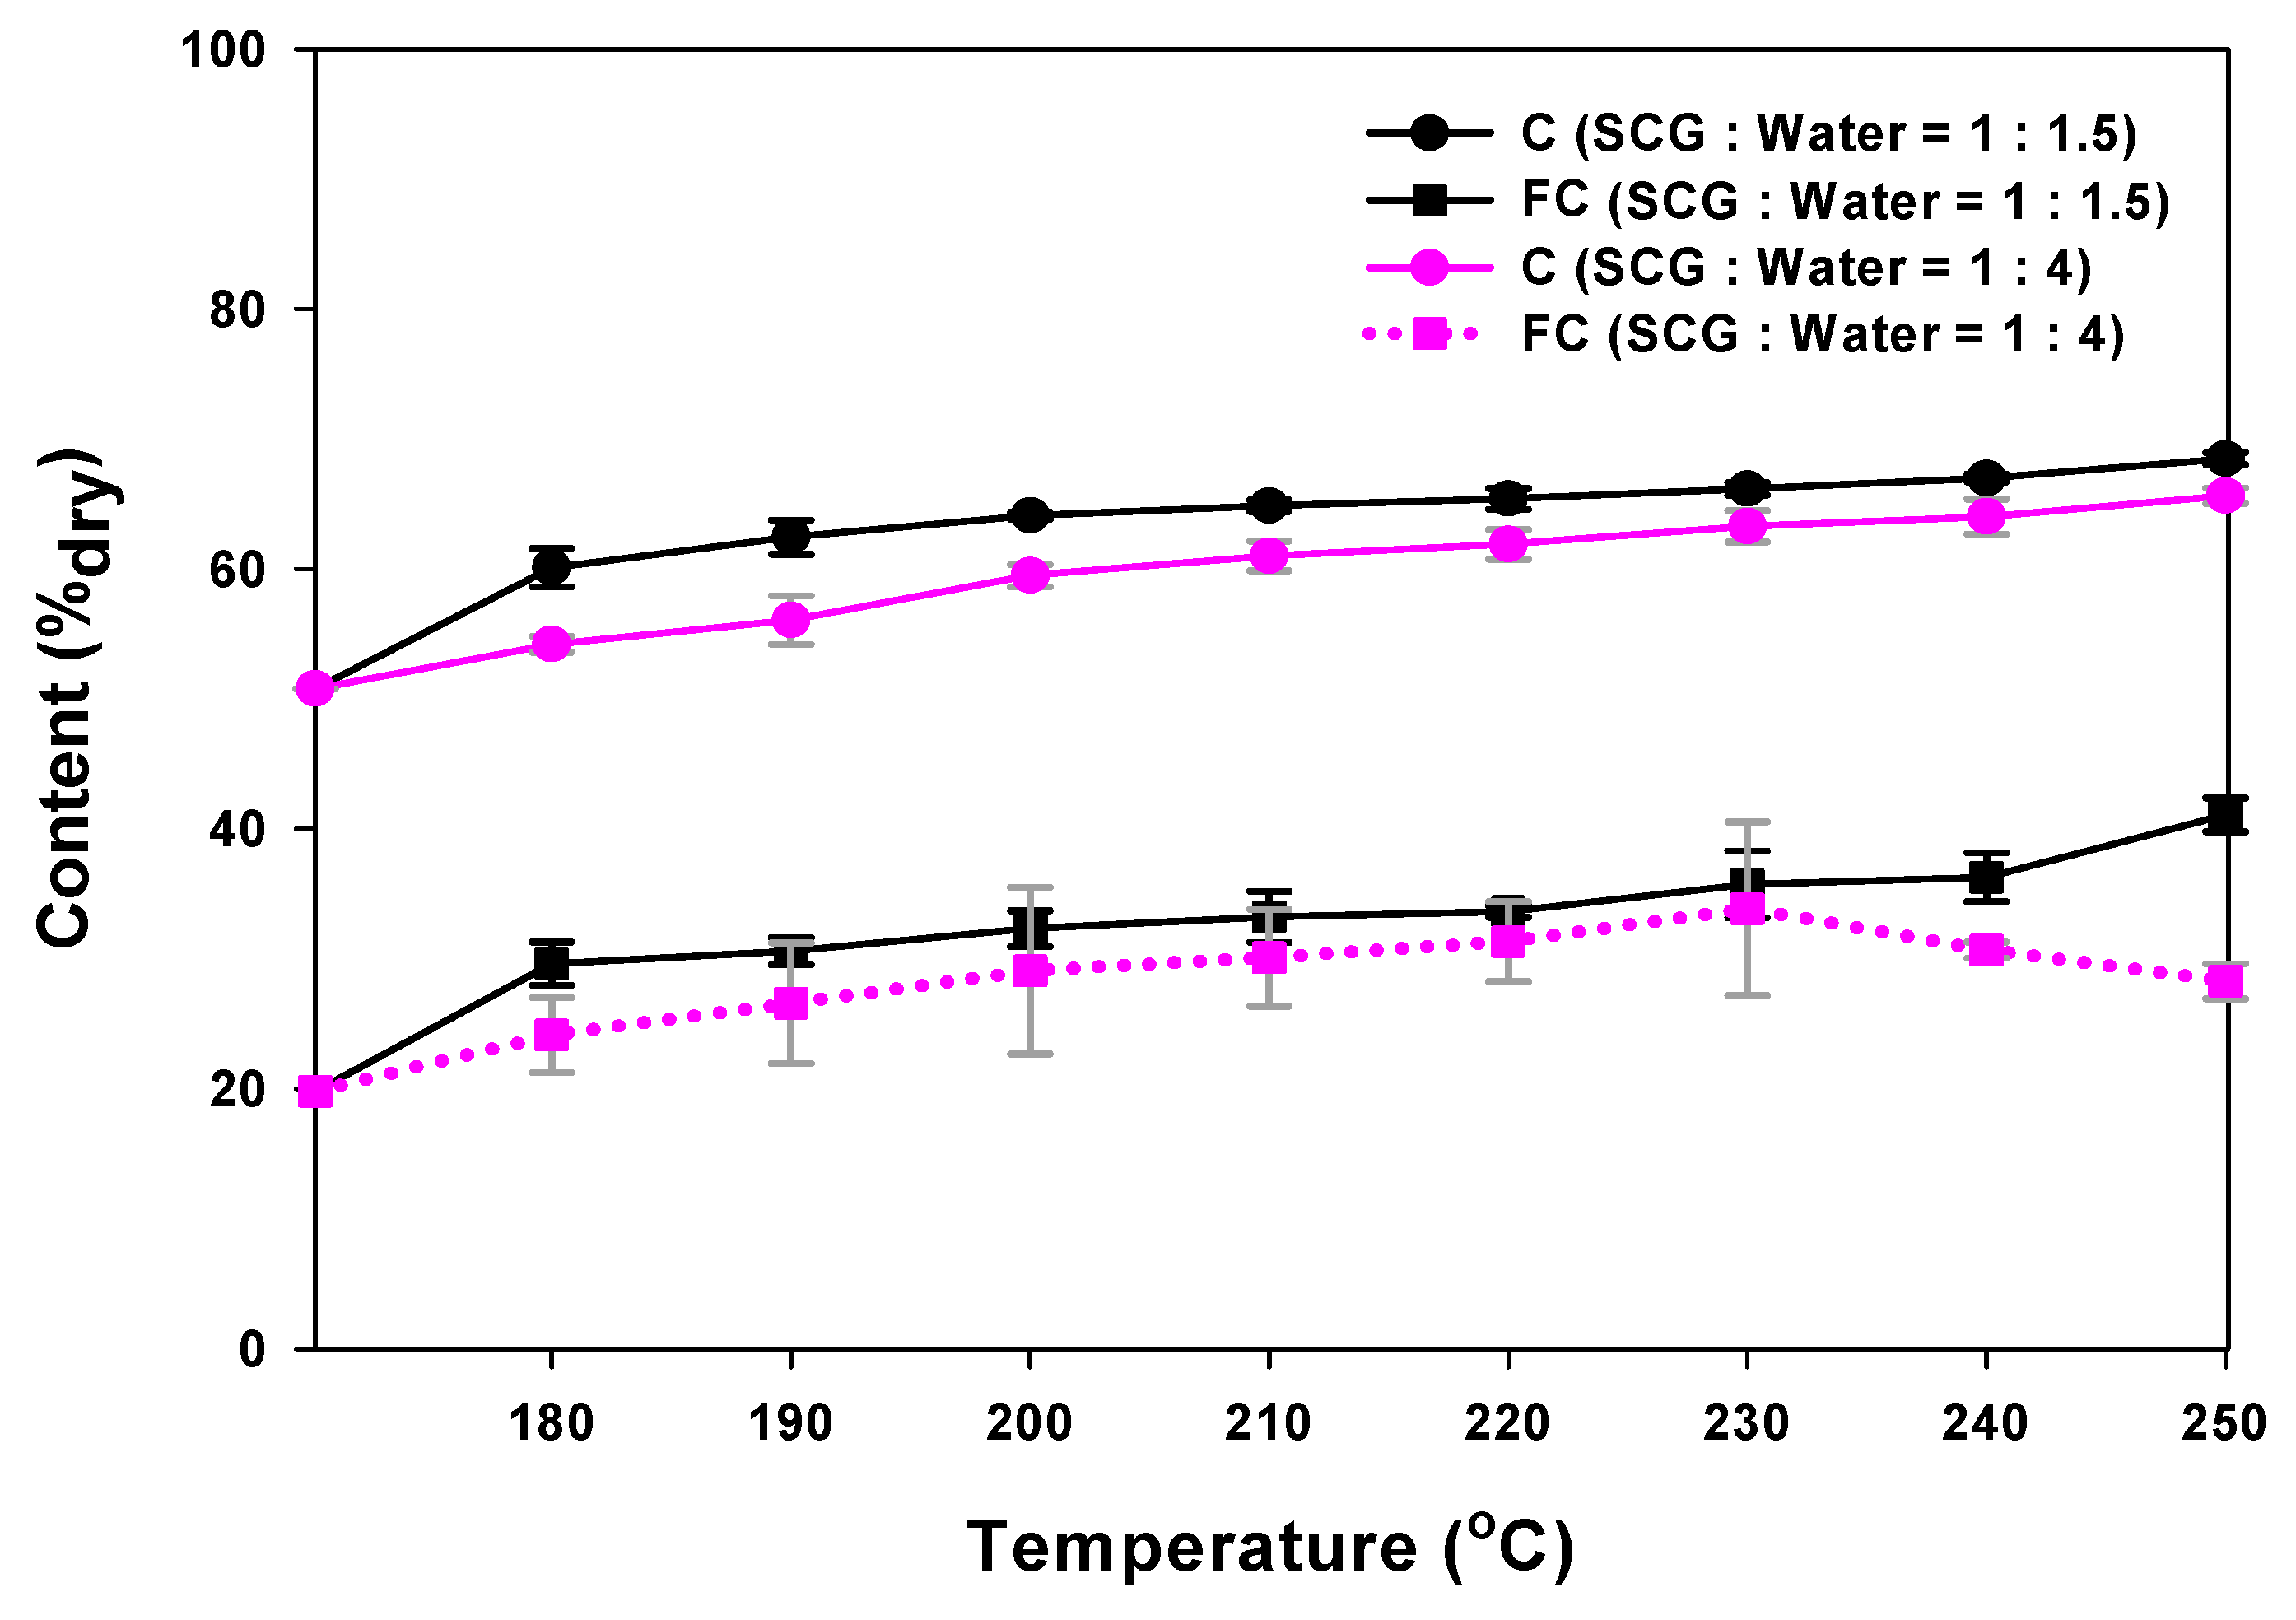
Figure 6.
Oxygen and volatile organic compound (VOC) contents of SCGs produced with different reaction temperatures and water contents.
Figure 6.
Oxygen and volatile organic compound (VOC) contents of SCGs produced with different reaction temperatures and water contents.
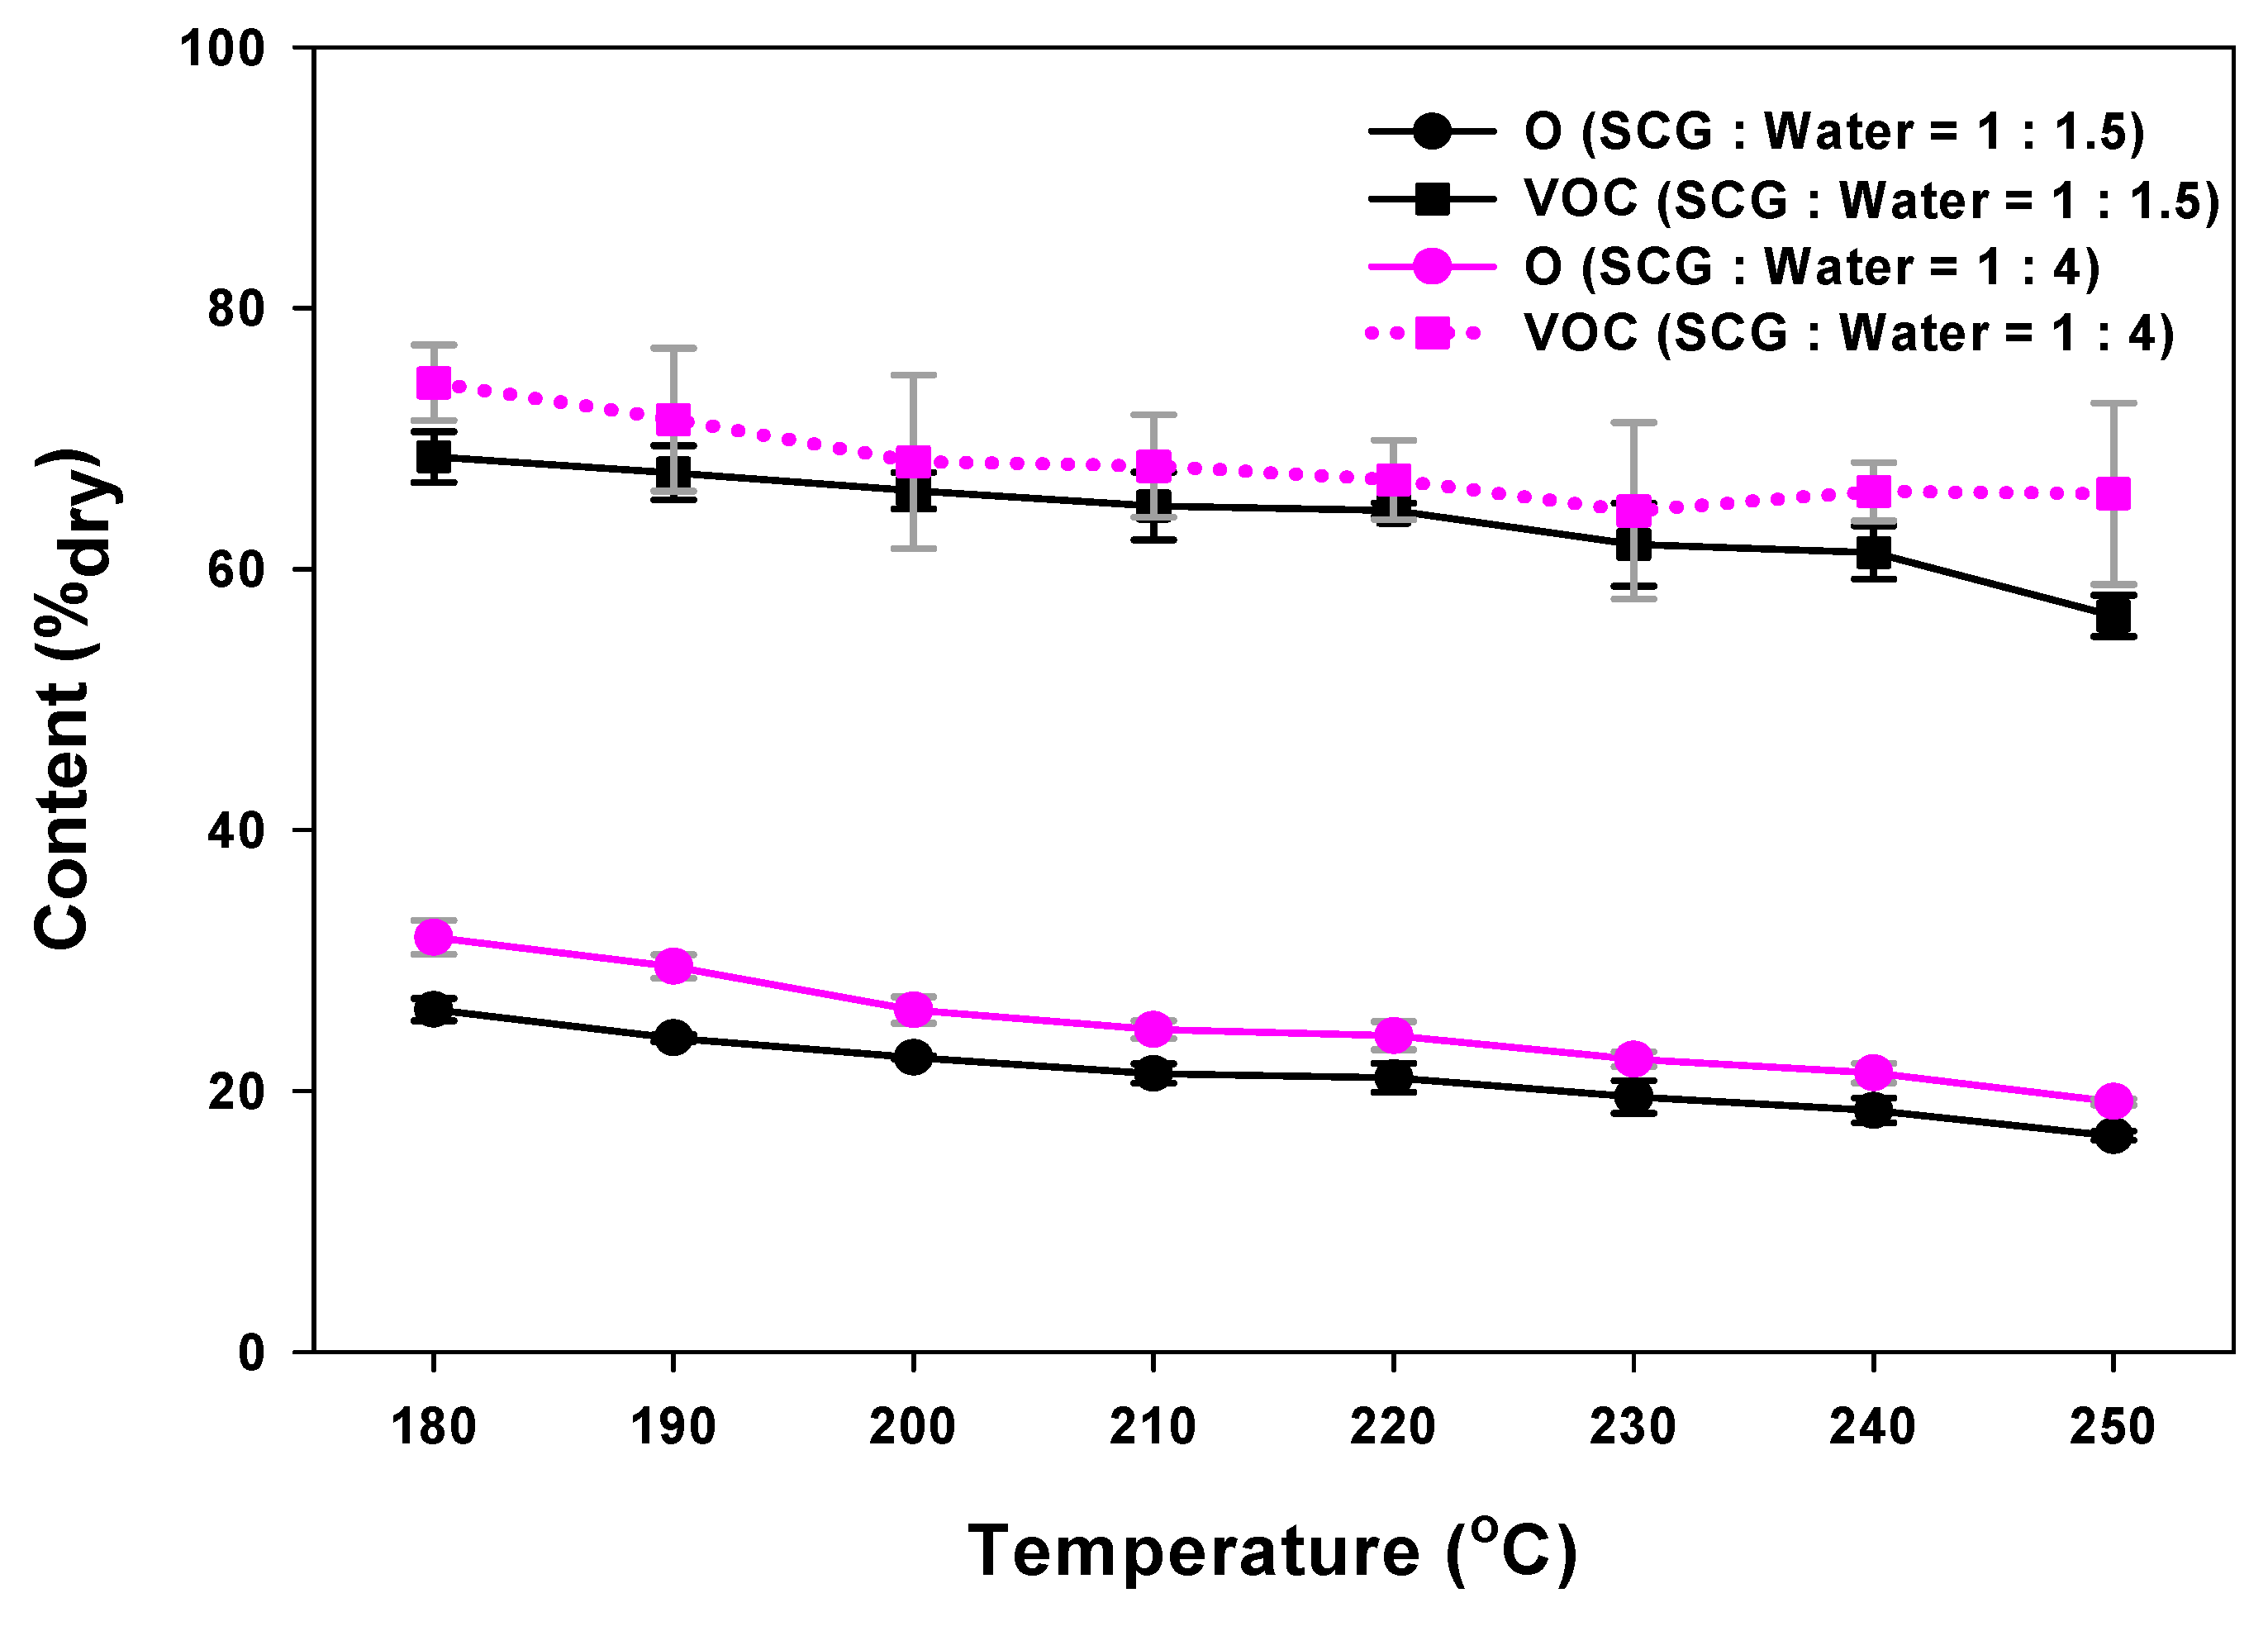
Figure 7.
O/C and H/C ratios of SCGs hydrothermally carbonized with different reaction temperatures and water contents.
Figure 7.
O/C and H/C ratios of SCGs hydrothermally carbonized with different reaction temperatures and water contents.

Figure 8.
Van Krevelen diagram of raw material, coal, and hydrothermally carbonized SCGs produced with different reaction temperatures and water contents.
Figure 8.
Van Krevelen diagram of raw material, coal, and hydrothermally carbonized SCGs produced with different reaction temperatures and water contents.
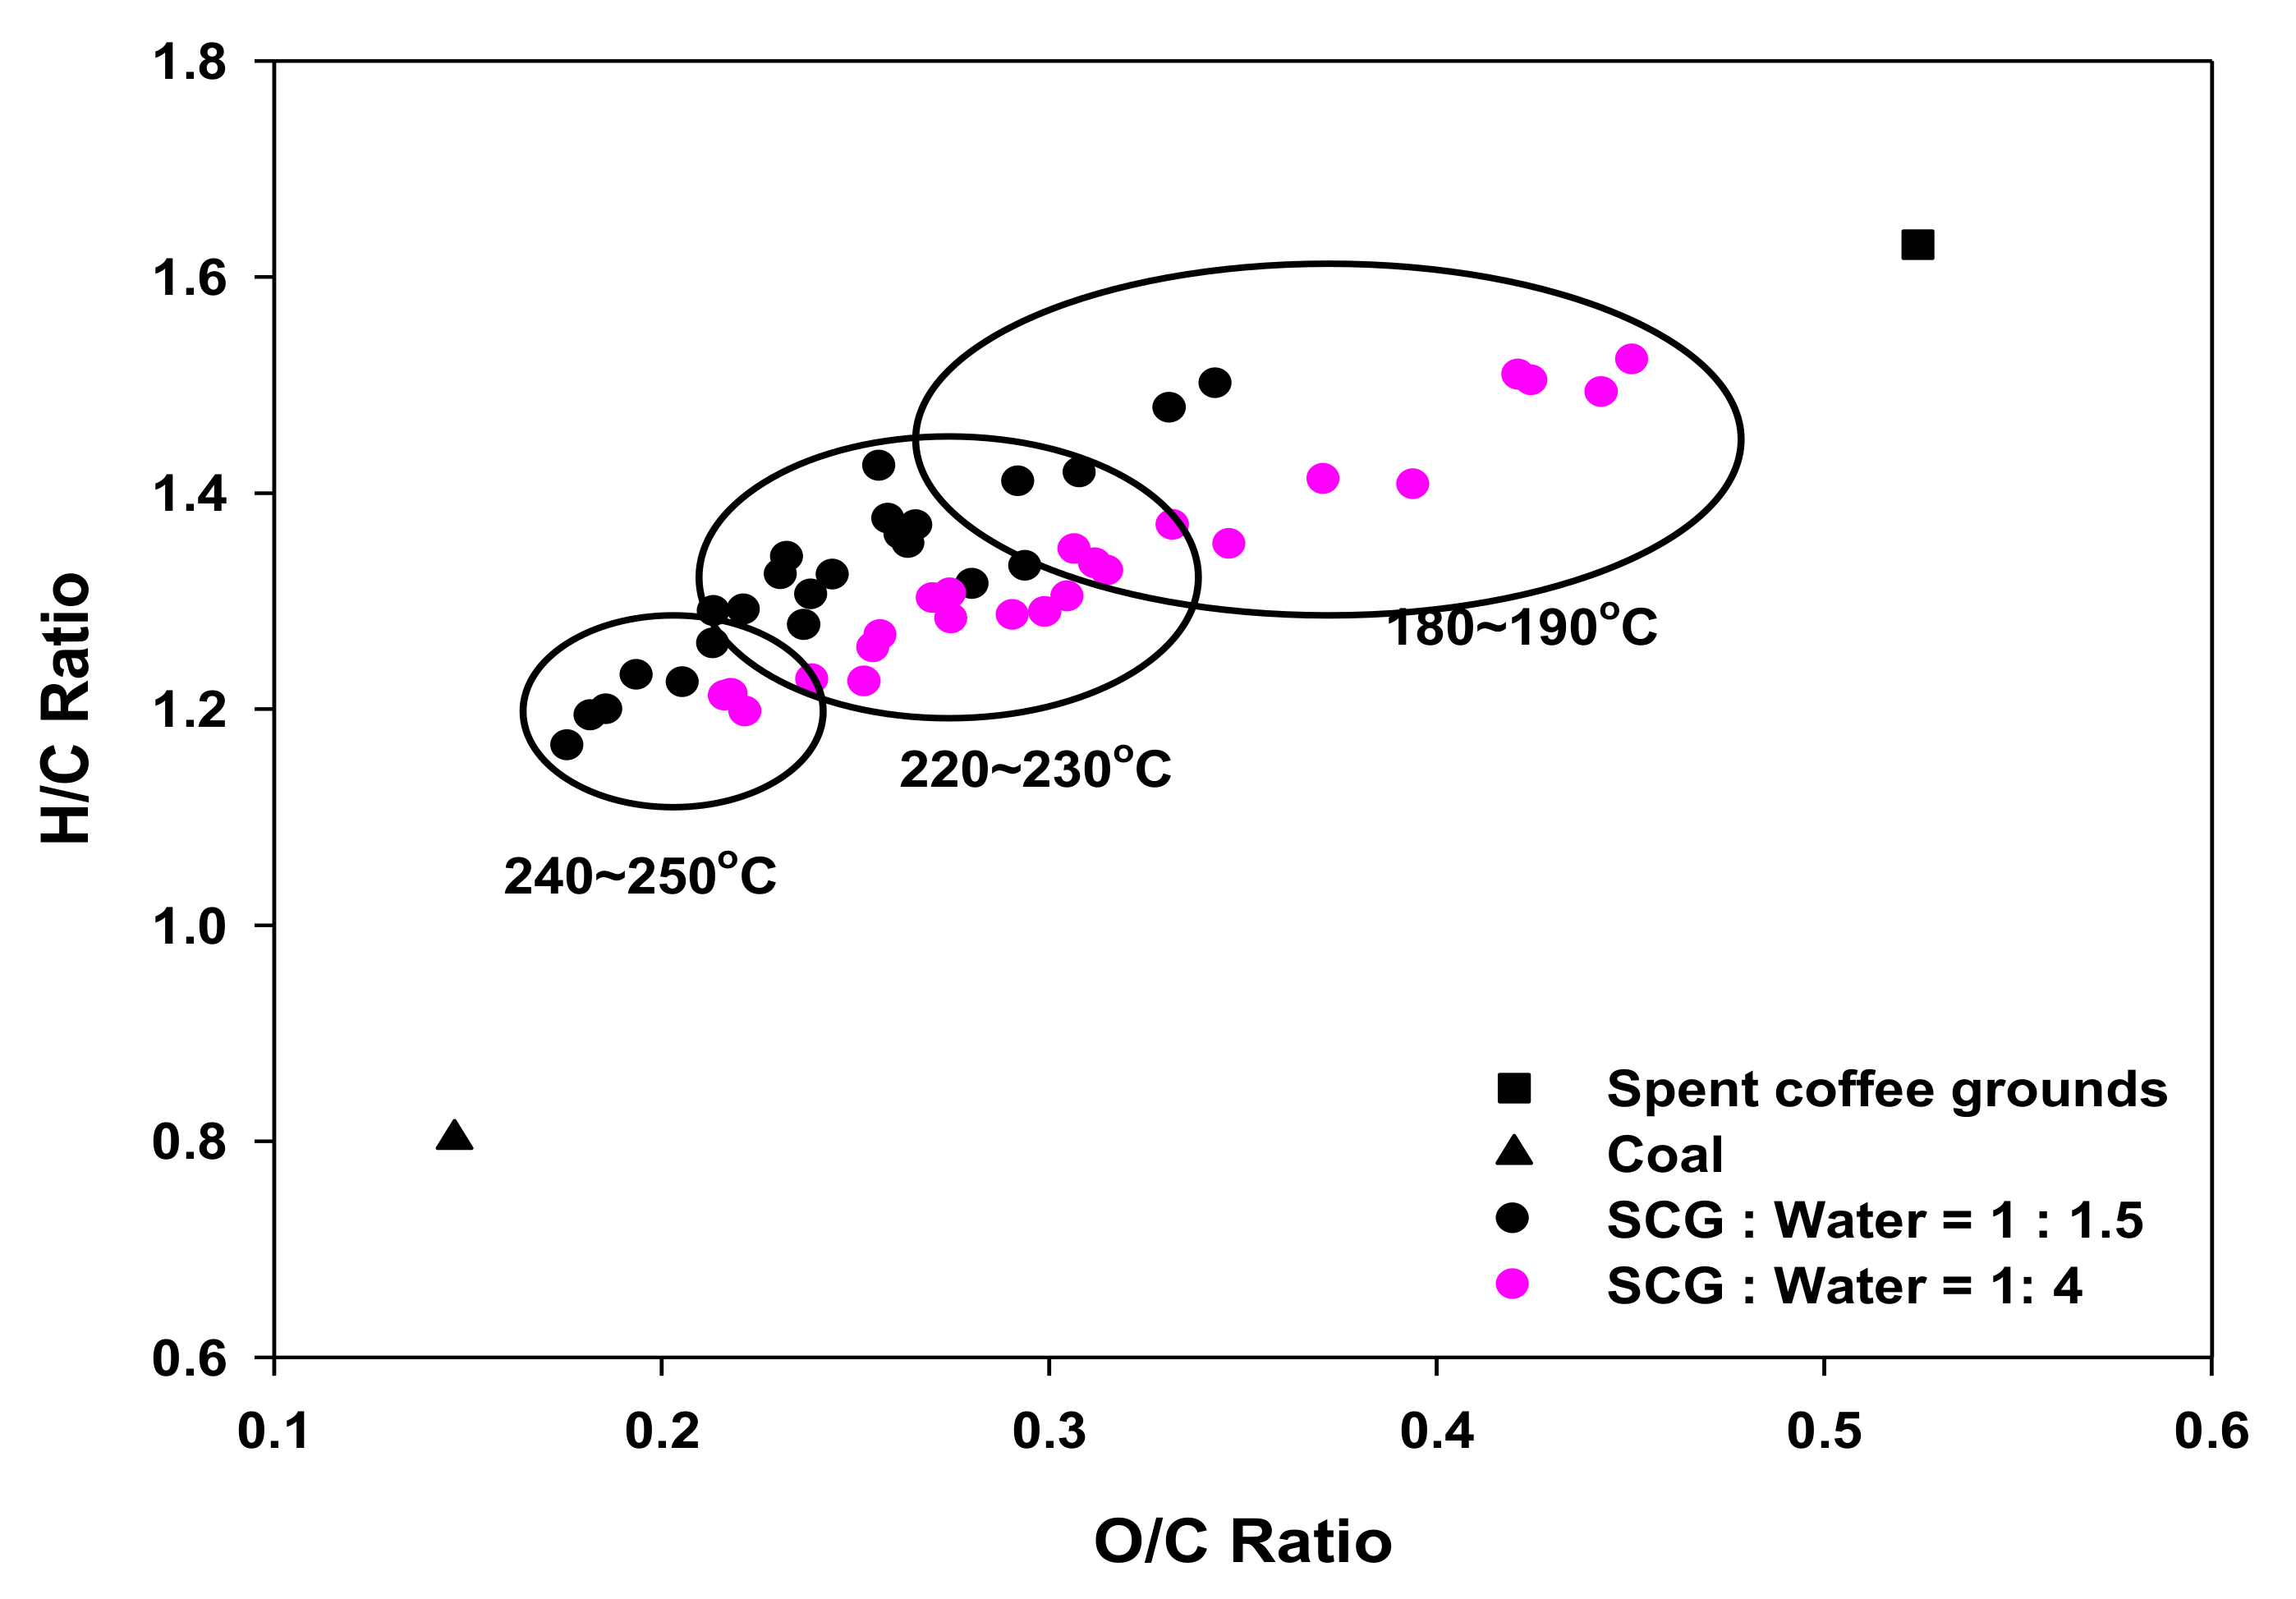
Figure 9.
Correlations between carbon and hydrogen contents and the HHV of hydrothermally carbonized SCGs produced with different reaction temperatures and water contents: (a) SCG: water = 1:1.5; (b) 1:4.
Figure 9.
Correlations between carbon and hydrogen contents and the HHV of hydrothermally carbonized SCGs produced with different reaction temperatures and water contents: (a) SCG: water = 1:1.5; (b) 1:4.

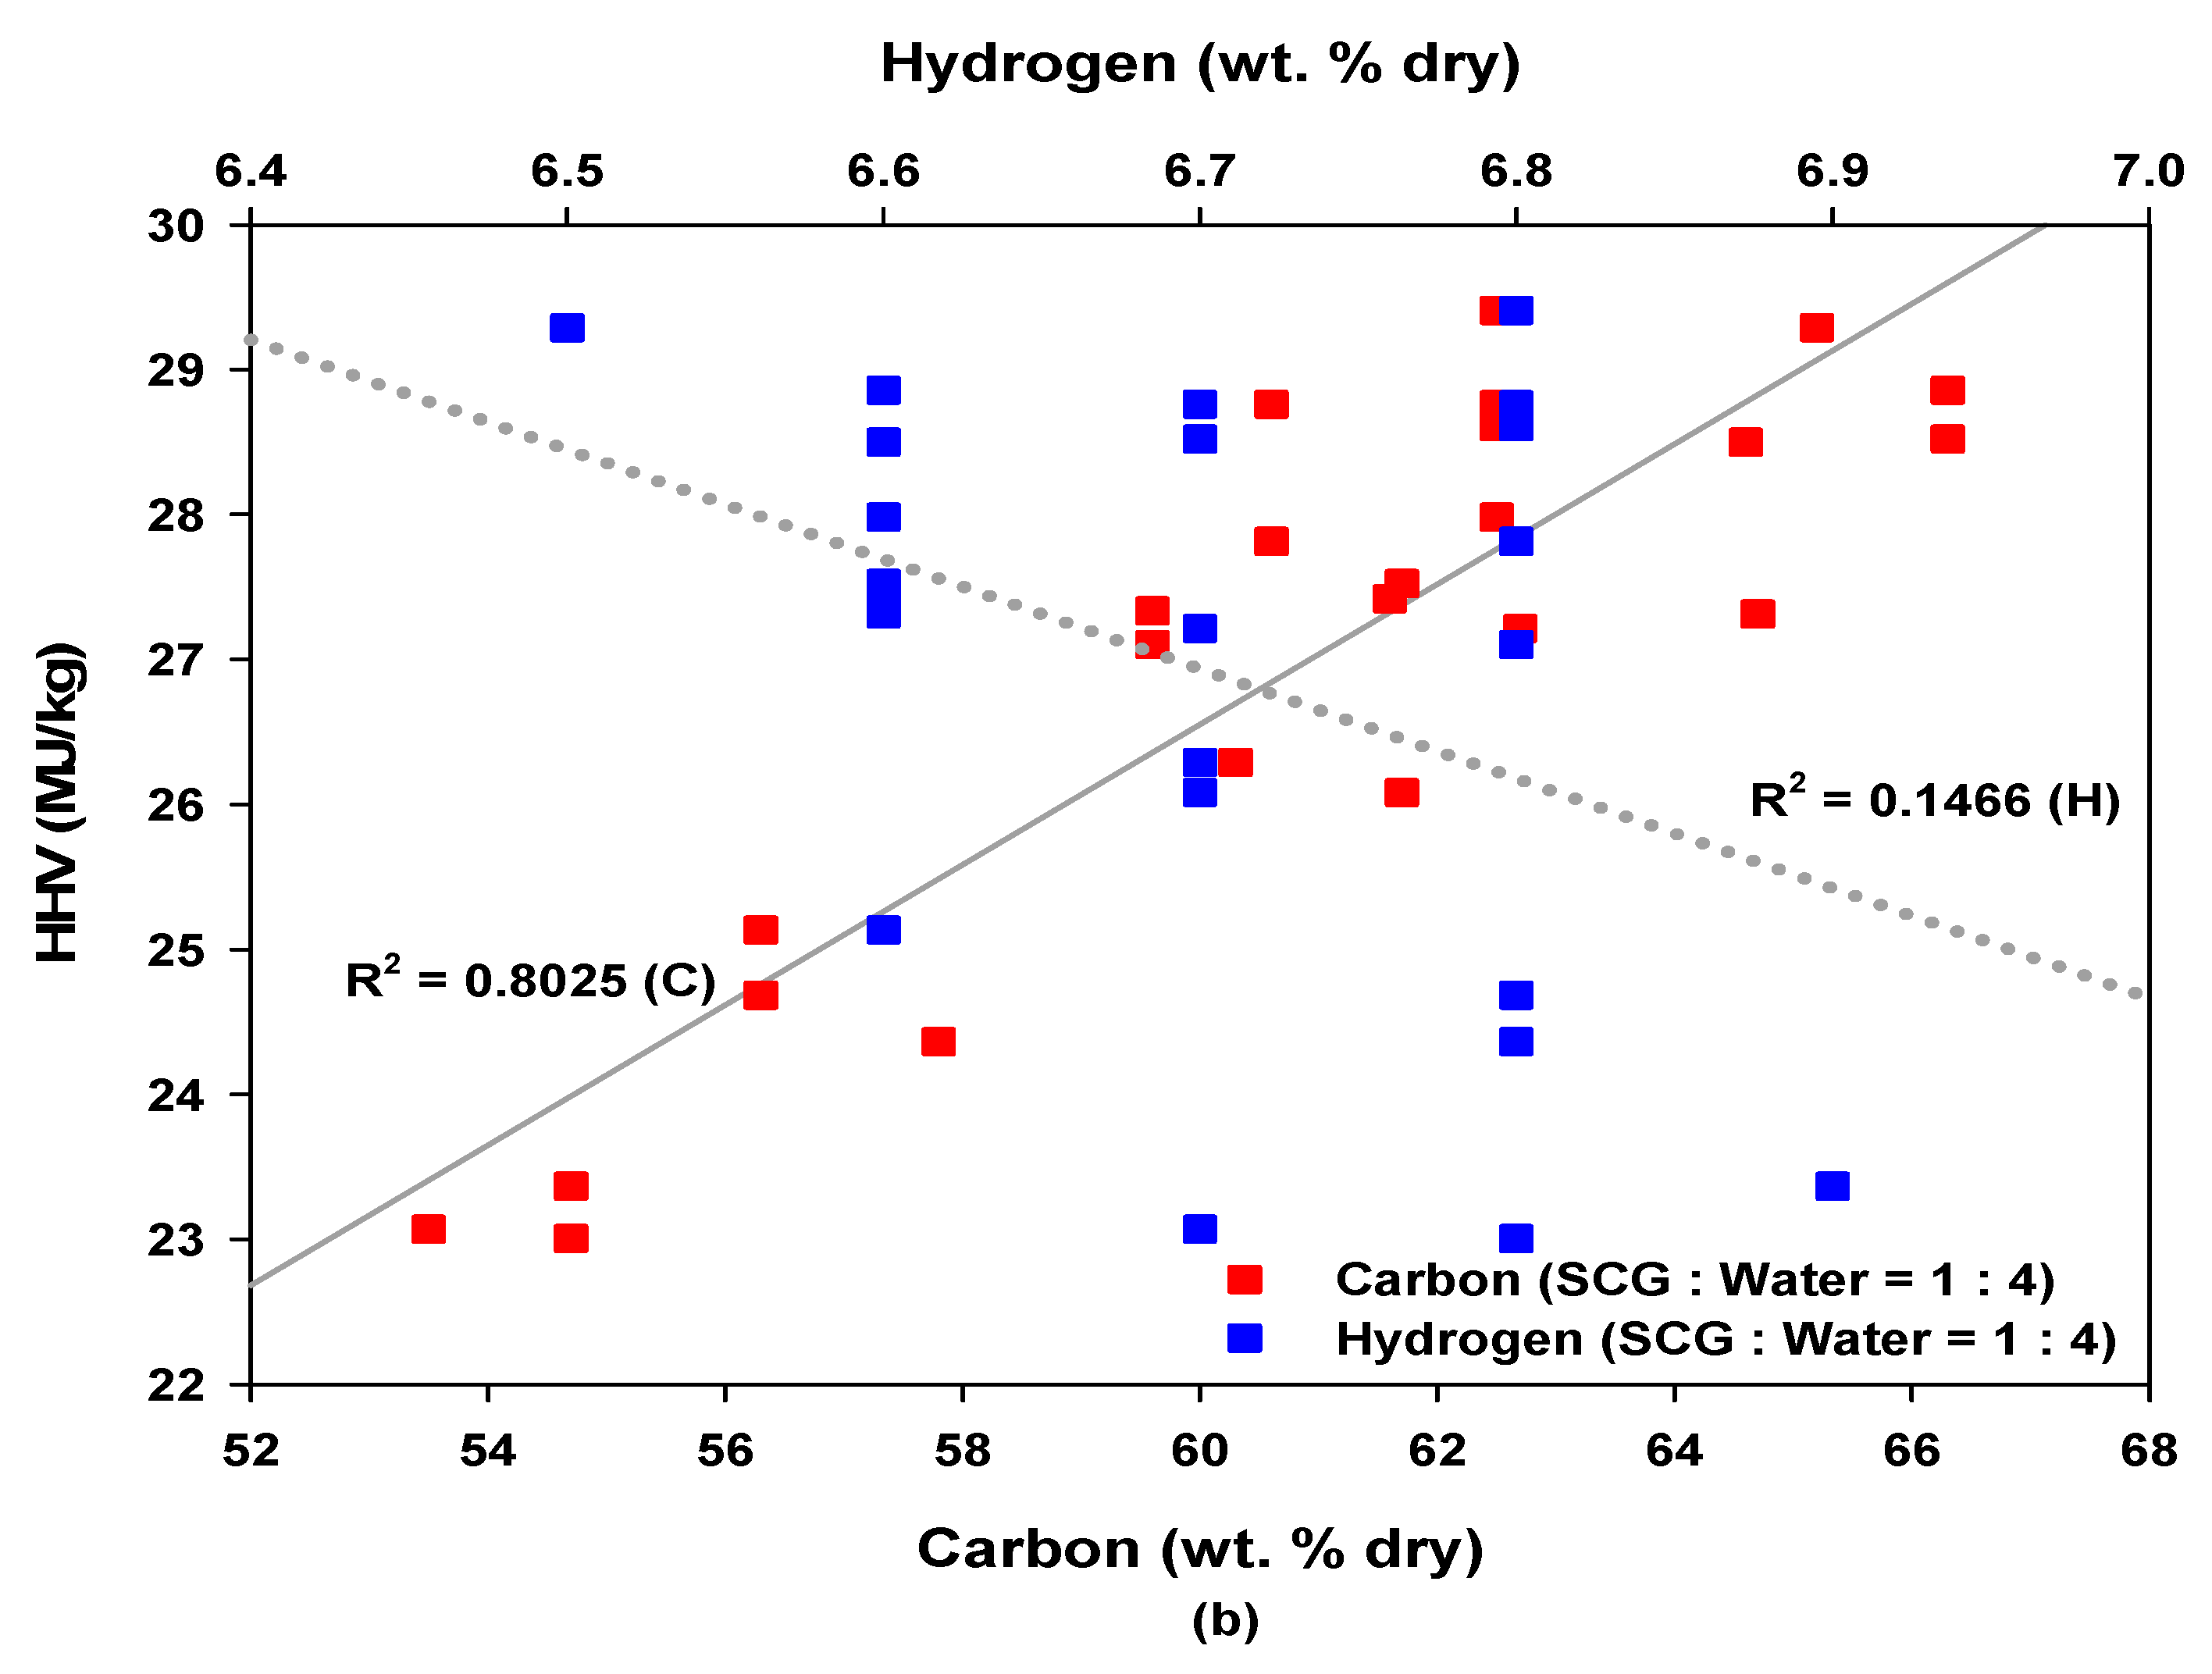
Figure 10.
Thermogravimetric analysis (TGA) and derivative thermogravimetry (DTG) curves of raw and hydrothermally carbonized SCGs produced with different reaction temperatures and water contents. (a) SCG: water = 1:1.5; (b) 1:4.
Figure 10.
Thermogravimetric analysis (TGA) and derivative thermogravimetry (DTG) curves of raw and hydrothermally carbonized SCGs produced with different reaction temperatures and water contents. (a) SCG: water = 1:1.5; (b) 1:4.

Figure 11.
Fourier transform infrared spectroscopy (FT-IR) spectra of raw and hydrothermally carbonized SCGs produced with different reaction temperatures and water contents: (a) SCG: water = 1:1.5; (b) 1:4.
Figure 11.
Fourier transform infrared spectroscopy (FT-IR) spectra of raw and hydrothermally carbonized SCGs produced with different reaction temperatures and water contents: (a) SCG: water = 1:1.5; (b) 1:4.

Figure 12.
Chemical oxygen demand of SCGs produced with different reaction temperatures and water contents.
Figure 12.
Chemical oxygen demand of SCGs produced with different reaction temperatures and water contents.


Table 1.
Characteristics of dry spent coffee grounds used in this study.
| Element Analysis [wt.%] | Proximate Analysis [wt.%] | Higher Heating Value [MJ/kg] | |||||||
|---|---|---|---|---|---|---|---|---|---|
| C | H | N | O | S | Others | VM | FC | Ash | |
| 50.8 (0.35) | 6.9 (0.06) | 2.5 (0.07) | 35.5 (0.30) | - | 4.3 (0.33) | 80.4 (1.86) | 18.1 (1.71) | 1.5 (0.13) | 22.6 (0.22) |
VM: volatile matter; FC: fixed carbon; HHV: higher heating value; moisture of raw SCGs: 62%; ( ): standard deviation.
Table 2.
Elemental and proximate analysis of SCGs hydrothermally carbonized with different reaction temperatures (SGC: water = 1:1.5).
Table 2.
Elemental and proximate analysis of SCGs hydrothermally carbonized with different reaction temperatures (SGC: water = 1:1.5).
| Temperature | Elemental Analysis (wt.%, dry) | Proximate Analysis (wt.%, dry) | |||||||
|---|---|---|---|---|---|---|---|---|---|
| C | H | O | N | S | Others | VM | FC | Ash | |
| 180 °C | 60.1 ± 1.7 | 7.3 ± 0.1 | 26.2 ± 0.9 | 2.7 ± 0.2 | 0 | 3.6 ± 1.0 | 68.6 ± 2.2 | 29.6 ± 1.8 | 1.8 ± 0.4 |
| 190 °C | 62.5 ± 1.4 | 7. ± 0.2 | 24.1 ± 0.3 | 3.2 ± 0.3 | 0 | 3.3 ± 1.4 | 67.4 ± 2.3 | 30.6 ± 1.2 | 1.7 ± 0.8 |
| 200 °C | 64.1 ± 0.3 | 7.3 ± 0.1 | 22.6 ± 0.1 | 3.0 ± 0.1 | 0 | 3.1 ± 0.4 | 66.0 ± 1.6 | 32.3 ± 1.6 | 1.7 ± 0.2 |
| 210 °C | 64.9 ± 0.5 | 7.3 ± 0.4 | 21.3 ± 0.9 | 3.0 ± 0.4 | 0 | 3.5 ± 1.0 | 64.8 ± 2.9 | 33.2 ± 2.1 | 1.9 ± 0.8 |
| 220 °C | 65.4 ± 0.8 | 7.3 ± 0.1 | 21.0 ± 1.3 | 3.2 ± 0.5 | 0 | 3.1 ± 0.7 | 64.5 ± 0.6 | 33.7 ± 0.5 | 1.8 ± 0.3 |
| 230 °C | 66.2 ± 0.5 | 7.0 ± 0.1 | 19.5 ± 1.3 | 3.3 ± 0.4 | 0 | 4.0 ± 0.7 | 61.9 ± 3.7 | 35.7 ± 3.0 | 2.4 ± 0.7 |
| 240 °C | 67.0 ± 0.3 | 7.0 ± 0.2 | 18.5 ± 1.1 | 3.5 ± 0.2 | 0 | 4.0 ± 0.9 | 61.3 ± 2.1 | 36.3 ± 1.9 | 2.4 ± 0.2 |
| 250 °C | 68.5 ± 0.5 | 6.8 ± 0.1 | 16.6 ± 0.4 | 3.7 ± 0.0 | 0 | 4.5 ± 0.1 | 56.4 ± 1.7 | 41.1 ± 1.4 | 2.5 ± 0.3 |
Table 3.
Elemental and proximate analysis of SCGs hydrothermally carbonized with different reaction temperatures (SGC: water = 1:4).
Table 3.
Elemental and proximate analysis of SCGs hydrothermally carbonized with different reaction temperatures (SGC: water = 1:4).
| Temperature | Elemental Analysis (wt.%, dry) | Proximate Analysis (wt.%, dry) | |||||||
|---|---|---|---|---|---|---|---|---|---|
| C | H | O | N | S | Others | VM | FC | Ash | |
| 180 °C | 54.2 ± 0.7 | 6.8 ± 0.1 | 31.8 ± 1.5 | 2.6 ± 0.1 | 0 | 4.7 ± 2.3 | 75.2 ± 1.4 | 23.3 ± 1.5 | 1.5 ± 0.1 |
| 190 °C | 56.1 ± 2.0 | 6.7 ± 0.1 | 29.5 ± 0.9 | 2.7 ± 0.2 | 0 | 4.9 ± 1.3 | 73.4 ± 3.3 | 24.9 ± 2.7 | 1.7 ± 0.6 |
| 200 °C | 59.5 ± 0.9 | 6.7 ± 0.1 | 26.2 ± 1.1 | 3.0 ± 0.1 | 0 | 4.6 ± 0.4 | 70.9 ± 3.0 | 27.0 ± 3.6 | 2.2 ± 0.6 |
| 210 °C | 61.0 ± 1.3 | 6.6 ± 0.1 | 24.7 ± 0.8 | 3.0 ± 0.2 | 0 | 4.7 ± 1.3 | 69.1 ± 3.0 | 29.1 ± 3.1 | 1.8 ± 0.1 |
| 220 °C | 61.9 ± 1.3 | 6.7 ± 0.1 | 24.2 ± 1.2 | 3.1 ± 0.1 | 0 | 4.1 ± 1.1 | 68.3 ± 1.7 | 29.9 ± 1.7 | 1.8 ± 0.1 |
| 230 °C | 63.3 ± 1.4 | 6.7 ± 0.1 | 22.4 ± 0.6 | 3.2 ± 0.1 | 0 | 4.4 ± 0.7 | 67.2 ± 4.5 | 31.0 ± 4.2 | 1.7 ± 0.3 |
| 240 °C | 64.0 ± 1.5 | 6.7 ± 0.1 | 21.4 ± 0.8 | 3.4 ± 0.1 | 0 | 4.5 ± 1.9 | 67.5 ± 0.7 | 30.4 ± 0.8 | 1.9 ± 0.1 |
| 250 °C | 65.6 ± 0.7 | 6.6 ± 0.1 | 19.2 ± 0.3 | 3.6 ± 0.1 | 0 | 5.0 ± 1.0 | 69.8 ± 1.4 | 28.3 ± 1.3 | 1.9 ± 0.4 |
Publisher’s Note: MDPI stays neutral with regard to jurisdictional claims in published maps and institutional affiliations. |
© 2021 by the authors. Licensee MDPI, Basel, Switzerland. This article is an open access article distributed under the terms and conditions of the Creative Commons Attribution (CC BY) license (https://creativecommons.org/licenses/by/4.0/).
Share and Cite
MDPI and ACS Style
Kim, H.-J.; Oh, S.-C. Hydrothermal Carbonization of Spent Coffee Grounds. Appl. Sci. 2021, 11, 6542. https://doi.org/10.3390/app11146542
AMA Style
Kim H-J, Oh S-C. Hydrothermal Carbonization of Spent Coffee Grounds. Applied Sciences. 2021; 11(14):6542. https://doi.org/10.3390/app11146542
Chicago/Turabian StyleKim, Hyeok-Jin, and Sea-Cheon Oh. 2021. "Hydrothermal Carbonization of Spent Coffee Grounds" Applied Sciences 11, no. 14: 6542. https://doi.org/10.3390/app11146542
Note that from the first issue of 2016, this journal uses article numbers instead of page numbers. See further details here.