Review

Applying Force Plate Technology to Inform Human Performance Programming in Tactical Populations

1
Human Performance Innovation Center, Rockefeller Neuroscience Institute, West Virginia University, Morgantown, WV 26505, USA
2
College of Physical Activity and Sport Sciences, West Virginia University, Morgantown, WV 26505, USA
3
Sports Medicine Assessment Research & Testing (SMART) Laboratory, George Mason University, Fairfax, VA 22030, USA
*
Author to whom correspondence should be addressed.
Appl. Sci. 2021, 11(14), 6538; https://doi.org/10.3390/app11146538
Submission received: 27 June 2021 / Revised: 13 July 2021 / Accepted: 14 July 2021 / Published: 16 July 2021
(This article belongs to the Special Issue Human Performance Monitoring and Augmentation)

Abstract

:
Force plate assessments, such as countermovement jumps and isometric mid-thigh pulls, examine performances (e.g., jump height, force, power) and movement strategies (e.g., asymmetries, durations), and are best suited to characterize and monitor physical capabilities, not predict injuries. To begin applying force plate technologies, users must first; (1) develop a data management plan to visualize and capture data over time; (2) select appropriate force plates for their scenario; (3) design appropriate testing protocols to ensure valid and reliable data. Force plate assessments may be added to existing testing, serve as separate testing batteries for annual profile testing to compare individuals and understand initial physical capabilities, or for more frequent testing (i.e., monthly or weekly) to monitor training-related adaptations or neuromuscular fatigue. Although these assessments inform evidence-based program designs, human performance practitioners must understand the considerations for conducting appropriate force plate testing, as well as proper visualizations and management of force plate data. Thus, the aim of this review is to provide evidence-based practices for utilizing force plates in tactical populations (e.g., military, firefighters, police). This includes best practices to implement testing for performance profiling, training adaptations, and monitoring neuromuscular fatigue and force asymmetries. Of note, due to the large amount of force-time metrics to choose from, this article provides general examples of important metrics to monitor and training recommendations based on changes to these force-time metrics, followed by specific examples in three case studies.

1. Introduction

Although the physical demands and occupational requirements vary across and within tactical populations, muscular strength and power capabilities remain fundamentally vital to most tactical environments [1,2]. Rates of musculoskeletal injuries are high for many tactical populations, with lower extremities, back, and shoulders being the most common injury locations [3,4,5,6,7,8,9,10,11,12]. As a result, musculoskeletal injuries increase missed duty time and require rehabilitation, thereby inhibiting skill maintenance and acquisition, restricting operational capacities, and increasing compensatory workforce strain [2]. This series of events costs significant government funding and resources [9,13]. One resounding characteristic contributing to musculoskeletal injury rates is unwarranted accumulations of neuromuscular fatigue from monotonous high-volume training periods at initial entry points purported to prepare individuals for their career [2,7,14,15]. For example, in Navy recruits, greater run mileage increased incidences of injury without any further improvement in aerobic fitness [16]. Yet, tactical personnel must be free of chronic musculoskeletal concerns and obtain a suitable level of muscular fitness to achieve operational success, which varies with occupational demands across tactical environments [12,17,18].
Adapted concepts originating from Selye’s general adaptation syndrome [19], applied to strength and conditioning programs [14], suggest the primary goal of physical training is to elicit heightened workload capacities over time. The increased ability to withstand greater workloads concomitantly reduces injury incidences during subsequent training [6], which explains the association of injury rates with low muscular fitness [20,21]. If training loads are increased beyond accustomed levels or adequate recovery from training is not provided, neuromuscular fatigue may result in diminished functional capacities via decreased strength and power production, decreased cardiorespiratory endurance, and/or increased risk for musculoskeletal injuries [5,6]. Indeed, performance potential may be purposefully sacrificed (i.e., functional overreaching) to facilitate adaptations through certain levels of fatigue but should be monitored to track physical preparedness and prevent undue chronic fatigue. Considering the absolute physical requirements of occupational demands in tactical settings, regardless of physiological stature (i.e., the same equipment load requirements for a 130-pound and 190-pound individual), improving physical performance capabilities may reduce the relative intensity of common occupational tasks and subsequently reduce longitudinal injury risk. A major roadblock in performance monitoring efficacy is buy-in from personnel to reduce attrition, which may be improved by focusing on physical performance capabilities rather than attempting to predict injuries occurrences [22]. Thus, human performance monitoring and profiling initiatives should transition from the perspective of predicting injuries to assessing and improving the potential risk factors for increased injury rates, such as muscular strength and power [21,23,24,25]. For these reasons, the implementation of strategies designed to objectively monitor the acute and chronic effects of training loads is imperative to ensuring desirable performance adaptations and injury risk mitigations are achieved [2].
In human performance monitoring systems, baseline and repeated physical fitness assessments are imperative and provide insight into occupational performance capabilities. For example, dynamic lifting abilities were more predictive of performances during a 5-day combat simulated scenario than aerobic capacity, thus demonstrating the importance of strength capabilities in real-world scenarios [26]. Maximal strength was also associated with specific occupational performances or assessments requiring lower body power (e.g., casualty drag; countermovement jump, CMJ) [27,28], as well as marksmanship [29]. In addition to strength, measures of lower body power, such as the CMJ, are indicative of occupational performances involving strength, speed, agility, or power (e.g., maneuvering over obstacles, dragging, lifting, and/or carrying loads, and sprinting) [30,31,32,33]. Moreover, load carriage requirements in tactical populations influence injury risk if not adequately accounted for via enhancement of muscular strength and power [34,35,36,37]. Greater recognition of muscular strength’s importance for occupational performance is prevailing [17,28,38], although many of the adopted tests have inherent limitations and degrees of injury risk due to innate fatiguability.
Isolated single muscle group assessments via dynamometry are not ecologically valid measures of muscular strength, as a majority of movements in tactical environments involve coordinated recruitment of multi-joint, large muscle groups by the nervous system. Further, 1–3 repetition maximal testing elicits undue fatigue and requires excessive amounts of equipment and skill [39,40], which makes this testing inappropriate for untrained/novice populations or those enduring fatigue from occupational demands. These testing characteristics motivated the exploration of alternative methods for maximal strength testing that are non-fatiguing, require less skill, and include coordinated actions by multiple large muscle groups. A main limitation of field tests of muscular power (i.e., CMJ using only tape on the wall for total jump height), explained in detail elsewhere [41], is their inability to capture the neuromuscular strategies called upon to generate observed outcomes (i.e., jump height), which may be more responsive to training loads. In fact, when estimating power output, kinematic variables often explain the relationship between power and vertical jump height, such as countermovement jump depth [42], a metric that is also sensitive to neuromuscular fatigue [43]. Further, a field test of CMJ only depicts the outcome, which fails to inform whether the individual requires improvements in force or velocity capabilities (or both) to maximize their structured training methods [44]. Thus, alternative strategies, namely, force plate testing, are encouraged for the purposes of objectively monitoring tactical personnel.
Further, force plates provide an inside look into movement strategies and forces generated throughout various phases of a movement (i.e., eccentric and concentric phases) in addition to the outcome metric (i.e., jump height during a CMJ or drop jump). When protocols are designed and implemented effectively, force plates are considered the most reliable method of measuring vertical jump height [45]. The increased confidence in data quality obtained from force plates provides practitioners with an actionable means of identifying instances of training adaptations [46], levels of resiliency to fatigue [43,47], and risks for injury [48]. Furthermore, CMJ’s can be conducted under loaded conditions (e.g., barbell, weighted vest, occupational-specific equipment) to ascertain occupationally relevant performance capabilities (i.e., meeting load requirements during tasks performed by firefighters, law enforcement, or military personnel) or maximal strength capabilities [49,50]. Isometric strength testing of large muscle groups (e.g., isometric mid-thigh pull, IMTP) is another appropriate measure of maximal strength, as it is relatively simple to administer, time-efficient, less fatiguing, and possesses high degrees of reliability under standardized testing conditions [51,52,53,54]. Although high sampling frequencies generated by force plates may allow force-time metrics to be more sensitive (than jump height) to changes in the neuromuscular status of an individual [55,56,57,58], they also present a large amount of data and number of force-time metrics to choose from.
As discussed thus far, there is substantial evidence pertaining to the potential use of force-plate assessments in tactical populations, but despite detailed methods sections, no study describes the required steps to begin using force plate technologies in human performance facilities. This leaves practitioners with uncertainty pertaining to; (1) how to select appropriate force plates; (2) how to ensure valid and reliable force plate data; (3) when to test with force plates; (4) what force plate metrics to monitor; (5) how to manage and visualize force plate data; (6) what training recommendations could be made based on intra-individual changes to selected force plate metrics. Independent literature exists, such as those previously mentioned in the current review and in prior literature pertaining to the foundations of force plate monitoring in tactical populations [41], but there are currently no scientific literature reviews that outline the many considerations for using force plate technologies in tactical settings. Therefore, this narrative review begins by briefly covering overall considerations for implementing force plate testing and handling force-time data. Next, this review describes the use and implementation of force plate testing in tactical settings from a practical perspective, including actionable training recommendations based on suggested force plate metrics to monitor and three case study examples in the following scenarios; (1) profile testing for physical capabilities; (2) testing performances for training related adaptations; (3) testing to monitor neuromuscular fatigue and detraining; (4) monitoring force asymmetries.

2. Important Data Considerations for Implementing Force Plate Testing

The most important step in preparation for using force plate data to inform training program prescriptions is identifying the database management system that will store the raw data, conduct calculations, and build visualizations. It is common for high frequency (1000 Hz) force plate systems to provide a wealth of meaningful data from the force-time curve, resulting in upwards of 100+ calculated variables. This, understandably so, may look overwhelming at first sight, but a properly designed (and commercially available) data management system provides the ability to make this vast data easily accessible, visualizable, and actionable, as well as overlay additional important contextual data such as training load. Figure 1 displays a dashboard example of an executive summary of CMJ testing utilizing Fusion Sport Smartabase Athlete Management System (AMS). In the absence of a data management tool (such as an AMS), the data becomes very cumbersome to manage and can lead to a decreased likelihood of analyzing historical trends and managing large datasets. Although deeper evaluations of data may be necessary, the simplicity and automaticity of displays on dashboards can improve the buy-in from all users by seeing the testing results being implemented immediately. Indeed, the results from force plate data are only as reliable as the depth of standardization of the testing conditions and parameters, which are disseminated in a previous review [41]. In line with standardization recommendations (i.e., time of day, warm-up, instructions, tools), the order of assessments should be consistent across testing sessions, and testing should linearly progress from the least to most fatiguing assessments to limit the influence of the prior test on the next. Fatigue accumulation during testing may also be reduced by allowing short rest periods between trials (10–30 s) and between assessments (45–120 s). The duration of rest must be kept consistent across testing sessions and will be dictated by the number and intensity of trials performed for each assessment. Typically, averaging 2–3 trials provides more reliable and accurate depictions of the current state the individual is in [59]. However, if multiple trials are not permitted by schedule, single trials are sufficient for detecting neuromuscular fatigue [46] and should be used, at the very least.
A standardized and supervised dynamic warm-up protocol must be implemented to ensure maximal performances during testing. Examples are provided in Table 1 below. The warm-up protocols are strategically standardized to help ensure maximal effort is being attained at each trial within and across testing sessions over time. Failure to maximally potentiate the assessed musculature (e.g., lower extremity muscles contributing to CMJ performance) causes the inability to decipher whether variations in power output are due to neuromuscular fatigue or poor effort, which lends inaccurate interpretations of data. For example, reduced performance outcomes from a CMJ completed without properly warming up or with submaximal effort may appear as a maladaptation to training, despite the underlying maintenance or improvement in neuromuscular capabilities. At the very least, time constraints may warrant a minimum warm-up of 2–3 repetitions at 50–75% of their maximal perceived effort prior to collecting data (Table 1). There is also evidence of CMJ performances being improved following dynamic warm-up exercises, including submaximal CMJs, loaded with an additional 10% of an individual’s body mass [60,61]. The warm-up should also include the same additional load during submaximal warm-up repetitions when testing externally loaded jump performances (i.e., unloaded barbell or weighted vest) to ensure specificity and preparedness for the assessment.
Complicated testing protocols require further familiarization to prepare the individual for the testing session [62]. For example, single-leg jump or squat jump assessments are more unnatural movements than traditional CMJs and require additional familiarization to ensure data accuracy and reliability. When individuals become accustomed to testing protocols, their performances often increase toward their “true” scores (i.e., maximized potential for an individual testing session). Familiarization can occur naturally, but the first testing sessions should be referred to carefully, as an increase in performances within a week of training may transpire from becoming more familiar with the test rather than neuromuscular adaptations. Further, since fatigue from intensive training reduces force applications [63], testing batteries should be performed prior to or following a recovery period (72 h) from planned intensive training sessions to obtain the most actionable and reliable individual performance profiles. Additionally, standardized verbal instructions and encouragement must be provided throughout each assessment. Generally, instructions include a statement similar to “perform this movement as explosively as possible or jump as high as possible.” For CMJs, an external locus of control, such as “perform the countermovement jump as explosively as possible in attempt to jump towards the ceiling as high as possible” [64], or a competition for achieving personal or group best performances (e.g., displaying and updating leaderboards during a testing session), may ensure maximal effort.
Another consideration is selecting the most adequate force plate for a given scenario based on the specifications, such as portability, dimensions, software specifications, and pricing (USD 3500–50,000). For example, despite their portability, some force plate dimensions are too small, which increases occurrences of invalid trials due to the difficulty of landing with each foot completely on the plates (i.e., part of one or both feet land off of the platform). If testing will be conducted on deployment or at various training sites, adequate portability is necessary, as well as the ability of software to collect data offline. Financial considerations must be accounted for as well, as there is likely both a hardware and a software cost (often with annual licensing fees) associated with the force plate. Force plates without software license subscriptions require manually built software and expertise to analyze the raw force-time data. Without coding expertise to develop automated scripts in programs, such as Python, R, MATLAB, or LabVIEW, manual computations will be more time-consuming than the relatively expensive software options. With increased automation comes a yearly software license cost that can be an order of magnitude difference between companies. Additionally, some force plate software products contain proprietary algorithms to calculate metrics, which must be considered as they will impact the results of testing for reasons stated elsewhere [41]. The use of proprietary and especially unitless metrics also creates an issue when the inevitable change in technology arises years down the road. In order to compare new data to old, the same force-time curve metrics must be compared for longitudinal data analysis. This requires the software manufacturers to use similar units of variables (e.g., reactive strength index) and phases of the force-time curve (i.e., concentric/propulsive, eccentric/braking) and provide adequate definitions to allow appropriate comparisons. Interest in asymmetries requires the use of bipedal force plates equipped with the ability to separate individual force-time curves across upper or lower body limbs. Testing frequency, sample sizes, and time availability will also drive decisions on the aforementioned considerations. For example, testing bi-annually or quarterly may allow robust testing batteries comprising less portable equipment (i.e., large force plates or an isometric mid-thigh pull (IMTP) rack), while frequently testing large groups may require more portable options (Table 1).

3. Profile Testing for Physical Capabilities

A major component of human performance monitoring is assessing overall program efficiency and efficacy (i.e., macro-level monitoring) based on reaching the intended adaptations of training prescriptions. Testing frequencies dictate the purpose and actionable responses from force plate assessments. Minimally, annual testing provides informative performance profiles for comparisons between individuals and groups and tracks individualized developments to confirm the maintenance or improvement of important physical qualities (e.g., power output) from year to year. Profiling can allow practitioners to better pinpoint individual strengths and weaknesses that subsequently can be utilized in strength and conditioning programming to identify areas of emphasis (e.g., strength or aerobic capacity). For example, during annual assessments, an active-duty soldier might display larger differences between unloaded and loaded CMJ performances than their peers (i.e., well below the group average). The use of a data management system is imperative for this example, where historical norms specific to (in addition to self-comparisons) the group, gender, age, occupational specialty, etc., can be directly assessed. This information informs the practitioner of this individual’s requirement for a substantial emphasis on strength development in the upcoming training cycle. Consequently, practitioners are better able to diagnose an individual’s physical preparedness for specific occupational specialties and subsequently modulate them effectively over time.

3.1. Use of Loaded Jump Assessments

Increased load carriage requirements and lifting tasks challenge the physical capabilities of tactical personnel to a greater degree and resultantly place them under greater musculoskeletal injury risk over time [37,65]. There are many biomechanical movement consequences from being equipped with external loads [66], such as impaired squat jump, drop jump, and CMJ performances [36,50,67,68], as well as hindered occupational physical-movement capabilities [69,70,71,72]. Thus, jump assessments with external loads may be more related to occupational task performances than unloaded jumps [36]. By testing loaded conditions, the strength of an individual may be indirectly assessed without the additional equipment requirements of an IMTP or the fatiguability and time requirements inherent to maximum repetition testing. Thus, force plate testing under unloaded and loaded conditions provides complementary and actionable knowledge [50].
However, to ensure comparisons across loaded and unloaded conditions are appropriate, necessary precautions must be taken. The CMJ, without an arm swing, performed with a PVC pipe across the shoulders requires the loaded CMJ to be performed with a barbell using a standardized weight (≤20 kg) to mimic the unloaded condition. Weighted vests are a viable, and often a more ecologically valid, option for loading CMJs in tactical populations, but must be strapped tight to limit movement (or tightly holding the vest at the collar) and requires similar testing parameters during the unloaded CMJ (i.e., hands at the waist or arms crossed at the shoulders). The load selected should reflect the capabilities of the occupational specialty and be standardized, although too heavy of a load may not be suitable for detecting neuromuscular fatigue. To this end, practitioners should ensure the magnitude of the load and distribution (symmetrical or asymmetrical) appropriately mimic the occupational demands and testing purpose, as both are linked to the ability of the neuromuscular system to maintain postural stability [73,74].

3.2. Creating Normative Data and Percentile Scores

Normative data sets are critical when comparing individual or group performances to the typical distribution of performance values and must be assessed for a given population (gender, age, specialty, etc.). This allows for the identification of below or above-average performances but requires a large randomly selected sample from a specific population. For that reason, it is not appropriate to compare values from a sample in one population to normative data from another population (i.e., across vastly different occupational specialties). Indeed, more data is needed to better understand not just tactical personnel overall but specific occupational specialties within tactical groups who require specific and potentially different physiological demands.
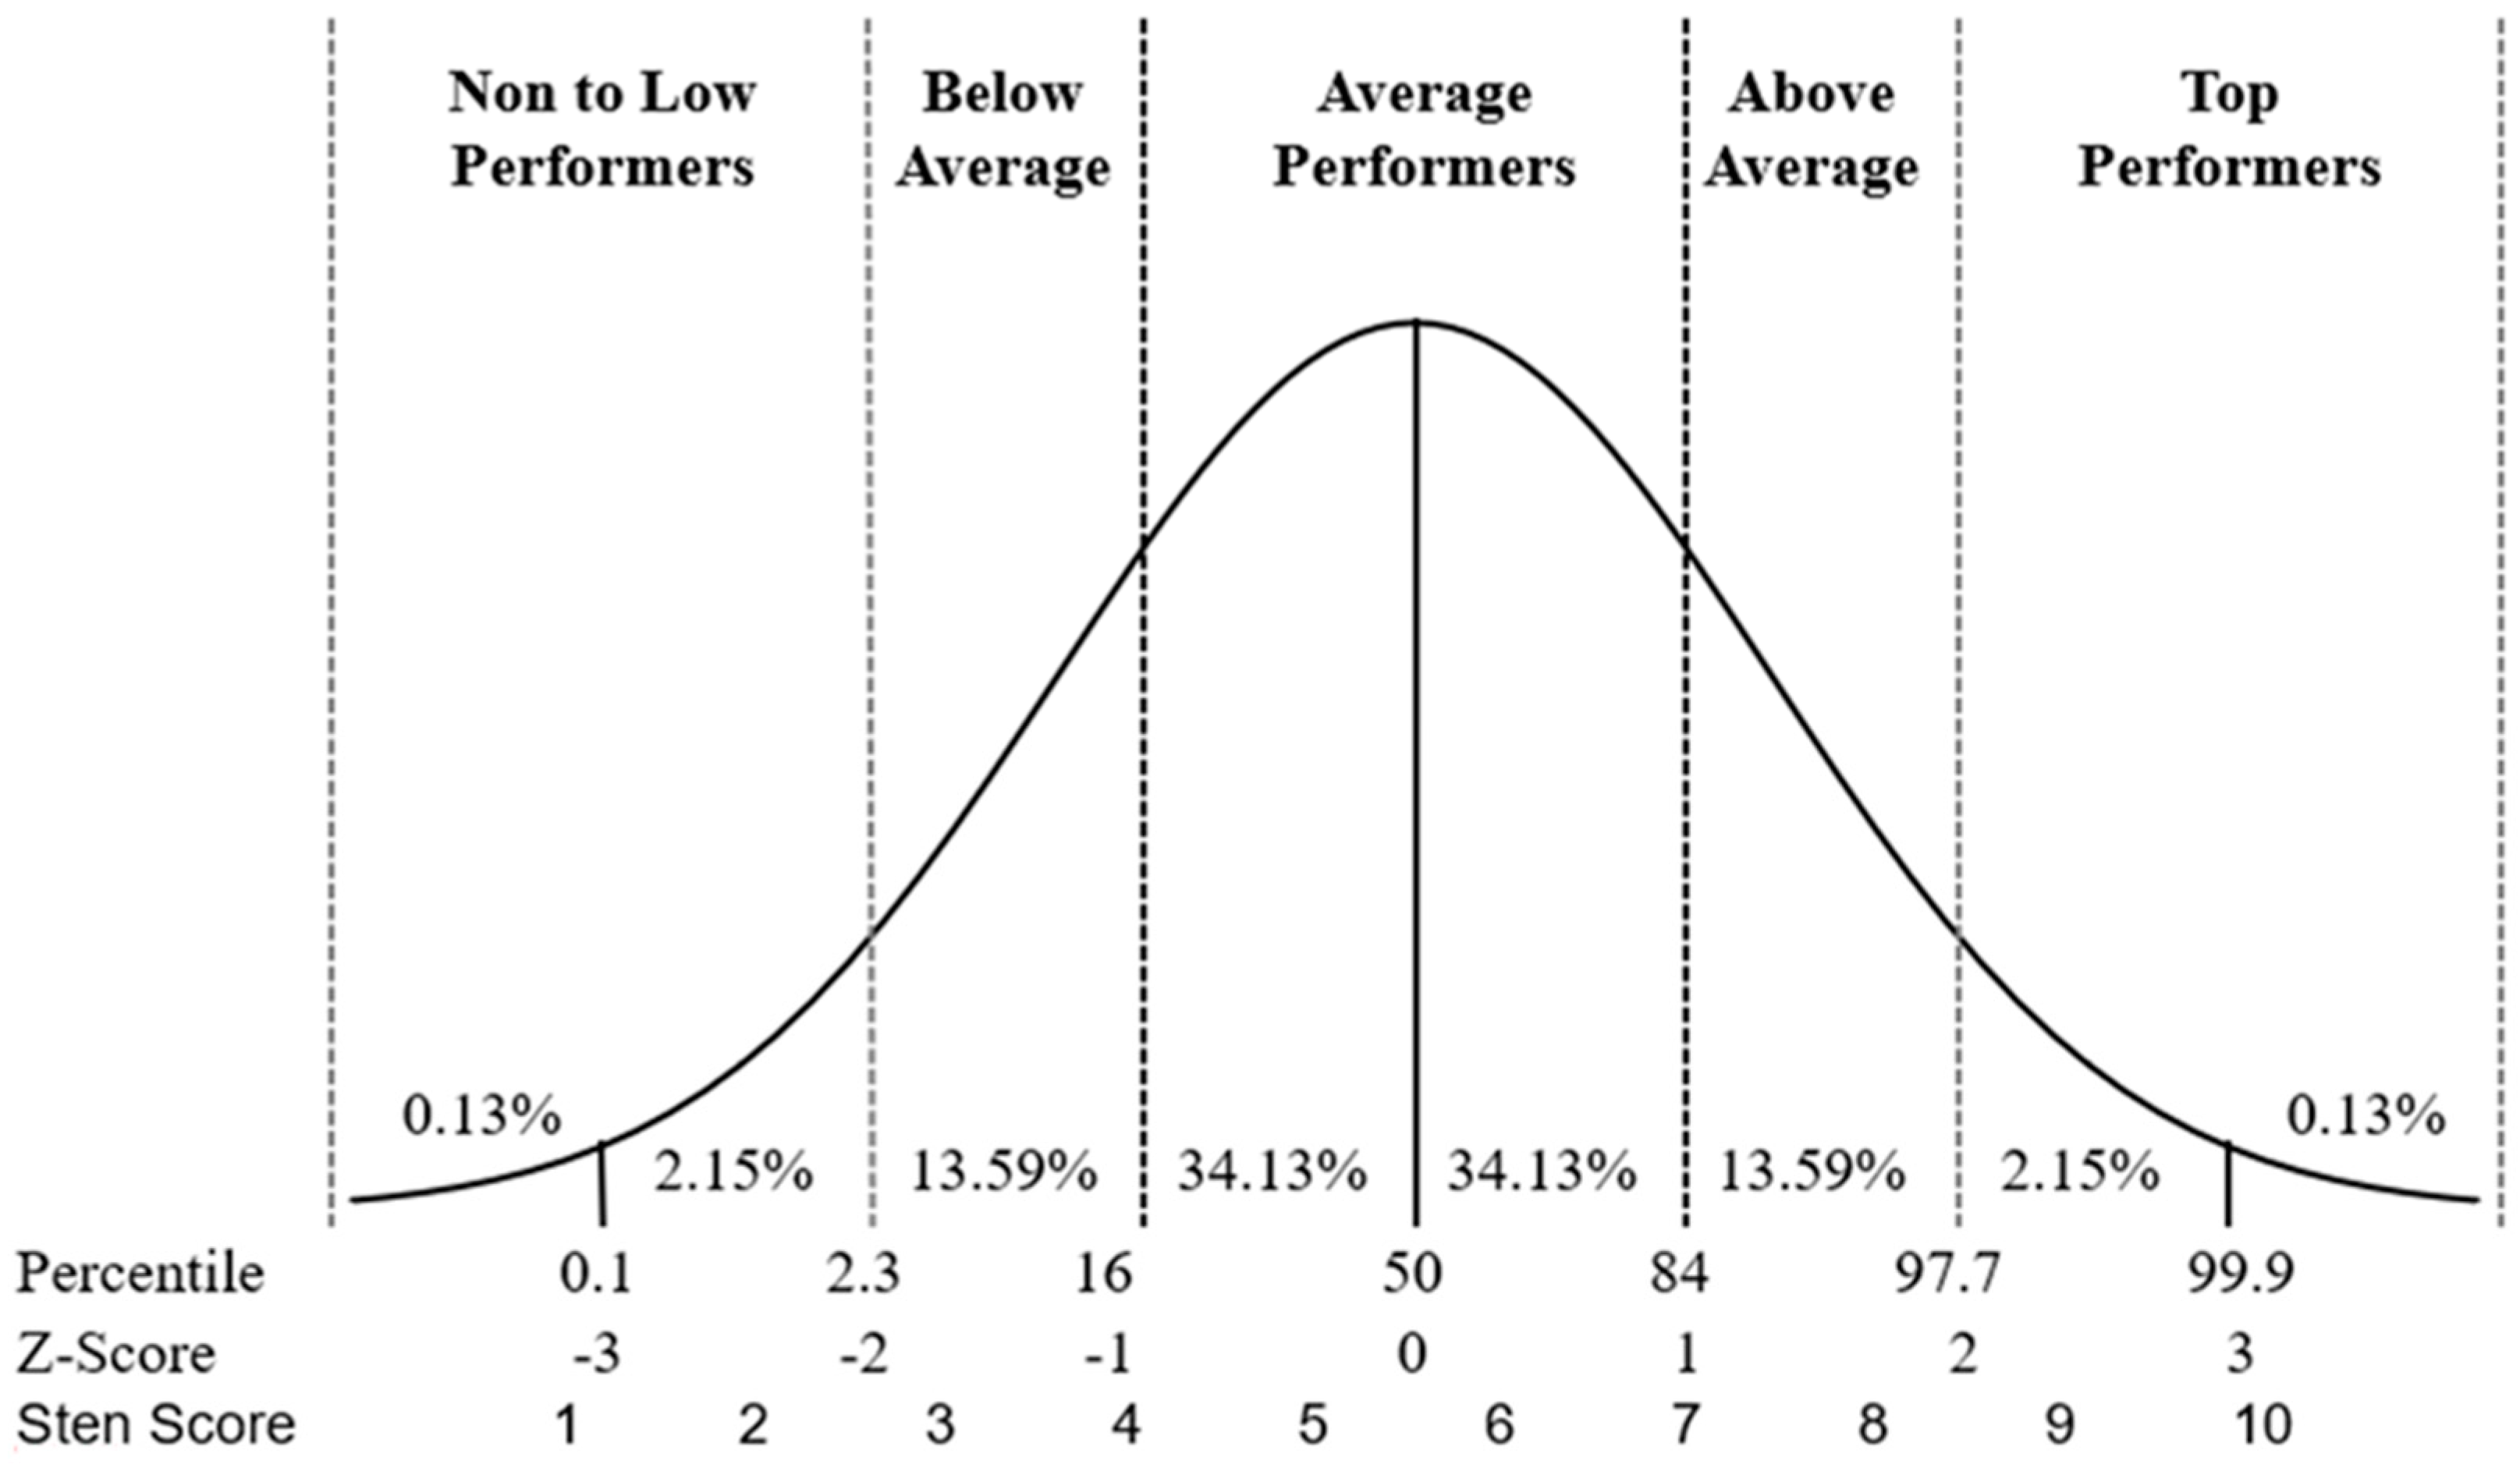
Practitioners are encouraged to indicate high and low performers within their group by calculating and comparing standard scores (i.e., inter-individual: Z-scores, STEN scores, and percentile rankings). Standard scores also allow more direct comparisons among performance metrics of differing units (i.e., comparing magnitude changes in power output and impulse) and are more likely to resonate with personnel by demonstrating relative changes in performances. The scores align with standard deviations to indicate the distance an individual’s performance is from the group’s average at a single time point or their own performances over time (Figure 2). For example, a Z-score of 0 equates to the group average, while a Z-score of +2 would equate to a performance better than approximately 97% of all scores (mean = 50% + 34% (+1 standard deviation) + 13% (+2 standard deviations). Whereas a Z-score of −0.5 would equate to one standard deviation below the mean of a performance, ~34% of all performers (or 34% of one’s own previous performances across a specific time period), and indicate a red flag alert to monitor the individual and promote a prescriptive training and/or recovery plan. Percentiles (and other standard scores) are linked to standard deviations above and below the mean (if a normal distribution exists, Figure 2), but custom weighted classifications may also be created based on well-established “norms” for a group. For example, if rates of attrition or injury increase when performances are below a certain threshold and successes are noted when performances are above a threshold, practitioners may use these standardized classifications to suggest low, average, and high performers (again, assuming a normal distribution). Regardless, the classifications should remain consistent unless new data emerges warranting the need for change. Context should also be taken for each metric, as positive changes to standard scores (i.e., jump height, forces, and power) may indicate improved performance, while negative changes to other variables indicate improved performance (i.e., duration metrics, eccentric to concentric ratios). Further, some metrics follow a bell shape, where a large change in either positive or negative directions may be a red flag for poor performance or are dependent on changes to other metrics (i.e., countermovement depth).

3.3. Case Study Scenario 1: Profiling

The occupational requirements in tactical populations consisting of both exceptional physical performances and sedentary tasks require a wide range of physical capabilities. Thus, tactical fitness test batteries may consist of select/non-select decisions for occupational specialties based on the minimum required scores across a wide range of fitness domains (i.e., strength and endurance), such as the physical fitness test (PFT), combat fitness test (CFT), LawFit, or FireFit [75,76,77]. Even if testing is not used as minimum requirements or to predict performances for specific occupational specialties, the utilization of percentile scores allows the practitioner to understand weak areas that need improvement or strong areas that need maintained (i.e., categories as—Excellent, Good, Average, Below Average, Poor). The latter example is likely to be the most common scenario for force plate assessments, at least until enough data are gathered and analyzed to determine “likely and unlikely” scenarios for occupational performance or injury risk. Until then, claims of high injury risk based on performance cut-offs are deemed inappropriate.
In this example case study, a group of (fictional) firefighters perform an entire annual testing battery consisting of strength measures (loaded countermovement jump height and absolute and relative IMTP peak force), power measures (CMJ and DJ height), reactive strength indexes (RSI from DJ), and movement strategies (DJ peak force when landing and CMJ asymmetries in mean concentric force and countermovement depth). Firefighter 1 (Figure 3) was slightly below the average (when compared to the group, which is gender and occupationally specific) relative strength measures but was above the average for movement strategies, which indicates the need to continue strength training with the additional attention on movement patterns during explosive tasks. Firefighter 2 (Figure 3) was below average on all strength and power measures, which suggests this firefighter is either experiencing undue fatigue or lacks fundamental strength and power capacities. Thus, the impending training program(s) should consider individual fatigue levels, as well as training all facets of a force-velocity profile [78]. Firefighter 3 (Figure 3) was well above-average for all strength measures and CMJ performances. However, Firefighter 3 was slightly below average in DJ performances and had low reactive strength capabilities, which suggests the need for explosive movements in their training program to induce adaptations for improving the ability to quickly decelerate and reaccelerate. Since Firefighter 3 also showed above-average CMJ asymmetries and shallower countermovement depths, their training should also be aimed to improve movement competencies. Conversely, Firefighter 4 (Figure 3) performed poorly on unloaded and loaded CMJs. Considering the above-average DJ height and average relative strength, Firefighter 4 may require coaching efforts aimed to improve jumping strategies and the addition of velocity and power-focused training efforts (i.e., velocity-based training and plyometrics). Notice the importance of considering strength and power capabilities when making training recommendations, as weaker individuals would improve ballistic power performances from strength training more than power training alone [79]. Nonetheless, by visualizing these individual performances compared to group averages, using Z-scores for each metric displayed in radar plots (also applicable to other visualization strategies such as conditionally formatted tables, time series comparisons), practitioners can identify areas for improvement for each individual or group of individuals (Table 2).

4. Testing Performances for Training Related Adaptations

Increasing the frequency of performance assessments from annually to semi-annually provides the ability to closely monitor chronic training adaptations or instances of detraining, so long as accurate data are collected. Ideally, these semi-annual assessments are strategically deployed at pre/post time points relative to the various periodization phases within a given tactical population. Granted, unlike athletics, where a calendar year is much more predictable (than tactical environments), planning out testing sessions contingent upon periodization strategies very well may be a fluid (but still necessary) scenario. Since the intended outcome of a training block may be maintained power and strength while improving aerobic capacity and body composition (reduced body fat mass), relative force-time metrics should be used for comparisons between and within individuals to account for fluctuations in body mass. Otherwise, the assessments and their respective force-time metrics should reflect the intended training adaptations of improved strength and power. For example, when testing CMJ, main performance outcomes and/or driving factors should be monitored to indicate the intended adaptation of increased power-producing capabilities (i.e., jump height, relative mean power, and modified reactive strength index (RSImod)). Additional force-time metrics can be used to identify training adaptations, as they are often considered driving factors for the CMJ due to high collinearity, such as peak and mean concentric forces and concentric impulse [80,81,82]. Yet, force-time metrics from the eccentric phase may inform the movement strategy used to obtain the outcome objective (e.g., eccentric velocity and countermovement depth). A shorter, forceful, and powerful eccentric/braking phase improves performances through stretch-shortening cycle efficiency [83]. These metrics may be particularly useful alongside the countermovement depth, as a deeper countermovement is effective with appropriate baking duration to permit faster velocities but often requires longer durations and additional strength throughout a longer range of motion. Moreover, a shallower countermovement with a stable or longer braking duration will be less powerful and likely coincide with reductions in jumping performances.
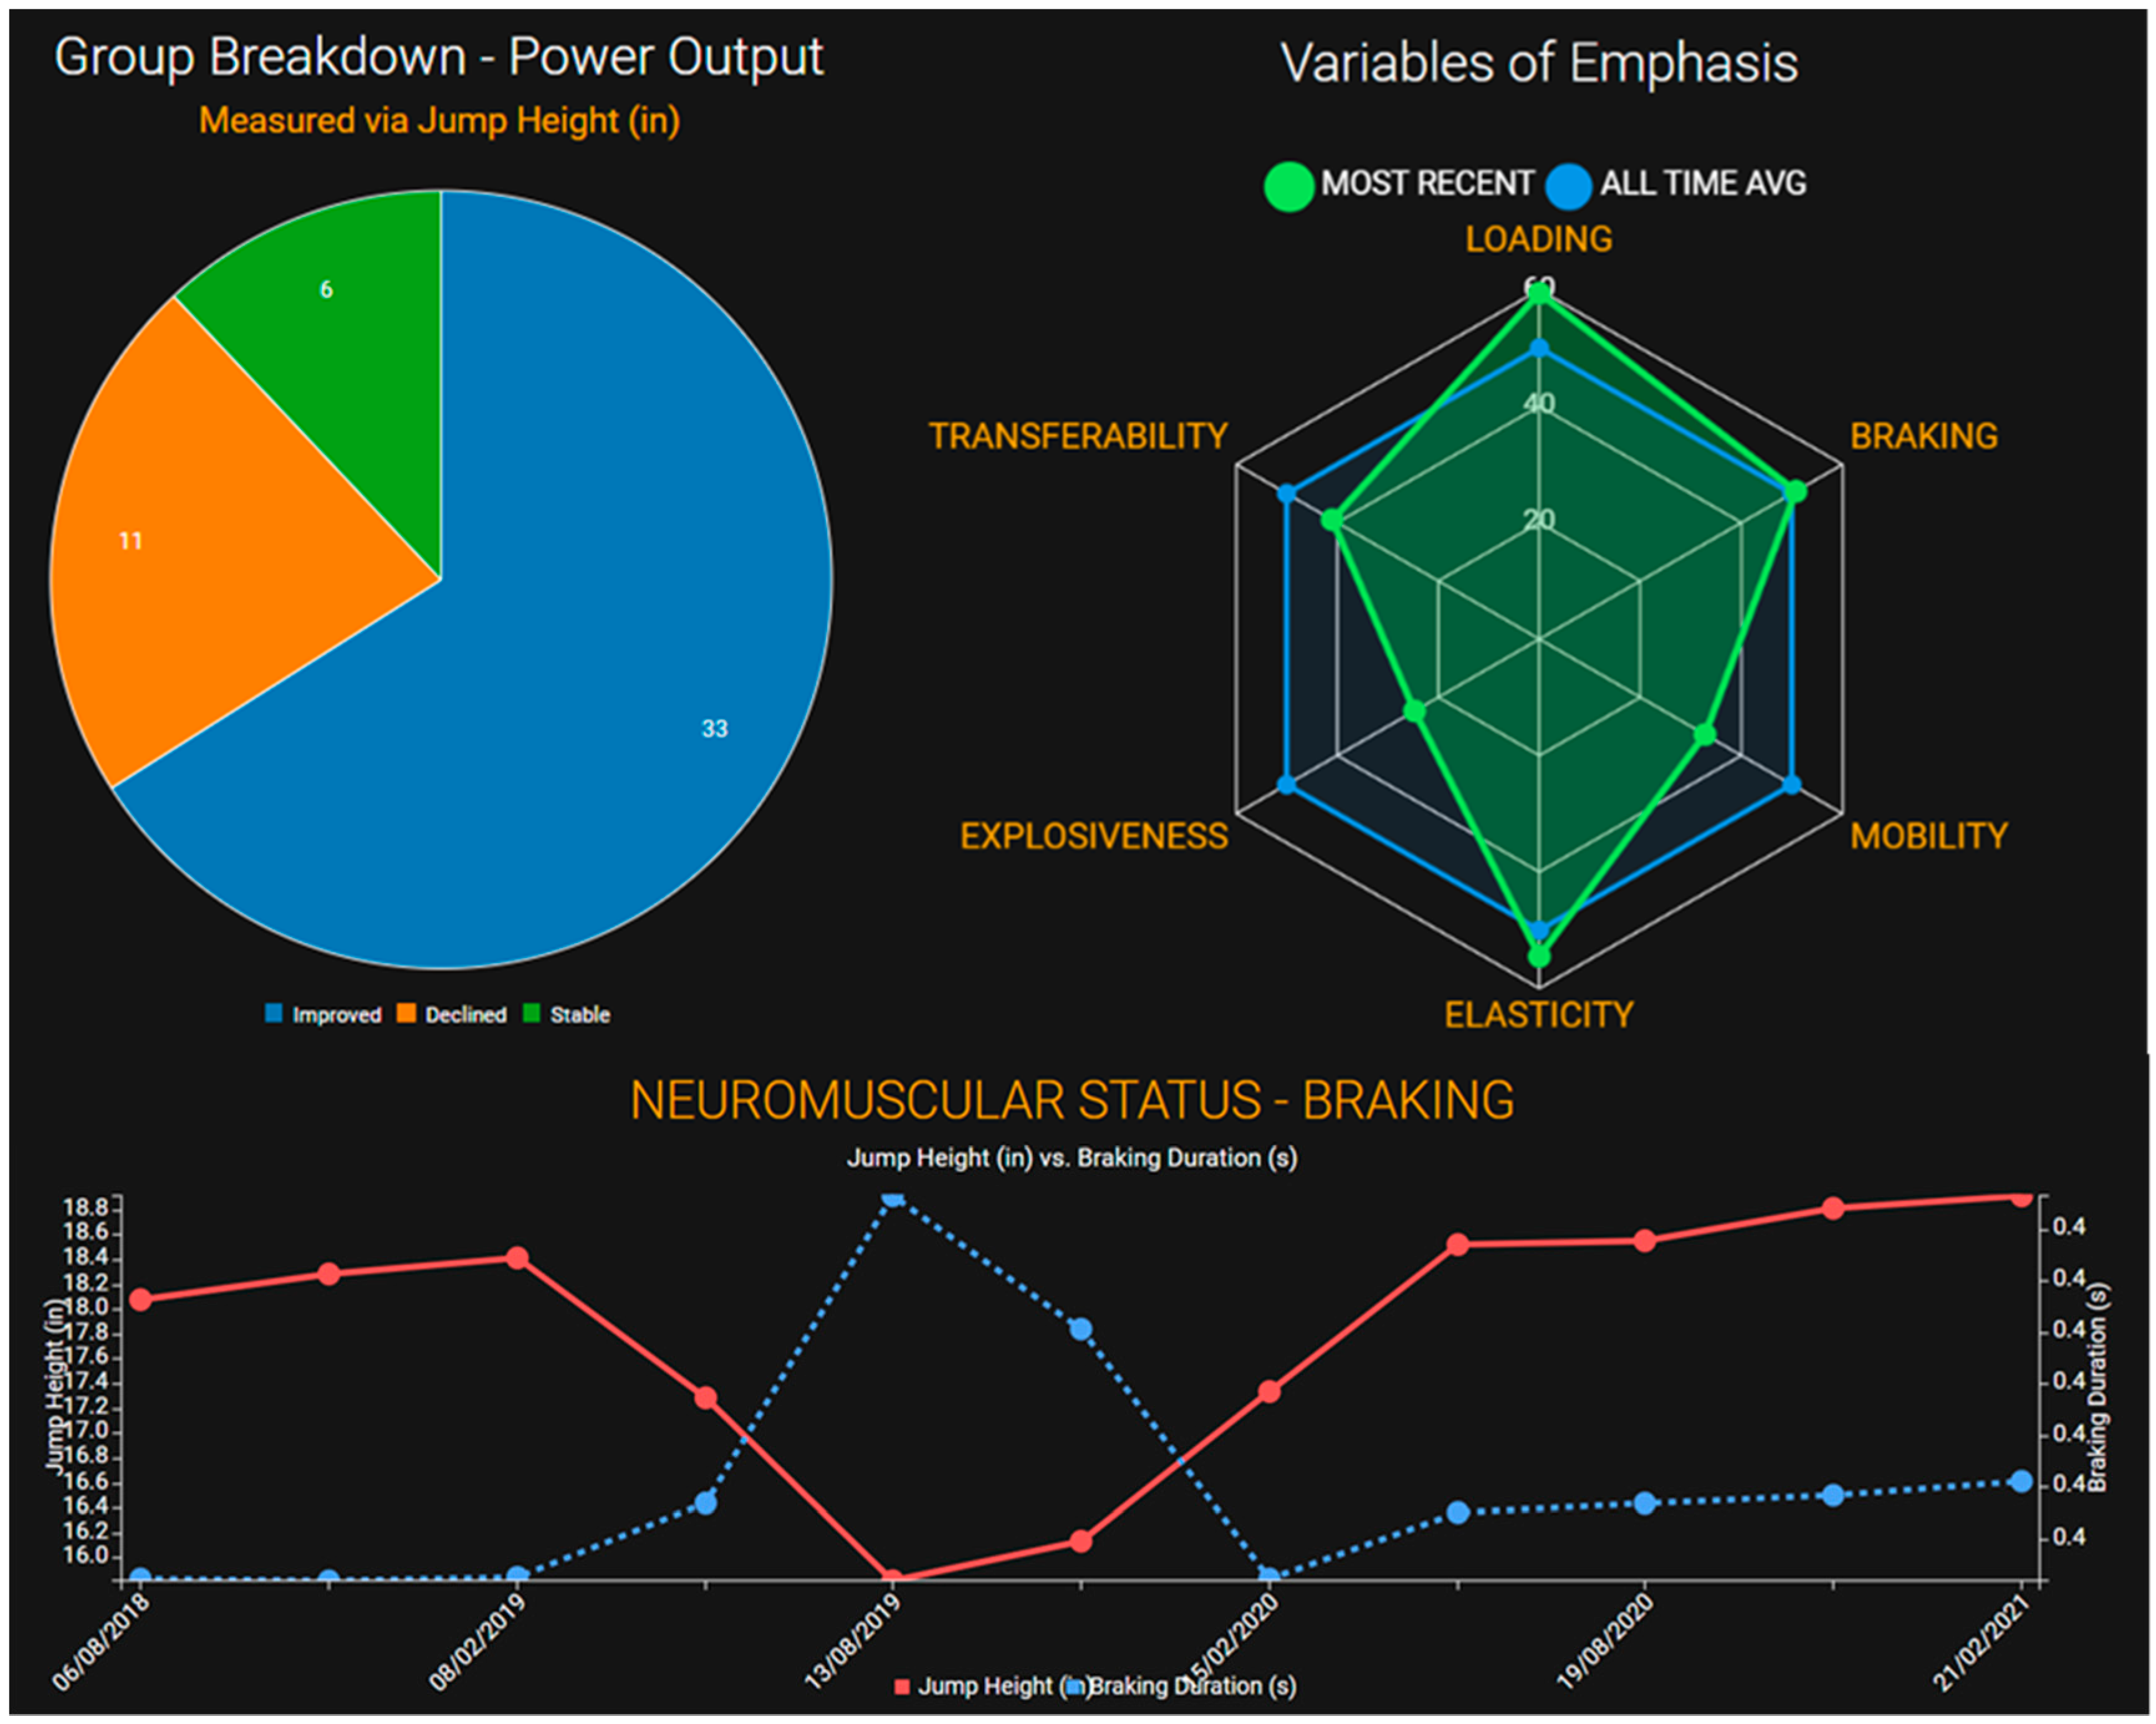
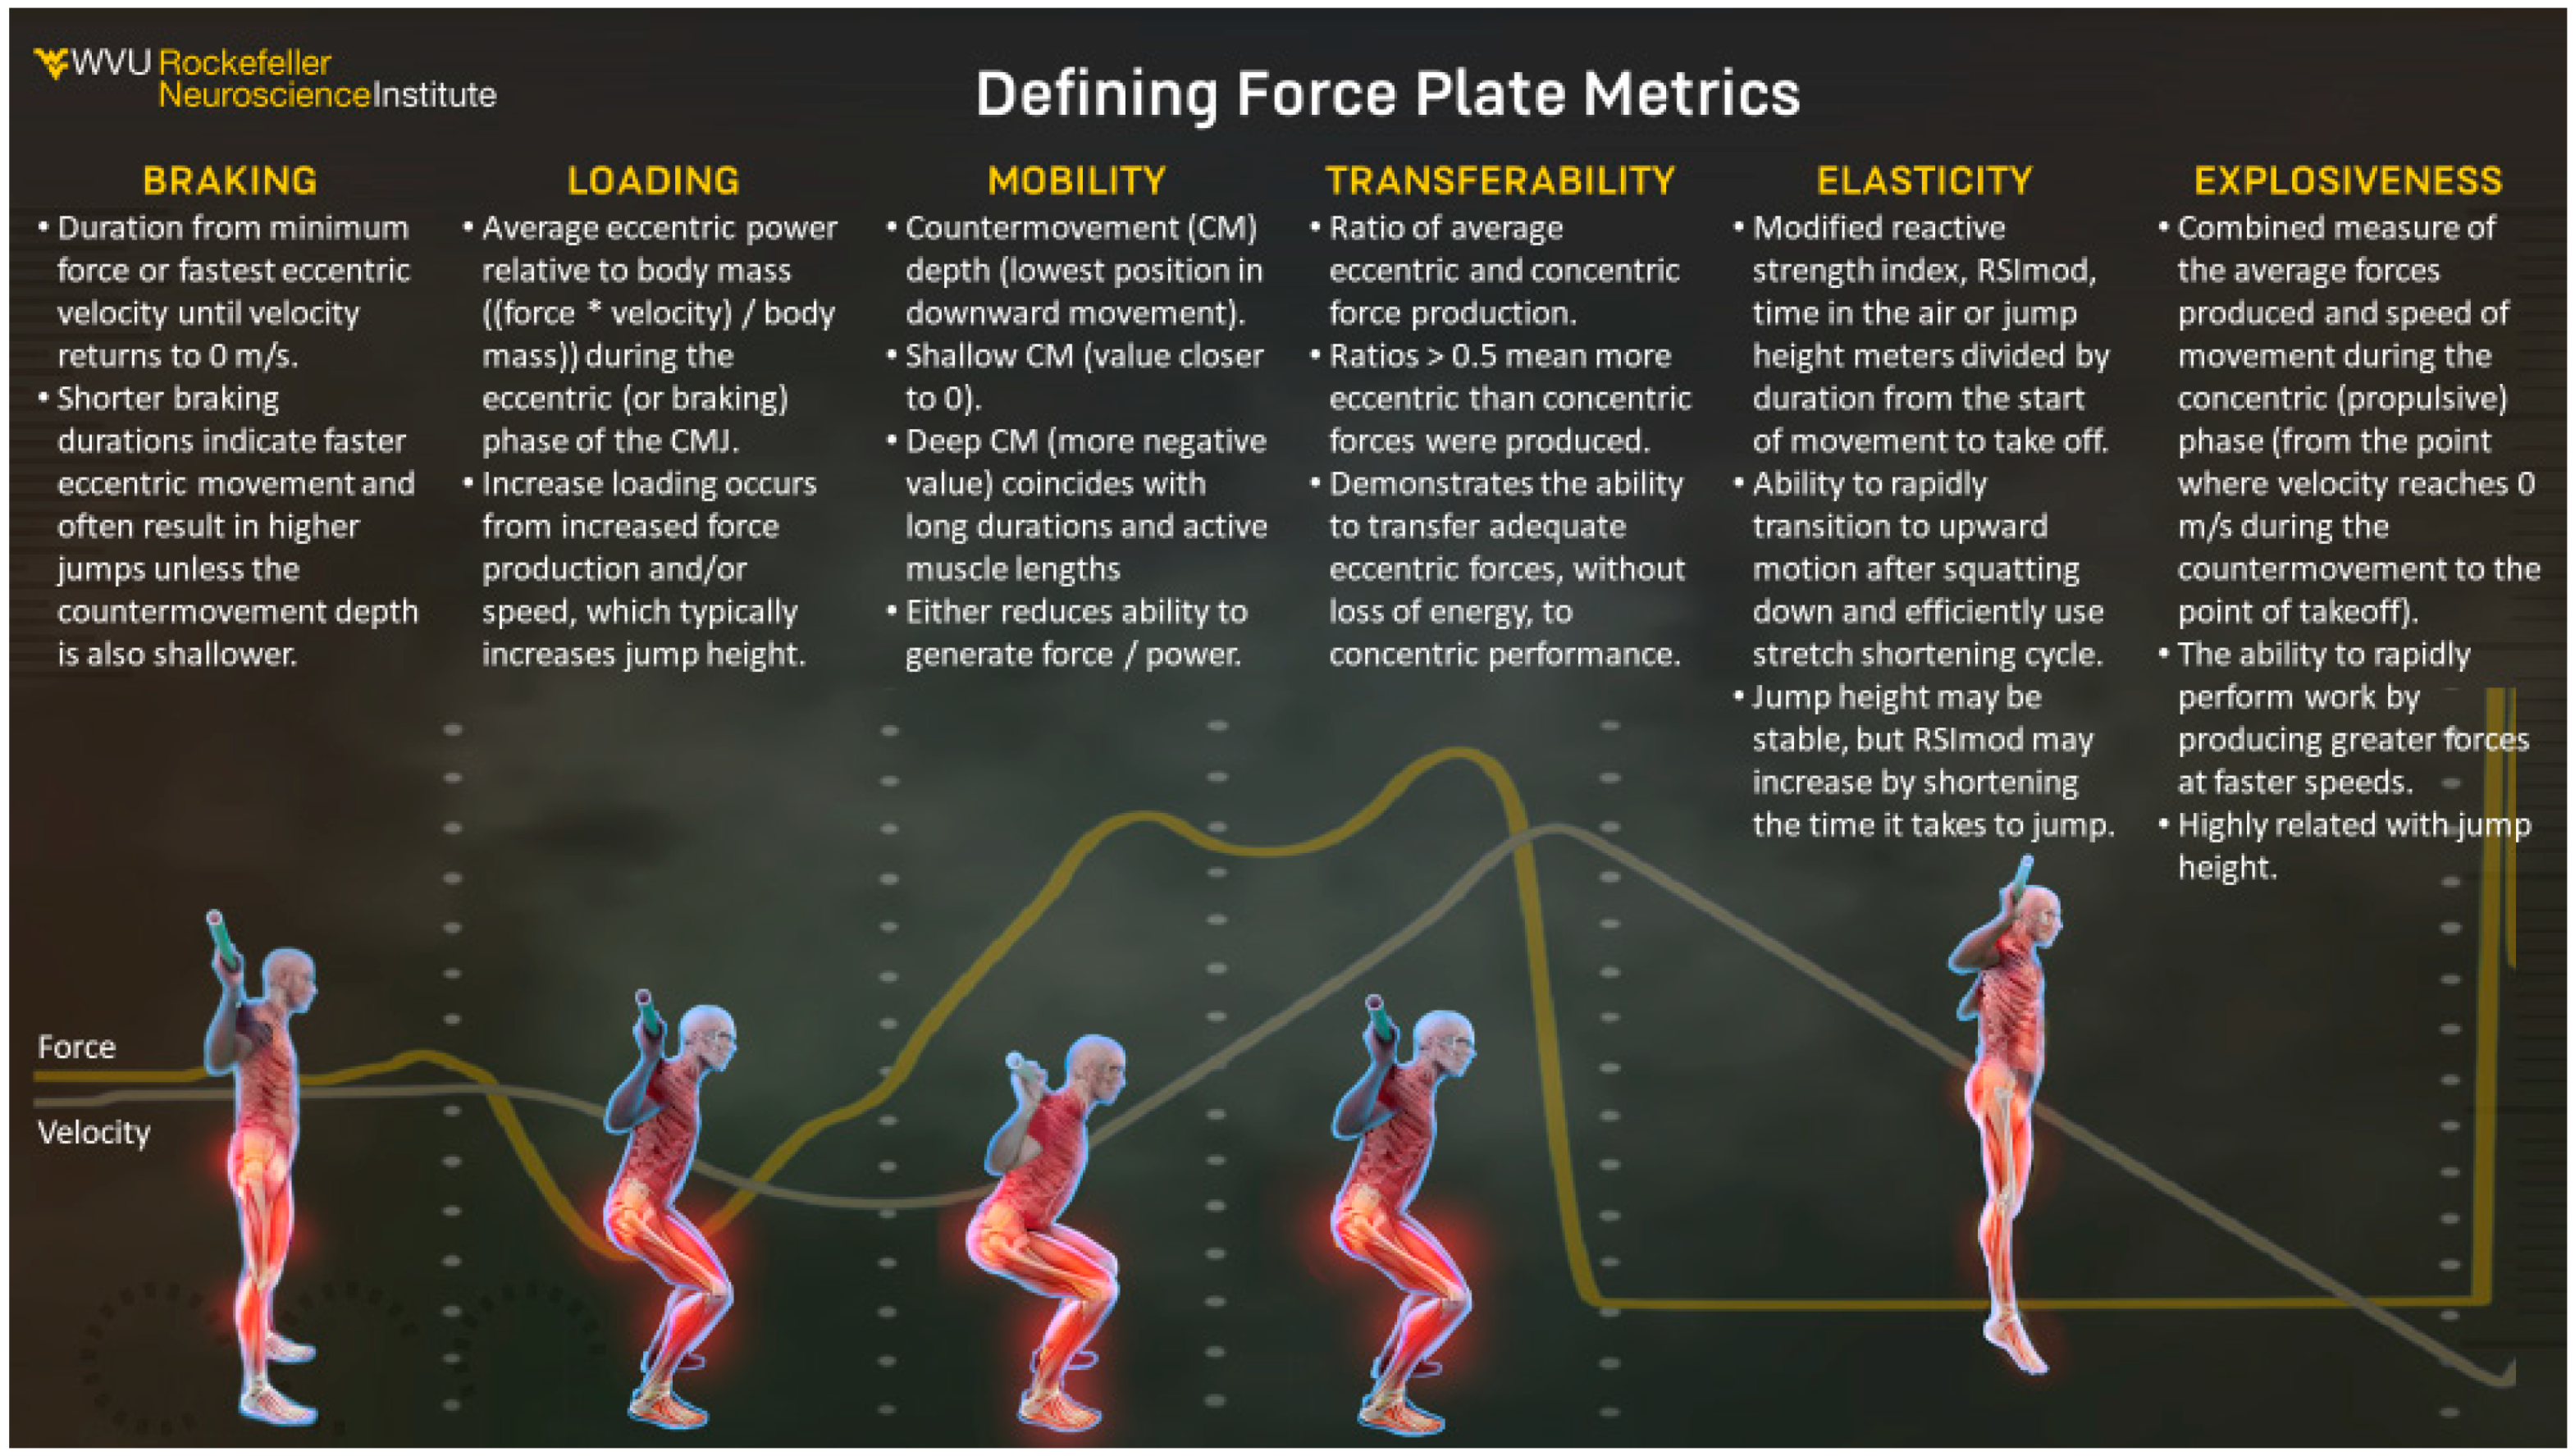
Thus, monitoring a few metrics of performance outcomes (i.e., jump height and scaled peak power), driving factors (i.e., scaled concentric mean power or impulse and mod-RSI), and movement strategies (i.e., eccentric velocity and countermovement depth and mean force asymmetries) would be most suitable for properly tracking performance adaptations [50]. To start, the overall status of the group can be assessed through a simple pie chart (Figure 4, Group Breakdown—Power Output) that displays the number of individuals noting increased, decreased, or maintained performances based on intra-individual Z-scores. In doing so, the individuals experiencing performance reductions may be further examined and their training programs adjusted accordingly. After identifying those with decrements in jump performances, evaluating metrics from domains of jumping characteristics, named “Variables of Emphasis”, may help identify areas of weakness or cause for reduced jump outcomes. The raw force-time curve metrics are renamed using more applicable nomenclature to be easily understandable and relatable for practitioners and tactical personnel. Definitions of these variables and coinciding calculated force-time curve metrics are shown in Figure 5. From a data visualization perspective, in Figure 4, the most recent score should be compared to the individual’s historical average through standard scores (such as a Z-score or STEN score) to identify their current status compared to their average historical status. The length of time for calculating historical values can be dictated by the practitioner based on their needs. For example, it could be based on the entire history of measurements to get an understanding of global changes, or it could be based on the phase of training to understand adaptations through that cycle. This is particularly useful at the individual level to explain changes in power production capabilities. The additional force-time metrics should also be investigated without decrements in jump performances, as high performers in fatigued states may alter their strategy to obtain the same jump outcome [81]. Although recommendations have been made within this manuscript, key performance indicators can be identified by plotting the force-time metric on the same longitudinal graph as jump height. In Figure 4, neuromuscular status through assessing the braking phase of the CMJ, the aforementioned relationship between braking duration and jump height is clear (i.e., braking duration decreases and jump height increases). Subsequently, training recommendations can be made based on the alterations to specific performance metrics in relation to jump outcomes.

Case Study Scenario 2: Training Adaptations

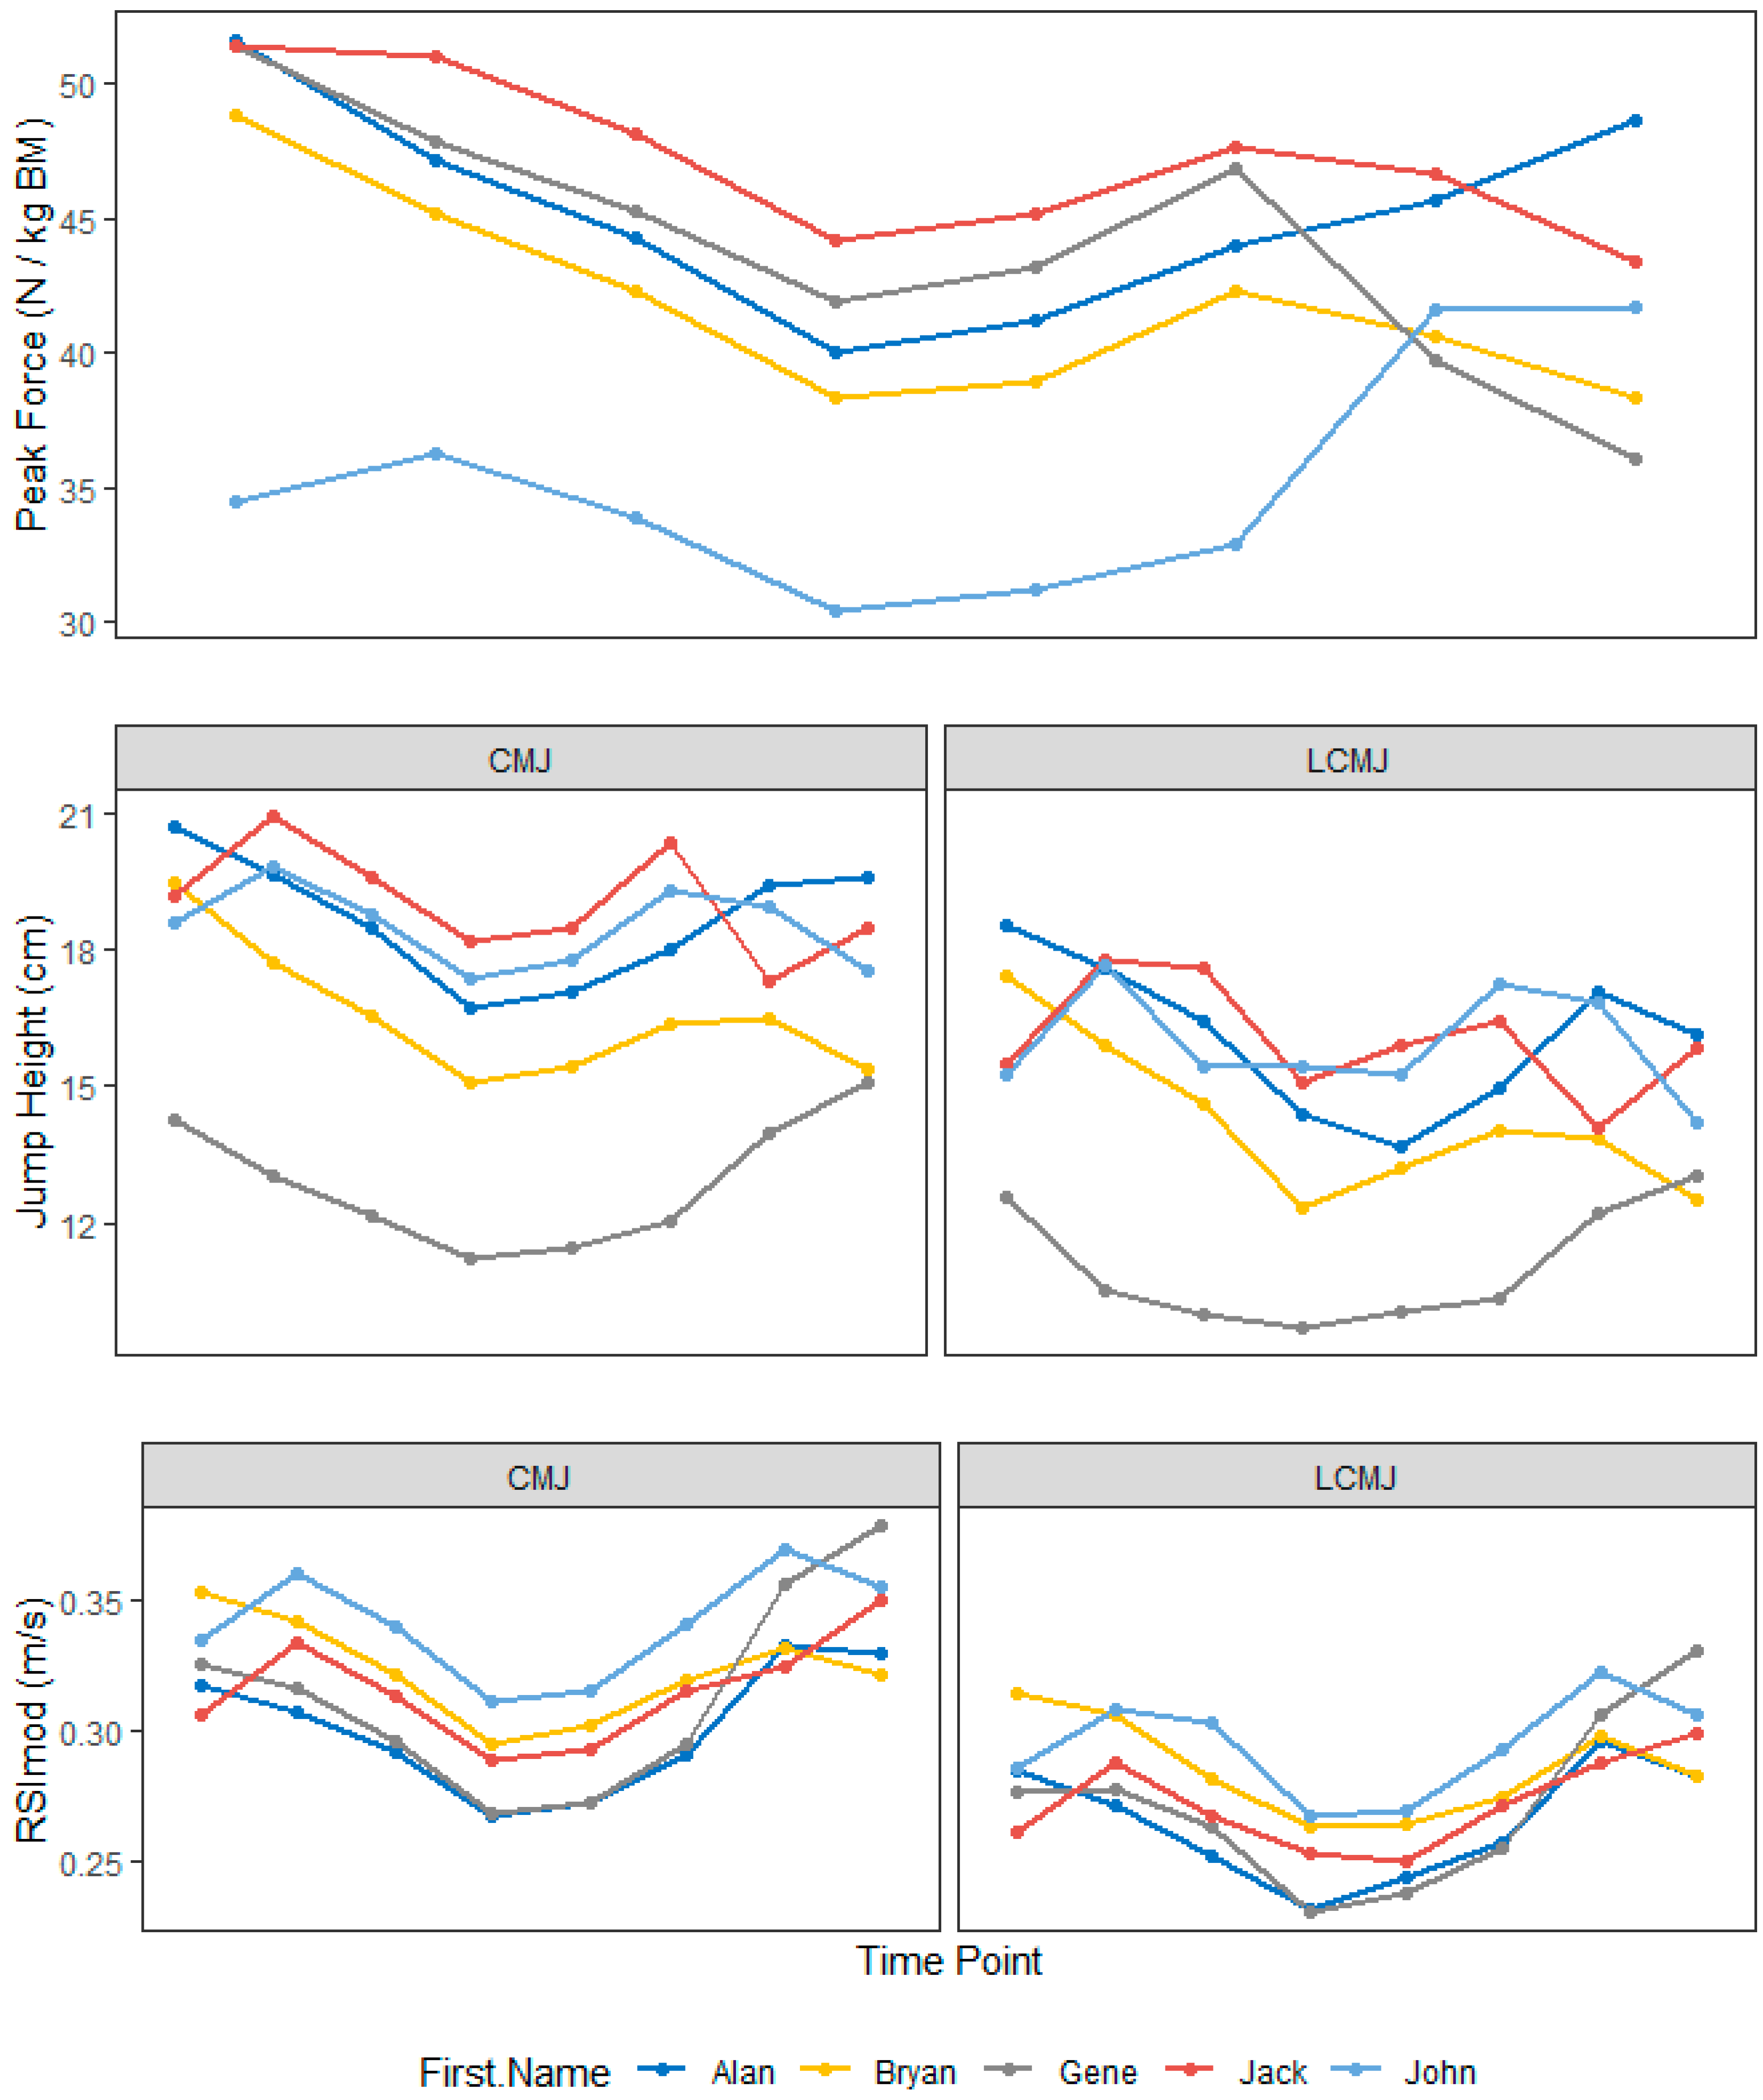
There are many theories on proper training protocols to elicit adaptations in tactical populations. Since many tactical training programs include aerobic/endurance-based tasks (i.e., combat training, prolonged ruck marches, field/shoot house training), the addition of high volume and low-intensity steady state cardiovascular training may interfere with cardiorespiratory and neuromuscular adaptations [84]. On the contrary, adding strength training has improved strength, power, endurance, speed, and occupational obstacle course times, proving the use of strength training for occupational preparedness and performance [85,86]. It should also be noted that while power training is beneficial for improving power-related metrics, stronger individuals may benefit more from this style of training [87]. Thus, it has been suggested by many that individualized training programs based on periodization and progressive overload theories be used to create optimal training programs for eliciting performance adaptations and subsequently reducing the risk of injuries [84,85,86]. Monitoring at the “meso level” with frequent performance assessments (i.e., every 8–12 weeks) illustrates whether the prescribed training programs are eliciting the intended adaptations through precise quantifications of performance alterations [88]. Over time, meso-level monitoring can be linked together with more robust, macro-level monitoring to help practitioners view development across the annual plan. This proactive approach identifies maladaptive responses to be corrected with necessary adjustments to ensure improved physical preparedness prior to occupational tasks, which can improve overall safety and health. It is beyond the scope of this paper, but the timeline for training adaptations is important to understand for estimating what training adaptions should be occurring at a given time frame. For example, strength and power adaptations may be noted at a faster rate in untrained versus trained populations, but in general, may be noticed following 8–12 weeks of training (Figure 6).

5. Testing to Monitor Neuromuscular Fatigue and Detraining

More frequent or “micro-level” monitoring via bi-weekly, weekly, or intra weekly assessments help to identify neuromuscular fatigue more quickly via decrements in force-generating capacities [56]. When trying to determine the ideal frequency for testing, there are several factors to consider, such as throughput and equipment limitations. Most importantly is the potential for test fatigue due to the implementation of force plate assessments at a high frequency. As mentioned earlier and described in greater detail elsewhere [41], maximal effort jump attempts are fundamental to the validity and reliability of force plate tests. Consequently, it is left to the practitioners to determine whether intra-weekly or weekly (sometimes even bi-weekly) testing would become too monotonous for their population. In these instances, it is recommended that test frequency is extended to bi-weekly or monthly. Proper use of this more immediate feedback allows appropriate, timely adjustments to training programs from unexpected responses caused by the unpredictable nature of occupational demands. The fluctuations in weekly training volume and intensity may lead to decreased or maintained jump performances depending on the individual. Conceptually, micro and meso-level monitoring feed into the “macro-level” training program by providing a robust description of long-term adaptive alterations, creating the roadmap for the course taken to reach the annual training adaptation. Thus, it is helpful for practitioners to have a training prescription in which predetermined expectations are deployed, which allows reflection and interpretation based upon comparing desired/anticipated changes vs. actual outcomes. Then, eliciting functional overreaching via minimal neuromuscular fatigue to elicit training adaptations and prepare for high stressors [14,19] would not be an alarm for negative training responses, but rather an expected decrease that should be followed by an eventual increase in performance (adaptation). Nonetheless, if data lead a practitioner to be concerned, programmatic alterations (e.g., lower training volume and/or training intensity and increased recovery modalities) may then be implemented to guide future training towards a more desirable long-term adaptation, all of which is directed by objective, reliable, and actionable data. Collectively, micro-level monitoring can help to identify performance reductions from detraining [89] or neuromuscular fatigue (i.e., overreaching/overtraining) [90] to ensure individuals take necessary steps (e.g., retrain or recover) to regain occupational physical readiness.
Having appropriate plans of action for data management, as previously discussed, is particularly important for monitoring frequent assessments to provide immediate feedback. Some force plate software have embedded cloud-based data management systems, which allow immediate comparisons to previous records. These databases also may be connected to other AMS (e.g., Fusion Sport Smartabase, Kinduct, Kitman Labs, RockDaisy, Edge10) through application program interfaces (API), which allow easy integration of force-plate data into the holistic monitoring system. Further advantages for AMS allow for additional data to be seamlessly connected for more context, such as training load from global positioning systems (GPS) and heart rate monitoring systems, sleep tracking, subjective wellness, to name a few. Regardless of whether force-plate data are merged with other objective and subjective health and performance metrics, “red flags” can be set to alert the practitioner when an individual has substantial performance decrements. These alerts suggest the individual may require additional training/recovery adjustments to their training cycle, particularly if the group generally displays stable or improved responses. Within the AMS, general recommendations are made based on specific outcomes for each metric. An example is displayed in Figure 7, where a decrease in specific force-time metrics coincides with general training recommendations. These recommendations are simply a guide, as responses to outcomes may overlap and context from the individual’s or group’s training need to be considered (i.e., was the testing conducted immediately following an intensive bout of training). Further, it is also worth considering that although the training recommendations for counteracting detraining or below group average performances do not always focus solely on strength and conditioning alterations, rather each metric may be altered from neuromuscular fatigue that require recovery modality implementations rather than training adjustments. For these reasons, holistic data sets comprise not only force plate data but other health and performance constructs to generate a more complete and informative profile.
As with many training and coaching decisions, assessment information should be placed in the appropriate context and largely based on the specific needs of the individual (e.g., stage of development, tactical requirements) and the intended goals of the training prescription [91]. If the intended training outcomes are not induced (i.e., impaired power and strength rather than maintained or improved), then identifying the factors contributing to the maladaptation are necessary [91]. For example, training recommendations in Figure 7 based on explosive exercise are likely more helpful for individuals with established baseline strength (e.g., >2x bodyweight back squat) [87]. In developmental stages, individuals may benefit more from improving base muscular strength levels to improve force characteristics during explosive tasks. The nervous system adaptations from strength training alone may eventually become more asymptotic and require power-based training inclusive of explosive movements such as plyometrics or Olympic weightlifting. If a well-strength-trained individual is digressing in multiple areas, the human performance practitioner should plan the necessary training and recovery to properly develop the individual over time, versus an immediate “fix-all” approach [92]. This is particularly important when requiring multiple physiological adaptations that are conflicting, as often seen in tactical populations, where the training of one adaptation (e.g., maximal strength/power) is dampened by the adaptive response of another (e.g., cardiovascular training).

Case Study Scenario 3: Monitoring Neuromuscular Fatigue

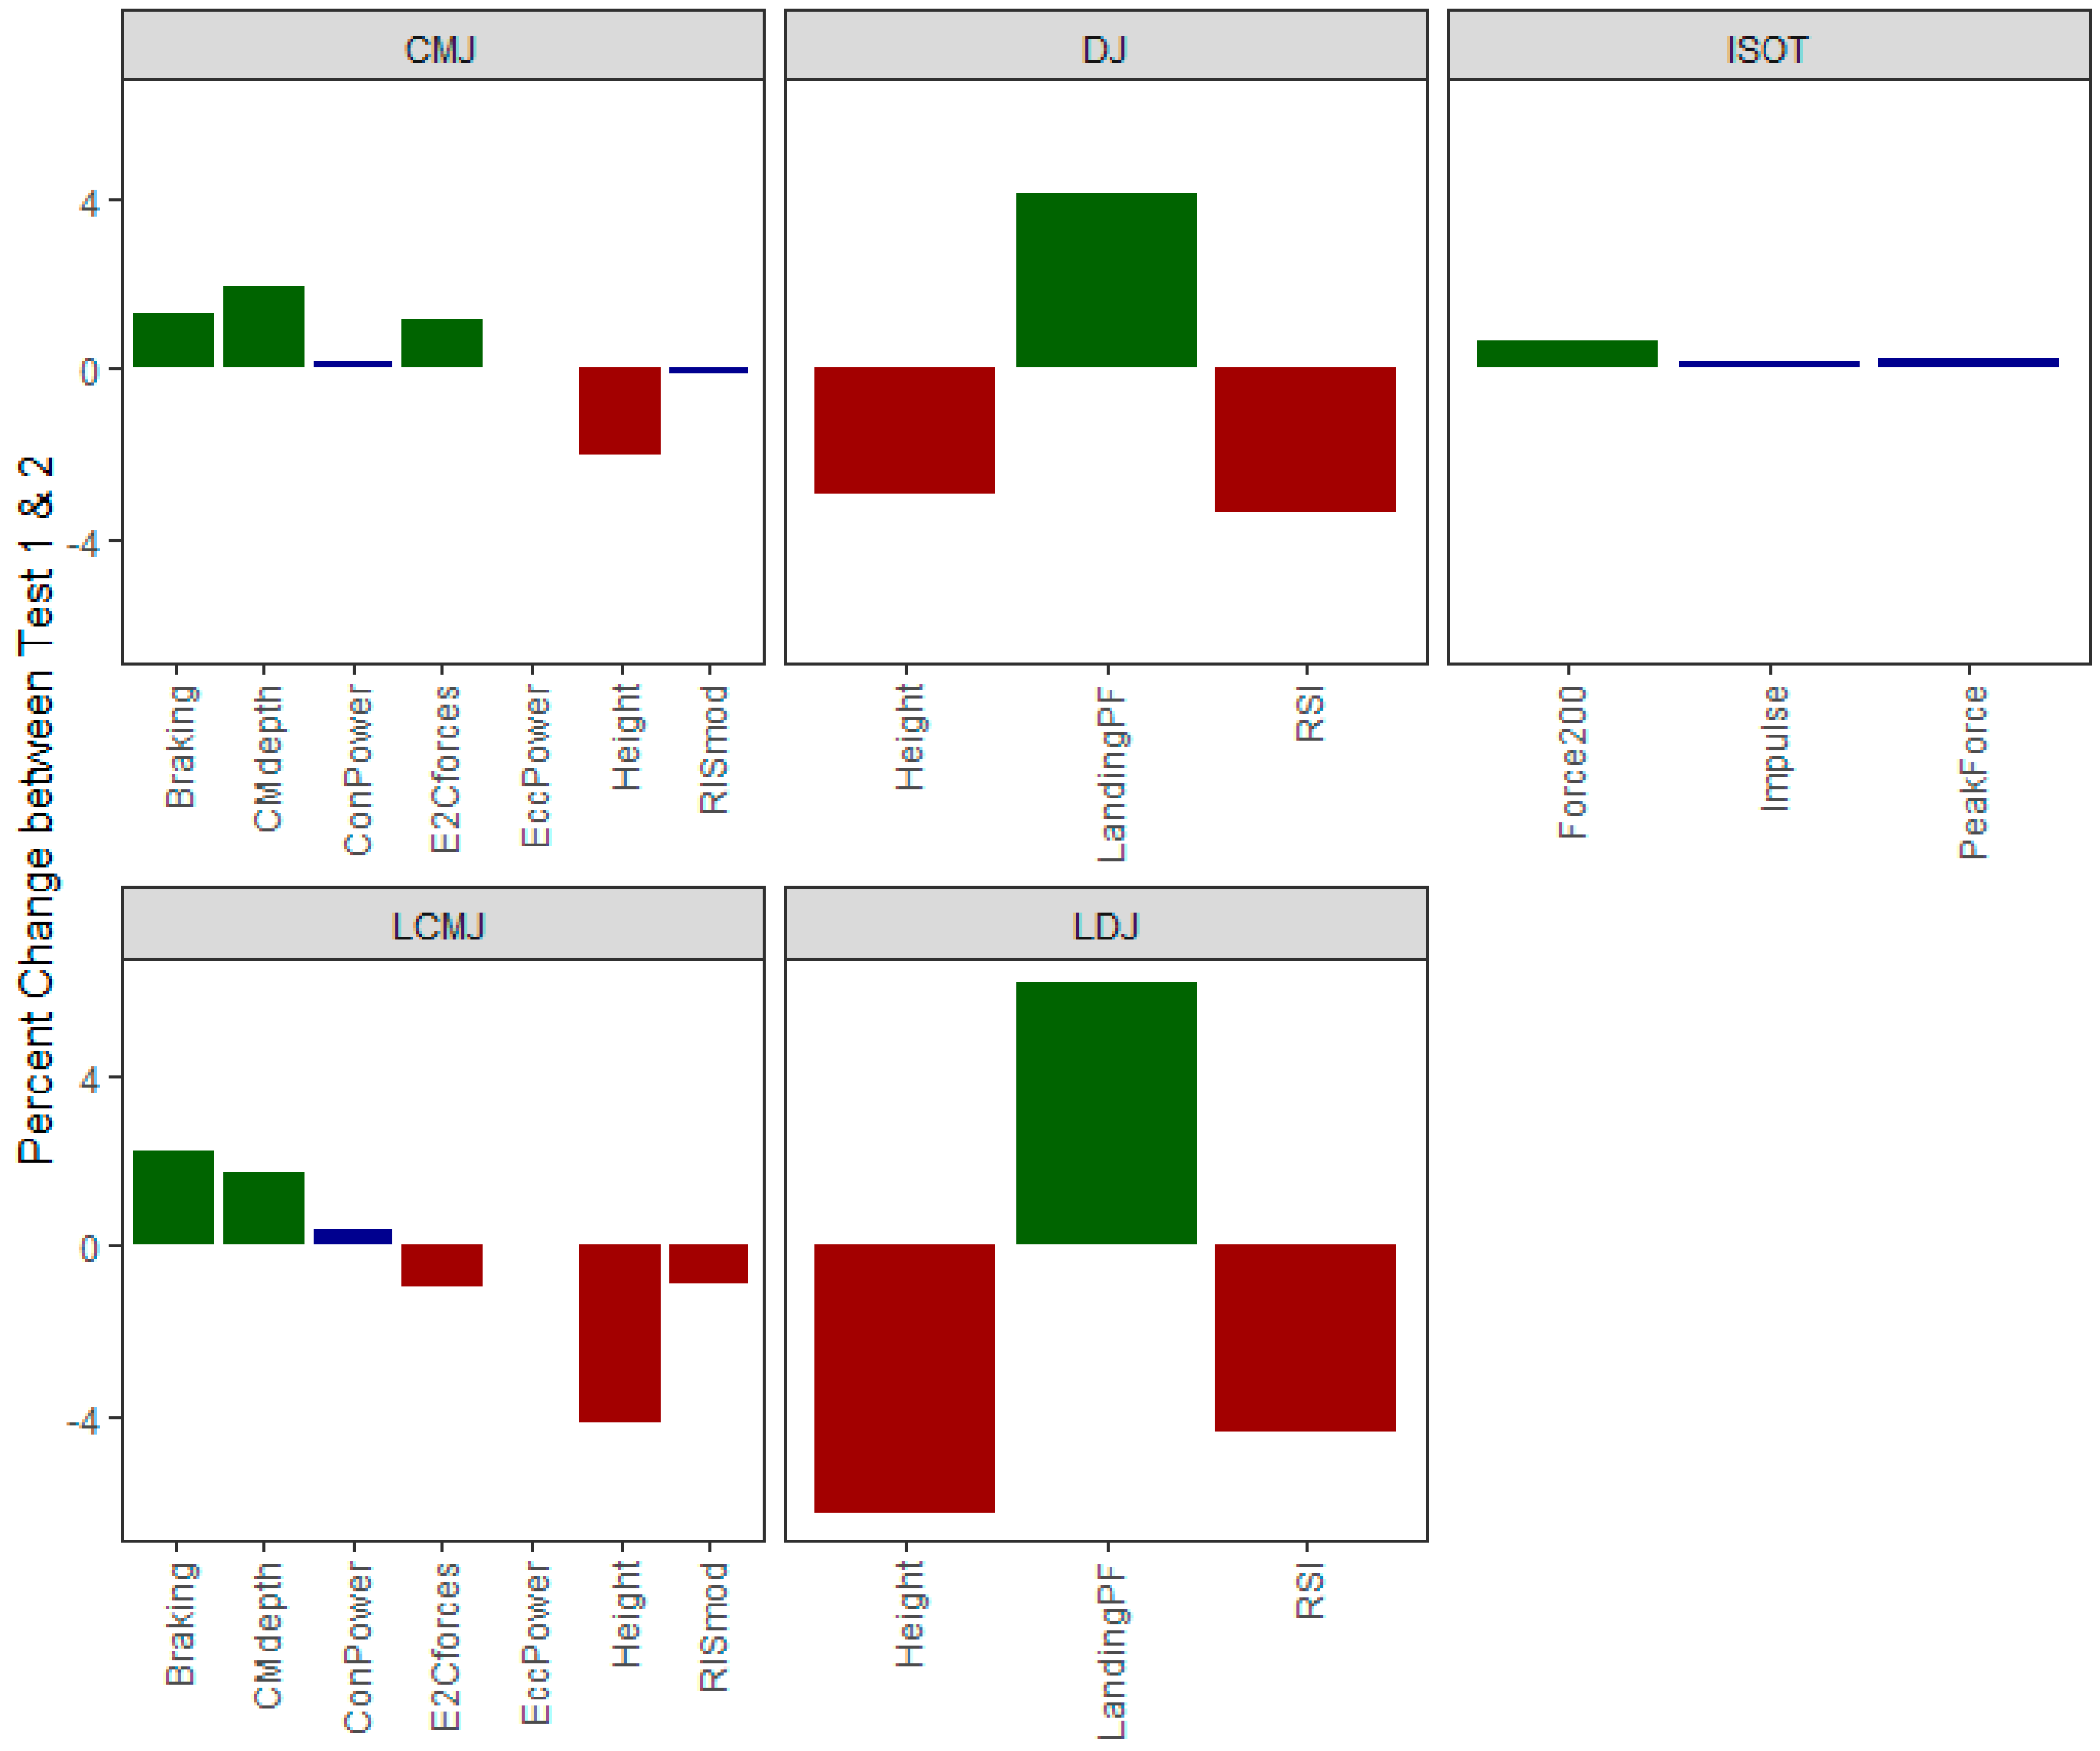
Continuing with the example in Figure 6, these data were manufactured to demonstrate percent changes in variables between testing before and after 4 weeks of intensive training. The bars in Figure 8 can be color-coded to illustrate improved, maintained, or decreased performances between the time points based on group responses. In this figure, the isometric test (ISOT) demonstrated very subtle changes between the time points, which is common as this is a relatively stable measure and may not demonstrate changes in this short of a time period. However, the CMJ and DJ heights were lower, which may be due to the increase in braking durations and countermovement depths. Further, the eccentric to concentric mean force ratio was increased, which may reduce jumping capability. Thus, by monitoring strategy and loading-based metrics, the decline in jumping performances may be explained [81]. The loaded variations of these performances noted slightly greater declines compared to their unloaded variations, which may suggest their ability to handle load was negatively affected. This may be a result of the type of training leading up to the testing, as loaded tasks such as long-distance ruck marches may result in decreased ability to perform jumping tasks under stringent conditions (i.e., external load with a barbell or weighted vest). Thus, frequent monitoring is encouraged (when feasible) to indicate early signs of fatigue and understand when reductions in training load are necessary. By monitoring these variables, it is possible to understand why the decreases in jump abilities occur and allow clarity for instances of potentially unusual responses.

6. Monitoring Force Asymmetries

Although some have used interlimb asymmetries to indicate injury risk [93], the evidence remains largely unclear as to the magnitude of bilateral “deficiencies” that would place an individual at risk. The inconsistencies in reported asymmetries are mainly driven by the variability between individuals caused by numerous factors. For example, asymmetries from acute injuries that alter mechanics and force-producing capabilities may exist, to some degree, for several years after the injury [94]. The extent of the chronic increase in asymmetries is dependent on the rehabilitation process but is also more likely to occur following major injuries requiring extensive surgeries. Nonetheless, an asymmetry from an injury likely suggests the individual is favoring the healthy side, subsequently placing more physiological stress on the healthy limb. This compensatory movement pattern may result in elevated injury risk if it is not properly managed through structured rehabilitation and training progressions, which may be informed by close monitoring of force plate assessments throughout the recovery process. Likewise, specializing in a sport or occupation may encourage the development of asymmetries from repetitive tasks in which asymmetries are likely advantageous. The most common example of asymmetries is noted in baseball pitchers, with a dominant arm and leg being natural development for increased performances. In this case, the asymmetry that may be more concerning is the balance of muscle strength around the joint rather than between limbs or declinations in strength capacities within limb segments or ranges of motion over time. Lastly, smaller-scale factors may also influence asymmetries, such as anthropometrics (i.e., limb length differences) and physiology (i.e., lean body vs. fat mass differences).
As with the aforementioned performance and fatigue assessments, the ability to monitor asymmetries will rely on accurate baseline measurements. To start, identify the sensitivity of tests for detecting asymmetries, such that single-leg jumping tasks may highlight larger magnitudes of asymmetries than bilateral jumping tasks for the same individual [95]. Furthermore, the individual must face the correct direction on the force plate to consistently orient the left and right limbs for consistently accurate calculations. The learning curve to performing tasks, such as single-leg jumps, makes consistency between trials an important factor to consider. Wide ranges of asymmetries may occur, with some trials favoring the right, while other trials favor the left side, which clearly complicates insights derived from back-end data analysis. However, the average asymmetry across all trials may be closer to 0% and thus not concerning as the individual is capable of spreading the workload across limbs. Conversely, practitioners should be more alarmed when individuals consistently display a large asymmetry across several metrics, trials, and time points. Moreover, to truly understand asymmetries, analyses of metrics from various phases of a movement (i.e., concentric and eccentric actions of the CMJ), as well as various movements, are necessary across all populations of interest as they likely vary. For example, an individual may be more protective of rapid or heavily loaded movements, which will be shown more for certain tasks.
Nonetheless, information regarding asymmetries can be useful when addressed in an appropriate manner. For example, a law enforcement officer may have a 5% asymmetry in the lower limbs at baseline, but due to carrying unevenly distributed weight on their duty belt (i.e., firearm on the right leg), the asymmetry increases to 15% over two years on duty. This may be an indication to intervene in the training program and prescribe measures to improve this asymmetry. An increase in asymmetry may also occur more rapidly and be indicative of neuromuscular fatigue after acute intensive training bouts. Conversely, an improvement of asymmetries should be noted from the first testing session following an injury. Although the asymmetry may not return to baseline or equivalent of healthy counterparts, there should be improvements over time from rehabilitation. In conclusion, asymmetries may be useful monitoring tools for tactical populations, but care is required for implementing the testing and decision making. Asymmetries should not be used as a predictor for injury or performance capabilities as there is no clear value to determine asymmetries that are advantageous or detrimental. To make actionable decisions based on asymmetries, it is necessary to create normative data or percentile ranking scoring systems from in-house databases to account for the individual variation across populations. If these data or values do not exist for the population of interest, then monitoring asymmetries within individuals is a helpful alternative for understanding their responses to injuries or neuromuscular training [96]. Figure 9 depicts key concepts and examples of asymmetry values utilizing synthetic data.

7. Conclusions

Force plate assessments are valuable tools for implementing many variations of neuromuscular performance monitoring, but their complexity requires necessary precautions to ensure reliable and valid data are being collected before actioning (i.e., standardized protocols for warm-up, testing conditions, and instructions). Further, due to the load carriage requirements of tactical personnel, it is encouraged that appropriate assessments be conducted in unloaded and loaded conditions to showcase an individual’s ability to handle external loads in various conditions. Valid and reliable force-plate data can appropriately inform evidence-based training programs of necessary adjustments to the prescription of training types, volumes, and intensities, as well as recovery modalities. Force plate testing on an annual basis provides valuable insight into each individual’s neuromuscular performance capabilities (i.e., strength, power, load carriage, and force absorptive abilities). These performance scores may help indicate weak areas needing improvement to succeed at tactically relevant task requirements, especially at the group level. Depending on the force-time metric of specific assessments, training recommendations can then be made to improve an individual’s ability to conduct tactically relevant maneuvers requiring strength and/or power with proper movement mechanics (i.e., asymmetries and explosive movement patterns).
Meanwhile, more frequent testing (i.e., semi-annually and determined by training blocks) allows awareness of whether individuals are reaching the intended training adaptations. If strength or power metrics are decreased, training program adjustments can be made based on an informed decision surrounding changes to supportive force-time metrics. For example, by simultaneously monitoring confounding force-time metrics, practitioners can identify whether a decline in strength or power metrics was a result of moving through a significantly different countermovement or a potential direct loss of muscular function. The same strategies can be applied to weekly/bi-weekly assessments, which are useful for monitoring neuromuscular fatigue. Although the higher frequency of testing is valuable, it requires great attentive care to ensure maximal efforts are performed at every testing iteration, as test fatigue may set in and cause individuals to put forth less effort. To combat test monotony, motivational factors such as leaderboards may be worthwhile, or only conducting high-frequency test batteries during times of especially intensive training where injury risks are highest. Collectively, the implementation of neuromuscular fatigue monitoring and profiling assessments allows a holistic view of an individual’s neuromuscular performance progress over time. A short summary of the wide range of potential strategies for using force plate assessments in tactical populations is outlined in Table 3. Note, force plate data collection often requires a data management system to promote the capability of assessing historical trends in comparison to current outcomes and/or easy management of large quantities of individuals.

Author Contributions

The review was conceptualized by J.J.M., J.D.S. and J.A.H. The literature search and data collection were performed by J.J.M. and J.D.S. The manuscript was written by J.J.M. and J.D.S. The manuscript was critically reviewed and edited by J.R.M., W.G.H., S.M.G. and J.A.H. All authors have read and agreed to the published version of the manuscript.

Funding

This research was funded by Air Force Research Laboratory (AFRL) and Special Operations Forces Acquisition, Technology, and Logistics (SOCOM SOF AT&L) via KBR Contract # LX06000011.

Institutional Review Board Statement

Not applicable.

Informed Consent Statement

Not applicable.

Data Availability Statement

Not applicable.

Conflicts of Interest

The authors declare no conflict of interest.

References

  1. Kyröläinen, H.; Pihlainen, K.; Vaara, J.P.; Ojanen, T.; Santtila, M. Optimising training adaptations and performance in military environment. J. Sci. Med. Sport 2018, 21, 1131–1138. [Google Scholar] [CrossRef] [PubMed] [Green Version]
  2. Maupin, D.; Schram, B.; Orr, R. Tracking training load and its implementation in tactical populations: A narrative review. Strength Cond. J. 2019, 41, 1–11. [Google Scholar] [CrossRef]
  3. Lyons, K.; Radburn, C.; Orr, R.; Pope, R. A profile of injuries sustained by Law Enforcement Officers: A critical review. Int. J. Environ. Res. Public Health 2017, 14, 142. [Google Scholar] [CrossRef] [Green Version]
  4. Taylor, N.A.; Dodd, M.; Taylor, E.; Donohoe, A. A retrospective evaluation of injuries to Australian Urban Firefighters (2003 to 2012): Injury Types, Locations, and Causal Mechanisms. J. Occup. Environ. Med. 2015, 57, 757–764. [Google Scholar] [CrossRef] [PubMed]
  5. Wardle, S.L.; Greeves, J.P. Mitigating the risk of musculoskeletal injury: A systematic review of the most effective injury prevention strategies for Military personnel. J. Sci. Med. Sport 2017, 20, S3–S10. [Google Scholar] [CrossRef] [PubMed]
  6. Bullock, S.H.; Jones, B.H.; Gilchrist, J.; Marshall, S.W. Prevention of physical training–related injuries: Recommendations for the Military and other active populations based on expedited systematic reviews. Am. J. Prev. Med. 2010, 38, S156–S181. [Google Scholar] [CrossRef] [PubMed]
  7. Kaufman, K. Military training-related injuries surveillance, research, and prevention. Am. J. Prev. Med. 2000, 18, 54–63. [Google Scholar] [CrossRef]
  8. Knapik, J.J.; Graham, B.S.; Rieger, J.; Steelman, R.; Pendergrass, T. Activities associated with injuries in initial entry training. Mil. Med. 2013, 178, 500–506. [Google Scholar] [CrossRef] [PubMed] [Green Version]
  9. Dijksma, C.I.; Bekkers, M.; Spek, B.; Lucas, C.; Stuiver, M. Epidemiology and financial burden of musculoskeletal injuries as the leading health problem in the Military. Mil. Med. 2020, 185, e480–e486. [Google Scholar] [CrossRef] [Green Version]
  10. Knapik, J.J.; Grier, T.; Spiess, A.; Swedler, D.I.; Hauret, K.G.; Graham, B.; Yoder, J.; Jones, B.H. Injury rates and injury risk factors among Federal Bureau of Investigation new agent trainees. BMC Public Health 2011, 11, 920. [Google Scholar] [CrossRef] [Green Version]
  11. Knapik, J.J.; Sharp, M.A.; Canham-Chervak, M.; Hauret, K.; Patton, J.F.; Jones, B.H. Risk factors for training-related injuries among men and women in basic combat training. Med. Sci. Sports Exerc. 2001, 33, 946–954. [Google Scholar] [CrossRef] [PubMed]
  12. Ruble, P.; Silverman, M.; Harrell, J.; Ringenberg, L.; Fruendt, J.; Walters, T.; Christiansen, L.; Llorente, M.; Barnett, S.D.; Scherb, B.; et al. Medical and physical readiness of the U.S. Army Reserve for Noble Eagle/Enduring Freedom/Iraqi Freedom: Recommendations for future mobilizations. Mil. Med. 2005, 170, 443–450. [Google Scholar] [CrossRef] [PubMed] [Green Version]
  13. Kelly, E.W.; Bradway, L.F. A Team Approach to the treatment of musculoskeletal injuries suffered by Navy Recruits: A method to decrease attrition and improve quality of care. Mil. Med. 1997, 162, 354–359. [Google Scholar] [CrossRef] [PubMed] [Green Version]
  14. Cunanan, A.J.; DeWeese, B.H.; Wagle, J.P.; Carroll, K.M.; Sausaman, R.; Hornsby, W.G.; Haff, G.G.; Triplett, N.T.; Pierce, K.C.; Stone, M.H. The General Adaptation Syndrome: A foundation for the concept of periodization. Sports Med. 2018, 48, 787–797. [Google Scholar] [CrossRef]
  15. Nindl, B.C.; Barnes, B.R.; Alemany, J.A.; Frykman, P.N.; Shippee, R.L.; Friedl, K.E. Physiological consequences of U.S. Army Ranger Training. Med. Sci. Sport Exerc. 2007, 39, 1380–1387. [Google Scholar] [CrossRef]
  16. Trank, T.V.; Ryman, D.H.; Minagawa, R.Y.; Trone, D.W.; Shaffer, R.A. Running Mileage, Movement Mileage, and Fitness in Male U.S. Navy Recruits; Naval Health Research Center: San Diego, CA, USA, 2001; p. 8.
  17. Nindl, B.C.; Alvar, B.A.; Dudley, J.R.; Favre, M.W.; Martin, G.J.; Sharp, M.A.; Warr, B.J.; Stephenson, M.D.; Kraemer, W.J. Executive Summary from the National Strength and Conditioning Association’s Second Blue Ribbon Panel on Military Physical Readiness: Military Physical Performance Testing. J. Strength Cond. Res. 2015, 29 (Suppl. 11), S216–S220. [Google Scholar] [CrossRef]
  18. Hauschild, V.D.; DeGroot, D.W.; Hall, S.M.; Grier, T.L.; Deaver, K.D.; Hauret, K.G.; Jones, B.H. Fitness tests and occupational tasks of Military interest: A systematic review of correlations. Occup. Environ. Med. 2017, 74, 144–153. [Google Scholar] [CrossRef]
  19. Selye, H. The General Adaptation Syndrome and the Diseases of Adaptation. J. Clin. Endocrinol. 1946, 6, 117–230. [Google Scholar] [CrossRef]
  20. de la Motte, S.J.; Gribbin, T.C.; Lisman, P.; Murphy, K.; Deuster, P.A. Systematic review of the association between physical fitness and musculoskeletal injury risk: Part 2-muscular endurance and muscular strength. J. Strength Cond. Res. 2017, 31, 3218–3234. [Google Scholar] [CrossRef]
  21. de la Motte, S.J.; Lisman, P.; Gribbin, T.C.; Murphy, K.; Deuster, P.A. Systematic review of the association between physical fitness and musculoskeletal injury risk: Part 3—Flexibility, power, speed, balance, and agility. J. Strength Cond. Res. 2019, 33, 1723–1735. [Google Scholar] [CrossRef]
  22. West, S.W.; Clubb, J.; Torres-Ronda, L.; Howells, D.; Leng, E.; Vescovi, J.D.; Carmody, S.; Posthumus, M.; Dalen-Lorentsen, T.; Windt, J. More than a metric: How training load is used in elite sport for athlete management. Int. J. Sports Med. 2020. [Google Scholar] [CrossRef] [PubMed]
  23. Hoffman, J.R.; Chapnik, L.; Shamis, A.; Givon, U.; Davidson, B. The effect of leg strength on the incidence of lower extremity overuse injuries during Military training. Mil. Med. 1999, 164, 153–156. [Google Scholar] [CrossRef] [PubMed] [Green Version]
  24. Kollock, R.O.; Andrews, C.; Johnston, A.; Elliott, T.; Wilson, A.E.; Games, K.E.; Sefton, J.M. A Meta-analysis to determine if lower extremity muscle strengthening should be included in Military knee overuse injury-prevention programs. J. Athl. Train. 2016, 51, 919–926. [Google Scholar] [CrossRef] [PubMed] [Green Version]
  25. Orr, R.; Pope, R.; Peterson, S.; Hinton, B.; Stierli, M. Leg power as an indicator of risk of injury or illness in Police recruits. Int. J. Environ. Res. Public Health 2016, 13, 237. [Google Scholar] [CrossRef]
  26. Daniels, W.L.; Vogel, J.A.; Jones, B.H. Comparison of Aerobic Power and Dynamic Lift Capacity with Performance during a 5-Day Sustained Combat Scenario; Army Research Institute of Environmental Medicine: Natick, MA, USA, 1984. [Google Scholar]
  27. Dawes, J.; Lockie, R.; Kornhauser, C.; Holmes, R.; Orr, R. Relationships between absolute and relative strength and power in male Police Officers of varying strength levels. J. Sci. Sport Exerc. 2019, 1, 281–288. [Google Scholar] [CrossRef] [Green Version]
  28. Lockie, R.G.; Moreno, M.R.; McGuire, M.B.; Ruvalcaba, T.J.; Bloodgood, A.M.; Dulla, J.M.; Orr, R.M.; Dawes, J.J. Relationships between Isometric Strength and the 74.84-Kg (165-Lb) Body drag test in Law Enforcement Recruits. J. Hum. Kinet. 2020, 74, 9. [Google Scholar] [CrossRef]
  29. Muirhead, H.; Orr, R.; Schram, B.; Kornhauser, C.; Holmes, R.; Dawes, J.J. The Relationship between fitness and marksmanship in Police Officers. Safety 2019, 5, 54. [Google Scholar] [CrossRef] [Green Version]
  30. Lockie, R.G.; Dawes, J.J.; Balfany, K.; Gonzales, C.E.; Beitzel, M.M.; Dulla, J.M.; Orr, R.M. Physical fitness characteristics that relate to work sample test battery performance in Law Enforcement Recruits. Int. J. Environ. Res. Public Health 2018, 15, 2477. [Google Scholar] [CrossRef] [Green Version]
  31. Moreno, M.R.; Dulla, J.M.; Dawes, J.J.; Orr, R.M.; Cesario, A.; Lockie, R.G. Lower-body power and its relationship with body drag velocity in Law Enforcement Recruits. Int. J. Exerc. Sci. 2019, 12, 847–858. [Google Scholar]
  32. Mala, J.; Szivak, T.K.; Flanagan, S.D.; Comstock, B.A.; Laferrier, J.Z.; Maresh, C.M.; Kraemer, W.J. The role of strength and power during performance of high intensity Military tasks under heavy load carriage. US Army Med. Dep. J. 2015, 4, 3–11. [Google Scholar]
  33. Dawes, J.J.; Lindsay, K.; Bero, J.; Elder, C.; Kornhauser, C.; Holmes, R. Physical fitness characteristics of high vs. low performers on an occupationally specific physical agility test for patrol officers. J. Strength Cond. Res. 2017, 31, 2808–2815. [Google Scholar] [CrossRef]
  34. Kraemer, W.J.; Mazzetti, S.A.; Nindl, B.C.; Gotshalk, L.A.; Volek, J.S.; Bush, J.A.; Marx, J.O.; Dohi, K.; GÓmez, A.L.; Miles, M.; et al. Effect of resistance training on women’s strength/power and occupational performances. Med. Sci. Sport Exerc. 2001, 33, 1011–1025. [Google Scholar] [CrossRef] [Green Version]
  35. Knapik, J.J.; Harman, E.A.; Steelman, R.A.; Graham, B.S. A Systematic review of the effects of physical training on load carriage performance. J. Strength Cond. Res. 2012, 26, 585–597. [Google Scholar] [CrossRef] [PubMed]
  36. Pihlainen, K.; Santtila, M.; Häkkinen, K.; Kyröläinen, H. Associations of physical fitness and body composition characteristics with simulated military task performance. J. Strength Cond. Res. 2018, 32, 1089–1098. [Google Scholar] [CrossRef] [Green Version]
  37. Nindl, B.C.; Castellani, J.W.; Warr, B.J.; Sharp, M.A.; Henning, P.C.; Spiering, B.A.; Scofield, D.E. Physiological employment standards III: Physiological challenges and consequences encountered during international military deployments. Eur. J. Appl. Physiol. 2013, 113, 2655–2672. [Google Scholar] [CrossRef] [PubMed]
  38. Friedl, K.E.; Knapik, J.J.; Kkinen, K.H.; Baumgartner, N.; Groeller, H.; Taylor, N.A.S.; Duarte, A.F.A.; Jones, B.H.; Kraemer, W.J.; Nindl, B.C. Perspectives on aerobic and strength influences on military physical readiness: Report of an international military physiology roundtable. J. Strength Cond. Res. 2015, 29, S10–S23. [Google Scholar] [CrossRef]
  39. Gorostiaga, E.M.; Navarro-Amézqueta, I.; Calbet, J.A.L.; Hellsten, Y.; Cusso, R.; Guerrero, M.; Granados, C.; González-Izal, M.; Ibañez, J.; Izquierdo, M. Energy metabolism during repeated sets of leg press exercise leading to failure or not. PLoS ONE 2012, 7, e40621. [Google Scholar] [CrossRef]
  40. Izquierdo-Gabarren, M.; González de Txabarri Expósito, R.; García-Pallarés, J.; Sánchez-Medina, L.; Sáez de Villarreal, E.S.; Izquierdo, M. Concurrent endurance and strength training not to failure optimizes performance gains. Med. Sci. Sport Exerc. 2009, 42, 1191–1199. [Google Scholar] [CrossRef] [PubMed] [Green Version]
  41. Merrigan, J.J.; Stone, J.D.; Thompson, A.G.; Hornsby, W.G.; Hagen, J.A. Monitoring neuromuscular performance in military personnel. Int. J. Environ. Res. Public Health 2020, 17, 9147. [Google Scholar] [CrossRef]
  42. Gajewski, J.; Michalski, R.; Buśko, K.; Mazur-Różycka, J.; Staniak, Z. Countermovement depth–a variable which clarifies the relationship between the maximum power output and height of a vertical jump. Acta Bioeng. Biomech. 2018, 20, 127–134. [Google Scholar]
  43. Taylor, K.-L.; Chapman, D.W.; Cronin, J.B.; Newton, M.J.; Gill, N. Fatigue monitoring in high performance sport: A survey of current trends. J. Aust. Strength Cond. 2012, 20, 12–23. [Google Scholar]
  44. Jiménez-Reyes, P.; Samozino, P.; Brughelli, M.; Morin, J.-B. Effectiveness of an individualized training based on force-velocity profiling during jumping. Front. Physiol. 2017, 7. [Google Scholar] [CrossRef] [Green Version]
  45. Street, G.; McMillan, S.; Board, W.; Rasmussen, M.; Heneghan, J.M. Sources of error in determining countermovement jump height with the impulse method. J. Appl. Biomech. 2001, 17, 43–54. [Google Scholar] [CrossRef]
  46. Welsh, T.; Alemany, J.; Montain, S.; Frykman, P.; Tuckow, A.; Young, A.; Nindl, B. Effects of intensified military field training on jumping performance. Int. J. Sports Med. 2008, 29, 45–52. [Google Scholar] [CrossRef]
  47. Wu, P.P.-Y.; Sterkenburg, N.; Everett, K.; Chapman, D.W.; White, N.; Mengersen, K. Predicting fatigue using countermovement jump force-time signatures: Pca can distinguish neuromuscular versus metabolic fatigue. PLoS ONE 2019, 14, e0219295. [Google Scholar] [CrossRef] [Green Version]
  48. Ortega, D.R.; Rodríguez Bíes, E.C.; Berral de la Rosa, F.J. Analysis of the vertical ground reaction forces and temporal factors in the landing phase of a countermovement jump. J. Sports Sci. Med. 2010, 9, 282–287. [Google Scholar]
  49. Kraska, J.M.; Ramsey, M.W.; Haff, G.G.; Fethke, N.; Sands, W.A.; Stone, M.E.; Stone, M.H. Relationship between strength characteristics and unweighted and weighted vertical jump height. Int. J. Sport Physiol. Perform. 2009, 4, 461–473. [Google Scholar] [CrossRef] [Green Version]
  50. Merrigan, J.J.; Stone, J.D.; Ramadan, J.; Hagen, J.A.; Thompson, A.G. Dimensionality reduction differentiates sensitive force-time characteristics from loaded and unloaded conditions throughout competitive military training. Sustainability 2021, 13, 6105. [Google Scholar] [CrossRef]
  51. Brady, C.J.; Harrison, A.J.; Comyns, T.M. A review of the reliability of biomechanical variables produced during the isometric mid-thigh pull and isometric squat and the reporting of normative data. Sport Biomech. 2020, 19, 1–25. [Google Scholar] [CrossRef]
  52. Comfort, P.; Jones, P.A.; McMahon, J.J.; Newton, R. Effect of knee and trunk angle on kinetic variables during the isometric midthigh Pull: Test–retest reliability. Int. J. Sport Physiol. Perform. 2015, 10, 58–63. [Google Scholar] [CrossRef] [PubMed]
  53. Merrigan, J.J.; Dabbs, N.C.; Jones, M.T. Isometric mid-thigh pull kinetics: Sex differences and response to whole-body vibration. J. Strength Cond. Res. 2020, 34, 2407–2411. [Google Scholar] [CrossRef]
  54. Merrigan, J.J.; Stone, J.D.; Hornsby, W.G.; Hagen, J.A. Identifying reliable and relatable force–time metrics in athletes—considerations for the isometric mid-thigh pull and countermovement jump. Sports 2021, 9, 4. [Google Scholar] [CrossRef]
  55. Kennedy, R.; Drake, D. The Effect of Acute Fatigue on Countermovement jump performance in rugby union players during preseason. J. Sport Med. Phys. Fit. 2017, 57, 1261–1266. [Google Scholar]
  56. McGuigan, M. Monitoring Training and Performance in Athletes; Human Kinetics: Champaign, IL, USA, 2017; ISBN 1-4925-3520-6. [Google Scholar]
  57. McLean, B.D.; Coutts, A.J.; Kelly, V.; McGuigan, M.R.; Cormack, S.J. Neuromuscular, endocrine, and perceptual fatigue responses during different length between-match microcycles in professional rugby league players. Int. J. Sport Physiol. Perform. 2010, 5, 367–383. [Google Scholar] [CrossRef] [PubMed] [Green Version]
  58. Mooney, M.G.; Cormack, S.; O’Brien, B.J.; Morgan, W.M.; McGuigan, M. Impact of neuromuscular fatigue on match exercise intensity and performance in elite Australian football. J. Strength Cond. Res. 2013, 27, 166–173. [Google Scholar] [CrossRef] [Green Version]
  59. Sands, W.A.; Stone, M.H. Are you progressing and how would you know. Olymp. Coach 2006, 17, 4–10. [Google Scholar]
  60. Burkett, L.N.; Phillips, W.T.; Ziuraitis, J. The best warm-up for the vertical jump in college-age athletic men. J. Strength Cond. Res. 2005, 19, 673–676. [Google Scholar]
  61. Thompsen, A.G.; Kackley, T.; Palumbo, M.A.; Faigenbaum, A.D. Acute effects of different warm-up protocols with and without a weighted vest on jumping performance in athletic women. J. Strength Cond. Res. 2007, 21, 52–56. [Google Scholar] [CrossRef]
  62. Musham, C.; Fitzpatrick, J. Familiarisation and reliability of the isometric mid-thigh pull in elite youth soccer players. Sport Perform. Sci. 2020, 85, 1–4. [Google Scholar]
  63. Brown, N.; Bubeck, D.; Haeufle, D.F.B.; Weickenmeier, J.; Kuhl, E.; Alt, W.; Schmitt, S. Weekly time course of neuro-muscular adaptation to intensive strength training. Front. Physiol. 2017, 8, 329. [Google Scholar] [CrossRef] [Green Version]
  64. Wulf, G.; Dufek, J.S.; Lozano, L.; Pettigrew, C. Increased jump height and reduced emg activity with an external focus. Hum. Move Sci. 2010, 29, 440–448. [Google Scholar] [CrossRef] [PubMed]
  65. Roy, T.C.; Ritland, B.M.; Knapik, J.J.; Sharp, M.A. Lifting tasks are associated with injuries during the early portion of a deployment to Afghanistan. Mil. Med. 2012, 177, 716–722. [Google Scholar] [CrossRef] [Green Version]
  66. Knapik, J.J.; Reynolds, K.L.; Harman, E. Soldier load carriage: Historical, physiological, biomechanical, and medical aspects. Mil. Med. 2004, 169, 45–56. [Google Scholar] [CrossRef] [Green Version]
  67. Frio Marins, E.; Cabistany, L.; Bartel, C.; Dawes, J.J.; Boscolo Del Vecchio, F. Aerobic fitness, upper-body strength and agility predict performance on an occupational physical ability test among Police Officers while wearing personal protective equipment. J. Sports Med. Phys. Fit. 2019, 59. [Google Scholar] [CrossRef]
  68. Merrigan, J.J.; O’Toole, K.B.; Wutzke, C.J.; Jones, M.T. A kinetic and kinematic analysis of various drop jump performances in Army Reserve Officer Training Corps Cadets. J. Strength Cond. Res. 2021, in press. [Google Scholar] [CrossRef]
  69. Billing, D.C.; Silk, A.J.; Tofari, P.J.; Hunt, A.P. Effects of Military load carriage on susceptibility to enemy fire during tactical combat movements. J. Strength Cond. Res. 2015, 29, S134. [Google Scholar] [CrossRef]
  70. Martin, P.E.; Nelson, R.C. The effect of carried loads on the combative movement performance of men and women. Mil. Med. 1985, 150, 357–362. [Google Scholar] [CrossRef]
  71. Jaworski, R.L.; Jensen, A.; Niederberger, B.; Congalton, R.; Kelly, K.R. Changes in combat task performance under increasing loads in active duty Marines. Mil. Med. 2015, 180, 179–186. [Google Scholar] [CrossRef] [Green Version]
  72. O’Neal, E.K.; Hornsby, J.H.; Kelleran, K.J. High-intensity tasks with external load in Military applications: A review. Mil. Med. 2014, 179, 950–954. [Google Scholar] [CrossRef] [PubMed] [Green Version]
  73. Schiffman, J.M.; Bensel, C.K.; Hasselquist, L.; Gregorczyk, K.N.; Piscitelle, L. Effects of Carried Weight on Random Motion and traditional measures of postural sway. Appl. Ergon. 2006, 37, 607–614. [Google Scholar] [CrossRef] [PubMed]
  74. Tahayor, B.; Riley, Z.A.; Mahmoudian, A.; Koceja, D.M.; Hong, S.L. Rambling and trembling in response to body loading. Motor. Control 2012, 16, 144–157. [Google Scholar] [CrossRef]
  75. Draicchio, C.; Martin, J.R.; Fyock-Martin, M.B.; Merrigan, J.J. Retrospective cohort analysis of the Army Physical Fitness Test and the Occupational Physical Assessment Test in Reserve Officer Training Corps Cadets: A brief report. Mil. Med. 2020, 185, e937–e943. [Google Scholar] [CrossRef] [PubMed]
  76. Marks, D.; Merrigan, J.J.; Martin, J.R. Do baseline physical fitness measures predict law enforcement academy graduation? Work 2021, in press. [Google Scholar]
  77. Parallelus LawFit Fitness Profiles- LawFit. Available online: https://www.lawfit.org/lawfit-fitness-profiles/ (accessed on 9 March 2020).
  78. Turner, A.N.; Comfort, P.; McMahon, J.; Bishop, C.; Chavda, S.; Read, P.; Mundy, P.; Lake, J. Developing powerful athletes, Part 1: Mechanical underpinnings. Strength Cond. J. 2020, 42, 30–39. [Google Scholar] [CrossRef]
  79. Cormie, P.; McGuigan, M.R.; Newton, R.U. Adaptations in athletic performance after ballistic power versus strength training. Med. Sci. Sport Exerc. 2010, 42, 1582–1598. [Google Scholar] [CrossRef] [PubMed]
  80. Claudino, J.G.; Cronin, J.; Mezêncio, B.; McMaster, D.T.; McGuigan, M.; Tricoli, V.; Amadio, A.C.; Serrão, J.C. The countermovement jump to monitor neuromuscular status: A meta-analysis. J. Sci. Med. Sport 2017, 20, 397–402. [Google Scholar] [CrossRef] [PubMed]
  81. Conkright, W.R.; Beckner, M.E.; Sinnott, A.M.; Eagle, S.R.; Martin, B.J.; Lagoy, A.D.; Proessl, F.; Lovalekar, M.; Doyle, T.L.A.; Agostinelli, P.; et al. Neuromuscular performance and hormonal responses to Military operational stress in men and women. J. Strength Cond. Res. 2021, 35, 1296–1305. [Google Scholar] [CrossRef] [PubMed]
  82. Cormie, P.; McBride, J.M.; McCaulley, G.O. Power-time, force-time, and velocity-time curve analysis of the countermovement jump: Impact of training. J. Strength Cond. Res. 2009, 23, 177–186. [Google Scholar] [CrossRef] [PubMed]
  83. Cormie, P.; McGuigan, M.; Newton, R.U. Changes in the eccentric phase contribute to improved stretch-shorten cycle performance after training. Med. Sci. Sport Exerc. 2010, 42, 1731–1744. [Google Scholar] [CrossRef] [Green Version]
  84. Santtila, M.; Pihlainen, K.; Viskari, J.; Kyröläinen, H. Optimal physical training during Military basic training period. J. Strength Cond. Res. 2015, 29, S154. [Google Scholar] [CrossRef]
  85. Ojanen, T.; Häkkinen, K.; Hanhikoski, J.; Kyröläinen, H. Effects of task-specific and strength training on simulated Military task performance in Soldiers. Int. J. Environ. Res. Public Health 2020, 17, 8000. [Google Scholar] [CrossRef]
  86. Vantarakis, A.; Chatzinikolaou, A.; Avloniti, A.; Vezos, N.; Douroudos, I.I.; Draganidis, D.; Jamurtas, A.Z.; Kambas, A.; Kalligeros, S.; Fatouros, I.G. A 2-Month linear periodized resistance exercise training improved musculoskeletal fitness and specific conditioning of Navy Cadets. J. Strength Cond. Res. 2017, 31, 1362–1370. [Google Scholar] [CrossRef]
  87. Cormie, P.; Mcguigan, M.R.; Newton, R.U. Influence of strength on magnitude and mechanisms of adaptation to power training. Med. Sci. Sport Exerc. 2010, 42, 1566–1581. [Google Scholar] [CrossRef] [PubMed] [Green Version]
  88. Sands, W.A.; McNeal, J.R. Predicting athlete preparation and performance: A theoretical perspective. J. Sport Behav. 2000, 23, 289–310. [Google Scholar]
  89. Sousa, A.C.; Neiva, H.P.; Izquierdo, M.; Cadore, E.L.; Alves, A.R.; Marinho, D.A. Concurrent training and detraining: Brief review on the effect of exercise intensities. Int. J. Sports Med. 2019, 40, 747–755. [Google Scholar] [CrossRef] [PubMed]
  90. Ojanen, T.; Häkkinen, K.; Vasankari, T.; Kyröläinen, H. Changes in physical performance during 21 d of Military field training in Warfighters. Mil. Med. 2018, 183, e174–e181. [Google Scholar] [CrossRef] [PubMed] [Green Version]
  91. Gleason, B.H.; Hornsby, W.G.; Suarez, D.G.; Nein, M.A.; Stone, M.H. Troubleshooting a nonresponder: Guidance for the strength and conditioning coach. Sports 2021, 9, 83. [Google Scholar] [CrossRef]
  92. Stone, M.H.; Hornsby, W.G.; Haff, G.G.; Fry, A.C.; Suarez, D.G.; Liu, J.; Gonzalez-Rave, J.M.; Pierce, K.C. Periodization and block periodization in sports: Emphasis on strength-power training-a provocative and challenging narrative. J. Strength Cond. Res. 2021. [Google Scholar] [CrossRef] [PubMed]
  93. Hewit, J.; Cronin, J.; Button, C.; Hume, P. Understanding deceleration in sport. Strength Cond. J. 2011, 33, 47. [Google Scholar] [CrossRef] [Green Version]
  94. Paterno, M.V.; Ford, K.R.; Myer, G.D.; Heyl, R.; Hewett, T.E. Limb asymmetries in landing and jumping 2 years following anterior cruciate ligament reconstruction. Clin. J. Sport Med. 2007, 17, 258–262. [Google Scholar] [CrossRef]
  95. Bishop, C.; Turner, A.; Read, P. Effects of inter-limb asymmetries on physical and sports performance: A systematic review. J. Sport Sci. 2018, 36, 1135–1144. [Google Scholar] [CrossRef] [PubMed]
  96. Hewett, T.E.; Myer, G.D.; Ford, K.R.; Paterno, M.V.; Quatman, C.E. Mechanisms, prediction, and prevention of ACL injuries: Cut risk with three sharpened and validated tools. J. Orthop. Res. 2016, 34, 1843–1855. [Google Scholar] [CrossRef] [PubMed] [Green Version]
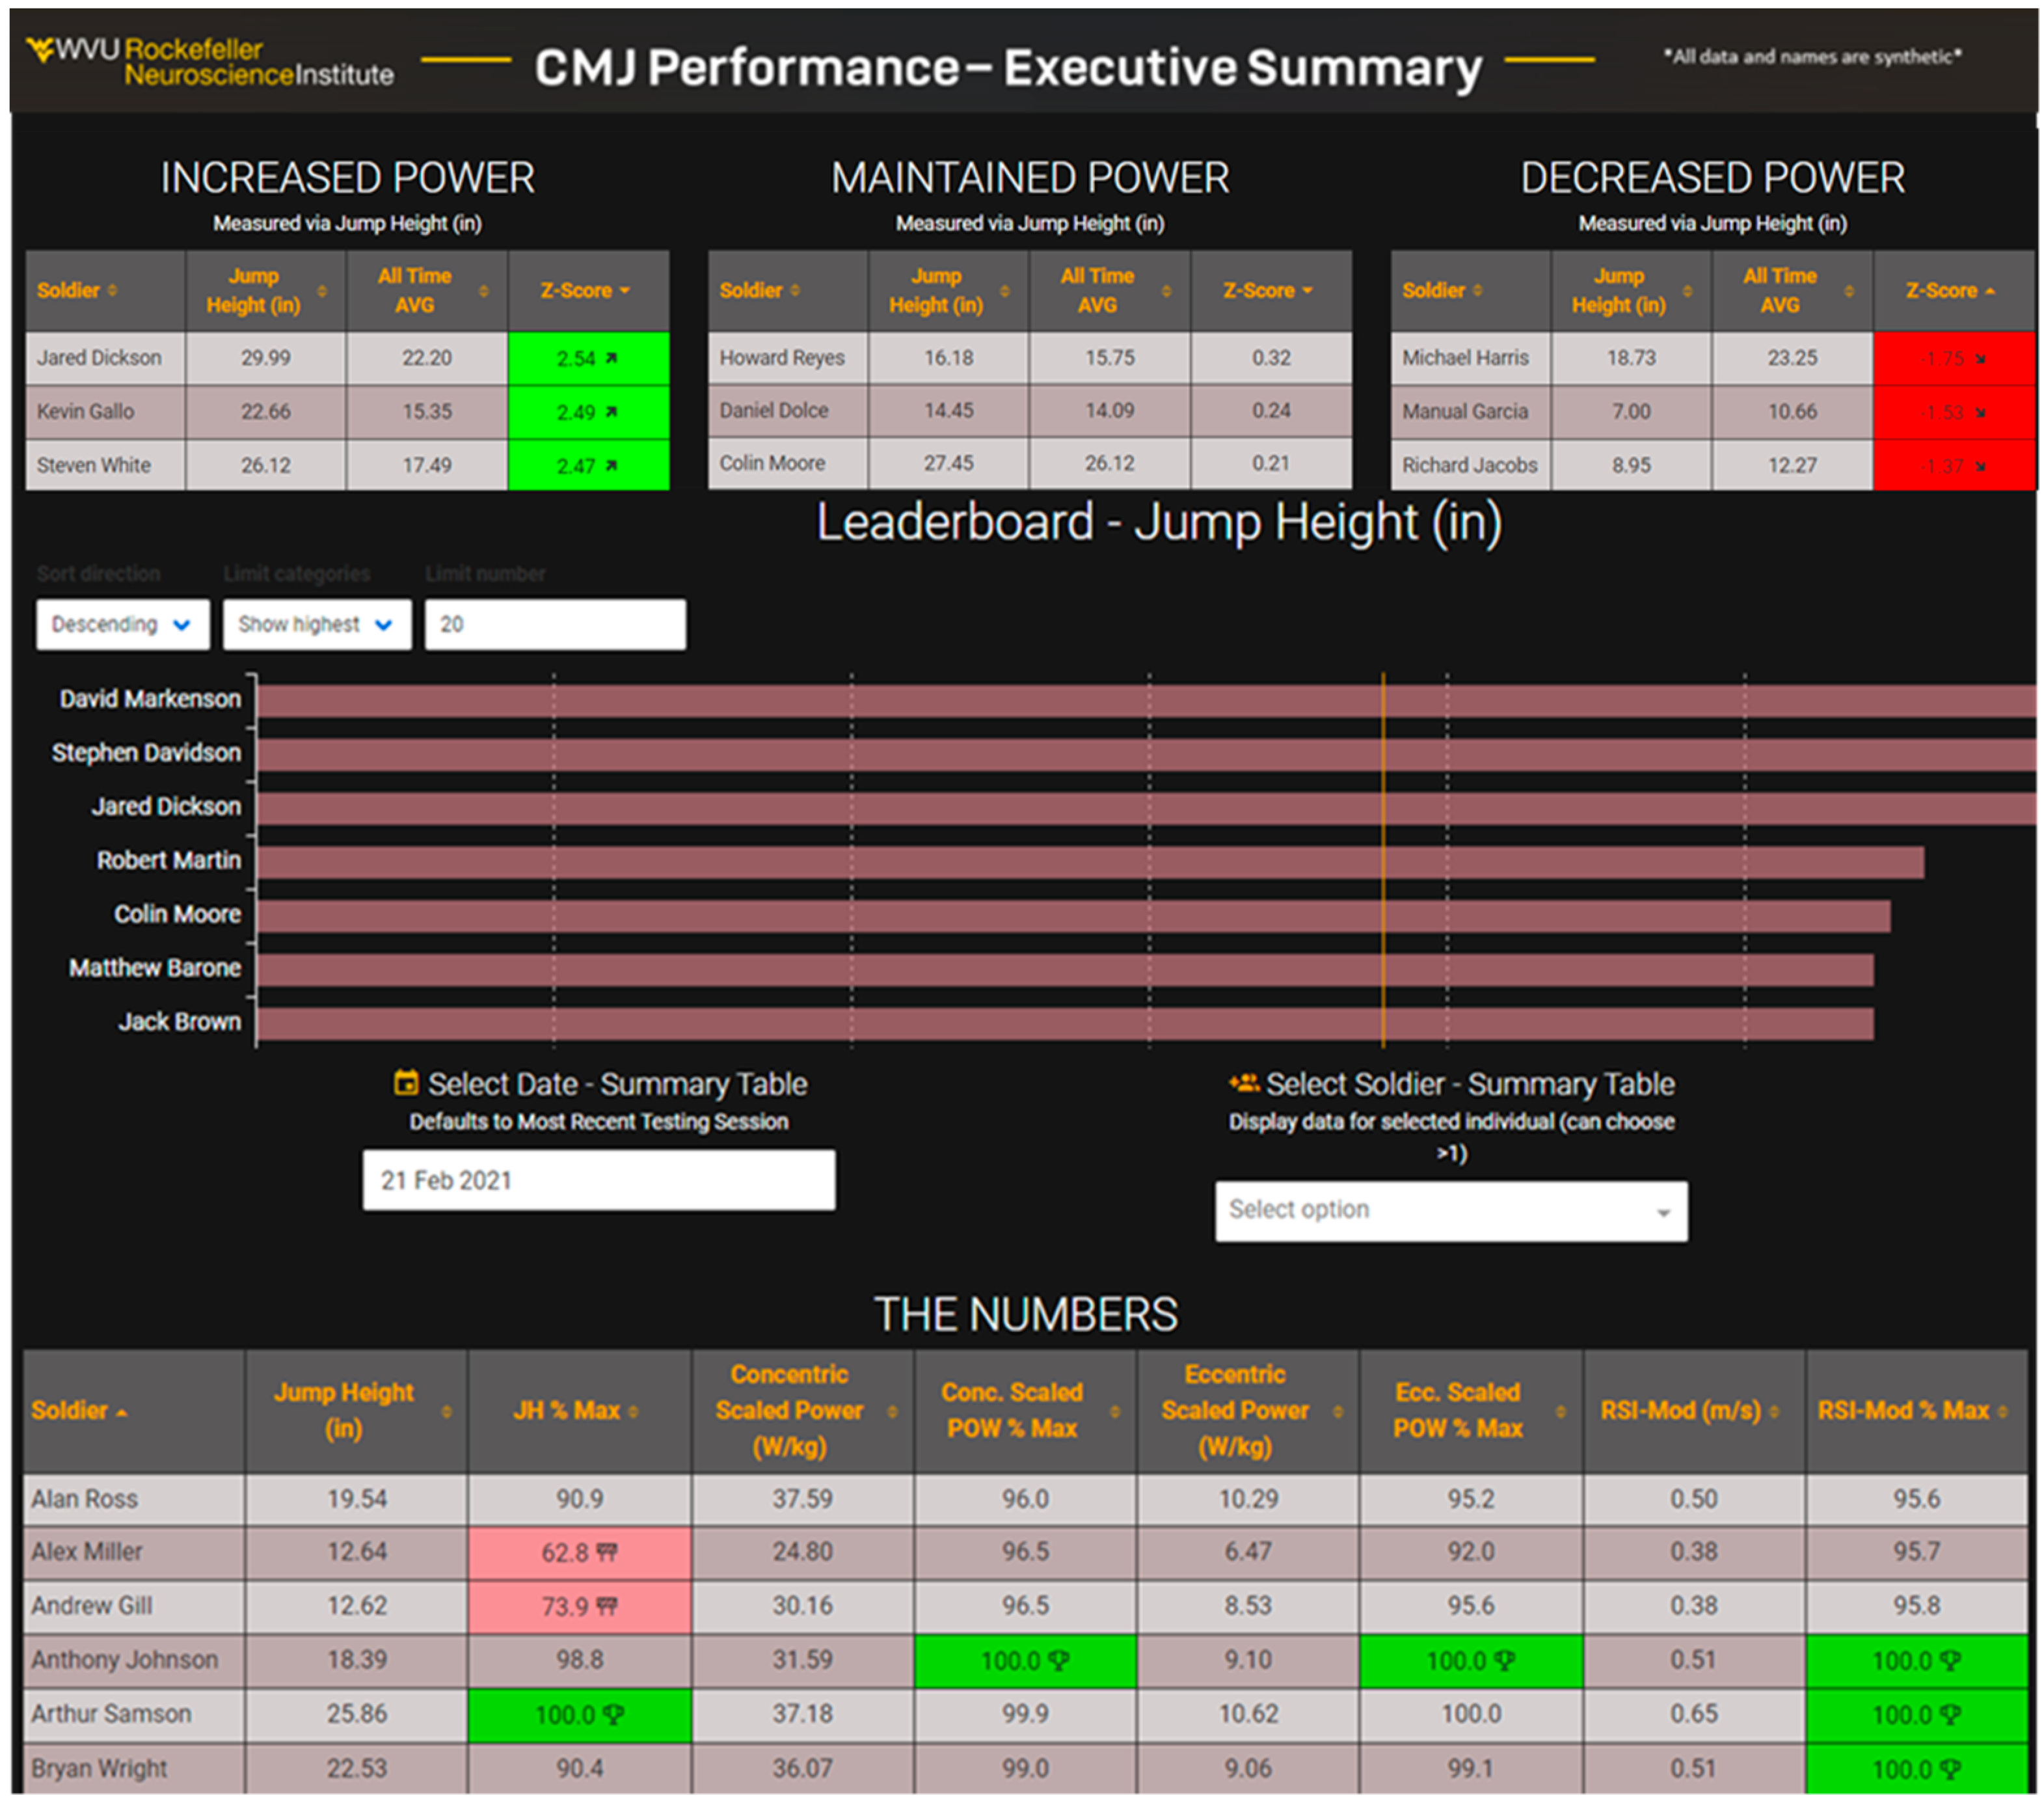
Figure 1. A Fusion Sport Smartabase dashboard built to display comparisons of individuals to their average historical values (identifying those increasing, maintaining, and decreasing in power production capabilities by utilizing jump height Z-scores based on intra-individual variation), others within the group (leaderboard comparisons to the group average), and as a percentage of their all-time personal best record (100% highlighted in green would indicate a personal record while red indicates very low performances compared to historical records). Highlighting groups of individuals with red flag alerts from decreased performances can be used to easily identify and make appropriate adjustments to individual training regimens. This data and names have been synthetically generated for visual purposes.
Applsci 11 06538 g001
Figure 2. Example of a normal distribution and classifications for Z-score and percentiles.
Applsci 11 06538 g002
Figure 3. Displayed are the results of force plate assessments of four firefighters (1, purple; 2, green; 3, blue; 4, red) with the results described in case study 1. Data are displayed as standard scores (Z-scores) from −3 to 3 using radar plots, with the group average being the black dotted line around 0, for unloaded (CMJ) and loaded (LCMJ) countermovement jump height, countermovement depth, (CMdepth), CMJ mean force asymmetry (CMJasym), drop jump height (DJ), DJ peak force (DJ_PF), DJ reactive strength index (DJ_RSI), and absolute (IMTP) and relative isometric mid-thigh pull (IMTPperBM, IMTP divided by body mass). Data was synthetically generated for visualization purposes.
Applsci 11 06538 g003
Figure 4. Examples of assessing group responses through the number of individuals that improved, declined, or remained stable and group/individual changes of important domains in comparison to historical averages using Z-scores. Neuromuscular status-braking plots synthetic data to display the relationship between jump height (red) and braking phase duration (blue dots).
Applsci 11 06538 g004
Figure 5. Definitions of Variables of Emphasis in the force-time curve.
Applsci 11 06538 g005
Figure 6. In this example case study, comparisons can be made between individuals and within individuals over time while also noting differences in responses across performance testing and metrics. These synthetic data may show a decrease for most individuals around the same time of the year, demonstrating examples of intense training bouts or detraining that lead to reductions in performances. Following the bout of training decrements, these individuals demonstrate varying rates of positive performance adaptations. Bryan, John, and Jack had decreased jumping, but John’s strength remained stable, while Gene noted consistent improvement in jumping abilities but a decline in isometric strength. Thus, demonstrating the variability in responses to training programs, which may be useful for properly informing training prescriptions.
Applsci 11 06538 g006
Figure 7. Example training recommendations based on decreased performances from countermovement jump force-time metrics. Note, these are general recommendations that may overlap across variables and still require the expertise of the strength and conditioning specialist to align these responses to the context of any scenario.
Applsci 11 06538 g007
Figure 8. Example of percent change plots for monitoring neuromuscular fatigue across weekly to bi-weekly training. CMJ, countermovement jump; LCMJ, loaded CMJ; DJ, drop jump; LDJ, loaded DJ; ISOT, isometric strength test.
Applsci 11 06538 g008
Figure 9. Key concepts and data associated with asymmetry monitoring.
Applsci 11 06538 g009
Table 1. Sample warm-up protocols and testing batteries.
Testing
Purpose:
Strength, Power, Ability to Absorb Forces, Ability to Handle LoadsStrength, Power, Ability to Absorb Forces, Ability to Handle LoadsStrength, Power, Ability to Absorb Forces, Ability to Handle LoadsPower and
Landing Forces
Time
Commitment:
30 min25 min5–10 min5–10 min
Equipment
Required:
Force plate, squat rack for IMTP set up, plyometric box (30 cm), weighted vest or barbellForce plate, plyometric box (30 cm), weighted vest or barbellForce plate, weighted vest or barbellForce plate, plyometric box (30 cm)
Example
Warm-ups:
5 min dynamic warmup
exercises
1 set of 5:
20 kg Mid-thigh Clean Pull
3 sets of 5:
40 kg Mid-thigh Clean Pull
5 min dynamic warmup exercises
5 CMJ at 50% effort
3 CMJ at 75% effort
2 CMJ at 100% effort
5 CMJ at 50% effort
3 CMJ at 75% effort
2 CMJ at 100% effort
5 CMJ at
50% effort
3 CMJ at
75% effort
2 CMJ at
100% effort
Example
Testing
Battery:
2–3 CMJ trials
2–3 DJ trials
2–3 Loaded CMJ trials
2–3 Loaded DJ trials
2–3 IMTP trials
2–3 CMJ trials
2–3 DJ trials
2–3 Loaded CMJ trials
2–3 Loaded DJ trials
2–3 CMJ trials
2–3 Loaded CMJ trials
2–3 CMJ trials
2–3 DJ trials
1. Abbreviations: IMTP, isometric mid-thigh pulls; CMJ, countermovement jump; DJ, drop jumps. 2. Rest between trials, 30 s; rest between exercises, 60–120. 3. Time of all sessions can be reduced by only collecting data on one trial; however, it is encouraged that the average value from two trials is used. 4. NOTE, the warm-ups repetitions performed prior to testing jumps under loaded conditions should include the same quantity of load. Small external loads of 10% of the individual’s body mass may be used for general warm-up purposes but needs to be standardized for all sessions.
Table 2. Training recommendations based on fitness test performances in Figure 3.
FirefighterMetrics Above Group AverageMetrics Below Group AverageTraining Recommendation
1Movement strategiesRelative strength measuresContinue strength training, progressively add explosive exercise (i.e., plyometrics)
2 Strength and power measuresAdditional strength and power programming
3Strength measures and CMJ
performance
Higher asymmetries
Drop jump
performance and low reactive strength
Countermovement Depth
Include explosive movements in the training program, and mobility work to improve movement compensation
4 Unloaded and loaded CMJ
performance
Coaching to improve jump strategy, and velocity/power focused training
Table 3. Scenarios for monitoring training adaptations and relevant variables to assess.
Training PhaseTesting PurposeTesting FrequencyTest Types
MacrocycleGeneral ProfilingAnnual
2× per year
Pre-Post Deployment
CPT/CFT
Maximal Isometric Strength Testing
CMJ (Loaded and
Unloaded)
SJ (Loaded and
Unloaded)
DJ
MesocycleTraining
Adaptations
Contingent on
Periodized Training BlocksTypically Every 4, 6, 8, or 12-Weeks
CMJ (Loaded and
Unloaded)
SJ (Loaded and
Unloaded)
DJ
MicrocycleFatigue or
Recovery/
Rehabilitation Monitoring
Weekly or Bi-WeeklyCMJ (Loaded and
Unloaded) *
SJ (Loaded and
Unloaded) *
DJ
* the magnitude of the load when jumping during weekly testing should not cause very large reductions in performance outcomes as this may be more indicative of stable strength measures, which will not inform fatigue or recovery patterns (loads up to 20 kg).
Publisher’s Note: MDPI stays neutral with regard to jurisdictional claims in published maps and institutional affiliations.