Abstract
Obstructive sleep apnea (OSA) is a well-known sleep ailment. OSA mostly occurs due to the shortage of oxygen for the human body, which causes several symptoms (i.e., low concentration, daytime sleepiness, and irritability). Discovering the existence of OSA at an early stage can save lives and reduce the cost of treatment. The computer-aided diagnosis (CAD) system can quickly detect OSA by examining the electrocardiogram (ECG) signals. Over-serving ECG using a visual procedure is challenging for physicians, time-consuming, expensive, and subjective. In general, automated detection of the ECG signal’s arrhythmia is a complex task due to the complexity of the data quantity and clinical content. Moreover, ECG signals are usually affected by noise (i.e., patient movement and disturbances generated by electric devices or infrastructure), which reduces the quality of the collected data. Machine learning (ML) and Deep Learning (DL) gain a higher interest in health care systems due to its ability of achieving an excellent performance compared to traditional classifiers. We propose a CAD system to diagnose apnea events based on ECG in an automated way in this work. The proposed system follows the following steps: (1) remove noise from the ECG signal using a Notch filter. (2) extract nine features from the ECG signal (3) use thirteen ML and four types of DL models for the diagnosis of sleep apnea. The experimental results show that our proposed approach offers a good performance of DL classifiers to detect OSA. The proposed model achieves an accuracy of 86.25% in the validation stage.
1. Introduction
Sleep apnea is a serious problem where breathing is interrupted [1]. People who have sleep apnea feel tired even after a full night’s sleep. In general, sleep apnea can be categorized into three categories: (i) obstructive sleep apnea (OSA), (ii) central sleep apnea (CSA), and (iii) mixed sleep apnea (MSA) [2]. The standard test to diagnose S.A. is Polysomnography (PSG), which requires examining the patients’ physiological data during sleep time. PSG data collection has two main weakness, which is time-consuming and costly [3]. To overcome these PSG weakness, several methods have been proposed such as physiological signals, abdominal signal [4], airflow [5], thoracic signal [6], or oxygen saturation [7].
Sleep apnea happens when no breathing process occurs. As a result, the amount of oxygen is not good enough for the heart, making the heart rate not normal (i.e., reduced). The easiest way to monitor the heart rate performance is an ECG signal that can indicate the oxygen level that comes to the heart. In general, apnea cases occur in a period of about 10–20 s [8]. Apnea–hypopnea index (AHI) is employed to evaluate the count of apnea episodes per hour. There are three types of sleep apnea: (i) central sleep apnea (CSA), (ii) obstructive sleep apnea (OSA), and (iii) mixed sleep apnea. CSA occurs when the brain stops sending any signal to muscles to breathe, while OSA occurs when muscles stop working and cannot take a breath due to the airflow getting obstructed. Mixed sleep apnea is due to both CSA and OSA [9]. In general, 84% of apnea is OSA [10]. CSA happened when no breathing operation happens during sleep. While MSA is a result of the occurrence of both OSA and CSA [10].
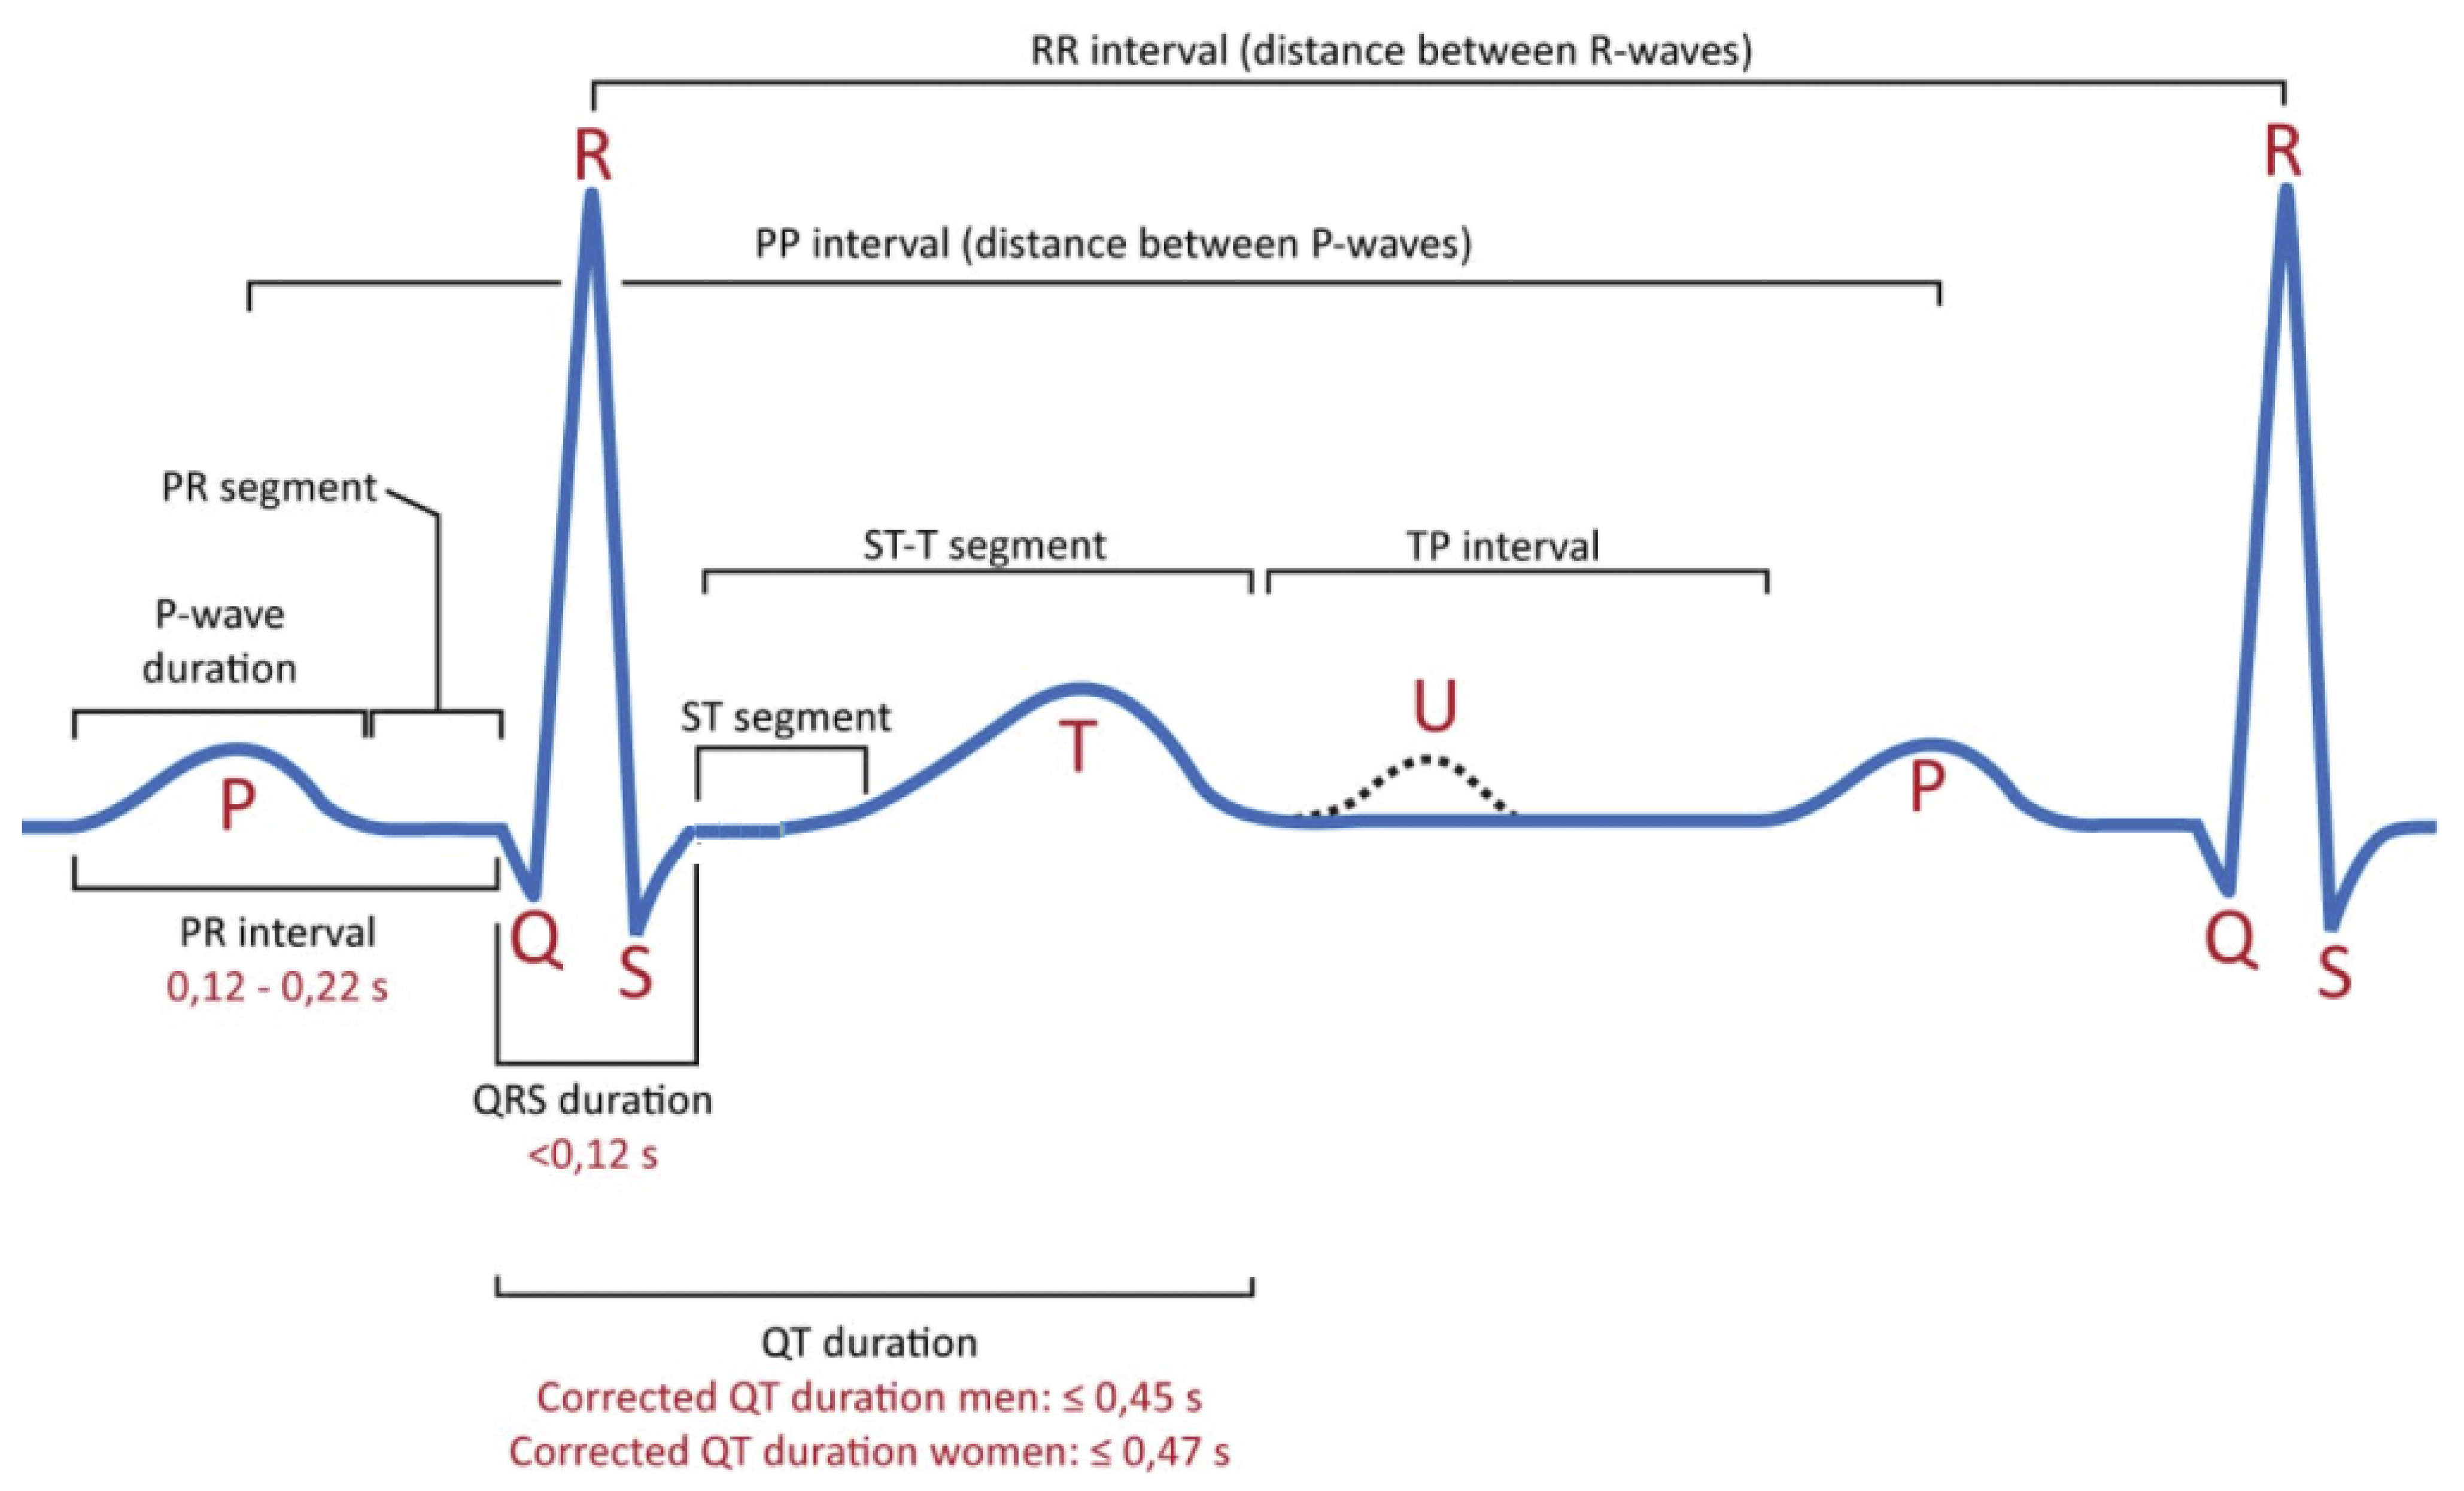
The ECG signal is one of the lowest cost methods that can simulate the heart beating process based on voltage over time by a set of external electrodes connected to the human skin. Several research papers investigated the ability to detect apnea using ECG signals [11,12]. For example, Kaya et al. [13] explored the correlation between OSA and ventricular re-polarization. Moreover, many papers highlighted the importance of examining the ECG signals deeply to determine the occurs of OSA [12]. ECG signal is used to understand the overall performance of the heart condition. In general, the ECG signal has a small amplitude, typically 0.5 mV in an offset environment of 300 mV, and having a frequency range of 0.05–100 Hz. In simple, the electrocardiogram illustrates the electrical heart activity for some time. Each ECG signal has a set of waves (P, Q, R, S, T, U) and various intervals (S-T, Q-T, P-R, R-R) [14]. These intervals are used to calculate their duration and amplitudes, which are employed either for heartbeat processing or classification. Figure 1 explores waves and intervals for ECG signals. Table 1 explores the wave names inside ECG signal, while Table 2 shows the standard range values of these waves.
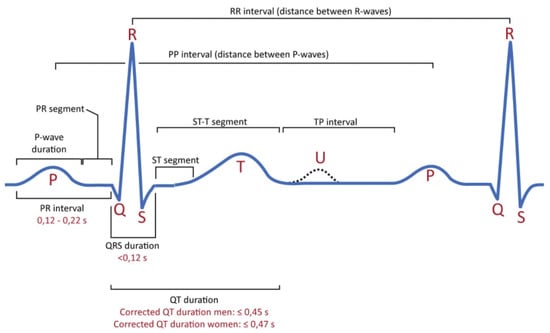
Figure 1.
Classical ECG Signal characteristics.

Table 1.
Main components of ECG signal.
Table 2.
Wave names inside ECG signal.
Up to date, most hospitals use polysomnography (PSG) tools to diagnose OSA. In general, PSG monitors several factors such as: breathing airflow, breathing events, snoring, blood oxygen saturation (SpO2), electrooculography (EOG), electroencephalography (EEG), and electrocardiography (ECG). However, the main drawbacks of the PSG method are: (i) PSG needs continual, hands-on supervision for patients during the examination process since each patient should wear many wearable devices (i.e., sensors), (ii) PSG needs a high level of recording systems, and (iii) the cost of PSG is between $3000 to $6000 [15]. To reduce the time and cost of apnea screening, we proposed a new CAD system that helps doctors to discriminate between apnea or normal respiration using ML methods. Building robust CAD systems can enhance the overall performance of the diagnosis process. To investigate this hypothesis, this study’s motivation is to investigate the performance of ML classifiers to detect OSA based on beat-to-beat interval traces, medically known as RR intervals, into apnea versus non-apnea. We used a notch filter to remove the collected ECG signal’s noise before extracting the most valuable feature. Moreover, this study highlights the performance of the hyper-parameter method for ML classifiers while the learning process.
In practice, users can directly apply the proposed system to diagnose the OSA or normal via the ECG signals recorded from the patients. Unlike other models, the proposed system not only filters and extracts the important information from the signals but also keeps the significant information when diagnosing the OSA, which helps in reducing the complexity and improving the diagnosis system.
The rest of this paper is organized as follows: Section 2 explores the related works of sleep apnea and CAD. Section 3 presents the proposed methodology that is used in this paper. Section 4 explores the public ECG dataset used here. Section 5 presents the obtained results with analysis. Finally, Section 6 explores the conclusion and future work on this paper.
2. Literature Review
There are several methods have been proposed to analyze the physiological signals to detect OSA. Most methods try to find a breathing pattern, ECG, SaO2, and nasal airflow collected from humans using several sensors [16,17]. In general, detecting sleep apnea is performed in the hospital with a sleep lab facility. Some home testing devices help patients to do sleep apnea tests at an affordable cost [16,18].
The first paper published about the effects of sleep apnea on the human heart’s electrical activity was in 1984 by Guilleminault et al. [19]. The authors report that the OSA has a high correlation with bradycardia during apnea time. The apnea usually occurs in 10–20 s, which affect the heartbeat [12]. In simple, apnea appears as a frequency component (i.e., the range is 0.05 Hz to 0.1 Hz) to the Respiration Rate (R.R.) interval tachogram related to the apnea duration. So, it is hard to determine the existence of apnea based on these additional frequency components. Many researchers start employing ML as an intelligent solution to detect the OSA based on heart rate to overcome this difficulty.
Many research papers highlight the ability to employ ML in detecting sleep apnea. For example, Xie and Minn [20] used a combination of different ML classifiers (i.e., AdaBoost with Decision Stump, and Bagging with REPTree) to detect sleep apnea. Moreover, the authors applied feature selection as a preprocess for collected ECG signals. The obtained results show a good accuracy value equals 82%. Rodrigues et al. [21] investigate the performance of 60 ML (i.e., regression and classification algorithms) to predict the Apnea-Hypopnea Index (AHI). The authors conclude the importance of ML in detecting sleep apnea.
Stein et al. [22] proposed a simple graphical representation to detect OSA for adult patients. The proposed system can determine the existence of OSA based on a visual inspection of the RR-interval tachogram. Maier et al. [23] examine 90 patients to investigate the occurrence of OSA. The authors applied three methods for extracting respiratory events from two types of ECG signals (i.e., single-lead and multi-lead). The obtained results show that the events from extracted multi-lead ECGs can improve the detection rate (i.e., sensitivity equals 85%, and specificity equals 89%. Uznańska et al. [24] report that there is a high correlation between sleep apnea and cardiovascular disease.
Many research papers used the single-lead ECG to detect the sleep apnea [25,26,27]. For example, Carolina et al. [28] proposed a novel automated method to detect sleep apnea based on single-lead ECG. In this work, the authors extracted four features (two novel features from ECG signal and two standard features from). The first two features from the ECG signal, while the last two features extracted from heart rate variability analysis. The first novel feature was used to describe the changes in morphology that happened by increased sympathetic activity during apnea. While the second novel feature retrieves the information between respiration and heart rate based on orthogonal subspace projections. The proposed approach shows excellent performance in detecting sleep apnea. The obtained results show an accuracy of 85% on a minute-by-minute basis for two different datasets. Li et al. [29] proposed a hybrid method between deep learning neural network and a Hidden Markov model (HMM) to detect OSA using a single-lead ECG signal. The proposed method showed 85% accuracy for per-segment OSA detection and 88.9% for the sensitivity. Chang et al. [30] proposed a one-dimensional (1D) CNN model to detect OSA. The proposed approach showed 87.9% accuracy. Sharma and Sharma [25] also used single-lead ECG to detect sleep apnea. The authors employed Hermite basis functions as a tool for detecting sleep apnea.
To conclude our brief review about OSA based on ECG single, we found that ML can build robust CAD systems, examine extensive data and reduce the overall cost of detecting OSA.
3. Methodology
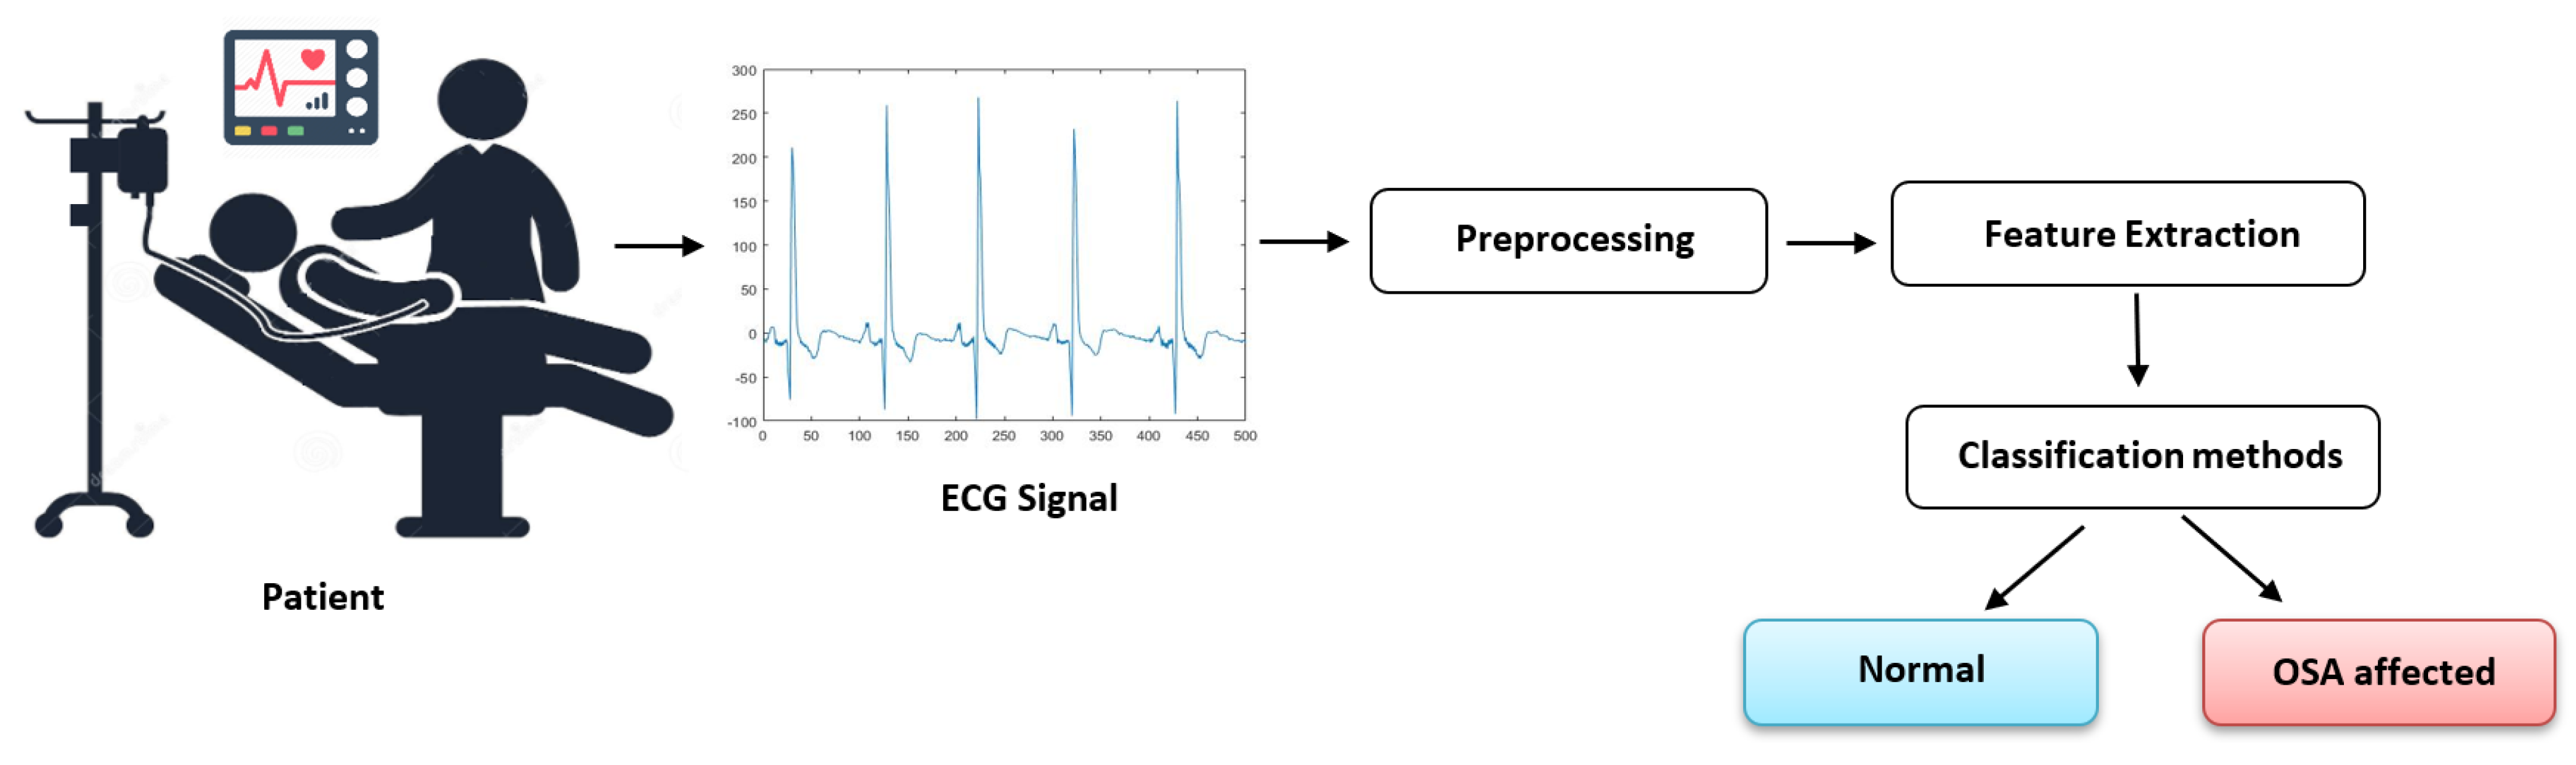
Analyzing the ECG signal using CAD systems based on data mining methods leads to a robust system that can recognize OSA inside ECG signals [12]. Figure 2 shows a pictorial diagram for a CAD system to diagnose ECG signal. The proposed system consists of three steps which are: Preprocessing, Feature extraction, and classification. The next subsections explore each step in more detail.
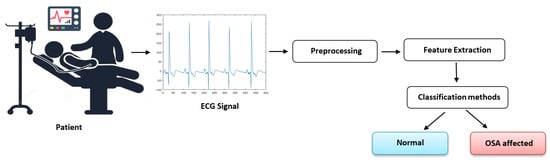
Figure 2.
Proposed method.
3.1. Preprocessing
ECG signals are collected from the human body using an impulse stimulus to a heart. The collected signal is built based on the voltage drop, a couple of uV and mV with impulse Variations. In general, each ECG signal has an embedded noise [31]. These noises (i.e., 60 Hz power line interference) can reduce the overall quality of ECG signal [32]. So it is essential to remove the 60 Hz noise. Typically, Digital Signal Processing (DSP) has several operations such as z-transform, convolution, Fourier transform, filtering, etc. The main advantages of DSP are programmable, high Precision, not hard to maintain, powerful ant-interference, and not hard to design a linear phase. In this paper, we employed the second-order IIR notch digital filter that removes a 60 Hz power interference. The main concept of notch filters that combine both high and low pass filters to create a small region of frequencies to be removed. The electromagnetic field caused by the powerline noise makes the analysis and interpretation of ECG signal became difficult. In addition, the ECG signal is non-stationary and sensitive to noise. Thus, the notch filter is applied to filter out the 60 Hz powerline interference accompanied by the harmonics. Figure 3 explored the original ECG and filtered one based on IIR notch digital.
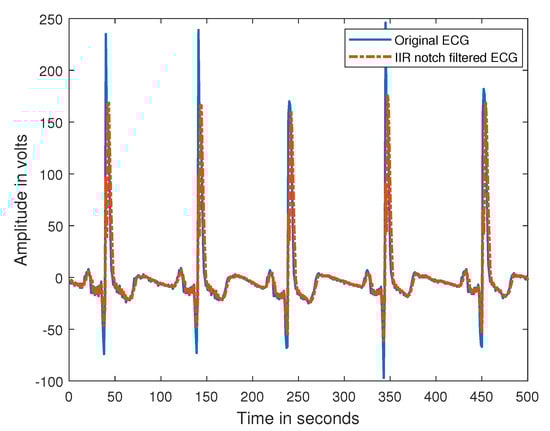
Figure 3.
Filtered ECG signalbased on IIR notch filter.
3.2. Feature Extraction
Feature extraction means finding the most important and relevant features from the ECG signal to determine the existence of OSA or not. Feature extraction methods have been widely used in ML applications [33]. In the present work, nine general features have been extracted from ECG signals, as shown in Table 3. The ECG feature extraction code for all these nine features available on https://www.mathworks.com/matlabcentral/fileexchange/63645-ecg-feature-extractor, accessed on 8 July 2021. The window size used in this work is one minute. From the experiment, we found that these extracted features are the most valuable ones that can reduce the data’s high dimension and improve the ML classifiers’ overall performance.
where:
Table 3.
Description of features extracted from each signal.
- N = Number of windows.
- = Sampled time for each window.
- = Number of R peaks in each window.
- = the heart rate at R-R peak location.
- =
- PSD = Power Spectral Density
- PSD_n(f) =
3.3. Machine Learning Classifiers
In sleep apnea classification, ML classifiers are the best way to decide either having OSA or not. There are several methods have been used to build such systems such as: artificial neural network (ANN) [10], support vector machine (SVM) [34], Linear Discriminant Classifier (LDC) [35], etc. In this work, we used seven popular and well-known classifiers, which are: decision tree (DT), linear discriminate analysis (LDA), k-nearest neighbors (KNN), logistic regression (LR), Naïve Bayes (NB), SVM, and boosted trees (BT). Moreover, we employed another six classifiers where we used the hyper-parameters model to optimize the internal parameters, which are: DT*, DA*, NB*, kNN*, ensemble DT*, and SVM*. We trained all the classifiers using the same hardware structure and the same input features. The cross-validation manner is implemented (i.e., k-fold = 10) to assess the classification methods to find a robust model.
4. Description of ECG Dataset
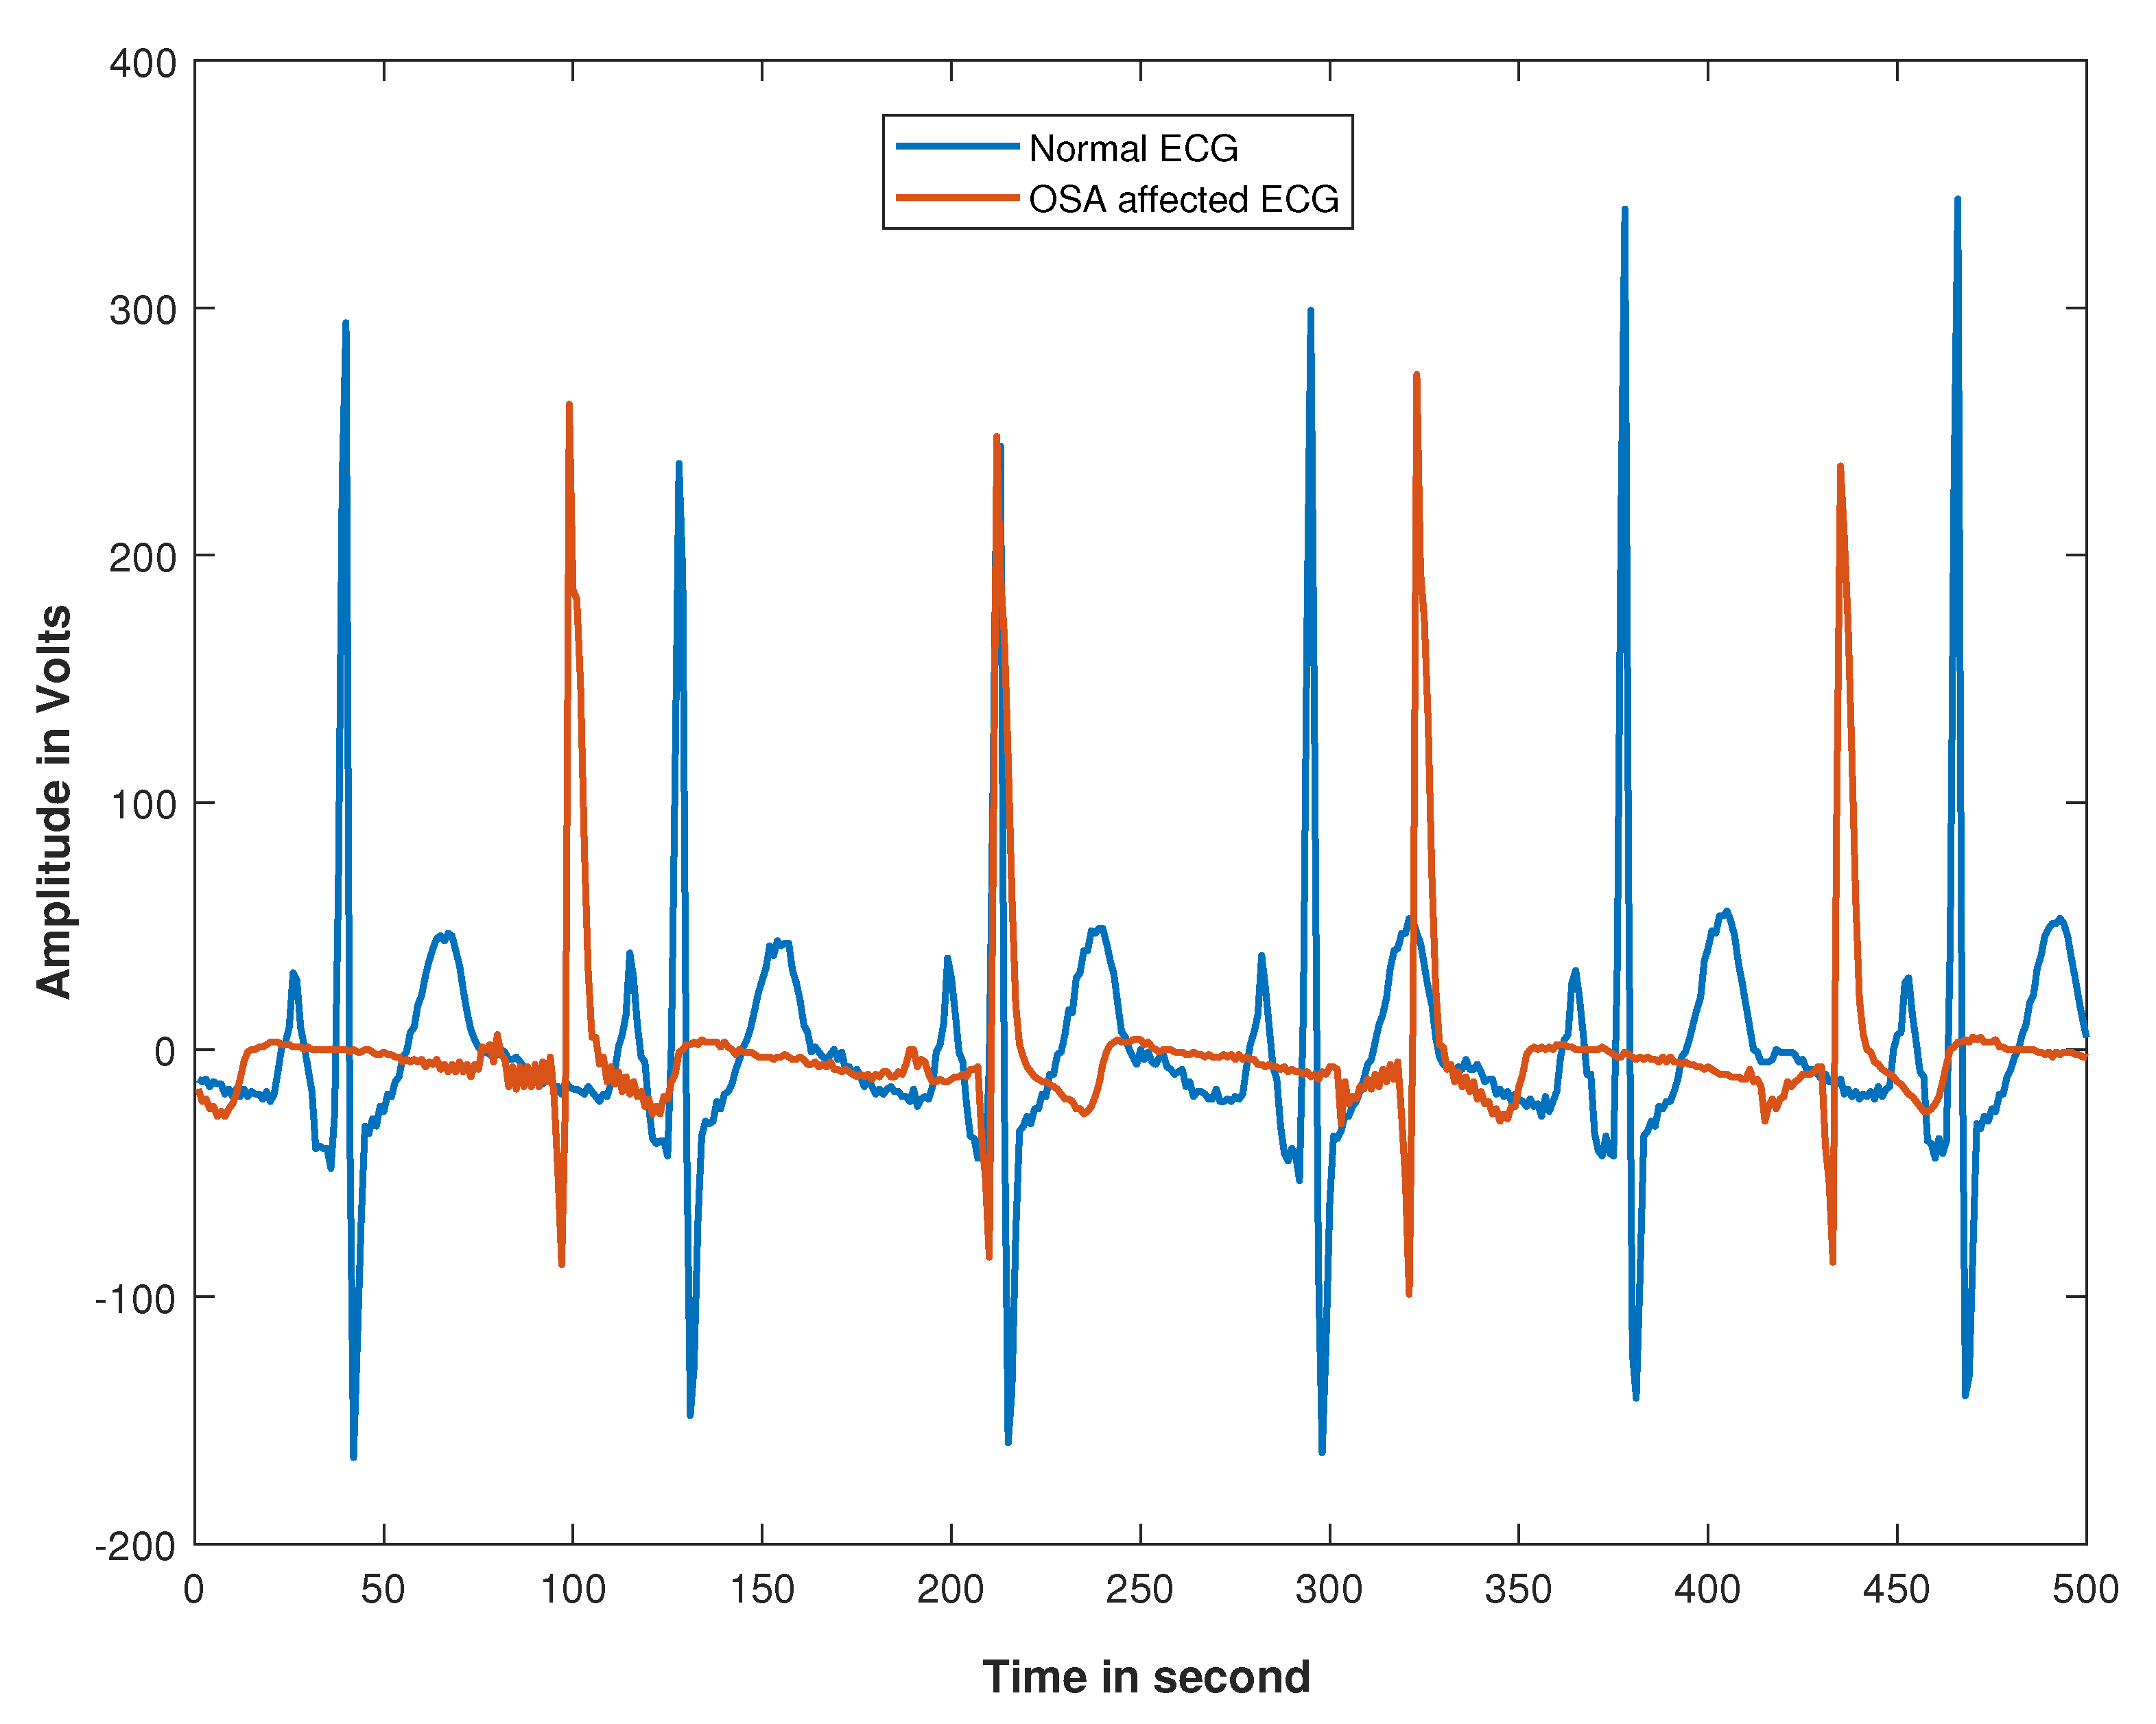
In this paper, we used a public ECG dataset for sleep apnea that we obtained from Physionet’s CinC challenge-2000 database [36]. The dataset was created at Philips University in Marburg, Germany. The dataset has 70 primary records, divided equally into a learning set and a test set of 35 records. The total duration of ECG signal for each patient is between [25,200, 36,000] minutes. A human expert in sleep apnea has evaluated this data. The ECG signals have been labeled (i.e., normal and OSA affected). This dataset’s main objective is to determine the apneic and regular ECG events of the duration of 1 min. Figure 4 shows the standard and OSA ECG signal. As can be seen, the OSA ECG signal is presented in non-linear and complex form. The ECG signal affected by OSA was less consistent and unstable as compared to the normal signal due to the obstruction of the airflow. When the brain stops sending the signal to the muscle, the breathing process will be interrupted, thus reducing the airflow. In short, the shortage of the amount of oxygen supply has caused an abnormal heart rate. For more information about the dataset, readers can refer to [37].
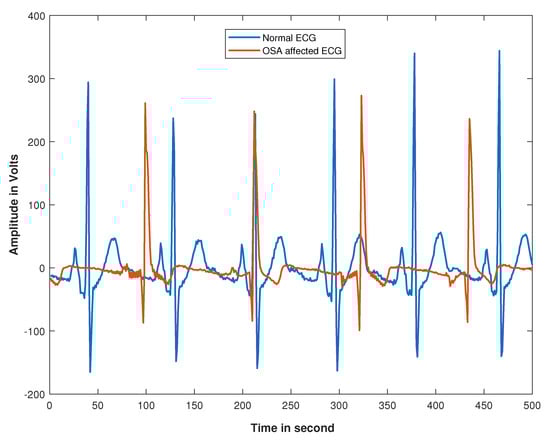
Figure 4.
Samples of ECG signals.
Challenges of Training Dataset
After performing preprocessing steps for the training set, the generated dataset contains 14775 samples such that 10078 samples are labeled as normal while 4679 samples are labeled as OSA affected. Considering these observations, a skewed class distribution poses a significant challenging aspect of data quality. Learning from imbalanced data may degrade the prediction quality of ML algorithms [38,39,40,41,42]. Specifically, the classifier tends to pick up the dominant class patterns (i.e., normal instances), which leads to inaccurate prediction of the minority class (i.e., OSA-affected instances). Accordingly, an efficient re-sampling technique should be employed to handle the problem of imbalanced learning, thereby enhancing ML algorithms’ overall performance and developing a robust OSA prediction model.
5. Experimental Results and Simulations
5.1. Experimental Setup
In this paper, we examined different types of supervised ML and DL algorithms. This selection is based on the No Free Lunch (NFL) theorem, which suggests that no universal algorithm can be the best-performing for all problems [43]. This motivated our attempts to explore the most well-known ML and DL methods to give the reader a clear image of their performance and determine the most applicable one on the OSA problem.
Specifically, this paper employed three types of experiments: (1) the preset setting of ML classifiers for the learning process, (2) the hyper-parameters setting while running the ML methods, and (3) the utilization and proposal of the hybrid DL approaches. From those mentioned above, we firstly investigated various predefined ML methods. However, only those classifiers with better performances are reported. Correspondingly, we adopted seven predefined parameter ML classifiers (Medium DT, LDA, LR, Gaussian NB, Medium KNN, BT, and Coarse Gaussian SVM). As well-known, the overall performance of ML algorithms is strongly affected by the used internal parameters. Therefore, after investigating the predefined classifiers, we applied hyper-parameter optimization within Matlab to automate the selection of hyper-parameter values. Accordingly, six optimized classifiers (DT*, NB*, KNN*, DA*, ensemble DT*, and SVM*) were employed for performance validation. Table 4 shows the preset parameters of the predefined parameter classifiers, while Table 5 explores the parameters of optimized classifiers after learning process. The main advantages of hyper-parameters settings are that the classification method will tune its parameters to reduce the classification error and retain the optimal setting for internal parameters. Lastly, we implement four DL models include CNN, LSTM, RNN, and CNNLSTM (hybridization of CNN and LSTM) for performance validation.
Table 4.
The parameter settings of preset classifiers.
Table 5.
Details of optimized hyperparameters.
5.2. Evaluation of Classification Algorithms
Initially, we examine the performance of different classification methods for sleep apnea classification. In this paper, we employed 13 other classification methods to predict the occurrence of OSA from ECG extracted features. To evaluate the performance of all classifiers, we measure accuracy, True Positive Rate (TPR), True Negative Rate (TNR), Area under the curve (AUC), Precision, F-score, and G-mean criteria.
Table 6 outlines the results obtained by all tested classifiers. The results show that ensemble DT* outperformed other classifiers with accuracy equals 77.26%, followed by KNN* (76.50%). The ensemble DT* and KNN* scored the highest AUC performances of 68.21% and 68.24%, respectively. G-mean, Precision, and F-score’s findings reveal the superiority of ensemble DT* and KNN* classifiers in this work. On the one hand, the worst performance is achieved by the NB classifier with accuracy equals 69.97%. Based on the results obtained, the optimized classifiers can usually work better than those predefined parameter classifiers, which leads to satisfactory performance.
Table 6.
Comparison of different classification methods [X* denotes the optimized classifier X].
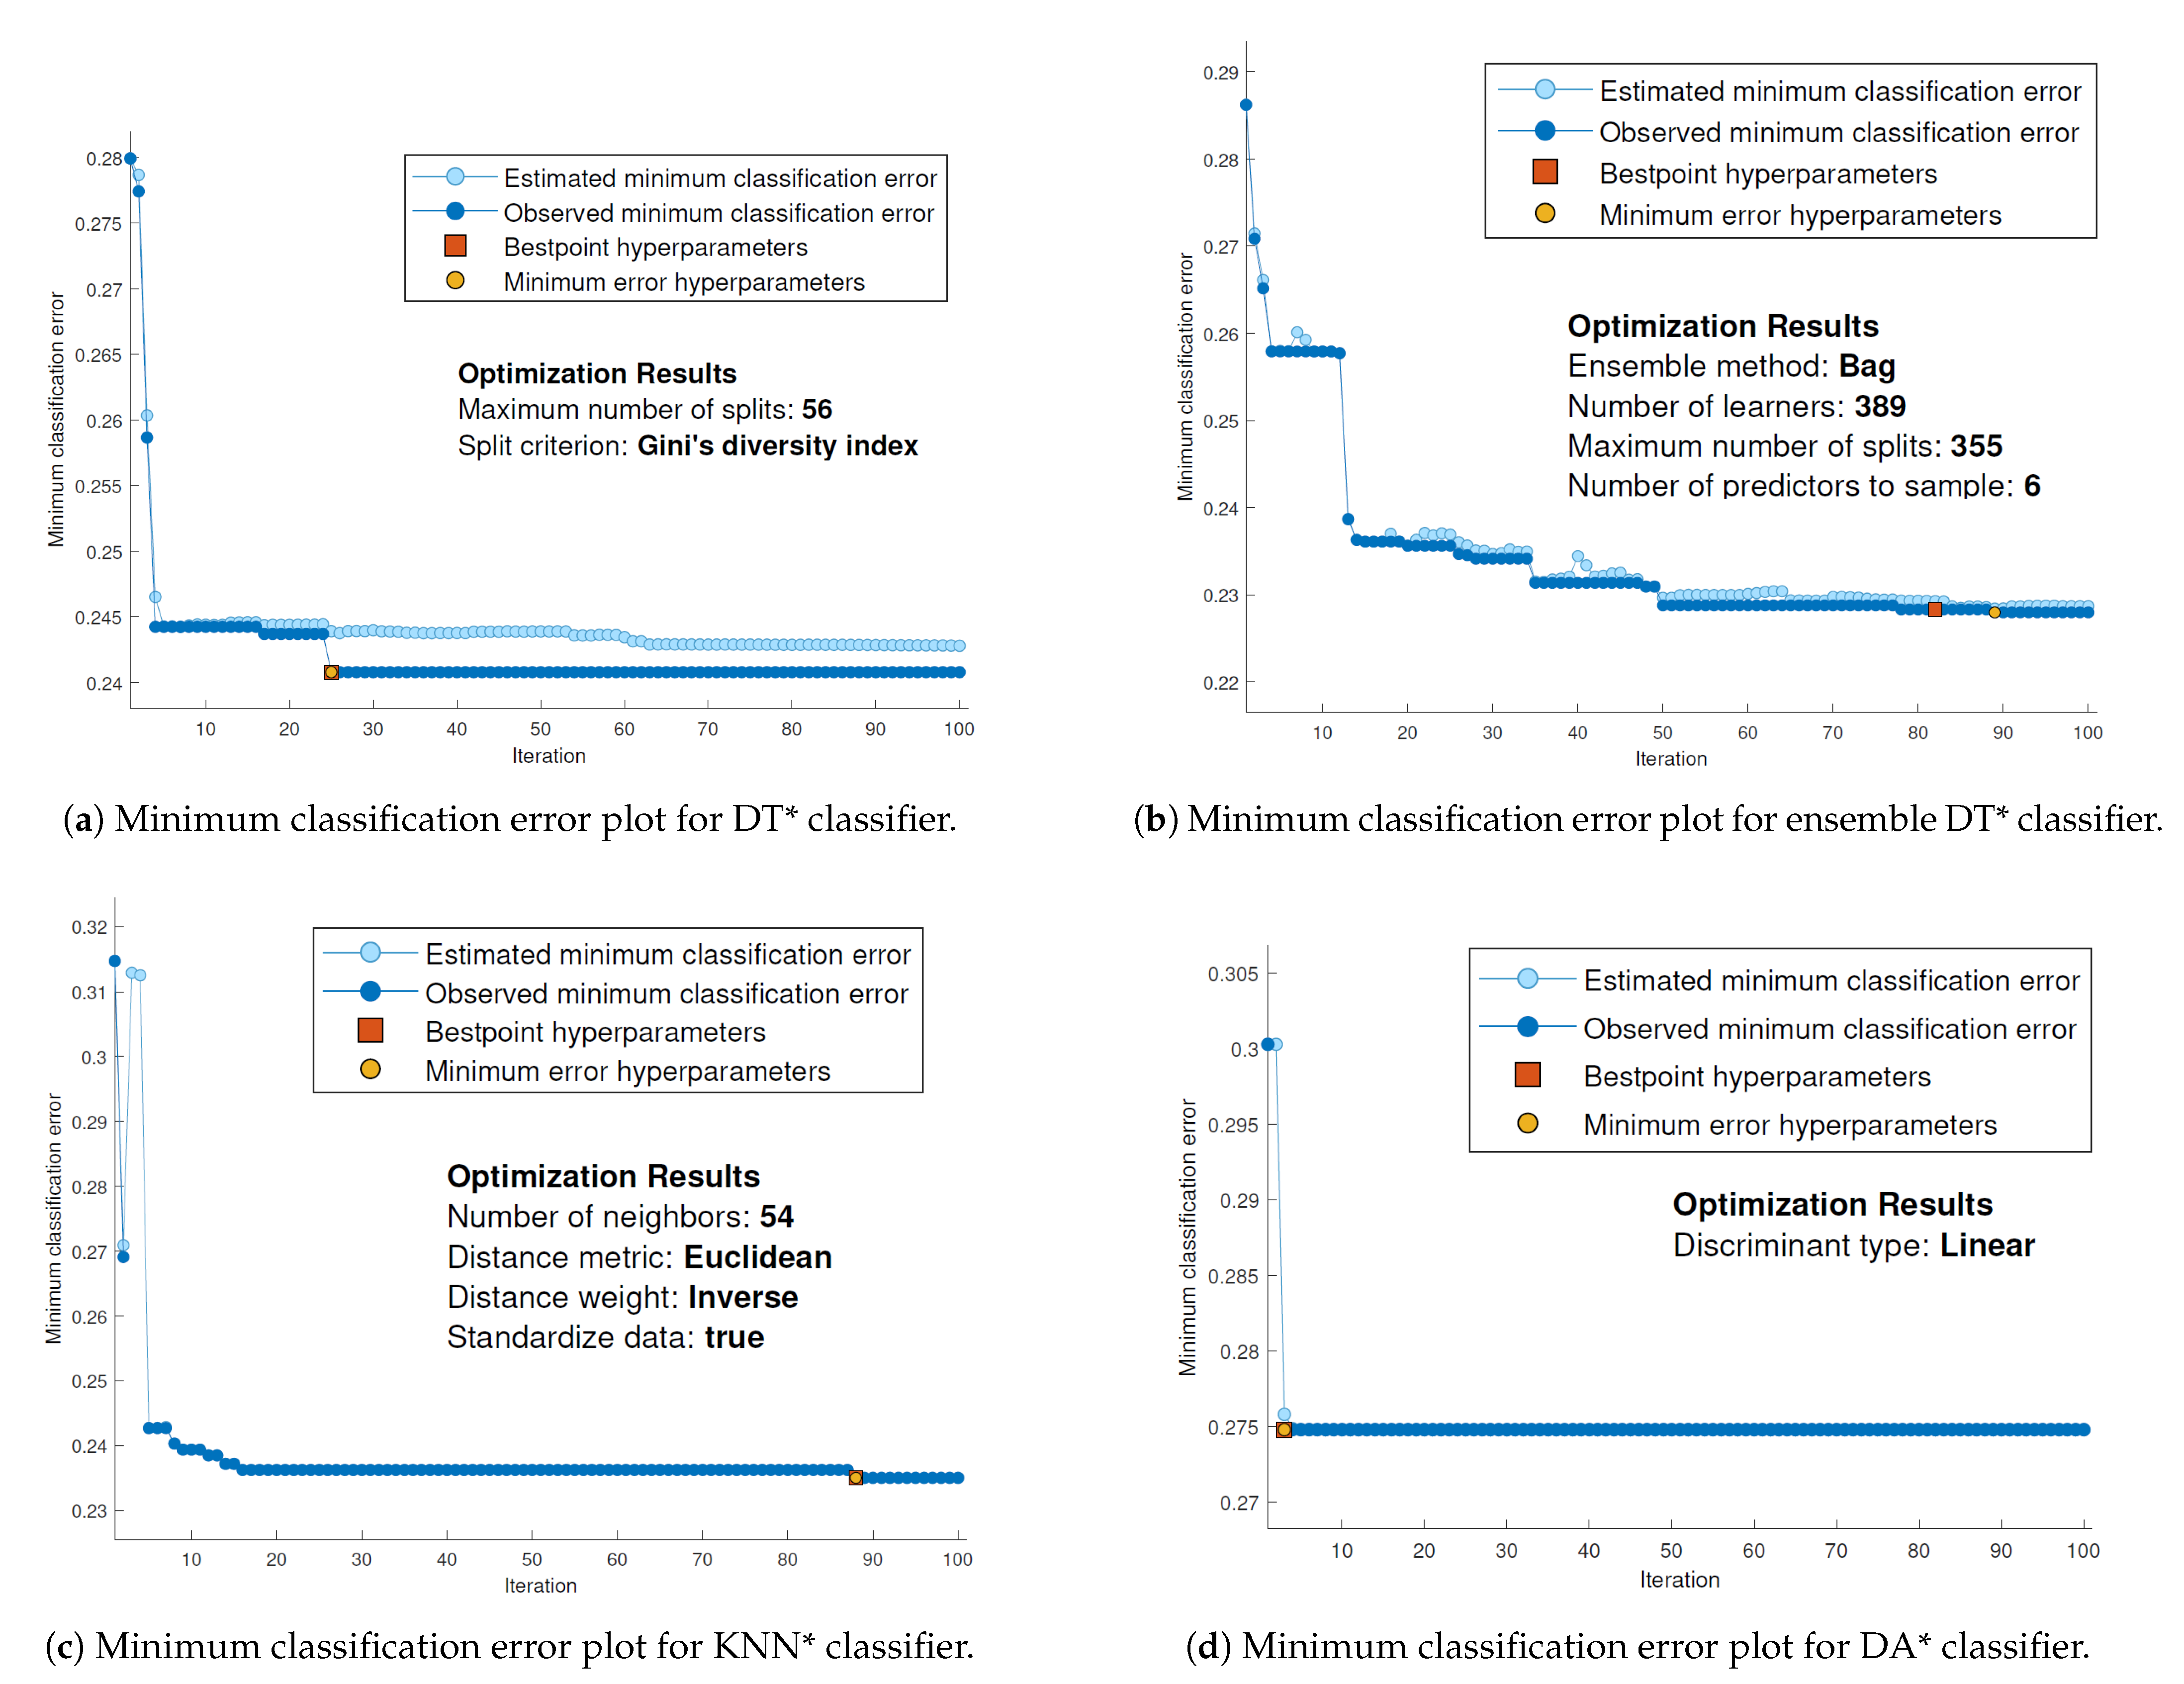
Figure 5 illustrates the minimum classification error for four classifiers (DT*, Ensemble DT*, KNN*, and DA*). The convergence curve (i.e., dark blue points) refers to the observed minimum classification error computed so far by the optimization process. While the light blue convergence curve refers to minimum classification error when examining all hyper-parameter values tried so far. Figure 5 shows that the classifiers accelerated to find the global minimum error. Accordingly, tuning internal parameters can affect the overall performance of the classifier. By tuning the parameters using the hyper-parameter optimization method instead of manually selecting these parameters during the learning process enables the selected model to explore different sets of combinations of hyper-parameter values. This process will give us a robust tuning method for internal parameters based on minimizing the model classification error.
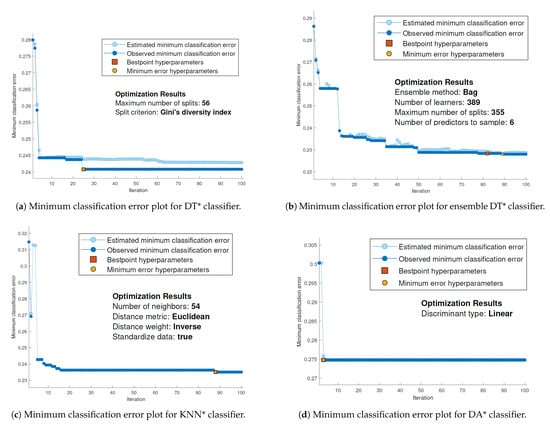
Figure 5.
Minimum classification error plot for DT* classifier.
5.3. Evaluation of ADASYN Technique
The collected ECG data is an imbalanced dataset. One of the most popular methods for handling imbalanced data is called SMOTE (Synthetic Minority Over-sampling Technique). SMOTE generates synthetic samples between every positive sample and one of its close sample [44], and Adaptive synthetic sampling (ADASYN), which finds a weighted distribution for many minority classes their difficulty through the learning process. In ADASYN, several synthetic data is created for minority class to assist the learning process and reduce the complexity [45].
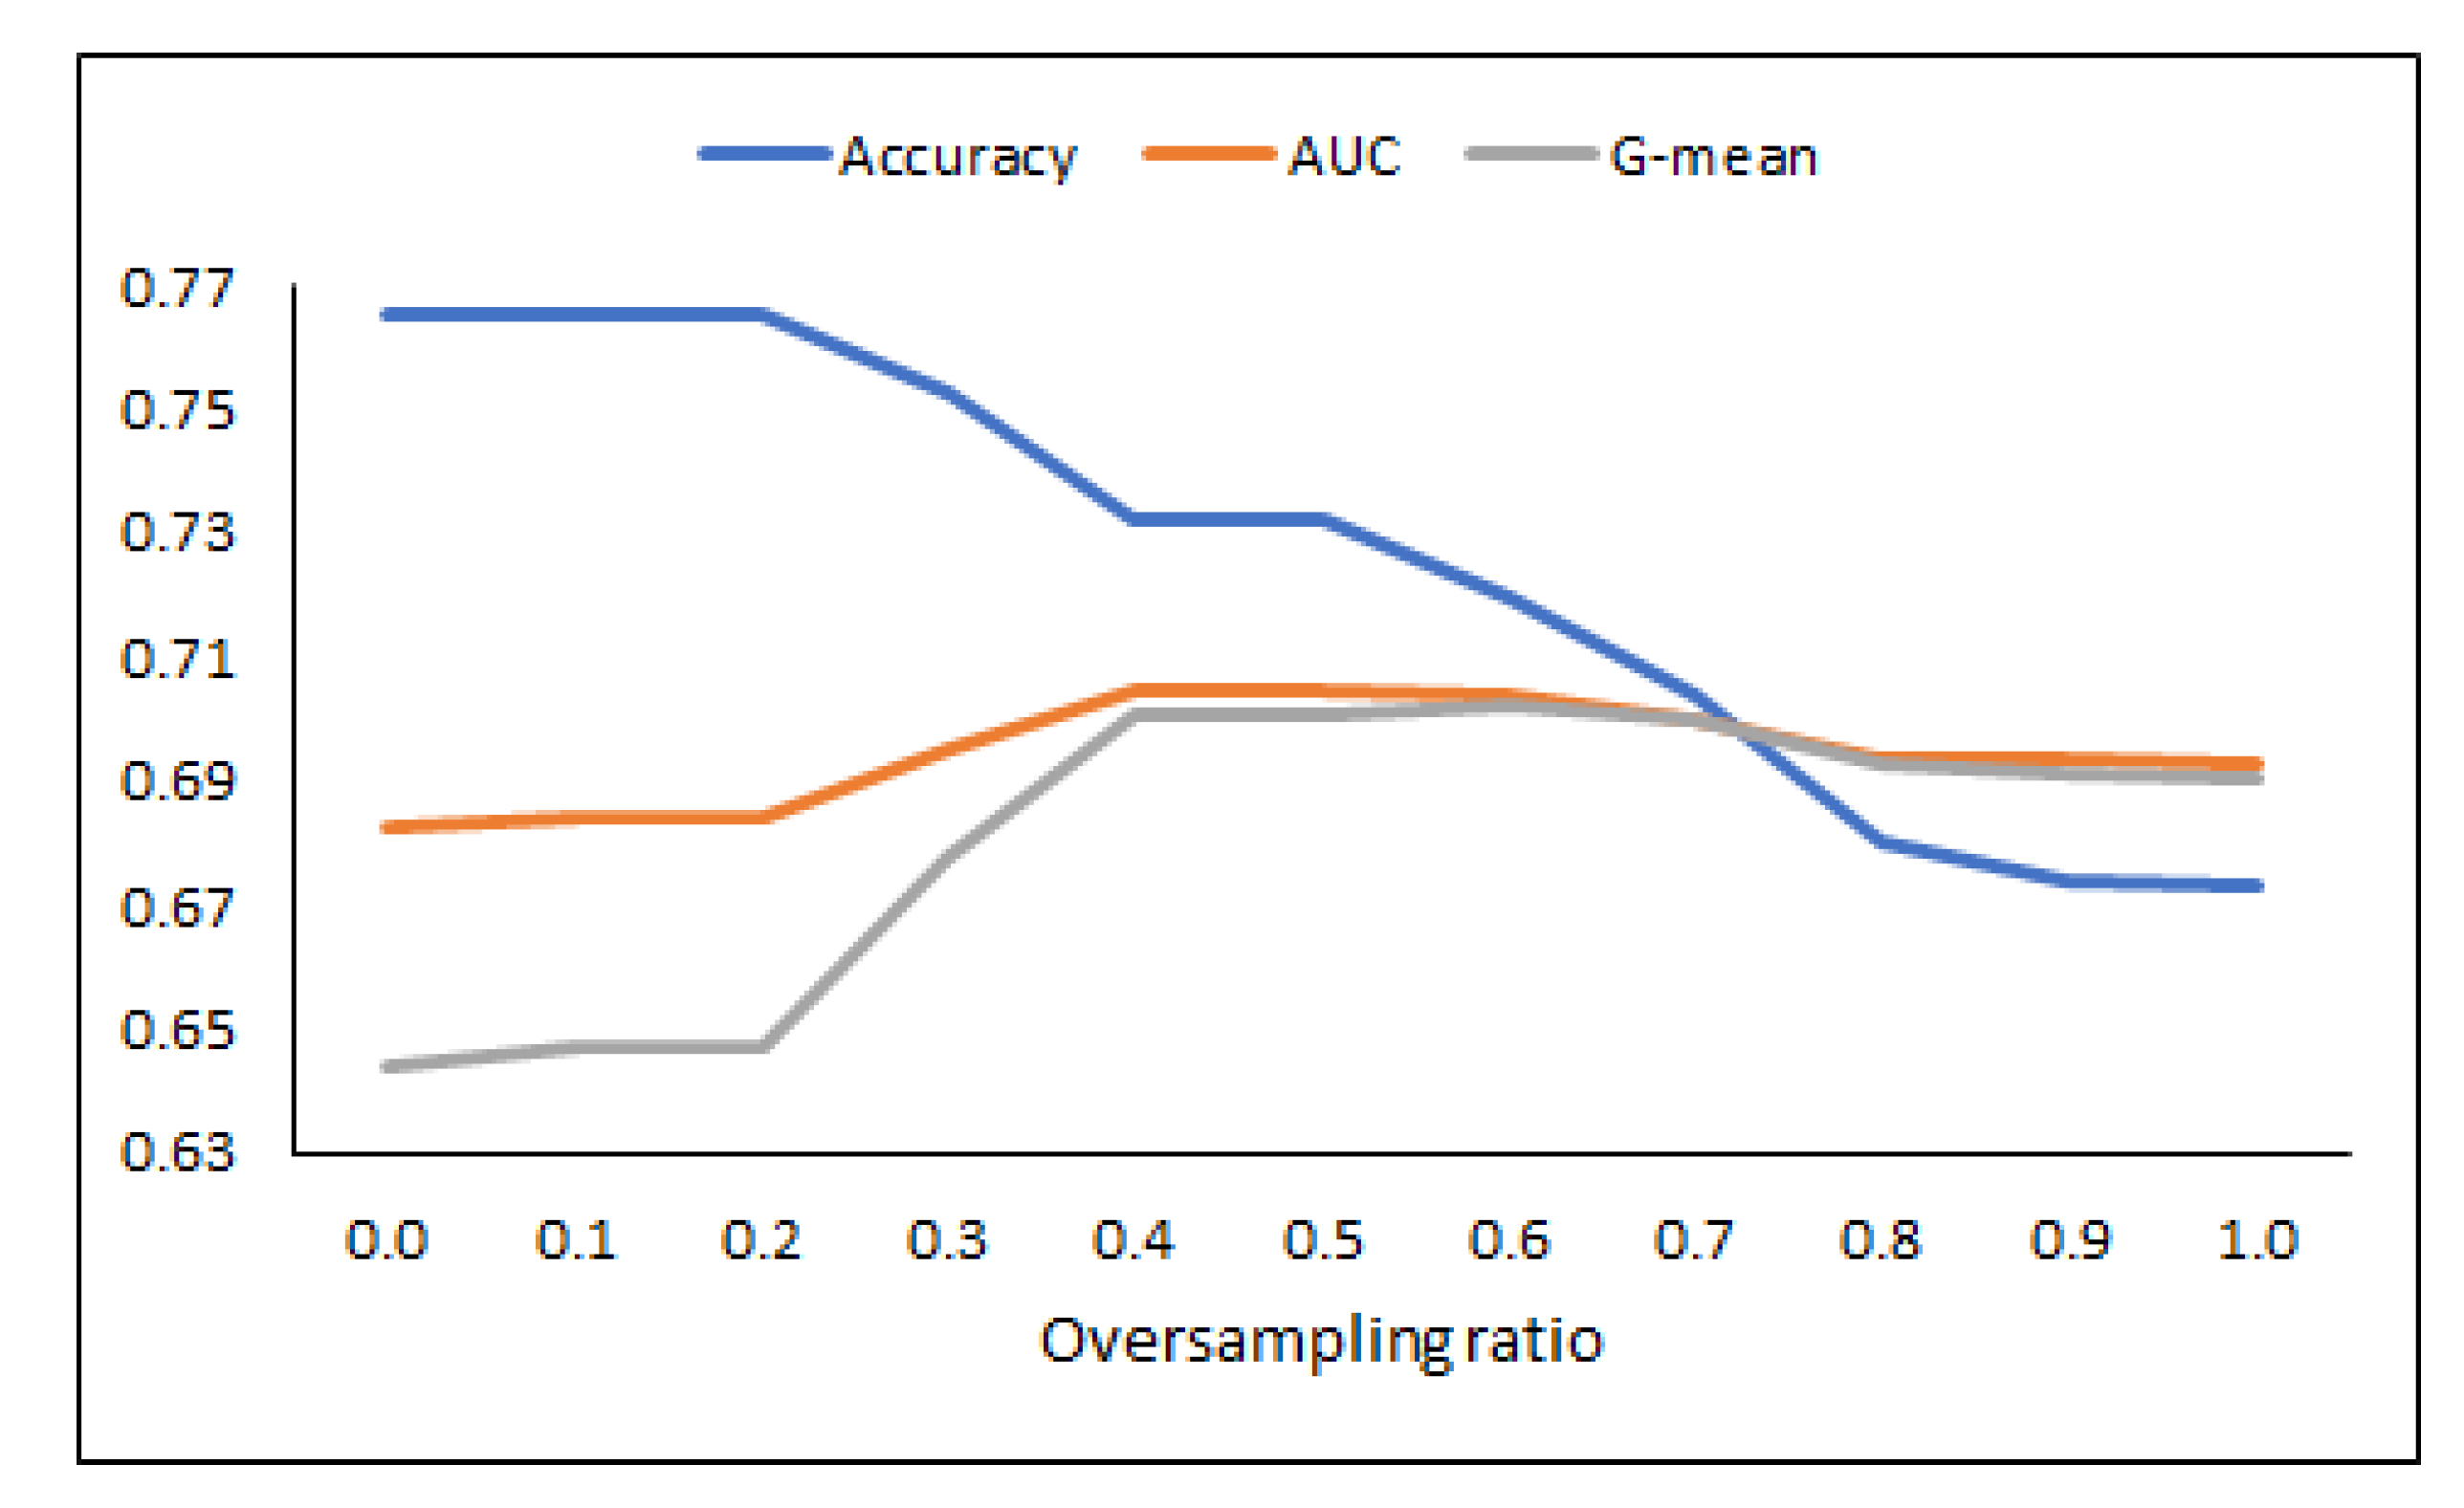
In this sub-section, we investigate the impact of the ADASYN technique on the learning model’s performance. Table 7 shows the KNN* classifier results using different oversampling ratios. It is clear that at the ratio equals 0.5, the performance of KNN* was highly robust with an AUC value equals 70.47. Although the accuracy is decreased compared to other ratios (see Figure 6), however, based on reported results of G-mean and AUC, the obtained model was more robust and had stable performance.
Table 7.
Results of KNN* classifier using different oversampling ratio.
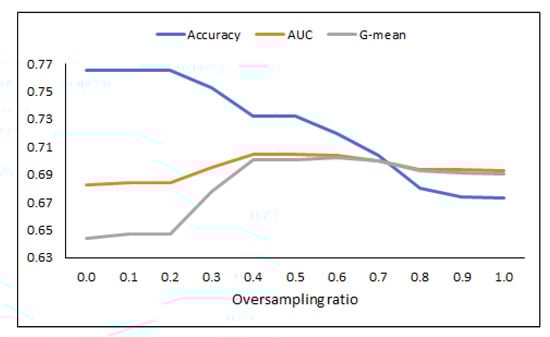
Figure 6.
Performance of KNN* in terms of accuracy, AUC, and G-mean measures.
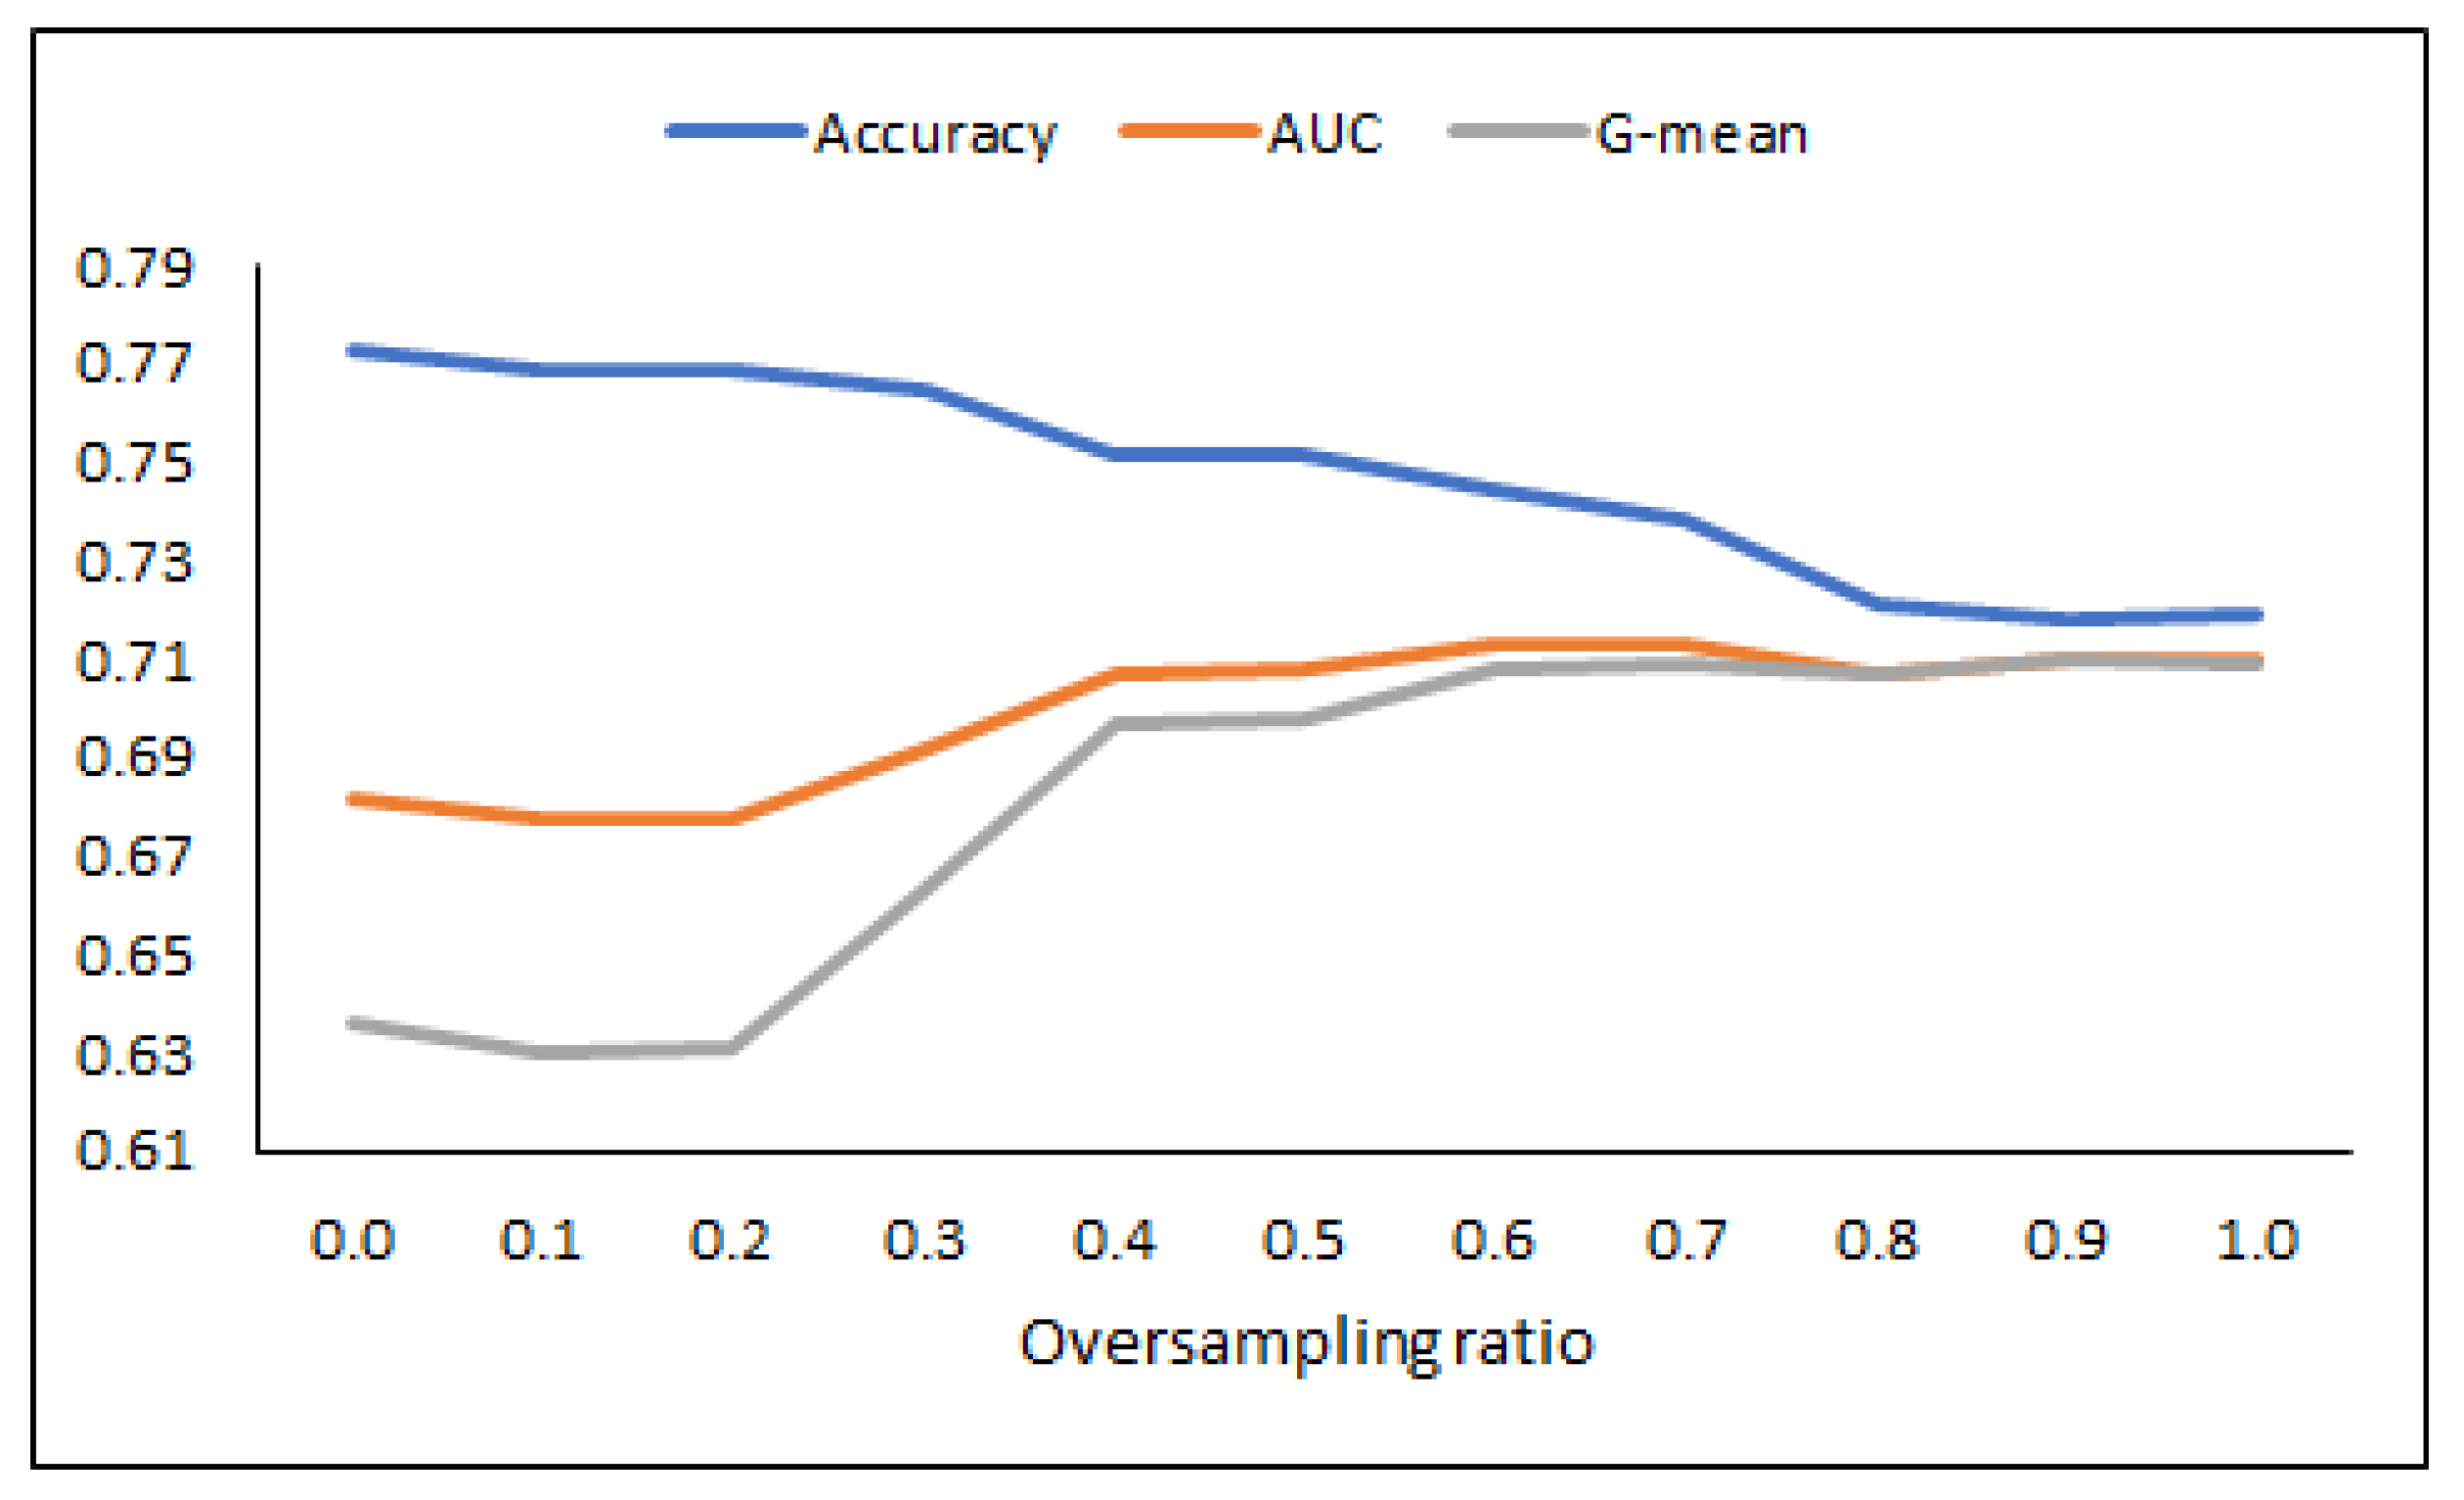
Table 8 and Figure 7 present the performance of the ensemble DT* using different oversampling ratios. The best AUC performance of ensemble DT* achieved at ratio equals 0.6, while the worst performance obtained at ratio equals 0.1. Figure 8 summarizes the comparison between KNN* and ensemble DT* based on the best oversampling ratios. It is clear that ensemble DT* was more accurate and robust as compared to KNN* classifier. The authors believe that finding the best oversampling ratio will generate a strong classifier that can avoid the over-fitting problem.
Table 8.
Results of ensemble DT* using different oversampling ratio.
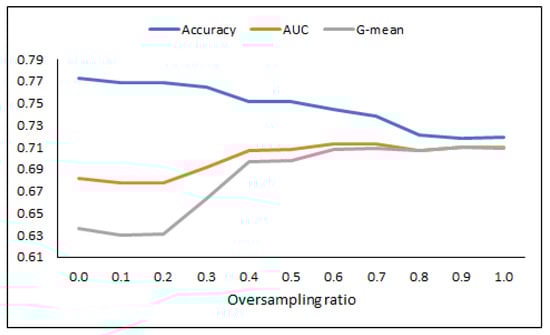
Figure 7.
Performance of Ensemble DT* in terms of accuracy, AUC, and G-mean measures.
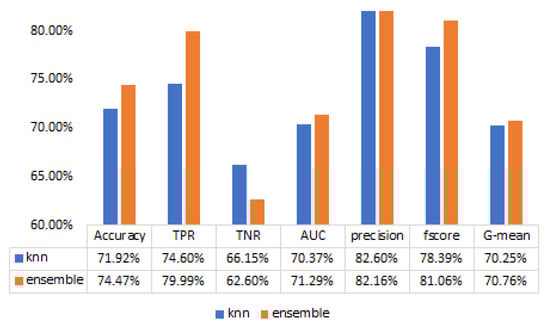
Figure 8.
Ensemble vs. KNN.
5.4. Impact of Feature Selection Technique
For the final part of the experiment, we evaluate the impact of the feature selection on sleep apnea classification. This sub-section employed the Relief method as a filter feature selection to select the significant attributes. The Relief method works by evaluating the quality of the features based on its ability to classify instances from one category to another in a local neighborhood. For example, the most valuable features can increase the distance between different class instances. In contrast, those features have less contribution to improving the distance between same class instances [46]. In other words, the Relief method can handle multi-class, noisy, and incomplete datasets.
Figure 9 shows the weight results of the Relief method. Note that the greater the weight, the higher the discriminative power of the feature is. Figure 9 shows that the eighth features had the highest importance while the ninth features provided the lowest weight. Table 9 explores the performance of the number of features using a different set of features. Based on the reported results, the ensemble DT* classifier’s overall performance has been improved considerably. Our finding indicates that the highest accuracy of 74.56% was achieved with eight features.
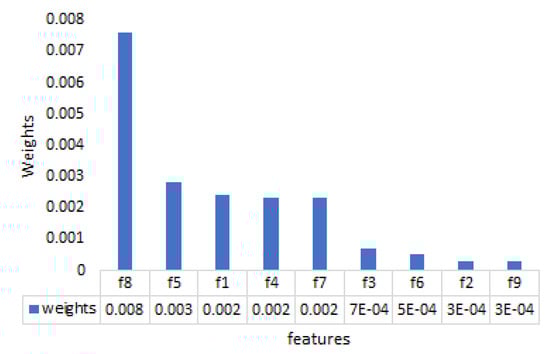
Figure 9.
Comparison between KNN* and ensemble DT* based on the best oversampling ratios.
Table 9.
Results of Relieff filter-based FS with incremental number of features based on their importance.
5.5. Validation Results
In this sub-section, we aim to access the performance of the proposed model on the unseen dataset. Once the classification model has been trained using 10-folds cross-validation, the validation process starts. Validation is an essential phase in building predictive models; it determines how realistic the predictive models when applied to real-world applications. In this research, the data obtained from the Physionet’s CinC challenge-2000 database consist of 70 records, divided into a learning set of 35 records and a test set of 35 records. The model is trained using the learning set, and then we applied the unseen test set to investigate the true performance of the trained model. After performing preprocessing steps, the generated test data contains 4935 samples such that 3197 samples are labeled as normal while 1738 samples are labeled as OSA affected.
Table 10 presents the evaluation results using the top classification model (ensemble DT*) through testing and validation process. Based on the findings, the ensemble DT* has retained the testing accuracy, AUC, precision, fscore, and G-mean of 74.47%, 71.29%, 82.16%, 81.06%, and 70.76%, respectively.
Table 10.
Results of ensemble DT* through testing and validation.
From the empirical analysis, the optimized classifiers have retained better classification results than those predefined parameter methods. Our findings prove that a better tuning of hyper-parameters significantly increased the classifiers’ performance, which can substantially help the learning model explain the target concepts. The results obtained in Table 6 support the arguments. Among the optimized classifiers, the KNN* and ensemble DT* was the best due to their high-performance measurement in the sleep apnea classification. Besides, we found that the implementation of ADASYN has a positive effect on the imbalance dataset, which offered a higher value of AUC and G-mean in the classification process. Moreover, the feature selection method was applied to select the optimal feature subset. The learning model’s accuracy can be further enhanced (See Table 9). All in all, it can be concluded that the utilization of both synthetic sampling and feature selection can be excellent ways to improve the performance of the learning process.
5.6. Evaluation of Deep Learning Approaches
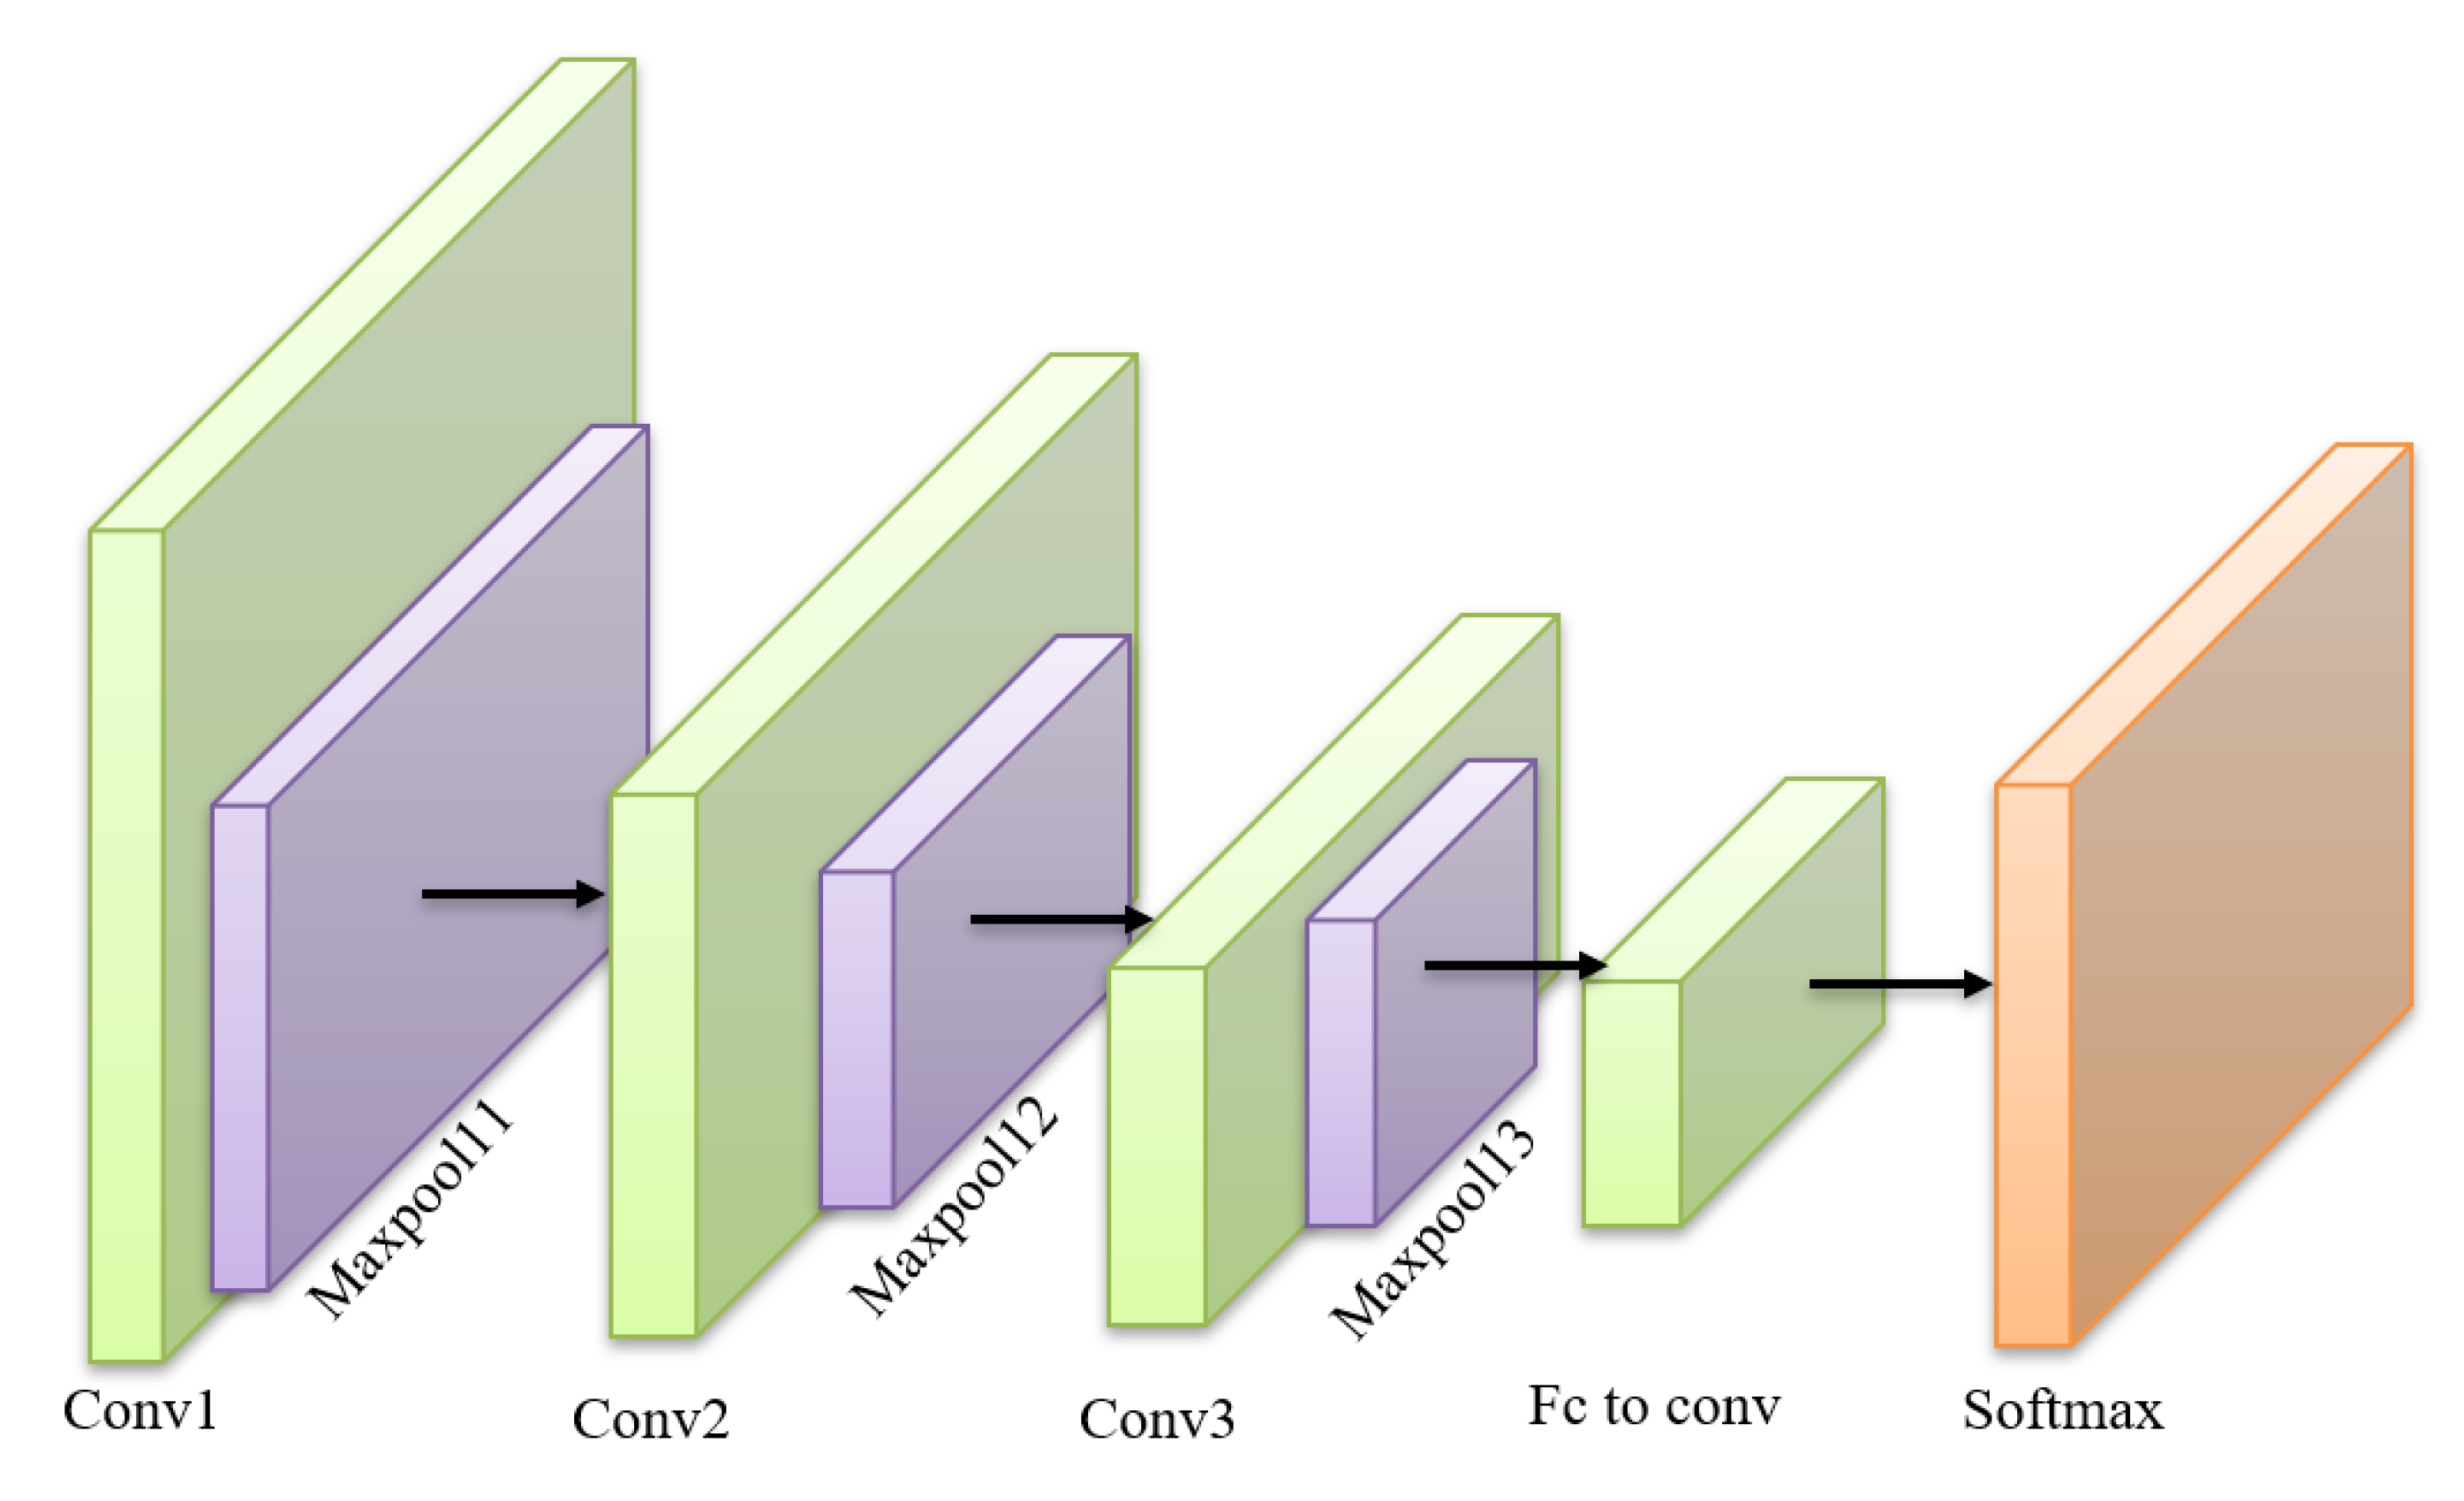
Undiagnosed and untreated OSA is one of the main health burdens in the USA. OSA has many consequences that can affect a person’s human life because it leads to several serious health problems, such as heart attacks, stroke, increased possibility of traffic accidents, and sudden death. Polysomnography (PSG) is considered the gold way for the exact diagnosis of OSA that needs a patient to spend a night at a sleep center. The analysis of the data collected is normally implemented by a practitioner who oversees studying hours of ECG records. However, this method is not fully accurate and hectic. Recently DL was proposed as a method to handle this task. Several types of DL models can be used to diagnose sleep apnea, such as Recurrent Neural Networks (RNN), Convolutional Neural Network (CNN), Long-Short Term Memory (LSTM). DL models can model complex nonlinear systems with high classification accuracy. A CNN consists of three main components: convolution layer, pooling layer, and classification layer. In the convolution layer, the feature map is obtained by utilizing a filter kernel to generate the convolution integral of the input data. In the pooling layer, the feature map is reduced and confined to the dimensions of input data. Finally, the classification layer uses a fully connected network to accomplish the classification task (See Figure 10). Deep Neural Networks was successfully used for sleep apnea-hypopnea severity classification in [47]. A deep neural network system with four hidden layers was developed utilizing a feature normalization technique called Covariance Normalization (CVN) in [48,49].
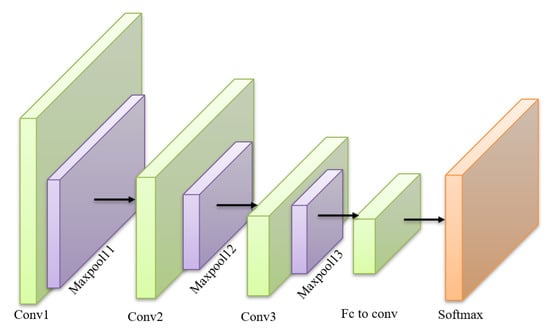
Figure 10.
An example of a three layers CNN model.
In this work, Four DL models were evaluated: RNN, one-dimensional CNN, LSTM, and a hybrid model of CNN and LSTM (CNNLSTM) introduced by Alakus and Turkoglu [50]. The detailed parameters settings of these models are presented in Table 11 based on the recommendation of study in [50].
Table 11.
Parameters of deep learning models.
Table 12 shows the classification performance of four deep learning models using two different optimizers (SGD and Adam). As can be observed, RNN worked better when implementing the SGD, with the accuracy and AUC of 0.8050 and 0.8837. As for CNN, LSTM, and CNNLSTM, we can see that these models achieved the optimal performance using Adam. Among these deep learning methods, the CNNLSTM has contributed the highest accuracy (0.9075), precision (0.9148), F1-score (0.9163), and AUC (0.9746). From the analysis, it is clear that the CNNLSTM can usually offer an accurate diagnosis of OSA. Ultimately, the CNNLSTM is the best deep learning method in the evaluation process, and hence only CNNLSTM will be applied in the rest of the analysis. Table 13 presents the training and validation results of the CNNLSTM. Based on the result obtained, the CNNLSTM was able to retain a high accuracy (0.8625) and AUC (0.9510) in the validation stage, which gives a better and accurate diagnosis of the OSA.
Table 12.
Classification performance metrics of deep learning models with 5-fold cross-validation approach.
Table 13.
Results of best-performing classifier CNNLSTM for the training and validation datasets.
Furthermore, we compare the performance of our CNNLSTM to other models in the literature. Table 14 outlines the performance comparison of the proposed CNNLSTM model with other seven studies. Among the previous studies, three of them were applying the machine learning while four of them were implementing the deep learning models. In Table 14, the highest accuracy of 0.8790 is obtained by 1-D CNN approach, and our CNNLSTM is ranked at third. In terms of the AUC measurement, it is obvious that our CNNLSTM has achieved the best result, 0.9510 compared to other studies. Ultimately, the proposed CNNLSTM can be considered as a valuable tool in diagnosing the OSA.
Table 14.
Comparison of the proposed CNNLSTM model with other previous studies.
6. Conclusions and Future Works
Obstructive sleep apnea (OSA) was considered a sleep ailment due to the shortage of oxygen supply. Early detection of the OSA can save human lives. In this paper, several machine learning and deep learning classifiers were employed to diagnose the OSA. The performances of the proposed models were validated and tested using the ECG dataset. Among the machine learning classifiers, our results indicated that the KNN* and ensemble D.T.* contributed to the highest performance. Besides, it was reported that the implementation of ADASYN and feature selection can further improve the classification model’s learning behavior. Furthermore, a hybridization of the CNN and LSTM was proposed to further improve the performance of the OSA diagnosis. From our experiment, it showed that the proposed CNNLSTM can often overtake other approaches and offered a better OSA diagnosis process. Future works can be focused on the development of feature selection and fuzzy logic for performance enhancement.
Author Contributions
Conceptualization, A.S., H.T., T.T., M.S.H. and S.R.S.; Methodology, A.S., H.T., M.M. and T.T.; Data curation, H.T., T.T. and J.T.; implementation and experimental work, A.S., H.T., T.T., J.T. and M.S.H.; Validation, A.S., M.M., H.T. and S.R.S.; Writing original draft preparation, A.S., H.T., T.T. and J.T.; Writing review and editing, A.S., H.T. and S.R.S.; Proofreading, A.S., S.R.S.; Supervision, A.S. All authors have read and agreed to the published version of the manuscript.
Funding
This research was supported by START Preliminary Proof of Concept Fund, University of Connecticut (UCONN), made possible by a generous grant from the CT Next Higher Education Fund (CTNext), Connecticut, USA 2020-2021; Taif University Researchers Supporting Project Number (TURSP-2020/125).
Data Availability Statement
Not applicable.
Acknowledgments
The authors would like to acknowledge the financial support provided through the START Preliminary Proof of Concept Fund, University of Connecticut (UCONN), made possible by a generous grant from the CT Next Higher Education Fund (CTNext), Connecticut, USA 2020–2021; The authors would like to acknowledge Taif University Researchers Supporting Project Number (TURSP-2020/125), Taif University, Taif, Saudi Arabia.
Conflicts of Interest
The authors declare that there is no conflict of interest regarding the publication of this paper.
References
- Umbro, I.; Fabiani, V.; Fabiani, M.; Angelico, F.; Del Ben, M. A systematic review on the association between obstructive sleep apnea and chronic kidney disease. Sleep Med. Rev. 2020, 53, 101337. [Google Scholar] [CrossRef] [PubMed]
- Sharma, M.; Raval, M.; Acharya, U.R. A new approach to identify obstructive sleep apnea using an optimal orthogonal wavelet filter bank with ECG signals. Informatics Med. Unlocked 2019, 16, 100170. [Google Scholar] [CrossRef]
- Azimi, H.; Xi, P.; Bouchard, M.; Goubran, R.; Knoefel, F. Machine Learning-Based Automatic Detection of Central Sleep Apnea Events From a Pressure Sensitive Mat. IEEE Access 2020, 8, 173428–173439. [Google Scholar] [CrossRef]
- Tagluk, M.E.; Sezgin, N. Classification of sleep apnea through sub-band energy of abdominal effort signal using wavelets+ neural networks. J. Med Syst. 2010, 34, 1111–1119. [Google Scholar] [CrossRef] [PubMed]
- Koley, B.L.; Dey, D. Real-Time Adaptive Apnea and Hypopnea Event Detection Methodology for Portable Sleep Apnea Monitoring Devices. IEEE Trans. Biomed. Eng. 2013, 60, 3354–3363. [Google Scholar] [CrossRef]
- Thommandram, A.; Eklund, J.M.; McGregor, C. Detection of apnoea from respiratory time series data using clinically recognizable features and kNN classification. In Proceedings of the 2013 35th Annual International Conference of the IEEE Engineering in Medicine and Biology Society (EMBC), Osaka, Japan, 3–7 July 2013; pp. 5013–5016. [Google Scholar]
- Marcos, J.V.; Hornero, R.; Álvarez, D.; Del Campo, F.; Aboy, M. Automated detection of obstructive sleep apnoea syndrome from oxygen saturation recordings using linear discriminant analysis. Med Biol. Eng. Comput. 2010, 48, 895–902. [Google Scholar] [CrossRef] [PubMed]
- Kapur, V.K.; Auckley, D.H.; Chowdhuri, S.; Kuhlmann, D.C.; Mehra, R.; Ramar, K.; Harrod, C.G. Clinical practice guideline for diagnostic testing for adult obstructive sleep apnea: An American Academy of Sleep Medicine clinical practice guideline. J. Clin. Sleep Med. 2017, 13, 479–504. [Google Scholar] [CrossRef] [PubMed]
- Acharya, U.R.; Chua, E.C.P.; Faust, O.; Lim, T.C.; Lim, L.F.B. Automated detection of sleep apnea from electrocardiogram signals using nonlinear parameters. Physiol. Meas. 2011, 32, 287. [Google Scholar] [CrossRef] [PubMed]
- Bali, J.; Nandi, A.; Hiremath, P. Efficient ANN Algorithms for Sleep Apnea Detection Using Transform Methods. In Advancement of Machine Intelligence in Interactive Medical Image Analysis; Springer: New York, NY, USA, 2020; pp. 99–152. [Google Scholar]
- Hassan, A.R. Automatic screening of Obstructive Sleep Apnea from single-lead Electrocardiogram. In Proceedings of the 2015 International Conference on Electrical Engineering and Information Communication Technology (ICEEICT), Dhaka, Bangladesh, 21–23 May 2015; pp. 1–6. [Google Scholar]
- Faust, O.; Acharya, U.R.; Ng, E.; Fujita, H. A review of ECG-based diagnosis support systems for obstructive sleep apnea. J. Mech. Med. Biol. 2016, 16, 1640004. [Google Scholar] [CrossRef]
- Kaya, K.A.; Yilmaz, B. A new tool for QT interval analysis during sleep in healthy and obstructive sleep apnea subjects: A study on women. Turk. J. Electr. Eng. Comput. Sci. 2013, 21, 1504–1513. [Google Scholar] [CrossRef]
- Christensen, B. Normal Electrocardiography (ECG) Intervals [Online]. Medscape Hear. Drugs Dis. 2014, 20. Available online: http://emedicine.medscape.com/article/2172196-overview (accessed on 29 November 2020).
- Korkalainen, H. Deep Learning for Next-Generation Sleep Diagnostics: Sophisticated Computational Methods for More Efficient and Accurate Assessment of Sleep and Obstructive Sleep Apnea. Ph.D. Thesis, Itä-Suomen Yliopisto, Kuopio, Finland, 2020. [Google Scholar]
- Bsoul, M.; Minn, H.; Tamil, L. Apnea MedAssist: Real-time sleep apnea monitor using single-lead ECG. IEEE Trans. Inf. Technol. Biomed. 2010, 15, 416–427. [Google Scholar] [CrossRef] [PubMed] [Green Version]
- Ng, A.K.; San Koh, T.; Baey, E.; Lee, T.H.; Abeyratne, U.R.; Puvanendran, K. Could formant frequencies of snore signals be an alternative means for the diagnosis of obstructive sleep apnea? Sleep Med. 2008, 9, 894–898. [Google Scholar] [CrossRef] [PubMed]
- Oliver, N.; Flores-Mangas, F. Healthgear: Automatic sleep apnea detection and monitoring with a mobile phone. J. Commun. 2007, 2, 1–9. [Google Scholar] [CrossRef]
- Guilleminault, C.; Winkle, R.; Connolly, S.; Melvin, K.; Tilkian, A. Cyclical variation of the heart rate in sleep apnoea syndrome: Mechanisms, and usefulness of 24 h electrocardiography as a screening technique. Lancet 1984, 323, 126–131. [Google Scholar] [CrossRef]
- Xie, B.; Minn, H. Real-Time Sleep Apnea Detection by Classifier Combination. IEEE Trans. Inf. Technol. Biomed. 2012, 16, 469–477. [Google Scholar] [CrossRef] [PubMed] [Green Version]
- Rodrigues, J.F., Jr.; Pepin, J.L.; Goeuriot, L.; Amer-Yahia, S. An Extensive Investigation of Machine Learning Techniques for Sleep Apnea Screening. In Proceedings of the 29th ACM International Conference on Information & Knowledge Management, Galway, Ireland, 19–23 October 2020; pp. 2709–2716. [Google Scholar]
- Stein, P.K.; Duntley, S.P.; Domitrovich, P.P.; Nishith, P.; Carney, R.M. A simple method to identify sleep apnea using Holter recordings. J. Cardiovasc. Electrophysiol. 2003, 14, 467–473. [Google Scholar] [CrossRef]
- Maier, C.; Rodler, V.; Laguna, P.; Dickhaus, H. Dynamic analysis of multi lead ECG recordings for detection and categorization of respiratory events during sleep. In Proceedings of the 2007 Computers in Cardiology, Durham, NC, USA, 30 September–3 October 2007; pp. 493–496. [Google Scholar]
- Uznańska, B.; Trzos, E.; Rechciński, T.; Kasprzak, J.D.; Kurpesa, M. Repeatability of sleep apnea detection in 48-hour Holter ECG monitoring. Ann. Noninvasive Electrocardiol. 2010, 15, 218–222. [Google Scholar] [CrossRef]
- Sharma, H.; Sharma, K. An algorithm for sleep apnea detection from single-lead ECG using Hermite basis functions. Comput. Biol. Med. 2016, 77, 116–124. [Google Scholar] [CrossRef] [PubMed]
- Wang, T.; Lu, C.; Shen, G.; Hong, F. Sleep apnea detection from a single-lead ECG signal with automatic feature-extraction through a modified LeNet-5 convolutional neural network. PeerJ 2019, 7, e7731. [Google Scholar] [CrossRef]
- Mendonça, F.; Mostafa, S.S.; Ravelo-García, A.G.; Morgado-Dias, F.; Penzel, T. A Review of Obstructive Sleep Apnea Detection Approaches. IEEE J. Biomed. Health Inform. 2019, 23, 825–837. [Google Scholar] [CrossRef] [PubMed]
- Varon, C.; Caicedo, A.; Testelmans, D.; Buyse, B.; Van Huffel, S. A Novel Algorithm for the Automatic Detection of Sleep Apnea From Single-Lead ECG. IEEE Trans. Biomed. Eng. 2015, 62, 2269–2278. [Google Scholar] [CrossRef] [PubMed]
- Li, K.; Pan, W.; Li, Y.; Jiang, Q.; Liu, G. A method to detect sleep apnea based on deep neural network and hidden Markov model using single-lead ECG signal. Neurocomputing 2018, 294, 94–101. [Google Scholar] [CrossRef]
- Chang, H.Y.; Yeh, C.Y.; Lee, C.T.; Lin, C.C. A Sleep Apnea Detection System Based on a One-Dimensional Deep Convolution Neural Network Model Using Single-Lead Electrocardiogram. Sensors 2020, 20, 4157. [Google Scholar] [CrossRef]
- Biswas, U.; Maniruzzaman, M. Removing power line interference from ECG signal using adaptive filter and notch filter. In Proceedings of the 2014 International Conference on Electrical Engineering and Information Communication Technology, Dhaka, Bangladesh, 10–12 April 2014; pp. 1–4. [Google Scholar]
- Bai, Y.-W.; Chu, W.-Y.; Chen, C.-Y.; Lee, Y.-T.; Tsai, Y.-C.; Tsai, C.-H. Adjustable 60 Hz noise reduction by a notch filter for ECG signals. In Proceedings of the 21st IEEE Instrumentation and Measurement Technology Conference (IEEE Cat. No.04CH37510), Como, Italy, 18–20 May 2004; Volume 3, pp. 1706–1711. [Google Scholar]
- Surani, S.; Sheta, A.; Turabieh, H.; Park, J.; Mathur, S.; Katangur, A. Diagnosis of sleep apnea using artificial neural network and binary particle swarm optimization for feature selection. Chest 2019, 156, A136. [Google Scholar] [CrossRef]
- Ma, B.; Wu, Z.; Li, S.; Benton, R.; Li, D.; Huang, Y.; Kasukurthi, M.V.; Lin, J.; Borchert, G.M.; Tan, S.; et al. A SVM-Based Algorithm to Diagnose Sleep Apnea. In Proceedings of the 2019 IEEE International Conference on Bioinformatics and Biomedicine (BIBM), San Diego, CA, USA, 18–21 November 2019; pp. 1556–1560. [Google Scholar]
- Ellawala, N.; Thayaparan, S. Hardware Implementation of EEG Classifier Using LDA. In Proceedings of the 2019 2nd International Conference on Bioinformatics, Biotechnology and Biomedical Engineering (BioMIC)—Bioinformatics and Biomedical Engineering, Yogyakarta, Indonesia, 12–13 September 2019; Volume 1, pp. 1–5. [Google Scholar]
- Obtaining CinC Challenge 2000 Scores. 2020. Available online: https://archive.physionet.org/physiobank/database/apnea-ecg/ (accessed on 29 November 2020).
- Penzel, T.; Moody, G.B.; Mark, R.G.; Goldberger, A.L.; Peter, J.H. The apnea-ECG database. In Proceedings of the Computers in Cardiology 2000 (Cat. 00CH37163), Cambridge, MA, USA, 24–27 September 2000; pp. 255–258. [Google Scholar]
- Tumar, I.; Hassouneh, Y.; Turabieh, H.; Thaher, T. Enhanced Binary Moth Flame Optimization as a Feature Selection Algorithm to Predict Software Fault Prediction. IEEE Access 2020, 8, 8041–8055. [Google Scholar] [CrossRef]
- Thaher, T.; Arman, N. Efficient Multi-Swarm Binary Harris Hawks Optimization as a Feature Selection Approach for Software Fault Prediction. In Proceedings of the 2020 11th International Conference on Information and Communication Systems (ICICS), Irbid, Jordan, 7–9 April 2020; pp. 249–254. [Google Scholar]
- Thaher, T.; Mafarja, M.; Abdalhaq, B.; Chantar, H. Wrapper-based Feature Selection for Imbalanced Data using Binary Queuing Search Algorithm. In Proceedings of the 2019 2nd International Conference on new Trends in Computing Sciences (ICTCS), Amman, Jordan, 9–11 October 2019; pp. 1–6. [Google Scholar]
- Khoshgoftaar, T.; Van Hulse, J.; Napolitano, A. Comparing Boosting and Bagging Techniques With Noisy and Imbalanced Data. IEEE Trans. Syst. Man Cybern. Part A 2011, 41, 552–568. [Google Scholar] [CrossRef]
- Thaher, T.; Jayousi, R. Prediction of Student’s Academic Performance using Feedforward Neural Network Augmented with Stochastic Trainers. In Proceedings of the 2020 IEEE 14th International Conference on Application of Information and Communication Technologies (AICT), Tashkent, Uzbekistan, 7–9 October 2020; pp. 1–7. [Google Scholar]
- Wolpert, D.H. The Lack of A Priori Distinctions Between Learning Algorithms. Neural Comput. 1996, 8, 1341–1390. [Google Scholar] [CrossRef]
- Bowyer, K.W.; Chawla, N.V.; Hall, L.O.; Kegelmeyer, W.P. SMOTE: Synthetic Minority Over-sampling Technique. J. Artif. Intell. Res. 2011, 16, 321–357. [Google Scholar]
- He, H.; Bai, Y.; Garcia, E.A.; Li, S. ADASYN: Adaptive synthetic sampling approach for imbalanced learning. In Proceedings of the 2008 IEEE International Joint Conference on Neural Networks (IEEE World Congress on Computational Intelligence), Hong Kong, China, 1–6 June 2008; pp. 1322–1328. [Google Scholar]
- Palma-Mendoza, R.J.; Rodriguez, D.; De-Marcos, L. Distributed ReliefF-based feature selection in Spark. Knowl. Inf. Syst. 2018, 57, 1–20. [Google Scholar] [CrossRef] [Green Version]
- Lakhan, P.; Ditthapron, A.; Banluesombatkul, N.; Wilaiprasitporn, T. Deep Neural Networks with Weighted Averaged Overnight Airflow Features for Sleep Apnea-Hypopnea Severity Classification. In Proceedings of the 2018 IEEE Region 10 Conference, Jeju, Korea, 28–31 October 2018. [Google Scholar]
- Vattamthanam, S.; Mrudula, G.B.; Kumar, C.S. Sleep Apnea Classification Using Deep Neural Network. In Proceedings of the 2020 IEEE International Conference on Distributed Computing, VLSI, Electrical Circuits and Robotics (DISCOVER), Karnataka, India, 30–31 October 2020; pp. 133–136. [Google Scholar]
- Shen, F.; Cheng, S.; Zhu Li, K.Y.; Li, W.; Dai, L. Detection of Snore from OSAHS Patients Based on Deep Learning. J. Healthc. Eng. 2020, 20. [Google Scholar] [CrossRef]
- Alakus, T.B.; Turkoglu, I. Comparison of deep learning approaches to predict COVID-19 infection. Chaos Solitons Fractals 2020, 140, 110120. [Google Scholar] [CrossRef] [PubMed]
- Song, C.; Liu, K.; Zhang, X.; Chen, L.; Xian, X. An Obstructive Sleep Apnea Detection Approach Using a Discriminative Hidden Markov Model From ECG Signals. IEEE Trans. Biomed. Eng. 2016, 63, 1532–1542. [Google Scholar] [CrossRef] [PubMed]
- Singh, S.; Majumder, S. A Novel Approach OSA detection using single-lead ECG Scalogram based on deep neural network. J. Mech. Med. Biol. 2019, 19, 1950026. [Google Scholar] [CrossRef]


Publisher’s Note: MDPI stays neutral with regard to jurisdictional claims in published maps and institutional affiliations. |
© 2021 by the authors. Licensee MDPI, Basel, Switzerland. This article is an open access article distributed under the terms and conditions of the Creative Commons Attribution (CC BY) license (https://creativecommons.org/licenses/by/4.0/).