Article

Beetroot Microencapsulation with Pea Protein Using Spray Drying: Physicochemical, Structural and Functional Properties

by
Purificación García-Segovia
,
Marta Igual
* and
Javier Martínez-Monzó
Food Investigation and Innovation Group, Food Technology Department, Universitat Politècnica de València, Camino de Vera s/n, 46022 Valencia, Spain
*
Author to whom correspondence should be addressed.
Appl. Sci. 2021, 11(14), 6658; https://doi.org/10.3390/app11146658
Submission received: 15 June 2021 / Revised: 15 July 2021 / Accepted: 19 July 2021 / Published: 20 July 2021
(This article belongs to the Special Issue Advanced Microencapsulation in Food Science)

Abstract

:
Beetroot is a root vegetable with carotenoids, phenols, vitamins, minerals, and water-soluble betalain pigments such as betacyanins (red-violet color) and betaxanthins (yellow-orange color), which have many nutritional and health benefits. Its use in the food industry is mainly as a powdered natural dye. This study aims to investigate the effect of adding pea protein to beetroot juice as an encapsulating agent, and the spray-dried temperature on the physicochemical, structural, and functional properties of the powder. The spray drying was conducted at 125 and 150 °C with 3.5% and 7% pea protein used in the mixtures with the beetroot juice. The water content, bulk density, porosity, hygroscopicity, water solubility, water absorption index, color, and microstructure of the obtained powder were determined. In addition, betacyanin, total phenols, antioxidant capacity, and powder encapsulate efficiency were analyzed. Using pea protein in the spray drying of beetroot juice had shown high yields of spray drying and good characteristics of the powdered product. Beetroot powder with 7% of pea protein was more porous and luminous, and less hygroscopic than beetroot powder with 3.5% of pea protein. However, the use of 7% of pea protein increased the amount of water immobilized by the samples and reduced the soluble solids present in the product compared to beetroot powder with 3.5% of pea protein. The use of 7% of pea protein protected beetroot bioactive compound higher than the use of 3.5%. Higher spray-drying temperature (150 °C) significantly decreased phenols content and antioxidant capacity of the beetroot powders (p < 0.05). Results showed using 7% pea protein mixed with beetroot juice and a 125 °C spray-drying temperature gave the most content of the studied bioactive compounds and antioxidant capacity. Moreover, the proposal gives more stable powders from a functionality viewpoint because it showed the higher encapsulate efficiency.

1. Introduction

Beetroot (Beta vulgaris) is botanically classified as an herbaceous biennial from the Chenopodiaceae family and has several varieties with bulb colors ranging from yellow to red. Deep, red-colored beetroots are the most popular for human consumption; cooked, raw (in salad), or juiced. There is growing interest in using natural food colors because synthetic dyes are being increasingly critically assessed by the consumer [1,2]. Beetroot contents such as carotenoids, nitrates, flavonoids, vitamins, minerals, and water-soluble pigments betalains such as betacyanins (red-violet color) and betaxanthins (yellow-orange color) are found to have many nutritional and health benefits [3]. Furthermore, studies have reported that beetroot is an important source of health-promoting phytochemicals [4]. Concretely, betalains and phenolic compounds that exist in red beetroot have been reported to increase the resistance of low-density lipoproteins (LDL) to oxidation and to prevent cancer and cardiovascular diseases by reducing the oxidative effect of free radicals on lipids [5,6,7]. Therefore, utilization of beetroot as an ingredient in different food products imparts beneficial effects on human health and provides an opportunity for development of different functional foods.
Bioactive compounds are sensitive to oxygen, light, heat, and water [8]. One effective method to preserve bioactive compounds is microencapsulation [9]. Microencapsulation is a technology for packing solids, liquids, or gaseous materials in miniature, sealed capsules to release their contents at controlled rates under specific conditions. Microencapsulation protects the core from adverse environmental conditions, improves shelf life of a product, and promotes controlled release [10].
Spray drying (SD) is one technique employed for microencapsulation. The process of SD transforms a product from a fluid to solid powdered state, through the dispersion of the product droplets inside a chamber where it contacts hot air [11].
Plant proteins could be an alternative to replace animal proteins and are extensively used in food, pharmaceutical, and cosmetic products. Particularly, seed storage proteins are used for emulsifying, film-forming, and gelling properties [12,13,14,15,16,17]. The plant protein most extensively studied for its functional properties is from soy [18]. However, using storage proteins of pea (Pisum sativum L.) seeds in the food industry for the formulation of new food products are interesting because of their nonallergenic characteristic and good functional properties [19].
Pea protein isolate (P) made from Pisum sativum L. is an important, readily available protein frequently incorporated into foods and supplements. Pea proteins have functional properties suitable for encapsulation, such as solubility, the ability to absorb water and oil, emulsion stabilization, gelation, foaming agents, and an ability to form the quality film and good organoleptic properties [20]. For example, pea protein has been used by Jarzębski et al. to stabilize hempseed oil nanoemulsion satisfactorily [21].
Beetroot juice has been encapsulated by carrier agent such as Arabic gum or maltodextrin as a potential source of betalain using spray drying [22]. Soy protein has been used as carrier for encapsulation of beetroot pomace extract by freeze drying [23]. However, this study aimed to evaluate the effect of adding pea protein to beetroot juice as an encapsulating agent, and the processing spray-dried temperature on the physicochemical, structural, and functional properties of the powder, since pea protein could offer aptitude to encapsulate and protect the bioactive compounds present in beetroot. In addition, spray-drying temperature is of vital importance to both powder yield and productivity and degradation of bioactive compounds.

2. Materials and Methods

2.1. Raw Material

Beetroot was purchased from a local market (Valencia, Spain). Pea protein powder (Nutralys® S85F) (P) was supplied by Roquette S.L. (Valencia, Spain).

2.2. Preparation of the Feed Mixture and Spray-Drying (SD) Conditions

The washed beetroots were liquidized in an electrical food processor (DeLonghi, Barcelona, Spain). The obtained juice was mixed with a water solution containing two concentrations of P. To incorporate P in different concentrations, solutions in water were previously prepared; each of these solutions was 200 g, which were added to 200 g of beetroot juice. The °Brix of the beetroot juice, P solution, and mixture were measured with a refractometer at 20 °C (PAL-BX/RI, Atago, Tokyo, Japan). The mixture was stirred for 30 min until homogeneous; mixtures ultimately gave 3.5 or 7% of P. These P concentrations were obtained from previous studies (data not shown) to achieve adequate viscosities in the mixtures to flow through the spray dryer feed tube. After this, the °Brix was measured and the mixture was fed into a Büchi B-290 (Flawil, Switzerland) mini spray dryer at 9 mL/min of pumping, with 35 m3/h of aspirator rate and 473 L/h atomization air. Drying air inlet temperature was 125 or 150 °C, and the outlet temperature was registered. Samples were collected from the powder collection vessel after experiments, when the air inlet temperature fell below 50 °C. Thus, the powdered products obtained from beetroot were: 3.5P125 or 3.5P150, powder with 3.5% of pea protein concentration spray dried at 125 or 150 °C, respectively; 7P125 or 7P150, powder with 7% of pea protein concentration spray dried at 125 or 150 °C, respectively.

2.3. Product Yield, Drying Ratio, and Productivity

Product yield (Yp) was the quotient of the solutes mass present in the powder obtained at the end of the SD process, to the solutes mass present in the mixture before SD [24]. The SD drying ratio [25] was calculated using Equation (1) (powder solid content/feed solid content).
Drying   ratio = ( X w i + 1 ) ( X w f + 1 )
where Xwi is the mixture feed moisture (dry basis) and Xwf is the powder moisture (dry basis). The productivity [25] was calculated using Equation (2).
Productivity   ( g / h ) = Feed   rate   g / h Drying   ratio

2.4. Analytical Determinations

All the analyses on samples were performed in triplicate.

2.4.1. Water Content (xw)

The water content (g/100 g) in beetroot juice, mixtures with P, and obtained powders were obtained by vacuum drying in a vacuum oven (Vaciotem, J.P. Selecta, Spain) at 70 ± 1 °C under a pressure of <100 mmHg until achieving a constant weight according to method 964.22 of AOAC [26].

2.4.2. Soluble Solid Content (xs)

The soluble solid content in beetroot juice and mixtures with P were determined by measuring the °Brix in the sample with a portable digital refractometer PAL-BX/RI, at 20 °C (Atago, Japan).

2.4.3. Crude Protein

The nitrogen content was determined using the Dumas method in a Leco CN628 Elemental Analyzer (Leco Corporation, St. Joseph, MI, USA) according to official method 990.03 of AOAC International (2002) [27]. Crude protein (CP) was calculated as the nitrogen content multiplied by the nitrogen factor (5.34) used for peas [28].

2.4.4. Hygroscopicity

To measure hygroscopicity [25], samples (about 1 g in a Petri dish) of each powder were placed at 25 °C in an airtight plastic container containing a Na2SO4 saturated solution (81% RH) at the bottom. Each sample was weighed after 1, 3, and 7 days, and hygroscopicity was expressed as g of water gained per 100 g dry solids.

2.4.5. Bulk Density and Porosity

Porosity (ε) was determined from true (ρ) and bulk (ρb) densities using the method of Igual et al. [29] with slight modifications. To determine ρb, about 2 g of powder were placed inside a 10 mL graduated test tube, and the occupied volume was noted. Bulk density was calculated by dividing the mass of powder by the occupied volume and was expressed as g/L. True density of samples was established by a helium pycnometer (AccPyc 1330, Micromeritics, Norcross, GA, USA).

2.4.6. Water Solubility Index (WSI) and Water Absorption Index (WAI)

The WSI and WAI were analyzed according to Singh and Smith [30]. WSI and WAI were calculated according to Equations (3) and (4), respectively.
WSI   % = weight   of   dissolved   solids   in   supernatant   weight   of   dry   solids   ×   100
WAI   = weight   of   sediment   weight   of   dry   solids  

2.4.7. Color Measurement

The color of the powder samples was measured with a standard D65 illuminate and 10° visual angle (Konica Minolta CM-700d colorimeter, Tokyo, Japan). A reflectance glass (CR-A51, Minolta Camera, Japan) was placed between the sample and colorimeter lens. The measurement window was 6 mm in diameter. The results were expressed using CIELab system [31]. Chroma; C * (saturation), hue angle; h *, the total color difference between samples with the same P concentration and different spray-dried temperature; ΔE1, and total color difference between samples with the same spray-dried temperature and different P concentration; ΔE2 were also calculated.

2.4.8. Total Phenols (TP)

Determining TP was based on the Folin–Ciocalteu method. The extraction procedure consisted of homogenizing 35 g of beetroot juice or 2 g of beetroot powder for 1 min with 50 mL of methanol. The mixture was centrifuged (12,857× g, 10 min, 4 °C, Eppendorf Centrifuge 5804 R, Hamburg, Germany) to obtain the supernatant [32]. Then, 15 mL of distilled water and 1.25 mL of Folin–Ciocalteu reagent (Sigma-Aldrich, Steinheim, Germany) were added to 250 μL of the supernatant. The samples were mixed and allowed to stand for 8 min in darkness before 3.75 mL of 7.5% sodium carbonate aqueous solution was added. Water was added to adjust the final volume to 25 mL. Samples were allowed to stand for 2 h at room temperature before measurement. Absorbance was measured at 765 nm in a UV-3100PC spectrophotometer (VWR, Leuven, Belgium). The total phenolic content was expressed as mg of gallic acid (Sigma-Aldrich, Steinheim, Germany) equivalents (GAE) per 100 g of sample and per 100 g of beetroot solids to compare all the samples (liquids and powders) [33].

2.4.9. Betalains

The betalains (betacyanins and betaxanthins) pigment contents in beetroot samples were measured according to Nilsson [34] with some modifications. Samples were mixed with phosphate buffer (0.05 M, pH 6.5). The mixture was centrifuged (12,857× g, 10 min, 4 °C) to obtain the supernatant. Then, 0.02 mL of the supernatant was added to 3 mL phosphate buffer (0.05 M, pH 6.5). Absorbances of samples were measured at 476, 538, and 600 nm with a phosphate buffer used as a blank. The wavelengths of 538 and 476 nm were used for betacyanin and betaxanthin analysis, respectively, and 600 nm for correction. Absorbances of betanin and vulgaxanthin-I were calculated using Equations (5)–(7):
x = 1.095 × a c
y = b z x 3.1
z = a x
where a is absorbance at 538 nm, b is absorbance at 476 nm, c is absorbance at 600 nm, x is absorbance of betanin corrected for colored impurities, y is absorbance of vulgaxanthin-I corrected for colored impurities, and z is absorbance of impurities. Betanin and vulgaxanthin-I concentrations in beetroot samples were calculated using Equation (8):
B C m g / L = A × D F × M W × 1000 E C × L
where A is the absorbance of betanin corrected for colored impurities (x) or absorbance of vulgaxanthin-I corrected for colored impurities (y). DF is the dilution factor and L is the pathlength of the 1 cm cuvette. For MW and EC, the molecular weights and extinction coefficients of the representative compounds betanin (550 g/mol and 60.000 L/mol·cm, respectively) and vulgaxanthin-I must be considered (308 g/mol and 48.000 L/mol·cm, respectively). The betacyanins content was expressed as mg betanin equivalents per 100 g of sample (mgBE/100 g), and the betaxanthins content was expressed as mg vulgaxanthin-I equivalents per 100 g of sample (mgVE/100 g) and per 100 g of beetroot solids for comparing all the samples (liquids and powders) [33].

2.4.10. Antioxidant Capacity (AC)

AC was assessed using the free radical scavenging activity of the samples evaluated with the stable radical 1,1-diphenyl-2-picrylhydrazyl (DPPH) following Igual et al.’s [32] methodology. A UV-3100PC spectrophotometer (VWR, Leuven, Belgium) was used to measure the absorbance at 515 nm. The percentage of DPPH was calculated following other author guidelines [29]. The results were expressed as milligram Trolox equivalents (TE) per 100 g of sample and per 100 g of beetroot solids for comparing all the samples (liquids and powders) [30] (mg TE/100 g or mg TE/100 gBS), using a Trolox calibration curve in the range of 10–500 mg/L (Sigma-Aldrich, Steinheim, Germany).

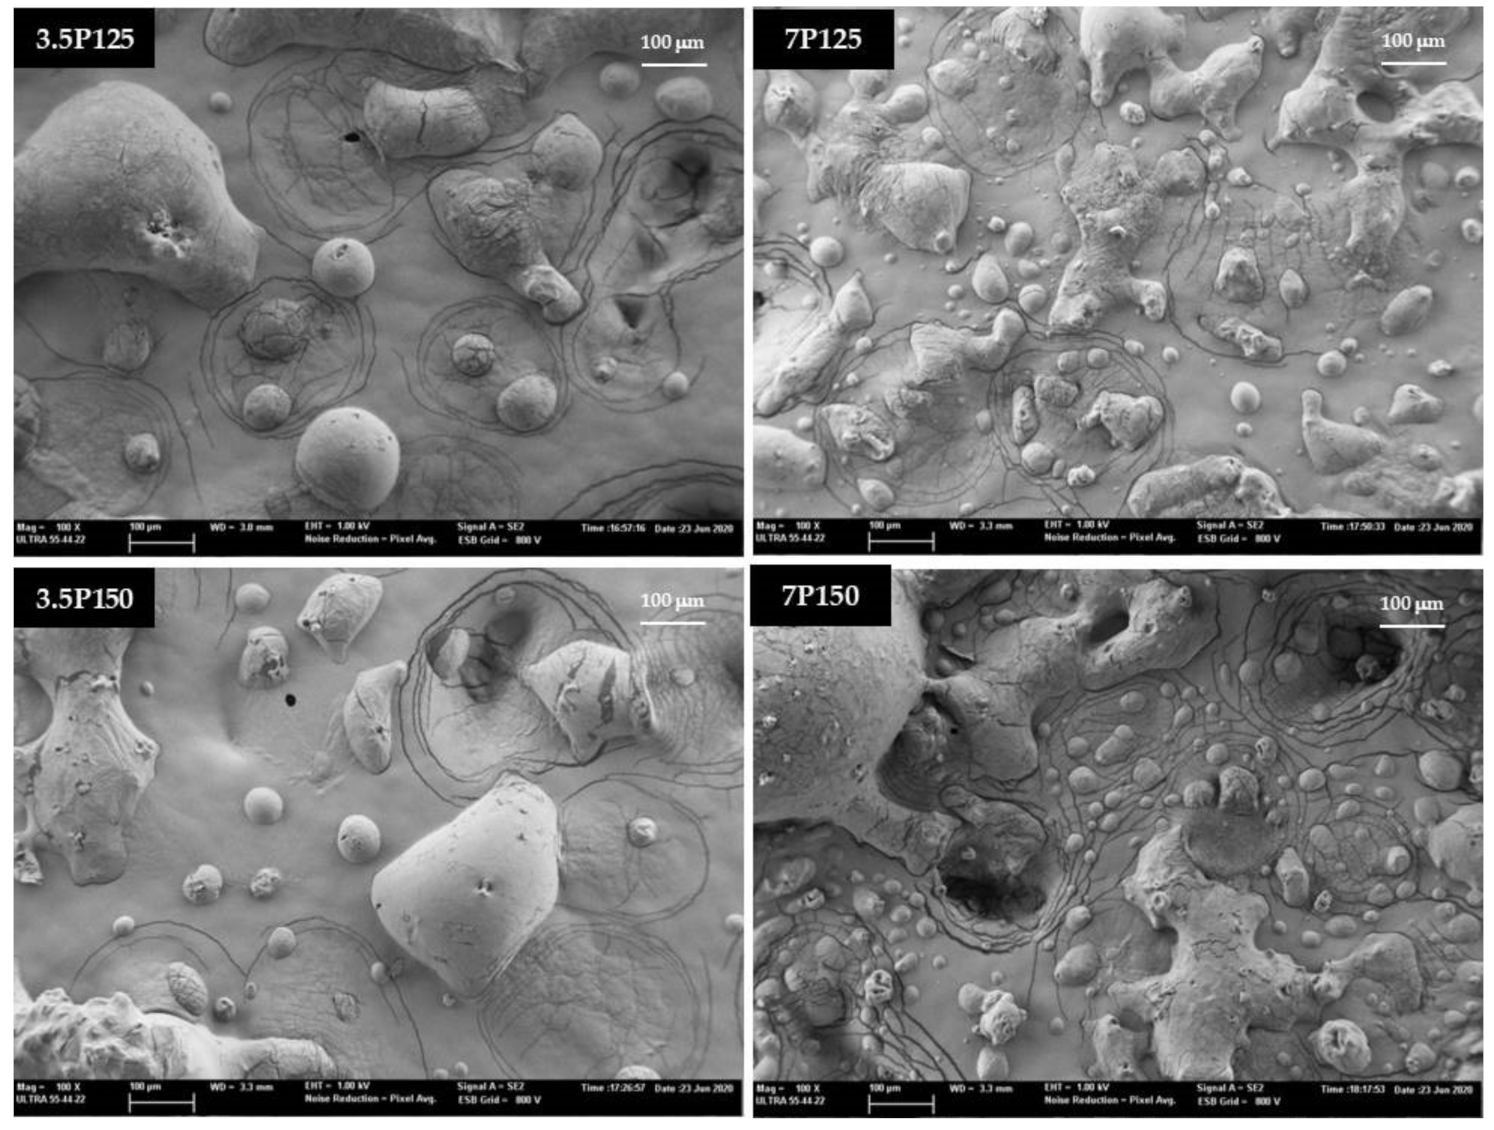
2.5. Powder Morphology

Morphology and surface microstructures of beetroot powders were examined using a Zeiss Ultra55 Field Emission Scanning Electron Microscope (FESEM; Carl Zeiss AG, Germany) with the Secondary Electron Detector (ETSE). The powder was fixed on a carbon adhesive tape and was platinum coated before analysis. Images were taken at an accelerating voltage of 1 kV and WD 3.5 mm. To examine the microstructure of samples, the electron mode was used under ×100 magnifications. Three representative location areas were imaged for each sample, and at least 12 images at different magnifications were obtained to assure the FESEM imaging results were representative.

2.6. Encapsulation Efficiencies (EE)

To evaluate the EE, total analyzed bioactive compounds (TB) content (TP, betalains, and AC) and surface-analyzed bioactive compounds (SB) content of the samples were determined after SD. For TB determination, samples were treated according to each bioactive compound (TP, betalains, and AC). For SB determination, samples were not ground to destroy microcapsules, samples were only extracted with the solvents in a vortex for 30 s and filtered through 0.45 µm sized filter following the procedure of Idham et al. [35]. The % of EE was calculated using Equation (9).
%   E E = T B S B T B × 100

2.7. Statistical Analysis

Analysis of variance (ANOVA) was applied with a confidence level of 95% (p < 0.05), to evaluate the differences among samples. Furthermore, a correlation analysis among all parameters studied, with a 95% significance level, was achieved. Statgraphics Centurion XVII Software, version 17.2.04 (Statgraphics Technologies, Inc., The Plains, VA, USA) was used.

3. Results and Discussion

Table 1 shows the beetroot juice’s water, soluble solids, total phenol, betacyanins, betaxanthins content, and antioxidant contents in this study. The values of xw and xs were similar to other authors in beetroot juice [22]. Furthermore, TP, betacyanins, and betaxanthins content in the beetroot juice were in the same range as another study [36]. The betacyanin and betaxanthin concentration ratio usually ranges from 1 to 3 and depends mainly on beet varieties, as well as on the respective technology of juice or extract production [37]. Here, the betacyanin and betaxanthin concentration ratio was 2.
Table 2 shows the mean values and standard deviation of outlet temperature, product yield, drying ratio, and productivity of powder samples with 3.5 or 7% P spray dried at 125 or 150 °C. As seen, higher P concentrations increased outlet temperatures significantly (p < 0.05). This was also observed in orange powders spray dried with resistant maltodextrin [38]. Product yield decreased significantly (p < 0.05) with P % increase. Other authors showed that maltodextrins, resistant maltodextrin, or gum arabic increased product yield; however, carboxymethyl cellulose decreased product yield [33,38,39,40]. Using a higher concentration of high-molecular-weight solutes reduced stickiness, according to other authors [40]. However, in concordance with Gonzalez et al. [39], 150 °C was the adequate temperature for SD for optimal product yield, because it was significantly higher at 150 °C than at 125 °C (p < 0.05). In contrast, the drying ratio decreased significantly (p < 0.05) when the P % increased, whereas the productivity increased significantly (p < 0.05) when P % increased. However, there were not observed changes in productivity or drying ratio using different spray-dried temperatures. Several authors have reported that an increase in the maltodextrin content results in an increase of the recovery of feed solids in the product [33,41,42].
Mean values and standard deviation of xw, CP, WAI, WSI, ρb, and ε are shown in Table 3. Samples spray dried at higher temperature showed the lowest values of xw. Other authors observed the same trend in grapefruit or lulo [33,43]. However, using 7% or 3.5% P only presented xw changes in powders obtained at 125 °C. Under this condition, beetroot with 7% P was drier than 3.5% (low xw value). The water content of the powdered products is related to its free-flowing behavior and stability during storage, because of its effect on the glass transition and its behavior during crystallization [24]. CP content was higher in powders with 7% P than samples with 3.5%. Nevertheless, slight differences were observed between the 125 or 150 °C SD, with the CP value higher for powder obtained at 150 °C. This is because of lower xw of samples spray dried at 150 °C. The spray-dried samples’ WAI increased significantly when higher P % was used (p < 0.05). However, the powders’ WSI decreased significantly when higher P % was used (p < 0.05). The WAI indicates the immobilized water amount by the samples [44], whereas the WSI is related to the soluble solids amount present in the product as a function of the solubilization of starches, sugars, proteins, fibers, and maltodextrin [45]. Therefore, using a higher level of P increased the amount of water immobilized by the samples and reduce the soluble solids present in the product. The spray-dried temperature effect only was observed in WSI for samples with 7% P, showing lower values at 150 °C. There was a significant (p < 0.05) increase of ε and decrease of ρb because of high P concentration in powders and high spray-dried temperatures. Porosity plays a key role in the agglomerate strength of dried foods [46]. Furthermore, a greater porosity (and lower bulk density) corresponds to a freer-flowing powder with a greater air volume distributed among particles, as well as being more soluble [46,47]. Other studies showed similar results as porosity increases when biopolymers were added [33,39]. When studying each P concentration (3.5 or 7%), there was a significant effect of SD temperature on ρb and ε (p < 0.05). The higher spray-dried temperature caused a lower ρb and higher ε of the powders; also observed but from another author in spray-dried Amaranthus [25].
Figure 1 presents the evolution of hygroscopicity of beetroot powders along 7d. Hygroscopicity is the capacity of a powder to absorb water from the environment; absorbed water influences the storage stability of products. Samples with lower hygroscopicity are easier to handle and package. Samples spray dried at 125 °C continuously and linearly collected water during the assay. However, the samples spray dried at 150 °C captured water more quickly in the first 5 days and then stabilized. At the end of the hygroscopicity study, samples are ordered from low to high hygroscopicity, as 7P150 < 7P125 < 3.5P150 < 3.5P125. According to Moghbeli et al. [48] a lower hygroscopicity could be more positive because of its importance on flowability factor during storage. Hygroscopicity presented significant Pearson’s correlation when related to ρb and ε (p < 0.05). The higher the hygroscopicity, the higher the ρb and the lower the ε, with 0.9799 and –0.9786 correlation values, respectively.
Table 4 shows color coordinates and total color differences of beetroot powders. Using higher P concentrations caused higher L* values and lower b* and h* values in spray-dried samples. SD at higher temperature also caused higher L* values and lower b* and h* values in spray-dried samples. Therefore, 7P150 (higher P % and higher spray-dried temperature) presented the highest L* and the lowest b* and h*. Contrarily, 3.5P125 (lower P % and lower spray-dried temperature) presented the lowest L* and the highest b* and h*. Other authors also observed that adding a carrier agent (maltodextrin, gum arabic, and maltodextrin resistant starch) caused whiter powders because these carrier agents are white [33,38,39]. According to Bodart et al. [49], total color differences are perceptible by the human eye when they are larger than 3. Total color differences for spray-dried samples because of SD temperature (ΔE1) or P % (ΔE2) ranged from 2.5 to 4.2, proximate to 3. Only total color differences between 7P125 and 7P150 were not perceptible, however the remaining total color differences shown in Table 4 are proximate to 3. Total color differences for spray-dried samples with the same P % (3.5 or 7) by temperature effect (ΔE1) showed significant differences if the sample contained 3.5 or 7% P. However, there were significant differences in ΔE2 (p > 0.05). Figure 2 shows the appearance of the studied samples. In concordance with color coordinates (Table 4), 3.5P125 of beetroot juice spray-dried sample was darker than the other samples. 7P125 and 7P150 showed a similar appearance, as it is indicated in low values of ΔE1 (Table 4). Visually, the most different sample of the four studied is 3.5P125.
In Figure 3, spray-dried beetroot juice powders FESEM micrographs are showed. Spray-dried beetroot powder presents an oval or spherical shape with smooth-surfaced particles, typical of SD samples. Other authors showed similar kinds of particles in mangos [50], lychees [51], and oranges [38]. Powdered particles had a continuous wall and no surface cracks. When increasing P % in beetroot juice, powdered particles are smaller with a higher particle density. Furthermore, when increasing spray-dried temperature, powdered particles are also smaller with a higher particle density. This is likely related to more free-flowing powders, because samples with 7% P and spray dried at 150 °C were more porous (Table 3). Similar to Bazaria and Kumar [52], increasing the solids content in the feed to be spray dried leads to a smoother particle surface. From the micrographs, the average powders particle size was between 34 to 94 µm. Mean values of particle size (and standard deviation) of spray-dried samples were 94 (16), 56 (7), 48 (6), and 34 (5) µm for 3.5P125, 3.5P150, 7P125, and 7P150, respectively. Therefore, the effect of increased P % and spray-dried temperature reduced the particle size. These results agree with the findings of Tze et al. [53], studying maltodextrin concentration in spray-dried pitaya fruit powders (effect of solute addition) and with Fang et al. [54], studying the effect of spray-dried temperature on milk protein concentrates.
Mean values of total phenol, betacyanins, betaxanthins content, and AC of beetroot feed and spray-dried samples are showed in Table 5. Total phenol, betacyanins, betaxanthins content, and AC of beetroot spray-dried samples were lower than the beetroot feed for each formulation. However, only values of TP and AC showed significant differences (p < 0.05) among feed sample and spray-dried samples at 125 and 150 °C. Betacyanins and betaxanthins content of feed 3.5P decreased significantly when the sample was spray dried at 150 °C (p < 0.05), but if it was spray dried at 125 °C, betacyanins and betaxanthins content did not show significant differences (p > 0.05). The same behavior was observed for betacyanin content in feed 7P; however, betaxanthins content was stable. Comparing the P %, there were only significant differences between SD3.5P125 and SD7P125 in total phenol and antioxidant activity terms, showing lower values in SD3.5P125. The spray-dried sample with the most content of studied bioactive compounds was 7P125. Moreover, this was reflected in the value of AC of this sample, higher than the rest of the spray-dried samples.
To explain the relationships in the different compounds quantified in this study with the AC and the relationships among them, correlation statistical analyses were performed. The studied bioactive compounds showed a positive Pearson’s correlation coefficient with AC. TP played a key role in the AC of beetroot samples, showing a coefficient of 0.9209 (p < 0.05). This behavior has been observed by other authors in fruit powders [32,43]. Betacyanins and betaxanthins also presented high Pearson correlation coefficients; 0.8549 and 0.8359 (p < 0.05), respectively.
Figure 4 shows bioactive compounds and AC EE % in beetroot spray-dried samples. EE refers to the potential of the wall material to encapsulate or hold the core material inside the microcapsule. EE are also related to the shelf life of the bioactive compounds content and AC in the powder. Among the bioactive compound analyzed, TP showed higher EE %. Comparing EE % with another study that encapsulated beetroot with pumpkin oil cake protein [55], TP EE % were slightly lower. As observed in Figure 4, remarkably, the highest values of EE, for all bioactive compounds and AC, were for 7P125. The higher P % protects bioactive compounds and the lower spray-dried temperature does not degrade them. The 3.5P150 showed a contrary effect, with lower P % and higher spray-dried temperature, and therefore lower values of EE % for all bioactive compounds and AC.
Therefore, 7P125 powder had higher bioactive compound content (Table 5) and, according to its EE %, these bioactive compounds could be more stable.

4. Conclusions

Using pea protein in the SD of beetroot juice shows adequate behavior for the spray-dried process according to the yields obtained and characteristics of the powdered product. Using a higher concentration of pea protein produced beetroot powders with a higher product yield, more porous and luminous, and less hygroscopic. However, using higher level of pea protein increased the amount of water immobilized by the samples and reduced the soluble solids present in the product. Here, using 7% pea protein in the initial mixture with beetroot juice and 125 °C SD temperature is recommended, because it showed the most content of studied bioactive compounds and AC. Moreover, the proposal allows obtaining more stable powders, from a functionality viewpoint, because it presented a higher encapsulate efficiency.

Author Contributions

Conceptualization, M.I., P.G.-S., and J.M.-M.; methodology, M.I.; formal analysis, M.I.; investigation, M.I. and P.G.-S.; resources, P.G.-S.; data curation, M.I. and P.G.-S.; writing—original draft preparation and editing, M.I.; writing—review, P.G.-S. and J.M.-M.; supervision, J.M.-M.; project administration, P.G.-S.; funding acquisition, P.G.-S. and J.M.-M. All authors have read and agreed to the published version of the manuscript.

Funding

This research received no external funding.

Institutional Review Board Statement

Not applicable.

Informed Consent Statement

Not applicable.

Data Availability Statement

The data herein presented are available on request from the corresponding author.

Conflicts of Interest

The authors declare no conflict of interest.

References

  1. Koul, V.K.; Jain, M.P.; Koul, S.; Sharma, V.K.; Tikoo, C.L.; Jain, S.M. Spray drying of beet root juice using different carriers. Indian J. Chem. Technol. 2002, 9, 442–445. [Google Scholar]
  2. Roy, K.; Gullapalli, S.; Chaudhuri, U.R.; Chakraborty, R. The use of a natural colorant based on betalain in the manufacture of sweet products in India. Int. J. Food Sci. Technol. 2004, 39, 1087–1091. [Google Scholar] [CrossRef]
  3. Panghal, A.; Virkar, K.; Kumar, V.; Dhull, S.B.; Gat, Y.; Chhikara, N. Development of Probiotic Beetroot Drink. Curr. Res. Nutr. Food Sci. 2017, 5. [Google Scholar] [CrossRef]
  4. Clifford, T.; Howatson, G.; West, D.J.; Stevenson, E.J. The Potential Benefits of Red Beetroot Supplementation in Health and Disease. Nutrients 2015, 7, 2801–2822. [Google Scholar] [CrossRef]
  5. Singh, B.; Hathan, B.S. Chemical composition, functional properties and processing of Beetroot. Int. J. Sci. Eng. Res. 2014, 5, 679–684. [Google Scholar]
  6. Tesoriere, L.; Allegra, M.; Butera, D.; Livrea, M.A. Absorption, excretion, and distribution of dietary antioxidant betalains in LDLs: Potential health effects of betalains in humans. Am. J. Clin. Nutr. 2004, 80, 941–945. [Google Scholar] [CrossRef] [Green Version]
  7. Delgado-Vargas, F.; Jiménez, A.R.; Paredes-López, O. Natural Pigments: Carotenoids, Anthocyanins, and Betalains—Characteristics, Biosynthesis, Processing, and Stability. Crit. Rev. Food Sci. Nutr. 2000, 40, 173–289. [Google Scholar] [CrossRef]
  8. Champagne, C.P.; Fustier, P. Microencapsulation for the improved delivery of bioactive compounds into foods. Curr. Opin. Biotechnol. 2007, 18, 184–190. [Google Scholar] [CrossRef]
  9. Thies, C. A survey of microencapsulation processes. In Microencapsulation: Methods and Industrial Applications; Benita, S., Ed.; Marcel Dekker Inc.: New York, NY, USA, 1996; pp. 133–154. [Google Scholar]
  10. Shahidi, F.; Han, X.-Q. Encapsulation of food ingredients. Crit. Rev. Food Sci. Nutr. 1993, 33, 501–547. [Google Scholar] [CrossRef]
  11. Rodríguez-Hernández, G.R.; González-García, R.; Grajales-Lagunes, A.; Ruiz-Cabrera, M.A.; Abud-Archila, M. Spray-Drying of Cactus Pear Juice (Opuntia streptacantha): Effect on the Physicochemical Properties of Powder and Reconstituted Product. Dry. Technol. 2005, 23, 955–973. [Google Scholar] [CrossRef]
  12. Bogracheva, T.Y.; Davydova, N.I.; Bespalova, N.Y.; Kondrashina, S.A.; Bezrukov, M.G.; Braudo, E.E.; Tolstoguzov, V.B. A study of stability of O/W emulsions stabilized by soybean and pea globulins. Food/Nahrung 1994, 38, 121–127. [Google Scholar] [CrossRef]
  13. Ducel, V.; Richard, J.; Popineau, Y.; Boury, F. Adsorption Kinetics and Rheological Interfacial Properties of Plant Proteins at the Oil−Water Interface. Biomacromolecules 2004, 5, 2088–2093. [Google Scholar] [CrossRef]
  14. Franco, J.M.; Partal, P.; Conde, B.; Gallegos, C. Influence of pH and protei thermal treatment on the rheology of pea protein-stabilized oil-in-water emulsions. J. Am. Oil Chem. Soc. 2000, 77, 975–984. [Google Scholar] [CrossRef]
  15. Galazka, V.B.; Dickinson, E.; Ledward, D.A. Emulsifying behaviour of 11S globulin Vicia faba in mixtures with sulphated polysaccharides: Comparison of thermal and high-pressure treatments. Food Hydrocoll. 1999, 13, 425–435. [Google Scholar] [CrossRef]
  16. Viroben, G.; Barbot, J.; Mouloungui, Z.; Guéguen, J. Preparation and characterization of films from pea protein. J. Agric. Food Chem. 2000, 48, 1064–1069. [Google Scholar] [CrossRef]
  17. O’Kane, F.E.; Happe, R.P.; Vereijken, J.M.; Gruppen, H.; Van Boekel, M.A.J.S. Characterization of Pea Vicilin. 2. Consequences of Compositional Heterogeneity on Heat-Induced Gelation Behavior. J. Agric. Food Chem. 2004, 52, 3149–3154. [Google Scholar] [CrossRef]
  18. Martins, V.B.; Netto, F.M. Physicochemical and functional properties of soy protein isolate as a function of water activity and storage. Food Res. Int. 2006, 39, 145–153. [Google Scholar] [CrossRef]
  19. Swanson, B.G. Pea and lentil protein extraction and functionality. J. Am. Oil Chem. Soc. 1990, 67, 276–280. [Google Scholar] [CrossRef]
  20. Ge, J.; Sun, C.X.; Corke, H.; Gul, K.; Gan, R.Y.; Fang, Y. The health benefits, functional properties, modifications, and applications of pea (Pisum sativum L.) protein: Current status, challenges, and perspectives. Compr. Rev. Food Sci. Food Saf. 2020, 19, 1835–1876. [Google Scholar] [CrossRef]
  21. Jarzębski, M.; Fathordoobady, F.; Guo, Y.; Xu, M.; Singh, A.; Kitts, D.D.; Kowalczewski, P.Ł.; Jeżowski, P.; Singh, A.P. Pea Protein for Hempseed Oil Nanoemulsion Stabilization. Molecules 2019, 24, 4288. [Google Scholar] [CrossRef] [Green Version]
  22. Janiszewska, E. Microencapsulated beetroot juice as a potential source of betalain. Powder Technol. 2014, 264, 190–196. [Google Scholar] [CrossRef]
  23. Šaponjac, V.T.; Čanadanović-Brunet, J.; Ćetković, G.; Jakišić, M.; Djilas, S.; Vulić, J.; Stajčić, S. Encapsulation of Beetroot Pomace Extract: RSM Optimization, Storage and Gastrointestinal Stability. Molecules 2016, 21, 584. [Google Scholar] [CrossRef]
  24. Vardin, H.; Yasar, M. Optimisation of pomegranate (Punica Granatum L.) juice spray-drying as affected by temperature and maltodextrin content. Int. J. Food Sci. Technol. 2012, 47, 167–176. [Google Scholar] [CrossRef]
  25. Cai, Y.Z.; Corke, H. Production and Properties of Spray-dried Amaranthus Betacyanin Pigments. J. Food Sci. 2000, 65, 1248–1252. [Google Scholar] [CrossRef]
  26. AOAC Association of Official Analytical Chemist. Volume I, Agricultural Chemicals, Contaminants, Drugs; Horwitz, W., Ed.; AOAC: Rockville, MD, USA, 2000. [Google Scholar]
  27. AOAC. AOAC Official Method 990.03. Protein (Crude) in Animal Feed, Combustion Method, 18th ed.; Horwitz, W., Latimer, G.W., Jr., Eds.; AOAC: Gaithersburg, MD, USA, 2002. [Google Scholar]
  28. Mariotti, F.; Tomé, D.; Mirand, P.P. Converting Nitrogen into Protein—Beyond 6.25 and Jones’ Factors. Crit. Rev. Food Sci. Nutr. 2008, 48, 177–184. [Google Scholar] [CrossRef]
  29. Igual, M.; Cebadera, L.; Cámara, R.M.; Agudelo, C.; Martínez-Navarrete, N.; Cámara, M. Novel ingredients based on grapefruit freeze-dried formulations: Nutritional and bioactive value. Foods 2019, 8, 506. [Google Scholar] [CrossRef] [Green Version]
  30. Singh, N.; Smith, A.C. A comparison of wheat starch, whole wheat meal and oat flour in the extrusion cooking process. J. Food Eng. 1997, 34, 15–32. [Google Scholar] [CrossRef]
  31. CIE. Colorimetry, 2nd ed.; Publication CIE No. 15.2; Commission Internationale de l’Eclairage: Vienna, Austria, 1986. [Google Scholar]
  32. Igual, M.; García-Martínez, E.; Camacho, M.M.; Martínez-Navarrete, N. Stability of micronutrients and phytochemicals of grapefruit jam as affected by the obtention process. Food Sci. Technol. Int. 2016, 22, 203–212. [Google Scholar] [CrossRef]
  33. Agudelo, C.; Igual, M.; Camacho, M.M.; Martínez-Navarrete, N. Effect of process technology on the nutritional, functional, and physical quality of grapefruit powder. Food Sci. Technol. Int. 2017, 23, 61–74. [Google Scholar] [CrossRef] [Green Version]
  34. Nilsson, T. Studies into the pigments in beetroot (Beta vulgaris L. ssp vulgaris var. rubra L.). Lantbrukshogskolans Annaler 1970, 36, 179–219. [Google Scholar]
  35. Idham, Z.; Muhamad, I.I.; Sarmidi, M.R. Degradation kinetics and color stability of spray-dried encapsulated anthocyanins from Hibiscus sabdariffa l. J. Food Process. Eng. 2012, 35, 522–542. [Google Scholar] [CrossRef]
  36. Chhikara, N.; Kushwaha, K.; Sharma, P.; Gat, Y.; Panghal, A. Bioactive compounds of beetroot and utilization in food processing industry: A critical review. Food Chem. 2019, 272, 192–200. [Google Scholar] [CrossRef]
  37. Marmion, D.M. Handbook of US Colorants: Foods, Drugs, Cosmetics, and Medical Devices; John Wiley & Sons: New York, NY, USA, 1991. [Google Scholar]
  38. Igual, M.; García-Segovia, P.; Martínez-Monzó, J. Resistant maltodextrin’s effect on the physicochemical and structure properties of spray dried orange juice powders. Eur. Food Res. Technol. 2021, 247, 1125–1132. [Google Scholar] [CrossRef]
  39. González, F.; Igual, M.; Camacho, M.M.; Martínez-Navarrete, N. Impact of Temperature, Gum Arabic and Carboxymethyl Cellulose on Some Physical Properties of Spray-Dried Grapefruit. Int. J. Food Eng. 2018, 14. [Google Scholar] [CrossRef]
  40. Bhandari, B.R.; Datta, N.; Howes, T. Problems Associated with Spray Drying of Sugar-Rich Foods. Dry. Technol. 1997, 15, 671–684. [Google Scholar] [CrossRef]
  41. Papadakis, S.E.; Gardeli, C.; Tzia, C. Spray Drying of Raisin Juice Concentrate. Dry. Technol. 2006, 24, 173–180. [Google Scholar] [CrossRef]
  42. Roustapour, O.R.; Hosseinalipour, M.; Ghobadian, B. An Experimental Investigation of Lime Juice Drying in a Pilot Plant Spray Dryer. Dry. Technol. 2006, 24, 181–188. [Google Scholar] [CrossRef]
  43. Igual, M.; Ramires, S.; Mosquera, L.H.; Martínez-Navarrete, N. Optimization of spray drying conditions for lulo (Solanum quitoense L.) pulp. Powder Technol. 2014, 256, 233–238. [Google Scholar] [CrossRef]
  44. Mezreb, K.; Goullieux, A.; Ralainirina, R.; Queneudec, M. Application of image analysis to measure screw speed influence on physical properties of corn and wheat extrudates. J. Food Eng. 2003, 57, 145–152. [Google Scholar] [CrossRef]
  45. Augusto-Ruiz, W.; Bonato, S.; Arrieche, L.; Risso, F. Characterization of pregelatinized whole rice flour produced from broken rice grains. Rev. Ciênc. Exatas Eng. 2003, 13, 25–46. [Google Scholar]
  46. Rahman, M.S. Toward prediction of porosity in foods during drying: A brief review. Dry. Technol. 2001, 19, 1–13. [Google Scholar] [CrossRef]
  47. Fazaeli, M.; Emam-Djomeh, Z.; Ashtari, A.K.; Omid, M. Effect of spray drying conditions and feed composition on the physical properties of black mulberry juice powder. Food Bioprod. Process. 2012, 90, 667–675. [Google Scholar] [CrossRef]
  48. Moghbeli, S.; Jafari, S.M.; Maghsoudlou, Y.; Dehnad, D. A Taguchi approach optimization of date powder production by spray drying with the aid of whey protein-pectin complexes. Powder Technol. 2020, 359, 85–93. [Google Scholar] [CrossRef]
  49. Bodart, M.; De Peñaranda, R.; Deneyer, A.; Flamant, G. Photometry and colorimetry characterisation of materials in daylighting evaluation tools. Build. Environ. 2008, 43, 2046–2058. [Google Scholar] [CrossRef]
  50. Caparino, O.A.; Tang, J.; Nindo, C.I.; Sablani, S.S.; Powers, J.R.; Fellman, J.K. Effect of drying methods on the physical properties and microstructures of mango (Philippine ‘Carabao’ var.) powder. J. Food Eng. 2012, 111, 135–148. [Google Scholar] [CrossRef]
  51. Kingwatee, N.; Apichartsrangkoon, A.; Chaikham, P.; Worametrachanon, S.; Techarung, J.; Pankasemsuk, T. Spray drying Lactobacillus casei 01 in lychee juice varied carrier materials. LWT 2015, 62, 847–853. [Google Scholar] [CrossRef]
  52. Bazaria, B.; Kumar, P. Optimization of spray drying parameters for beetroot juice powder using response surface methodology (RSM). J. Saudi Soc. Agric. Sci. 2018, 17, 408–415. [Google Scholar] [CrossRef] [Green Version]
  53. Tze, N.L.; Han, C.P.; Yusof, Y.A.; Ling, C.N.; Talib, R.A.; Taip, F.S.; Aziz, M.G. Physicochemical and nutritional properties of spray-dried pitaya fruit powder as natural colorant. Food Sci. Biotechnol. 2012, 21, 675–682. [Google Scholar] [CrossRef]
  54. Fang, Y.; Rogers, S.; Selomulya, C.; Chen, X.D. Functionality of milk protein concentrate: Effect of spray drying temperature. Biochem. Eng. J. 2012, 62, 101–105. [Google Scholar] [CrossRef]
  55. Čakarević, J.; Šeregelj, V.; Šaponjac, V.T.; Ćetković, G.; Brunet, J.Č.; Popović, S.; Kostić, M.H.; Popović, L. Encapsulation of beetroot juice: A study on the application of pumpkin oil cake protein as new carrier agent. J. Microencapsul. 2020, 37, 121–133. [Google Scholar] [CrossRef]
Figure 1. Evolution of hygroscopicity of each powder sample along assay time: 3.5P125 or 3.5P150, powder with 3.5% of pea protein concentration spray dried at 125 or 150 °C, respectively; 7P125 or 7P150 powder with 7% of pea protein concentration spray dried at 125 or 150 °C, respectively.
Applsci 11 06658 g001
Figure 2. Appearance of studied beetroot powder samples: 3.5P125 or 3.5P150, powder with 3.5% of pea protein concentration spray dried at 125 or 150 °C, respectively; 7P125 or 7P150 powder with 7% of pea protein concentration spray dried at 125 or 150 °C, respectively.
Applsci 11 06658 g002
Figure 3. FESEM micrographs of studied samples: 3.5P125 or 3.5P150, powder with 3.5% of pea protein concentration spray dried at 125 or 150 °C, respectively; 7P125 or 7P150 powder with 7% of pea protein concentration spray dried at 125 or 150 °C, respectively.
Applsci 11 06658 g003
Figure 4. Mean values and standard deviation of encapsulation efficiencies percentage in beetroot spray-dried samples for analyzed bioactive compounds. Letters indicate homogeneous groups established by the ANOVA (p < 0.05) for each bioactive compound or antioxidant capacity: 3.5P125 or 3.5P150, powder with 3.5% of pea protein concentration spray dried at 125 or 150 °C, respectively; 7P125 or 7P150 powder with 7% of pea protein concentration spray dried at 125 or 150 °C, respectively.
Applsci 11 06658 g004
Table 1. Mean value (and standard deviation) of water (xw), soluble solids (xs), total phenol, betacyanins, betaxanthins content, and antioxidant capacity of beetroot juice.
ParameterBeetroot Juice
xw (g/100 g)88.40 (0.03)
xs (g/100 g)12.2 (0.2)
Total phenols (mgGA/100 g)118 (3)
Betacyanins (mgBE/100 g)133 (2)
Betaxanthins (mgVE/100 g)64.7 (0.8)
Antioxidant Capacity (mgTE/100 g)38.4 (0.9)
Table 2. Outlet temperature, product yield, drying ratio, and productivity mean values (and standard deviation) of spray-dried powders.
Parameter3.5P1253.5P1507P1257P150
Outlet temperature (°C)74.2 (0.8) d86.5 (0.5) b77.8 (0.8) c92.8 (2.1) a
Product yield
(g solutes in the powder/100 g solutes in the mixture)
31.86 (0.02) c41.5 (1.8) a28.2 (0.7) d36.6 (0.8) b
Drying ratio8.8 (0.2) a8.95 (0.19) a6.48 (0.09) b6.56 (0.09) b
Productivity (g/h)67.1 (0.9) b66.5 (0.9) b84.1 (1.7) a83.7 (1.4) a
Letters indicate homogeneous groups established by the ANOVA (p < 0.05) within rows: 3.5P125 or 3.5P150, powder with 3.5% of pea protein concentration spray dried at 125 or 150 °C, respectively; 7P125 or 7P150 powder with 7% of pea protein concentration spray dried at 125 or 150 °C, respectively.
Table 3. Mean values (and standard deviation) of water (xw), crude protein (CP) content, water absorption (WAI), water solubility (WSI) index, bulk density (ρb), and porosity (ε) of beetroot spray-dried powders.
Parameter3.5P1253.5P1507P1257P150
xw (gw/g)0.0492 (0.0013) a0.0331 (0.0009) c0.0448 (0.0013) b0.0321 (0.0002) c
CP (gCP/g)20.380 (0.006) d21.79 (0.07) c26.70 (0.05) b27.65 (0.12) a
WAI0.49 (0.09) b0.53 (0.03) b0.70 (0.05) a0.824 (0.013) a
WSI (%)17.4 (0.9) a17.90 (0.03) a15.1 (0.2) b12.4 (0.7) c
ρb (g/cm3)0.5675 (0.0007) a0.44 (0.02) b0.417 (0.012) b0.363 (0.013) c
ε0.6143 (0.0006) d0.703 (0.008) c0.718 (0.006) b0.754 (0.006) a
Letters indicate homogeneous groups established by the ANOVA (p < 0.05) within rows: 3.5P125 or 3.5P150, powder with 3.5% of pea protein concentration spray dried at 125 or 150 °C, respectively; 7P125 or 7P150 powder with 7% of pea protein concentration spray dried at 125 or 150 °C, respectively.
Table 4. Mean values (and standard deviations) of color coordinates (L*, a*, b*, C*, and h*) and total color differences (ΔE1 and ΔE2) of beetroot powders.
3.5P1253.5P1507P1257P150
L*23.1 (0.3) d25.91 (0.13) c26.8 (0.6) b28.5 (1.3) a
a*34.66 (0.09) c36.80 (0.04) a36.1 (0.4) b35.7 (0.7) b
b*2.73 (0.12) a1.99 (0.03) b1.52 (0.04) c0.88 (0.12) d
C*34.765 (1.04) c36.85 (0.04) a36.2 (0.4) b35.8 (0.7) b
h*4.5 (0.2) a3.10 (0.04) b2.40 (0.05) c1.4 (0.2) d
ΔE1 3.61 (0.08) a 2.5 (0.6) b
ΔE2 4.2 (0.6) a3.6 (0.5) a
The same letter in superscript within a row indicates homogeneous groups established by ANOVA (p < 0.05). L*(lightness), a* (red/green coordinate), b* (yellow/blue coordinate), C* (chroma), and h* (tone); ΔE1 (total color difference between samples with the same P concentration and different spray-dried temperature) and ΔE2 (total color difference between samples with the same spray-dried temperature and different P concentration); 3.5P125 or 3.5P150, powder with 3.5% of pea protein concentration spray dried at 125 or 150 °C, respectively; 7P125 or 7P150 powder with 7% of pea protein concentration spray dried at 125 or 150 °C, respectively.
Table 5. Mean value (and standard deviation) of total phenol, betacyanins, betaxanthins content, and antioxidant capacity of beetroot feed and spray-dried (SD) samples in mg/100 g of beetroot solids (BS).
SampleTotal Phenol
(mgGA/100 gBS)
Betacyanin (mgBE/100 gBS)Betaxanthin (mgVE/100 gBS)Antioxidant Capacity
(mgTE/100 gBS)
Feed 3.5P935 (5) aA1015 (17) aA525 (7) aA314 (6) aA
SD3.5P125771 (25) bB941 (42) abA480 (21) abA235 (9) bB
3.5P150644 (40) cA845 (57) bA433 (26) bA213 (4) cA
Feed 7P939 (4) aA1041 (14) aA525 (5) aA304 (11) aA
SD7P125896 (14) bA981 (54) abA506 (26) aA263.41 (0.08) bA
7P150737 (28) cA905 (42) bA474 (26) aA223 (4) cA
For each bioactive compound, the same small letter in superscript within a column indicates homogeneous groups established by ANOVA (p < 0.05) comparing process and temperature (feed, SD125, and SD150) in samples with 3.5% of pea protein. For each bioactive compound, the same capital letter in superscript within a column indicates homogeneous groups established by ANOVA (p < 0.05) comparing pea protein percentage (3.5 and 7) in samples with the same process and temperature (feed, SD125, and SD150): 3.5P125 or 3.5P150, powder with 3.5% of pea protein concentration spray dried at 125 or 150 °C, respectively; 7P125 or 7P150 powder with 7% of pea protein concentration spray dried at 125 or 150 °C, respectively.
Publisher’s Note: MDPI stays neutral with regard to jurisdictional claims in published maps and institutional affiliations.

