Abstract
Air-assisted rice seeders were designed to perform sowing while ensuring the alignment and depth of seeds within the allowable standard range of 5–10 mm. Their performance varies on the basis of different specifications; thus, it is necessary to evaluate them to select the best one. Fuzzy set theory allows us to flexibly handle practical problems, especially applied problems in engineering. In this paper, a new similarity measure using fuzzy sets is proposed, and its advantages were tested using the technique for order preference by similarity to ideal solution (TOPSIS) method to select technical parameters for the sowing machines. The experiments allowed identifying the best results. The correlations between input attributes and decision variables were determined on the basis of their correlation coefficients with technical factors. The influence of technical factors on output results was also examined to determine the technical factors providing superior product quality.
1. Introduction
Rice direct seeding is used in paddy cultivation due to its low labor requirements and reduced production cost [,]. Air-assisted direct seeding machines were studied by Chosa et al. [], Loan et al. [], and Furuhata et al. [], showing many advantages and promising working efficiency. These machines can operate across 32 rows powered by a tractor power take-off PTO. The hardness of the soil surface is a factor affecting the depth of sowing. The accuracy of sowing is controlled by a float installed to increase the area of ground–surface contact. A series of seeding machines, such as those of Iseki, Kubota, and Yanmar, have been marketed to meet the needs of sowing seeds in flooded paddy fields. These sowing machines can sow 6–8 rows at the same time in clusters [].
The Tokyo University of Agriculture and Technology collaborated with the Vietnam National University of Agriculture to develop an air-assisted rice seeder for flooded paddy fields in Vietnam (Figure 1). This machine can sow 24 rows with an interval spacing of 20–25 cm. The experimental results showed that the seeding depth and seeding area precision were affected by the air-assisted velocity, internal diameter of the injection port, and distance between the injection port and soil surface. Seeding accuracy is one of the most important factors affecting the growth of paddy sprouts. In this study, a similarity measure using fuzzy sets was used to select the optimal plan for the sowing machines.
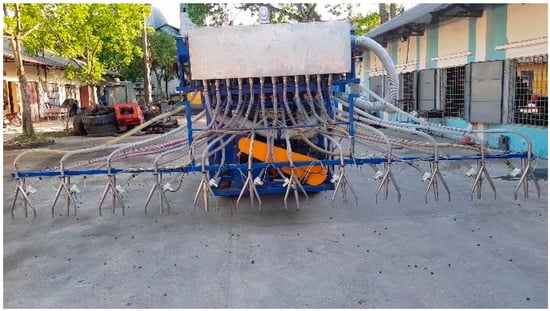
Figure 1.
Image of an air-assisted rice seeder.
Fuzzy logic was first introduced by Zadel in 1965 []. Fuzzy set theory allows researchers to flexibly handle practical problems, especially applied problems in engineering [,]. For example, the fuzzy multi-criteria decision-making (MCDM) method was used to select machines [], as well as evaluate reconfigurable machines [].
In seeding machines, research studies have shown that the seeding depth allows ranges from 3–15 mm, preferably 5–10 mm for Vietnam rice variables, which is a prerequisite for seeds to thrive after sowing []. Trapezoidal fuzzy sets are considered the best option for the chosen situation, i.e., to select the optimal plan for sowing machines.
The contributions of this study are as follows: (1) a new similarity measure using fuzzy sets is proposed; (2) this measure is compared with existing similarity measures; (3) the TOPSIS method using the new measure is applied to evaluate the best scenario with respect to specifications of the sowing machine; (4) analysis of the obtained results led to a determination of the correlation coefficient between factors and decision variables in MCDM to interpret/evaluate the identified specifications.
The rest of this paper is organized as follows: Section 2 presents the problem to be solved, i.e., an estimation of the impact of technical parameters on the sowing machine. In this section, some important concepts regarding fuzzy sets and similarity measures of fuzzy sets are reviewed. Furthermore, the new similarity measures are proposed and compared with others from the literature. The TOPSIS model based on our proposed similarity measures is also introduced. In Section 3, the TOPSIS model is applied to evaluate the best scenario with respect to specifications of the sowing machine, and the results are presented. The results are discussed in Section 4, while Section 5 concludes the paper.
2. Materials and Methods
2.1. Sowing Machine Problem
In a sowing machine, the seeding depth and seeding area precision are affected by the air-assisted velocity, internal diameter of the injection port, and distance between the injection port and soil surface. Thus, there is a need to determine the parameters leading to optimal seeding accuracy in terms of a seeding depth of 3–15 mm (preferably 5–10 mm) and a seeding area precision within a diameter of 0–100 mm (preferably 50 mm).
Twenty-five experiments (E) were carried out on seeding machines to examine three variables: air-assisted velocity, internal diameter of the injection port, and distance between the injection port and soil surface (mm). The experimental results are given in Table 1. The expected outcome of this investigation was to determine the best output, suitable in terms of both the technical requirements and the agronomical requirements of rice seeds after sowing.

Table 1.
Results of research on seeding accuracy.
The assessment of influential factors was considered using an MCDM approach to analyze their correlations with the efficiency of sowing machines.
The considered attribute values are expected to satisfy both technical requirements and practical requirements. For example, the seeding depth (C7) allows a range of 3–15 mm (preferably 5–10 mm). This is a prerequisite for adequate seed growth and alignment after sowing. Thus, seeding area precision should primarily fall within a diameter of 50 mm (C4) (user requirement of 75% or more). No more than 5% of seeds should fall into the C5 or C6 regions. C4 can be considered a benefit criterion, whereas C5 and C6 can be considered damage (or cost) criteria. C1, C3, and C7 were not identified as benefit or cost criteria. In the case of C7, too shallow a depth would not meet the agronomic requirements, whereas too great a depth would lead to seed death, according to its biological characteristics.
Accordingly, we used fuzzy set theory to convert the original problem into a fuzzy MCDM problem taking into account the above requirements, whereby all criteria could be considered as the same type (i.e., as benefit criteria).
2.2. Fuzzy Sets and Similarity Measures
In this subsection, the concepts of fuzzy sets, as well as their operators and similarity measures, are reviewed.
In this paper, it is assumed that is the universal set.
Definition 1
([]). A fuzzy set on the universal set takes the form
where is the membership function of the fuzzy set , and is the degree membership of the element in for all .
For two given fuzzy sets, and on the universal set , their operators are as follows:
- +
- Subset: if for all ,
- +
- Equal: if for all ,
- +
- Intersection: ,
- +
- Union: ,
- +
- Complement: ,
- +
- For all real numbers .
denotes a collection of all fuzzy sets on .
Definition 2
([]). Let be two fuzzy sets on the universal set. A similarity measure of is the function , which satisfies the following conditions:
- (S1)
- for all ,
- (S2)
- for all ,
- (S3)
- if for all ,
- (S4)
- For all , , , if , then .
2.2.1. New Similarity Measure for Fuzzy Sets
Let be a universal set. In this section, for all , the similarity measure in Equation (2) can be considered.
Definition 3.
For all , the real function is defined as follows:
Proof.
We consider the real function , , to yield for all . Thus, . This implies that for all . Accordingly, satisfies condition (S1).
It is easy to see that satisfies conditions (S2) and (S3) in Definition 2.
In the case of condition (S4), the real function monotonically decreases for all . Thus, for all . Now, assume that (, , . Consider for all , such that for all . This implies that for all . Accordingly, , for all cases of , , that satisfy . In the same way, we obtain for all cases of , , that satisfy . Hence, for all , , , if , then . □
2.2.2. Comparison to Other Similarity Measures for Fuzzy Sets
To demonstrate the effectiveness of the newly proposed measure, we compare it with some existing measures through application to pattern recognition problems. First, we review some existing similarity measures for fuzzy sets.
Mondal et al. proposed the following in 2006 []:
Pappis and Karacapilidis proposed the following in 1993 []:
Raha et al. proposed the following in 2002 []:
Wang proposed the following in 1997 []:
Lee-Kwang et al. proposed the following in 1994 []:
Pal et al. proposed the following in 2014 []:
In pattern recognition problems, the similarity measures are used to classify the sample into a class of given patterns . Given a set of m patterns , where is a fuzzy set on the universal set , a new sample also belongs to a fuzzy set on the universal set .
Question: What class does belong to?
To solve this problem, it is possible to use the similarity measures according to the two steps in Algorithm 1.
| Algorithm 1 Solving pattern recognition problems using similarity measures. |
| Step 1. Calculate all similarity measures from sample to patterns for all . Step 2. Classify sample into pattern with . |
Below, we consider two examples to compare the similarity measures.
Example 1.
Given a set of three patterns,() is a fuzzy set on the universal set:,, and.
New samplealso belongs to a fuzzy set on the universal set.
Question: What class does belong to?
Result: Using Algorithm 1, the results shown in Table 2 can be obtained. In this case, it can be seen that our proposed similarity measure (Equation (2)), as well as 10 other similarity measures, assigned sample to pattern . On the other hand, three measures (Equations (7), (9) and (13)) assigned sample to pattern , whereas Equation (15) assigned sample to pattern . Lastly, measure (Equation (6)) failed to classify sample .
Table 2.
Classification results for Example 1.
In Example 1, we can see that several measures were feasible, with most assigning sample to pattern . In Example 2, several measures failed to classify sample B, whereas the majority (including the proposed measure) assigned sample to pattern .
Example 2.
Given a set of three patterns , () is a fuzzy set on the universal set : , , and .
New sample also belongs to a fuzzy set on the universal set .
Question: What class does belong to?
Result: Using Algorithm 1, the results shown in Table 3 can be obtained. In this case, it can be seen that the measures (Equation (7)), (Equation (9)), (Equation (13)), and (Equation (15)) failed to classify sample . However, the proposed similarity measure (Equation (2)), as well as eleven other similarity measures, assigned sample to pattern .
Table 3.
Classification results for Example 2.
Examples 1 and 2 demonstrate the feasibility of our proposed similarity measure through application to classification problems. It was able to match or surpass the performance of the other measures identified in the literature when applied to recognition problems (Examples 1 and 2).
2.3. Fuzzy Similarity-Based MCDM
The MCDM problem involves selecting the optimal option from a set of alternatives, , according to criteria , in which , for all The relationship between alternatives and criteria can be represented in the form of a fuzzy decision matrix.
Next, TOPSIS was applied using the new similarity measure to solve this MCDM problem, as described in Algorithm 2.
| Algorithm 2 The fuzzy similarity-based TOPSIS model |
| Step 1: Normalize the data table according to each criterion to obtain a fuzzy decision matrix. Step 2: Determine weight of each criterion. Step 3: Define the best option and worst option . Step 4: Use Equation (2) to compute the similarity measures and for each alternative to identify and , respectively. Step 5. Determine the close coefficient , whereby can be considered the decision set of alternatives. Step 6. Rank if for all |
2.4. Correlation Coefficient
To evaluate the strength of two independent variables, the correlation coefficient plays an important role in statistical analysis. Suppose that and are two independent observations; then, the correlation coefficient of variables and is expressed as follows:
where , , and . If , then variables increase (decrease) simultaneously in the same direction. If , then variables increase (decrease) simultaneously in the opposite direction.
3. Results
Algorithm 2 was applied to solve the sowing machine problem, so as to select the parameters yielding the optimal seeding accuracy of the air-assisted rice seeder.
Step 1: The data table was normalized according to each criterion to obtain a fuzzy decision matrix.
- +
- Air-assisted velocity
- +
- Internal diameter of injection port
- +
- Distant between injection port and soil surface
- +
- Seeding area precision (diameter 50 mm)
- +
- Seeding area precision (diameter 100 mm)
- +
- Seeding area precision (diameter 150 mm)
- +
- Seeding depth
Then, the normalized data shown in Table A1 (Appendix A) were obtained.
Step 2. The weight vector w = (0.025, 0.025, 0.025, 0.2, 0.025, 0.6) was chosen. Due to the requirements of the problem, the weight determined in the criterion of seeding depth was greatest to meet the criterion of accuracy within 50 mm.
Step 4. Equation (2) was used to compute the similarity measures and for each alternative to identify and , respectively. The results are shown in Table A2 (Appendix B).
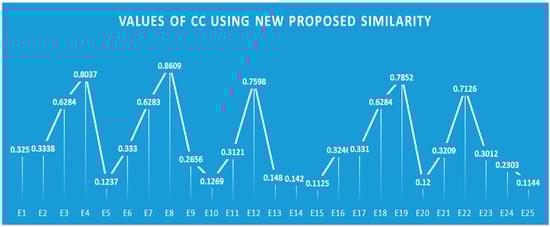
Figure 2.
Values of CC using newly proposed similarity measure.
Step 6. Accordingly, the top five results could be ranked as .
4. Discussion
To further validate the results, the results were compared with other methods, namely, the Hamming distance measure (Figure 3), the Euclidean distance measure (Figure 4), and the fuzzy simple additional weighting (fuzzy SAW) method [] (Figure 5). It was shown that the Hamming distance method and fuzzy SAW ranked the top five results identically to our proposed method (). On the other hand, the Euclidean distance measure ranked them slightly differently (). However, experiments E12 and E22 led to poor results, whereby E12 had 6% dispersion outside the 150 mm diameter, while the seed depth in experiment E22 exceeded the standard threshold of 5–10 mm, which would cause the seeds to rot. Therefore, in terms of practical application techniques, the top three results were E8, E4, and E19. The specifications and outputs of these options are shown in Table 4.
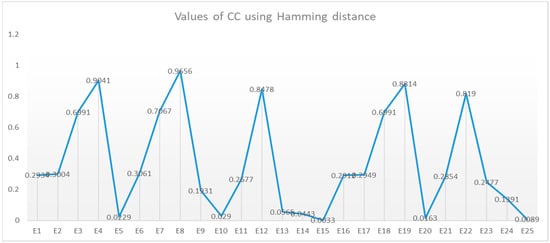
Figure 3.
Values of CC using Hamming distance.
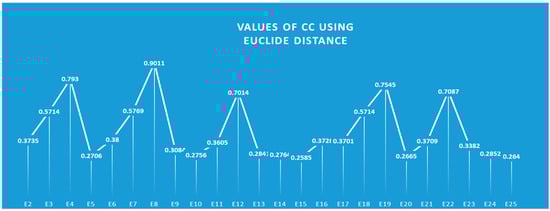
Figure 4.
Values of CC using Euclidean distance.
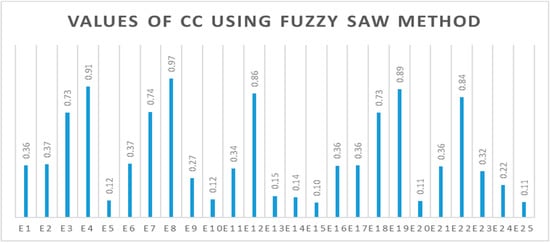
Figure 5.
Values of CC using fuzzy SAW method.
Table 4.
Selection results with respect to optimal seeding accuracy.
As can be seen in Table 4, when comparing seeding depth, the top four choices all met the agronomic requirements, whereas option 5 exceeded the optimal range. The seeding area precision of option 5 was highest; however, the seed depth in this case could lead to rotting paddy sprouts, thereby decreasing the germination rate. Therefore, option 5 is not recommended. On the other hand, option 1 presented the best seeding area precision at a diameter of 50 mm among the options with appropriate seeding depth.
The distance between the injection port and soil surface is also an influential factor. Too great a distance would lead to the seeding accuracy being easily affected by wind during sowing, whereas too small a distance would affect the working mode of the machine in the case of uneven fields.
The above analysis validates the selection order identified using Algorithm 2. The chosen weight vectors were varied to further confirm the above conclusion.
The correlation of each variable with the CC decision variable was also determined, corresponding to the above weight vectors, to determine their significance (i.e., hstqi denotes the correlation coefficient corresponding to weight wi (i = 1, 2, 3, 4, 5, and 6)) (See Table 5). This allows determining the factors contributing to product quality. It can be seen that, if the weight of the variable “seeding depth” is lower than 50%, the correlation coefficient of this variable becomes significantly worse; otherwise, its correlation coefficient exceeds 90% (see Figure 6 and Table 6). This is completely consistent with the actual requirements of the sowing machine applied in agriculture. The correlation coefficients of C1 and C3 were higher than those of C2, indicating their greater influence on the final result.
Table 5.
The top five results with differences in weight vectors.
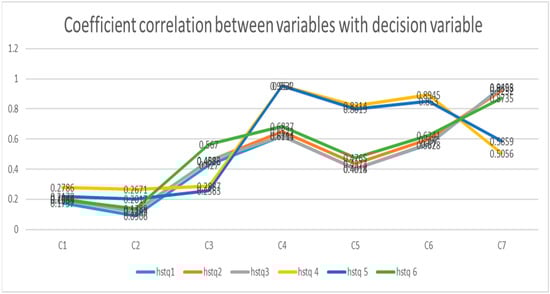
Figure 6.
Correlation coefficients between variables and the CC decision variable.
Table 6.
Correlation coefficients between variables and the CC decision variable.
5. Conclusions
In this paper, a new similarity measure using fuzzy sets was proposed. It was proven to be superior to some existing metrics through numerical examples. Then, a TOPSIS model was constructed using this newly proposed measure to solve a multi-criteria decision-making problem, i.e., to evaluate the quality of a sowing machine’s specifications. The results obtained using the new measure and those obtained using classical measures were also compared. In the future, intuitionistic fuzzy sets [] will be used to evaluate the quality of technical parameters. Furthermore, the results will be put into practice to evaluate sowing machine quality.
Author Contributions
Conceptualization, N.T.H., T.C. and S.T.; methodology, N.T.H., T.C. and S.T.; software, N.T.H. and N.T.-H.; validation, T.C. and S.T.; formal analysis, N.T.-H.; investigation, N.T.H. and N.T.-H.; resources, N.T.H. and N.T.-H.; data curation, N.T.H. and N.T.-H.; writing—original draft preparation, N.T.H.; writing—review and editing, T.C. and S.T.; visualization, N.T.-H.; supervision, T.C.; project administration, S.T.; funding acquisition, N.T.H. All authors have read and agreed to the published version of the manuscript.
Funding
This research received no external funding.
Institutional Review Board Statement
Not applicable.
Informed Consent Statement
Not applicable.
Data Availability Statement
The data presented in this study are available on request from the corresponding author.
Acknowledgments
We would like to thank the Ministry of Science and Technology of Vietnam, the Vietnam National University of Agriculture, and the Tokyo University of Agriculture and Technology for support.
Conflicts of Interest
The authors declare no conflict of interest.
Appendix A
Table A1.
The fuzzy decision matrix, highlighting the best option and the worst option.
Table A1.
The fuzzy decision matrix, highlighting the best option and the worst option.
| C1 | C2 | C3 | C4 | C5 | C6 | |
|---|---|---|---|---|---|---|
| E1 | 0.5 | 0 | 1.00 | 1.00 | 1.00 | 0 |
| E2 | 0.5 | 0.375 | 1.00 | 0.97 | 1.00 | 0 |
| E3 | 0.5 | 1 | 1.00 | 0.81 | 1.00 | 0.6 |
| E4 | 0.5 | 1 | 0.75 | 0.77 | 0.98 | 1 |
| E5 | 0.5 | 0 | 0.00 | 0.60 | 0.92 | 0 |
| E6 | 1 | 0 | 1.00 | 0.99 | 1.00 | 0 |
| E7 | 1 | 0.375 | 1.00 | 0.91 | 1.00 | 0.6 |
| E8 | 1 | 1 | 0.95 | 0.79 | 1.00 | 1 |
| E9 | 1 | 1 | 0.50 | 0.74 | 0.96 | 0 |
| E10 | 1 | 0 | 0.00 | 0.55 | 0.88 | 0 |
| E11 | 0.3333 | 0 | 1.00 | 0.81 | 1.00 | 0 |
| E12 | 0.3333 | 0.375 | 0.60 | 0.78 | 0.94 | 1 |
| E13 | 0.3333 | 1 | 0.00 | 0.73 | 0.85 | 0 |
| E14 | 0.3333 | 1 | 0.00 | 0.65 | 0.79 | 0 |
| E15 | 0.3333 | 0 | 0.00 | 0.57 | 0.71 | 0 |
| E16 | 0.5 | 0 | 1.00 | 0.98 | 1.00 | 0 |
| E17 | 0.5 | 0.375 | 1.00 | 0.92 | 1.00 | 0 |
| E18 | 0.5 | 1 | 1.00 | 0.81 | 1.00 | 0.6 |
| E19 | 0.5 | 1 | 0.65 | 0.78 | 0.95 | 1 |
| E20 | 0.5 | 0 | 0.00 | 0.56 | 0.88 | 0 |
| E21 | 0.3333 | 0 | 1.00 | 0.97 | 1.00 | 0 |
| E22 | 0.3333 | 0.375 | 1.00 | 0.89 | 1.00 | 0.8 |
| E23 | 0.3333 | 1 | 0.80 | 0.80 | 0.96 | 0 |
| E24 | 0.3333 | 1 | 0.35 | 0.73 | 0.94 | 0 |
| E25 | 0.3333 | 0 | 0.00 | 0.54 | 0.87 | 0 |
| P− | 0.3333 | 0 | 0 | 0.54 | 0.71 | 0 |
| P+ | 1 | 1 | 1 | 1 | 1 | 1 |
Appendix B
Table A2.
The values of S+, S−, and CC metrics.
Table A2.
The values of S+, S−, and CC metrics.
| S+ | S− | CC | |
|---|---|---|---|
| E1 | 0.4333 | 0.672 | 0.392 |
| E2 | 0.4599 | 0.6617 | 0.41 |
| E3 | 0.8531 | 0.4149 | 0.6728 |
| E4 | 0.9335 | 0.2512 | 0.788 |
| E5 | 0.1188 | 0.988 | 0.1073 |
| E6 | 0.4498 | 0.652 | 0.4082 |
| E7 | 0.8499 | 0.4293 | 0.6644 |
| E8 | 0.9865 | 0.1379 | 0.8774 |
| E9 | 0.3915 | 0.8123 | 0.3252 |
| E10 | 0.1323 | 0.9701 | 0.12 |
| E11 | 0.4198 | 0.6837 | 0.3804 |
| E12 | 0.8696 | 0.3466 | 0.715 |
| E13 | 0.1631 | 0.941 | 0.1477 |
| E14 | 0.1585 | 0.945 | 0.1436 |
| E15 | 0.1028 | 0.9992 | 0.0933 |
| E16 | 0.4328 | 0.6729 | 0.3914 |
| E17 | 0.4585 | 0.6637 | 0.4086 |
| E18 | 0.8531 | 0.4149 | 0.6728 |
| E19 | 0.9122 | 0.2874 | 0.7604 |
| E20 | 0.116 | 0.9903 | 0.1049 |
| E21 | 0.4242 | 0.6778 | 0.3849 |
| E22 | 0.8938 | 0.336 | 0.7268 |
| E23 | 0.4351 | 0.7354 | 0.3717 |
| E24 | 0.3212 | 0.8746 | 0.2686 |
| E25 | 0.1066 | 1 | 0.0963 |
References
- Chosa, T.; Furuhata, M.; Omine, M.; Matsumura, O. Development of air-assisted strip seeding for direct seeding in flooded paddy fields: Seeding machine and effect of air assistance. Farm Work Res. J. Farm Work Soc. Jpn. 2009. [Google Scholar] [CrossRef]
- Xu, L.; Li, X.; Wang, X.; Xiong, D.; Wang, F. Comparing the grain yields of direct-seeded and trans-planted rice: A meta-analysis. Agronomy 2019, 9, 767. [Google Scholar] [CrossRef] [Green Version]
- Nguyen, L.T.T.; Chosa, T.; Tojo, S.; Tsukamoto, T.A. Effect of Auxiliary Airflow in the Seeding Tube on an Air-assisted Seeding for Rice paddy. Am. Soc. Agric. Biol. Eng. 2011, 1. [Google Scholar] [CrossRef]
- Furuhata, M.; Chosa, T.; Shioya, Y.; Tsukamoto, T.; Seki, M.; Hosokawa, H. Developing Direct Seeding Cultivation Using an Air-Assisted Strip Seeder. Jpn. Agric. Res. Q. JARQ 2015, 49, 227–233. [Google Scholar] [CrossRef] [Green Version]
- Nishimura, Y.; Hayashi, K.; Goto, T.; Horio, M. Precision-drilling methods for the direct sowing of rice in flooded paddy fields. Copyr. Int. Rice Res. Inst. 2005, 2005, 238. [Google Scholar]
- Zadeh, L.A. Information and control. Fuzzy Sets 1965, 8, 338–353. [Google Scholar]
- Dixit, V.; Verma, P.; Raj, P. Leveraging tacit knowledge for shipyard facility layout selection using fuzzy set theory. Expert Syst. Appl. 2020, 158, 113423. [Google Scholar] [CrossRef]
- Jin, X.; Yuan, Y.; Ji, J.; Zhao, K.; Li, M.; Chen, K. Design and implementation of anti-leakage planting system for transplanting machine based on fuzzy information. Comput. Electron. Agric. 2020, 169, 105204. [Google Scholar] [CrossRef]
- Ertuğrul, İ.; Güneş, M. Fuzzy multi-criteria decision making method for machine selection. In Analysis and Design of Intelligent Systems Using Soft Computing Techniques; Springer: Berlin/Heidelberg, Germany, 2007; pp. 638–648. [Google Scholar]
- Abdi, M. Fuzzy multi-criteria decision model for evaluating reconfigurable machines. Int. J. Prod. Econ. 2009, 117, 1–15. [Google Scholar] [CrossRef]
- Duyen, H.V. Researching the Influence of Several Technical Measures on Using Air-Assisted Strip Seeder for Cultivation Inbred Rice Cultivars ĐH12 in the Red River Delta. Master’s Thesis, Vietnam National University of Agriculture, Hanoi, Vietnam, 2020; pp. 54–88. [Google Scholar]
- Xuecheng, L. Entropy, distance measure and similarity measure of fuzzy sets and their relations. Fuzzy Sets Syst. 1992, 52, 305–318. [Google Scholar] [CrossRef]
- Mondal, B.; Mazumdar, D.; Raha, S. Similarity-based approximate reasoning. Int. J. Comput. Cogn. 2006, 4, 46–56. [Google Scholar]
- Pappis, C.P.; Karacapilidis, N.I. A comparative assessment of measures of similarity of fuzzy values. Fuzzy Sets Syst. 1993, 56, 171–174. [Google Scholar] [CrossRef]
- Raha, S.; Pal, N.R.; Ray, K.S. Similarity-based approximate reasoning: Methodology and application. IEEE Trans. Syst. Man Cybern. Part A Syst. Hum. 2002, 32, 541–547. [Google Scholar] [CrossRef]
- Wang, W.-J. New similarity measures on fuzzy sets and on elements. Fuzzy Sets Syst. 1997, 85, 305–309. [Google Scholar] [CrossRef]
- Lee-Kwang, H.; Song, Y.S.; Lee, K.M. Similarity measure between fuzzy sets and between elements. Fuzzy Sets Syst. 1994, 62, 291–293. [Google Scholar] [CrossRef]
- Pal, A.; Mondal, B.; Bhattacharyya, N.; Raha, S. Similarity in fuzzy systems. J. Uncertain. Anal. Appl. 2014, 2, 18. [Google Scholar] [CrossRef] [Green Version]
- Roszkowska, E.; Kacprzak, D.; Roszkowska, E.; Kacprzak, D. The fuzzy saw and fuzzy TOPSIS procedures based on ordered fuzzy numbers. Inf. Sci. 2016, 369, 564–584. [Google Scholar] [CrossRef]
- Thao, N.X. A new correlation coefficient of the intuitionistic fuzzy sets and its application. J. Intell. Fuzzy Syst. 2018, 35, 1959–1968. [Google Scholar] [CrossRef]
Publisher’s Note: MDPI stays neutral with regard to jurisdictional claims in published maps and institutional affiliations. |
© 2021 by the authors. Licensee MDPI, Basel, Switzerland. This article is an open access article distributed under the terms and conditions of the Creative Commons Attribution (CC BY) license (https://creativecommons.org/licenses/by/4.0/).