Abstract
Geopolymer concrete, also known as an earth-friendly concrete, has been under continuous study due to its environmental benefits and a sustainable alternative to conventional concrete construction. The supplies of many source materials, such as fly ash (FA) or slag (SG), to produce geopolymer concrete (GPC) may be limited; however, quarry rock dust (QRD) wastes (limestone, dolomite, or silica powders) formed by crushing rocks appear virtually endless. Although significant experimental research has been carried out on GPC, with a major focus on the mix design development, rheological, durability, and mechanical properties of the GPC mixes; still the information available on the structural behavior of GPC is rather limited. This has implications in extending GPC application from a laboratory-based technology to an at-site product. This study investigates the structural behavior of quarry-rock-dust-incorporated fiber-reinforced GPC columns under concentric and eccentric loading. In this study, a total of 20 columns with 200 mm square cross-section and 1000 mm height were tested. The FA and SG were used as source materials to produce GPC mixtures. The QRD was incorporated as a partial replacement (20%) of SG. The conventional concrete (CC) columns were prepared as the reference specimens. The effect of incorporating quarry rock dust as a replacement of SG, steel fibers, and loading conditions (concentric and eccentric loading) on the structural behavior of GPC columns were studied. The test results revealed that quarry rock dust is an adequate material that can be used as a source material in GPC to manufacture structural concrete members with satisfactory performance. The general performance of the GPC columns incorporating QRD (20%) is observed to be similar to that of GPC columns (without QRD) and CC columns. The addition of steel fibers considerably improves the loading capacity, ductility, and axial load–displacement behavior of the tested columns. The load capacities of fiber-reinforced GPC columns were about 5–7% greater in comparison to the CC columns. The spalling of concrete cover at failure was detected in all plain GPC columns, whereas the failure mode of all fiber-reinforced GPC columns is characterized with surface cracking leading to disintegration of concrete cover.
1. Introduction
Environmental pollution has been a major concern around the world today. The primary reasons are the emission of CO2 in the atmosphere, depletion of natural resources and uncontrolled production of wastes that are dumped eventually in the environment. The construction industry is also responsible for environmental pollution. It cannot be ignored that cement is the most widely used material in construction activities. According to a study, the cement industry alone is emitting about 7% of the total greenhouse gas (GHG) emissions [1]. The constructional activities around the globe are growing every year to meet the infrastructural demand. It is estimated that more than 4 billion tons of cement is manufactured each year globally [2]. The production activities of cement are responsible for an enormous amount of GHG emissions into the environment due to use of energy, i.e., the fuel and raw material transformation. According to an estimate, about 1.6 tons of natural resource in the form of raw material is depleted to produce one ton of cement that leads to an emission of one ton of CO2 in the environment [3].
There are global campaigns to encourage the development of environment-friendly construction material that can serve as a sustainable alternative to conventional concrete construction. The basic principles to produce an eco-friendly material are restriction to the consumption of natural resources and deploying a strategy to reduce the emission of CO2 into the atmosphere [4]. On the other hand, there has been a significant increase in the generation of waste materials from industries, such as fly ash (FA) from coal power plants; molten slag (SG) from steel and iron industries; red mud from the alumina industry; dolomite, silica powders, and limestone dust from quarrying operations; ceramic wastes from the ceramic industry; and mine tailings from the mineral industry. This has become a challenging task for the environmentalists and researchers to dispose of or manage these wastes and develop alternatives to traditional ordinary Portland cement (OPC) concrete [5].
Geopolymer concrete (GPC) has emerged as an innovative solution that can fully avoid the usage of cement and endorse the effective use of waste materials [6,7,8]. GPC, also known as an earth-friendly concrete, is produced by activation of aluminosilicates, which are mainly derived from industrial wastes, such as FA, SG, ceramic wastes, red mud, limestone, dolomite, and silica powders [9,10,11,12,13]. FA, a waste product from coal power plants, and SG, a waste product of steel and iron industries, have been extensively used to produce GPC with an established good performance [14,15,16,17,18]. However, doubts persist about stability of the delivery of a good quality FA, since shortages in the supply of FA have been faced in some parts of the world due to strict regulation around coal-fired power stations [19]. Similarly, the annual global supply of SG is fairly limited while comparing to the annual requirement of concrete for global construction activities. It is very important to find alternatives for FA and SG to be used as precursors in the production of GPC due to shortages in supply of other source materials, such as FA and SG. Therefore, all the existing alternative raw material options should be explored in pursuing sustainable alternatives to conventional concrete construction.
One such raw material is quarry rock dust (QRD) in the form of limestone, silica, and dolomite powders. It can be defined as the residue or waste material formed during quarrying/crushing of large parent mass rock to produce aggregates [9,20]. The quarrying operations account for more than 15% of the waste dust of the total aggregate production [21]. These wastes are not biodegradable and produce environmental pollution, leading to health hazards. The storage and dumping of these wastes without treatment or recycling can trigger severe environmental challenges. In the premises of rock quarries, a massive quantity of fine dust particles can be found suspended in the air or accumulated near the stone crusher, which are hazardous for human health, animals, and plants [20]. It is, therefore, necessary to find a new way to recycle this waste. This waste material can be utilized efficiently in the construction of infrastructures as a partial replacement for cement and aggregates.
There are several studies highlighting the incorporation of quarry wastes, mostly limestone and dolomite powders as aggregates in geopolymers [22,23,24]. However, the data available on the incorporation of quarry wastes (limestone and dolomites) as a partial replacement of binder in GPC is limited. A few researchers have highlighted the use of this waste as a geopolymer binder in GPC mixes. Cohen et al. (2019) studied the integration of dolomite-based quarry dust waste material as a partial replacement of cement and FA in cement-based (CEM) and FA-based geopolymer mortars, respectively [9]. The FA was replaced by quarry dust wastes at five different percentages, i.e., 0%, 10%, 20%, 30%, and 40% by weight of total geopolymeric binder. The results confirm that quarry dust wastes can be incorporated, even at a high replacement level (40% by weight), in cement-based and FA-based geopolymer mortars, demonstrating good and, in certain cases, better mechanical and durability properties. It was found that compressive strength was increasing with the increase of quarry waste content for both CEM- and FA-based geopolymer mortars [9]. Hence, the utilization of quarry dust waste materials would not only create economic and environmental benefits for construction, but also deliver an effective and green disposal solution [9].
One of the significant problems in utilizing GPC for structural members is its brittle behavior, with low strength in tension and flexure as compared to conventional concrete [25,26]. Davidovits studied the utilization of steel fibers in GPC to cope with the brittle behavior [27]. Several studies inspected the influence of various types of fibers, i.e., cotton, polypropylene, polyvinyl alcohol and steel fibers, in GPC to lower its brittleness [28,29,30,31,32]. The inclusion of carbon, polyvinyl alcohol and polypropylene fibers in GPC are found to have inadequate resistance to elevated temperature, weak bond strength, and high sensitivity to solar radiation [31]. However, the presence of steel fibers in GPC are found to enhance ductility by improving the tensile and flexure strengths, controlling the crack width and energy absorption capacity [33]. The effectiveness of steel fibers in GPC relies on numerous parameters, including the fiber content by weight or volume, strength, geometry and aspect ratio [33].
Many studies have been reported on GPC, with the major focus of research on the evaluation of the engineering properties of GPC mixes, such as mix proportion development, effect of source material on physical, chemical, microstructural, mechanical, rheological, and durability properties [33]. Some studies are also available on the behavior of GPC structural members, which highlight equally good and, in certain cases, better performance than conventional concrete [34,35,36,37,38]. Sumajouw et al. (2005) investigates the behavior of FA-based GPC beams (200 × 300 × 3000 mm). The test results reported that loading capacity, load deflection behavior, and failure patterns were almost like those of reinforced cement concrete (RCC) beams [35]. Sumajouw et al. (2007) studied the behavior of FA-based GPC columns (175 × 175 × 1500 mm) tested under different loading eccentricities. The experimental results suggested that FA-based GPC columns have the potential to be used in structural applications [38]. Chang (2009) evaluated the shear and bond behavior of reinforced GPC beams. It was reported that cracking patterns and loading capacity of GPC beams were analogous to RCC beams [36]. Farhan et al. (2018) evaluated the performance of FA- and SG-based GPC columns and reported that most of the columns failed around the mid-height of specimens, and steel fibers can be incorporated to increase the loading capacity and ductility of columns [33]. GPC, therefore, can be considered as an alternative to conventional concrete construction due to the reduction in energy consumption, CO2 emissions, low cost, and effective consumption of waste materials.
FA and SG have been enormously used in the research to produce GPC mixes. However, shortages in the supply of FA have been faced in some parts of the world due to strict by-laws around coal-fired power stations. Similarly, the annual global supply of SG is fairly limited in comparison to the annual requirement of concrete for the global construction activities. It is important, therefore, to find alternatives for FA and SG to be used as precursors in the production of GPC, to promote commercialization of GPC and lessen the costs, as well as to meet the increasing infrastructural demand. Consequently, all the existing alternative raw material options should be explored in pursuing sustainable alternatives to conventional concrete construction. This study is planned to study the effect of the incorporation of QRD as a replacement for SG in ambient-cured GPC columns.
Regardless of the numerous environmental benefits of GPC, its use in construction practice is significantly limited. This is primarily due to comparatively fewer studies reporting the structural behavior of GPC structural elements. GPC is still a relatively new material in terms of field application and has yet to secure international acceptance as a construction material. The major portion of research into GPCs has focused on mix design and quantification of mechanical behavior in comparison to the studies that consider the behavior of GPC structural elements [34]. More studies on the full-scale structural elements should be undertaken to ensure its feasibility in practice. This will help to expand this relatively new material technology to field and site applications. To date, a few studies are available which are devoted to exploring the behavior of steel-fiber-reinforced GPC columns [33,39,40]. Moreover, there is a lack of data demonstrating the behavior of quarry-rock-dust wastes (dolomite, silica powders, and limestone) blended steel-fiber-reinforced GPC columns. The objective of this study, therefore, is to develop a thorough understanding about the behavior of ambient-cured, quarry-rock-dust-incorporated, steel-fiber-reinforced GPC square columns under concentric and eccentric loading.
2. Experimental Program
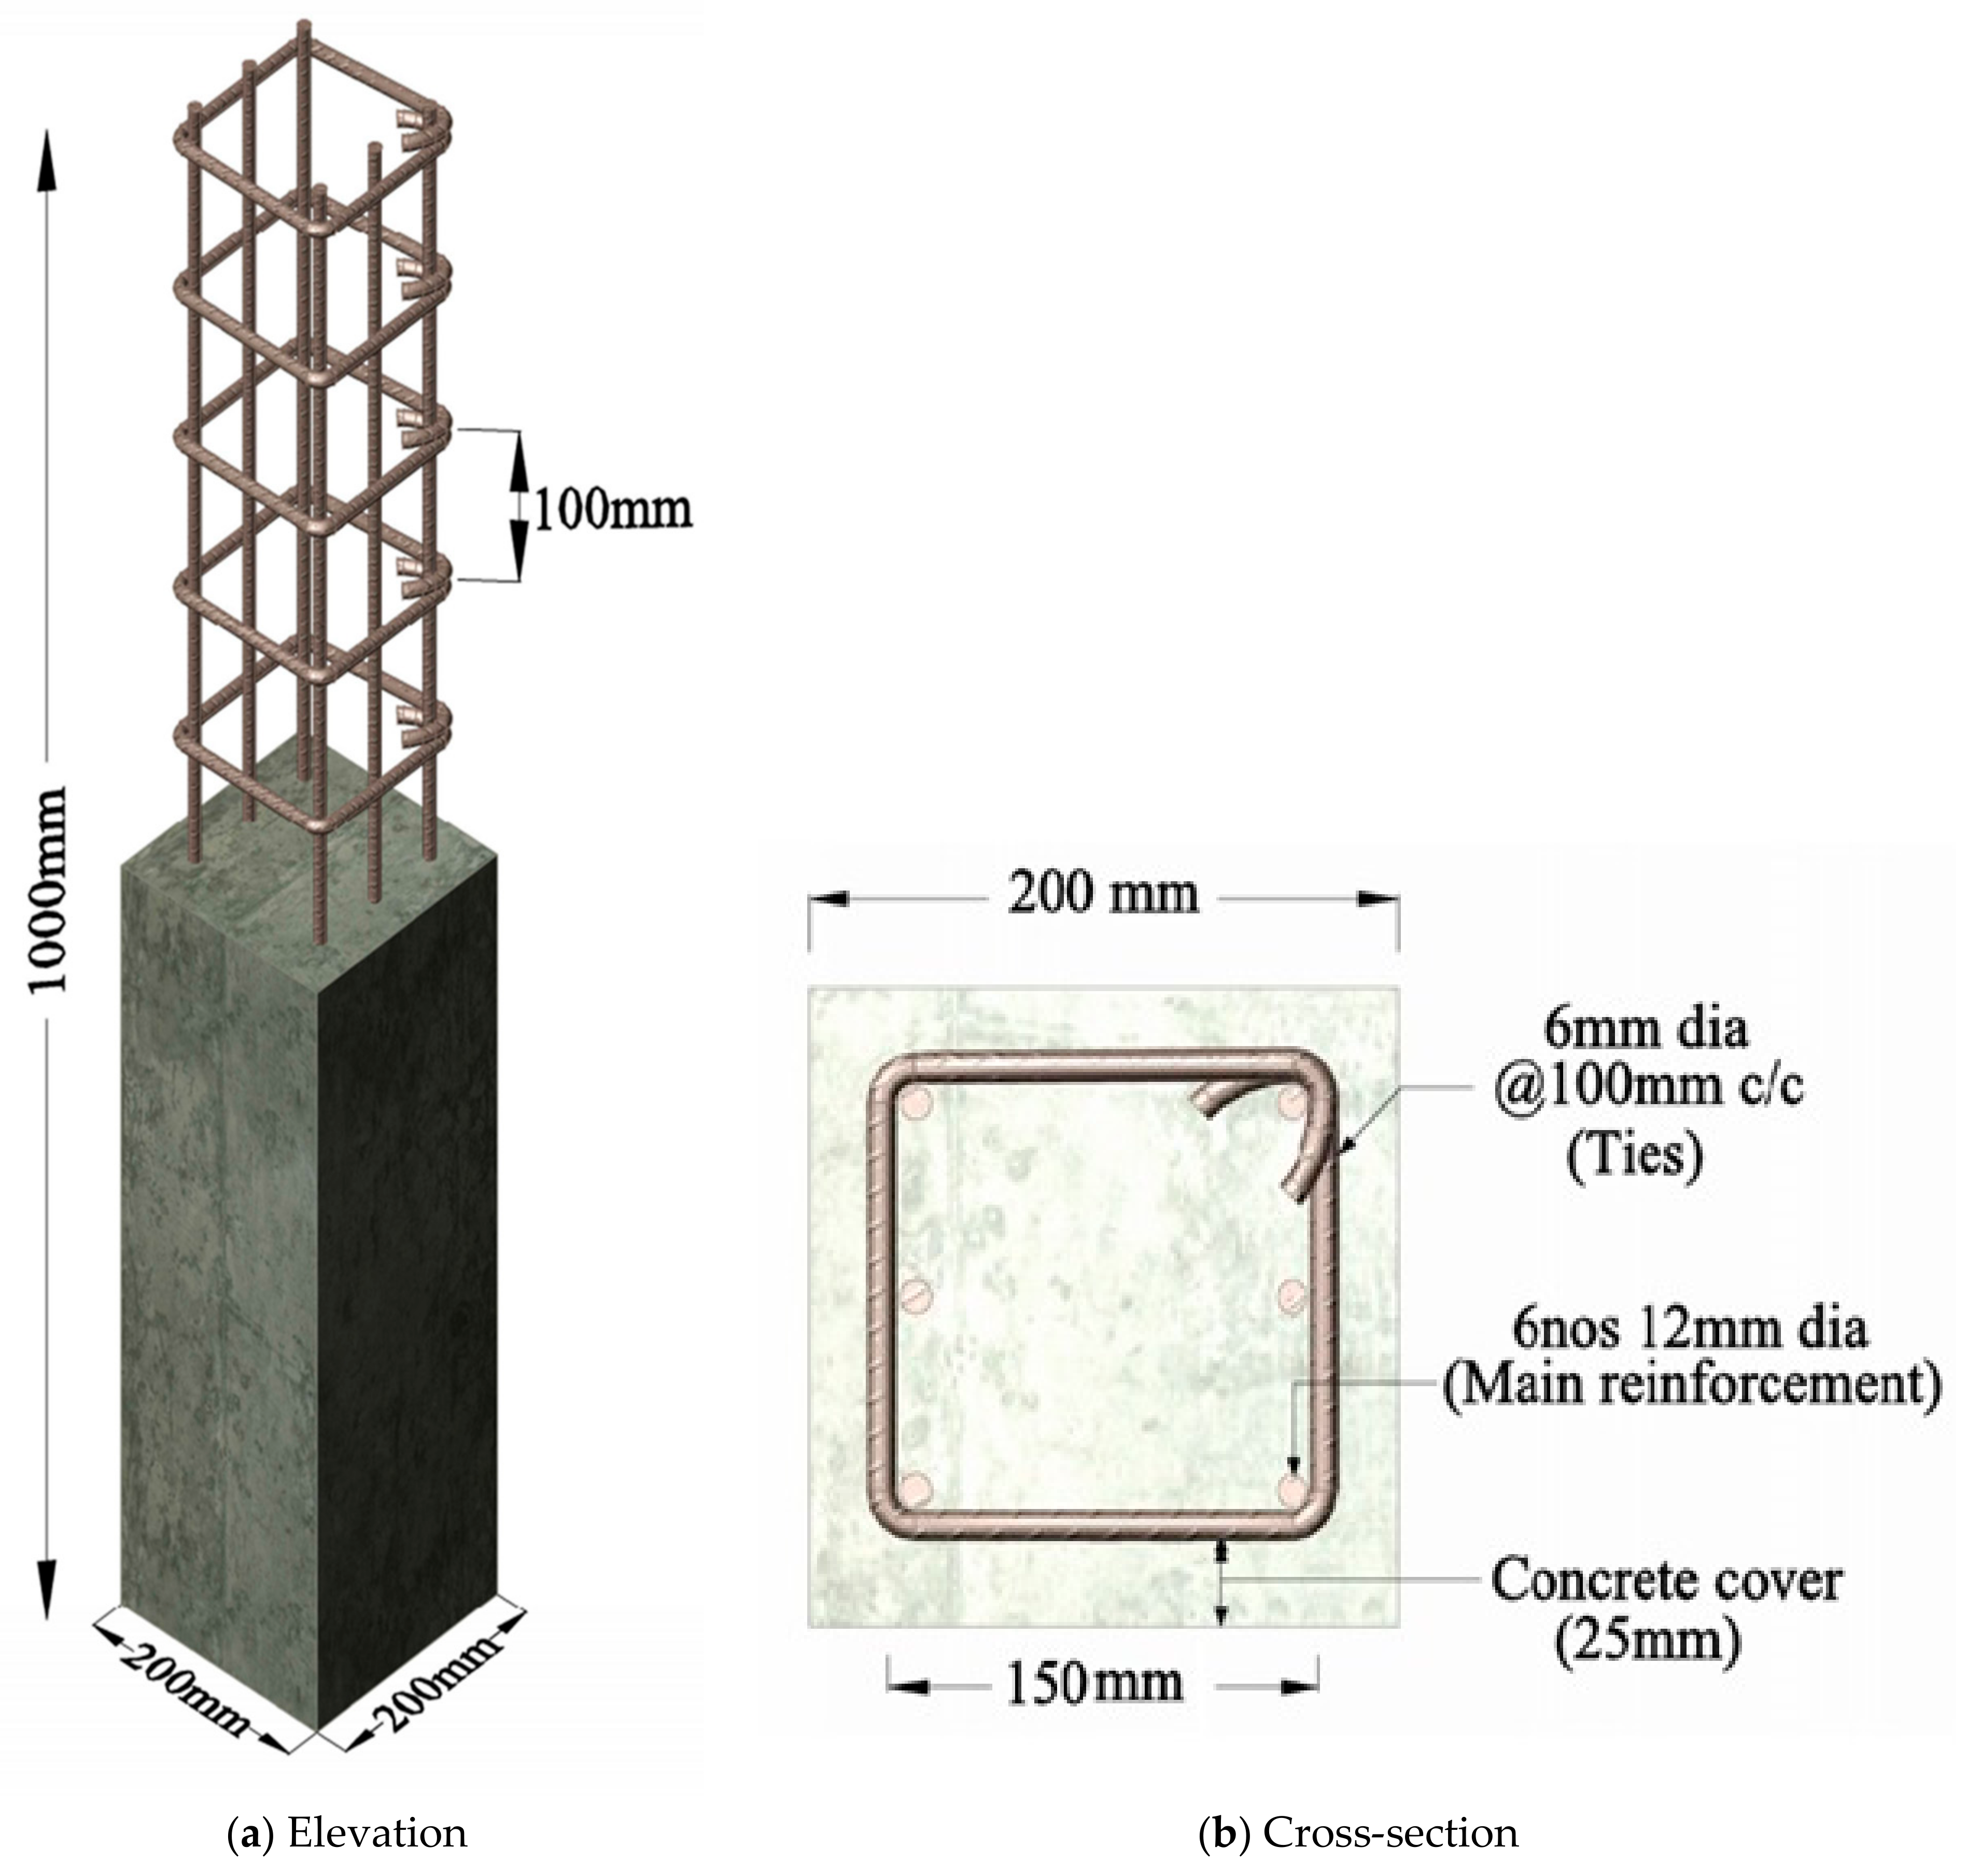
In this study, a total of 20 columns of 200 mm square cross-section and 1000 mm height, were tested. All the columns were reinforced longitudinally with six deformed 12 mm diameter bars. The transverse reinforcement was provided in the form of closed ties of 6 mm diameter bars at 100 mm center-to-center spacing in all specimens, as shown in Figure 1. The deformed steel of 450 MPa yield strength for D12 (12 mm) bars and 300 MPa yield strength for D6 (6 mm) bars were used. The columns were tested under two loading conditions, i.e., concentric axial loading (eccentricity e = 0 mm) and eccentric axial loading with different eccentricities (i.e., eccentricity e = 15, 35, and 50 mm). A clear cover of 25 mm to reinforcement was provided on all sides in the specimens. Shaikh and Hosan (2016) studied the mechanical properties of steel-fiber-reinforced GPC at ambient and elevated temperatures [41]. Three different fractions of steel fiber by volume were investigated (0%, 0.5%, and 0.75%) to find the optimal fraction of steel fiber. The test results showed that compressive strength of GPC specimens were increased by varying the fiber fraction from 0.5 to 0.75% regardless of temperature, and 0.75% was found to be optimal for other mechanical properties. Therefore, 0.75% of fiber fraction by volume has been used in the present study for all the fiber-reinforced GPC columns [41].

Figure 1.
The size and reinforcement detail of the test specimens.
The columns were divided into three groups depending upon their mix proportions, i.e., CC (conventional concrete columns), GC, and GCD (geopolymer concrete columns). The first group ‘CC’ comprised of four conventional concrete specimens. In this group, one column was subjected to concentric loading, and the other three were subjected to eccentric axial loading using three different eccentricities, i.e., 15, 35, and 50 mm. The specimens of this group were set as control specimens for the sake of comparison with GPC columns, i.e., GC and GCD specimens. The second group ‘GC’ comprised of eight square cross-section GPC columns. In this group, all specimens were prepared with FA (50%) and SG (50%) as the source materials. The mix proportions for the prepared columns are shown in Table 1. In the third group ‘GCD’, QRD was incorporated as a partial replacement (20%) of SG, alongwith SG (30%), and FA content (50%) in all the column specimens.

Table 1.
The detail of proportions and material quantities of mixes used in the study.
The four specimens each in the GC and GCD groups were prepared without steel fibers, and the remaining four in each were reinforced with 0.75% fraction by volume of steel fibers. The details of the specimens, reinforcements and loading eccentricities are shown in Table 2. The dimensions, longitudinal and transverse cross-sections, and reinforcement details of the columns are shown in Figure 1. In the GC and GCD groups, one plain and fiber-reinforced column was subjected to concentric axial load, whereas the remaining plain and fiber-reinforced columns were tested under eccentric axial loading with eccentricities of 15, 35, and 50 mm. All the specimens were named based upon the group (CC, GC, or GCD), loading condition (concentric and eccentric), and fiber fraction (0% or 0.75%). The first part of the specimen name tag represents the group to which the specimen belongs, the second part refers to the percentage of fiber fraction, and the third part represents the loading condition. For instance, GCD-0.75F-50E represents a specimen of third group ‘GCD’ with 0.75% fiber fraction (0.75F) and tested under 50 mm eccentric axial load (50E).
Table 2.
The details of column specimen groups, reinforcements, and the loading eccentricities.
2.1. Material Properties and Mix Proportions
The ordinary Portland cement (OPC) conforming to ASTM type 1 (ASTM C150) was used for production of reference concrete mixture for specimens of first group ‘CC’ [42]. For the second group ‘GC’, industrial wastes, i.e., low calcium FA from local power plants and SG from local steel industries, were used to produce GPC mixture. For the third group ‘GCD’, QRD was obtained from the local quarries and incorporated along with the FA and SG to produce the GPC mixtures. The raw QRD was first processed by heating in an oven at 200 °C for 24 h, then it was mechanically grinded to achieve the mean particle size of 90 µm [9]. The mixture proportions of GPC, as shown in Table 1, were based on the previous studies [43]. All the concrete mixtures were proportioned to achieve a target compressive strength of 40 MPa at 28 days. It was made sure that industrial wastes, FA, SG, and QRD, for all the mixes were obtained from the same source (power plant, steel industry, and rock quarries, respectively) to avoid error in results due to variation in source materials. The chemical analysis of FA, SG, and QRD was carried out by performing X-ray fluorescence (XRF). The chemical composition and physical properties of QRD, FA, and SG are shown in Table 3.
Table 3.
The chemical composition from XRF analysis and physical properties of FA, SG, and QRD.
In GPC, the geopolymerization process starts when source materials react with the alkaline activators. The sodium hydroxide (SH) and sodium silicate (SS) were mixed in predetermined ratios to make alkaline activator solution (AAS). The SH solution of 12 M molarity was prepared by mixing a predetermined quantity of SH pellets of 2.10 specific gravity in water. It was prepared 24 h before mixing with SS solution due to heat evolution resulting from exothermic reaction. The SS solution, with a ratio of SiO2 to Na2O = 2.0, was obtained from a local supplier. It was composed of Na2O, SiO2, and H2O in 15.06%, 29.95%, and 54.99% by mass, respectively. The properties of SS solution are shown in Table 4.
Table 4.
The properties of SS solution.
The coarse aggregates (CA) with a maximum size of 20 mm were taken from the Margallah quarry in Pakistan. They were prepared to surface dry condition, conforming to ASTM C127-15 [44]. The natural river sand from Lawrencepur (Pakistan) was used as fine aggregates in surface dry condition (SSD), conforming to ASTM C128-15 [45]. The properties of CA and sand are shown in Table 5. Since GPC mix is more cohesive and viscous due to the high viscosity of SS and SH solutions [46], a naphthalene-based superplasticizer (SP) was used to increase the workability of the fresh mix. For preparing fiber-reinforced concrete specimens, hooked steel fibers of 30 mm length, 0.5 mm diameter, and 2500 MPa tensile strength were used.
Table 5.
The physical properties of CA and sand.
2.2. Preparation of Specimens
All the mixes were prepared in a mechanical concrete mixer. The capacity of the mixer for an individual batch was 0.15 m3 which was enough to prepare two specimens of any group from a single batch. All column specimens were cast in steel molds. The alkaline activators SH and SS were mixed in predetermined ratios to make the solution one hour before the mixing operation. The SH solution was prepared 24 h before the application and mixed with SS solution at a required ratio about 30 min before the application to improve the reactivity of solution. The mixing procedure and time of mixing was kept the same for all the mixes. The CA and sand was prepared to the SSD condition before the mixing operation. Firstly, all the dry ingredients, i.e., aggregates (sand and CA), FA, SG, and QRD, were added to the mixer. After 2 min of dry mixing, steel fibers were gradually introduced into the dry mix, and mixing was continued for another 3 min to achieve uniform distribution of steel fibers into the mix. Afterwards, AAS was added to the premixed dry ingredients. The superplasticizer was then added if required and mixing was continued for another 2–3 min to ensure homogeneity. The freshly mixed concrete was poured into the steel molds of columns. Since GPC mixes are more viscous than conventional concrete mixes, the compaction was carried out mechanically by an internal vibrator during casting. Along with the columns, six cubes were also cast for a single batch of concrete mix to evaluate the 28 days average compressive strength of concrete, following BS EN 12390-3:2009 [47]. The specimens were demolded after 24 h. After demolding, the specimens were placed in a room under ambient environment with a temperature of 25 ± 2 °C and 70 ± 5% relative humidity till the testing age.
2.3. Test Setup
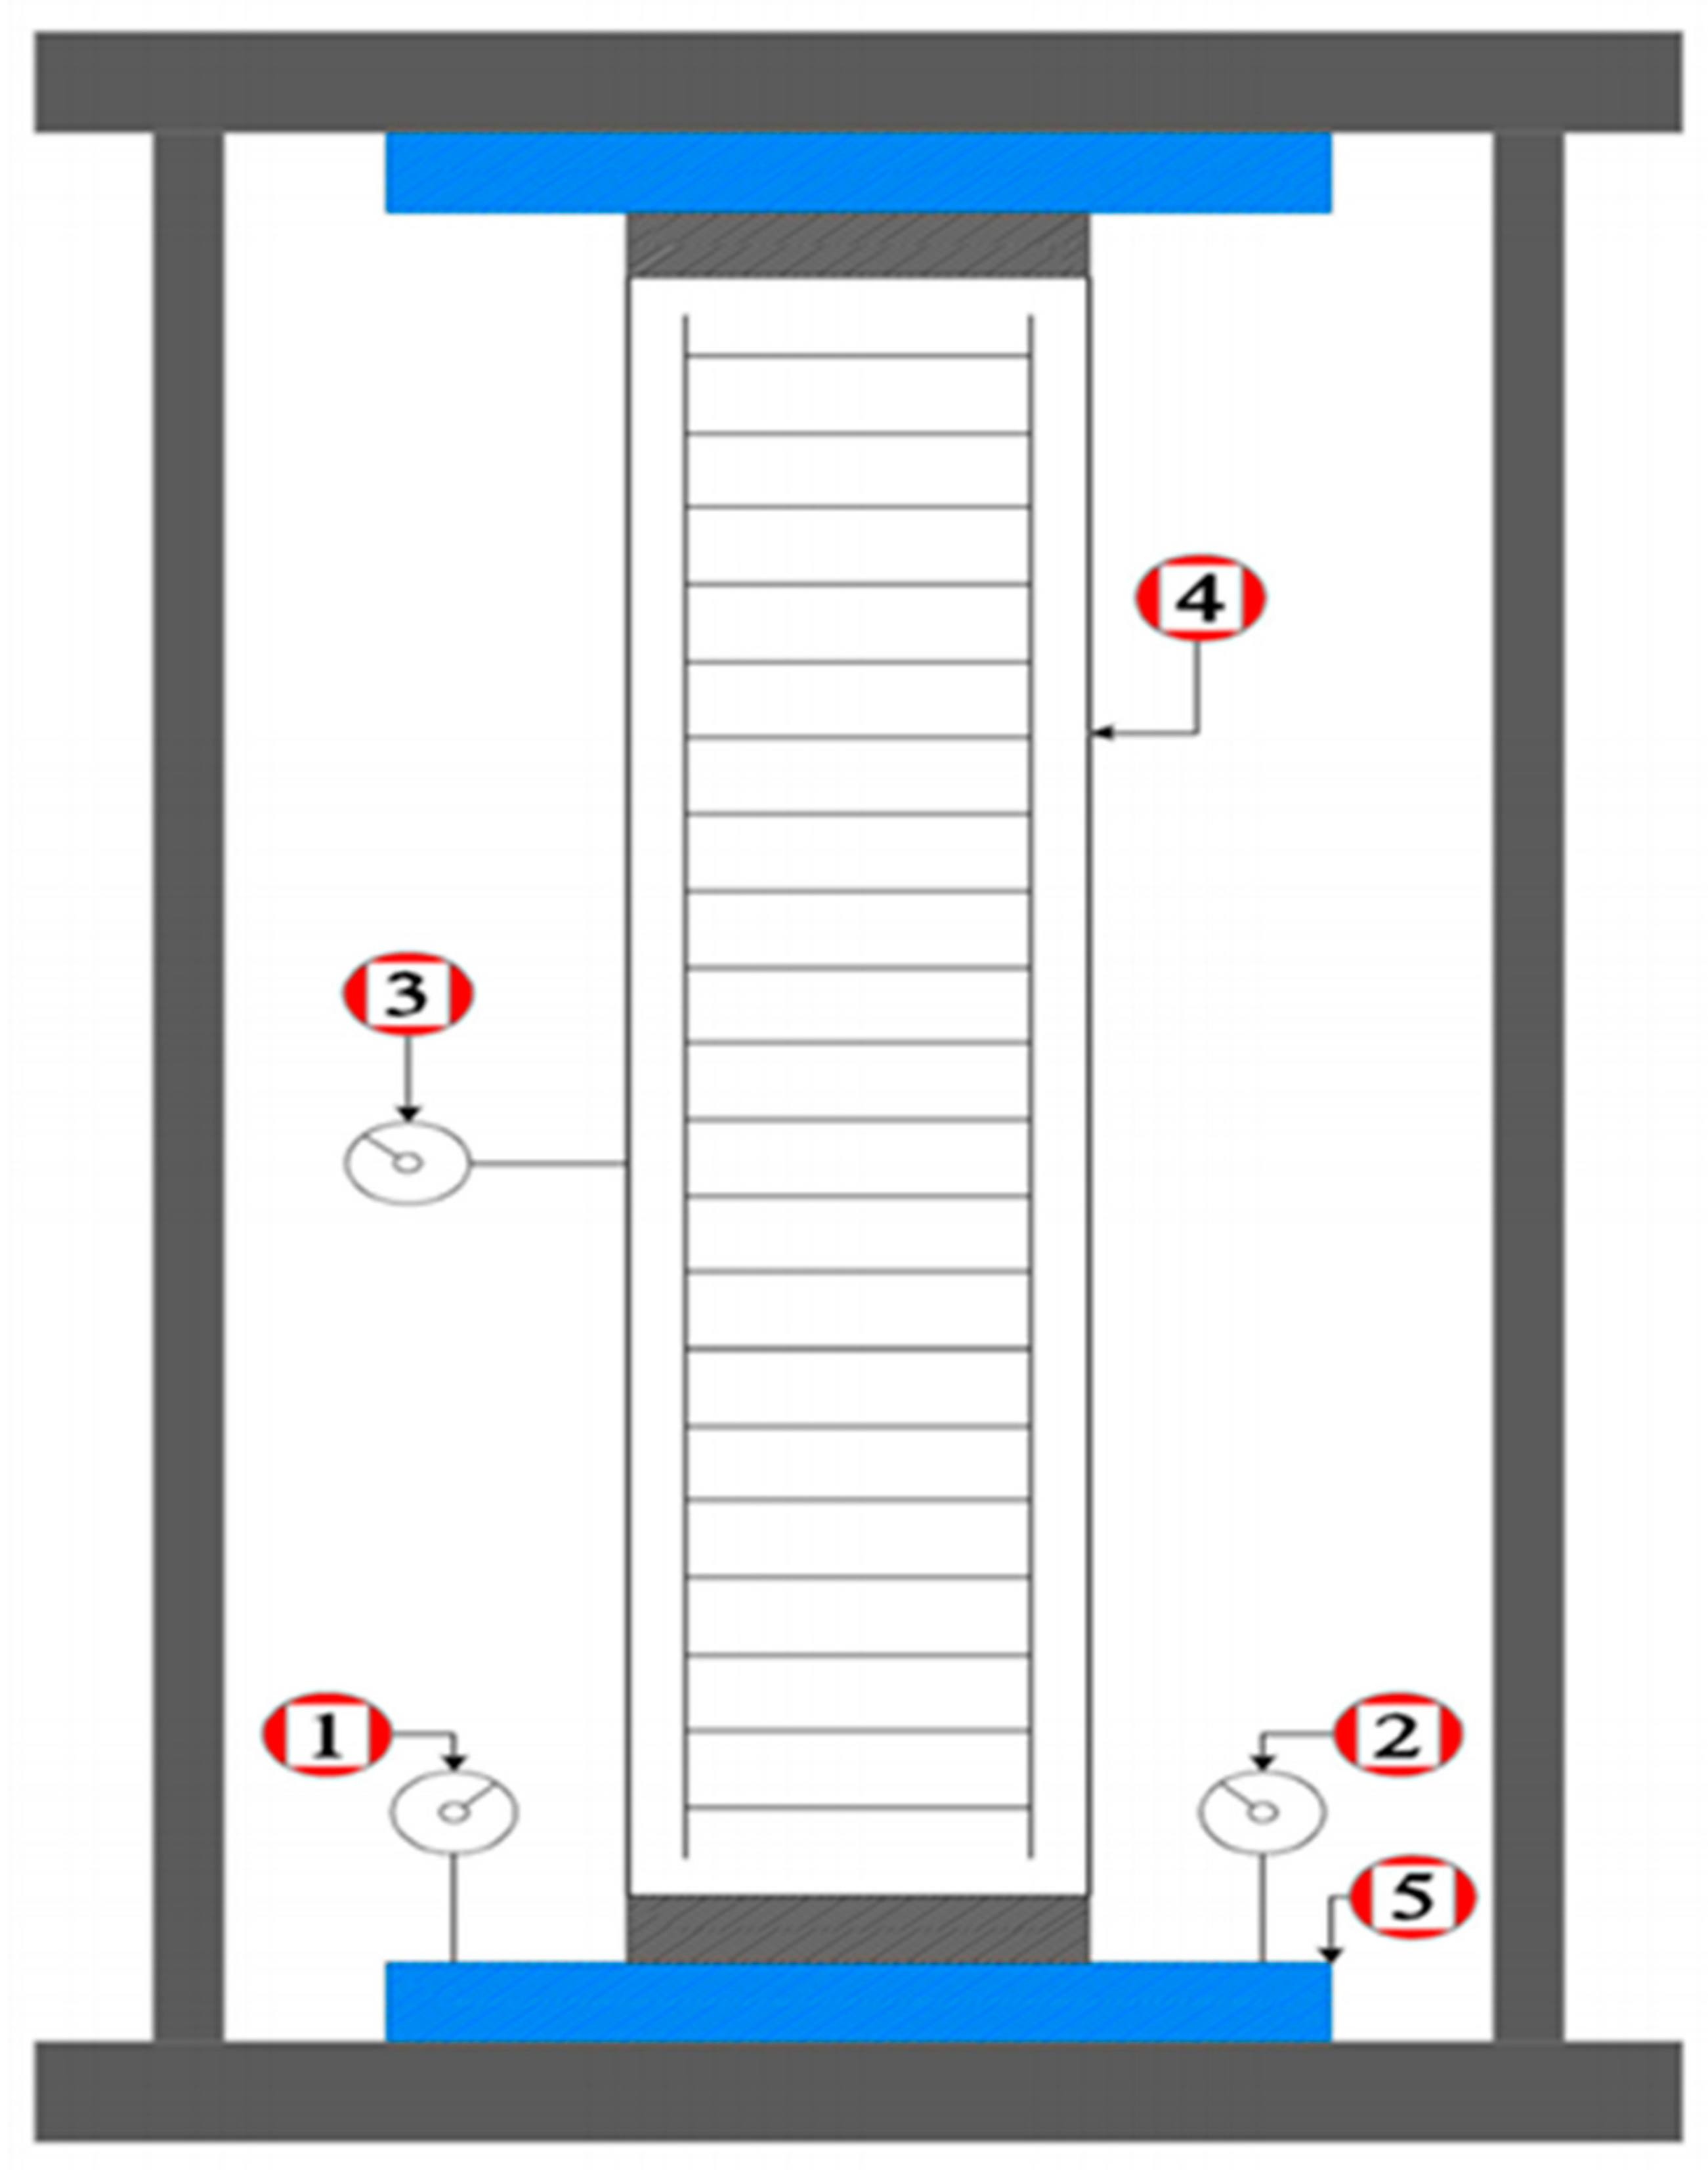
All the specimens were subjected to unidirectional axial loading at the age of 28 days. The loading was applied with an electrohydraulic testing machine of 5000 kN capacity. The columns were tested till failure under load control conditions. The load was applied in regular intervals of 1 kN/s. Figure 2 shows the loading set up for the specimens used in this study. For the eccentric loading, a high-strength steel pin attached with a bearing plate was placed at the top and bottom ends of the column to produce combined bending and axial loading effects [34]. A similar setup was adopted for the concentrically loaded columns, except no loading pin was used. Before the testing, 76 mm wide and 3.2 mm thick steel collars were wrapped around both ends of a column in order to avoid overstressed premature failure of columns. A thin layer of plaster of Paris was also applied on both top and bottom faces of the columns to give a smooth and level surface for uniform distribution of load during the test. The test setup and instrumentation of specimens are shown in Figure 3. Two dial gauges with an accuracy of 0.001 mm per deviation were installed vertically on two opposite faces of the columns to measure the axial deformations of the specimens for each load increment. The lateral displacement of the columns was measured by another dial gauge of the same specifications at mid-height of the columns along the vertical centerline of specimens, as shown in Figure 3.
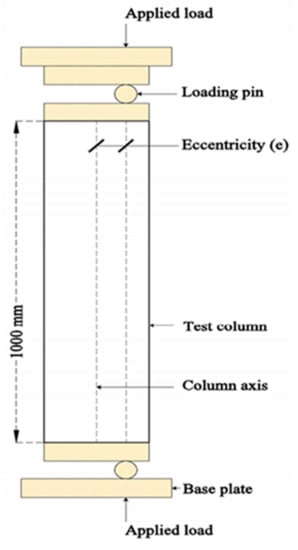
Figure 2.
The loading setup for eccentric axial loading of columns.
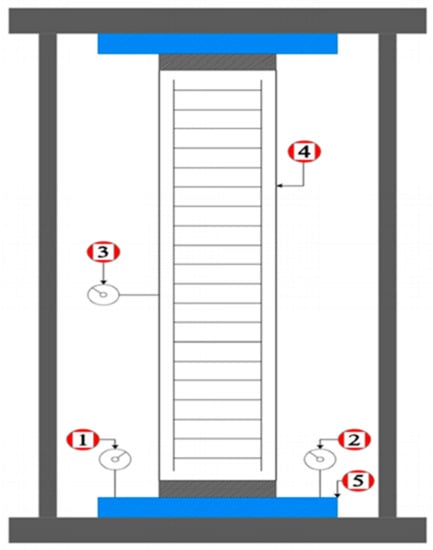
Figure 3.
The instrumentation setup to measure deformations in columns. The dial gauges 1 and 2 were installed for axial deformation, and 3 for lateral deformation measurements. The label 4 represents column specimen, while the base plate is marked with label 5.
3. Results and Discussion
3.1. General Behavior of Columns
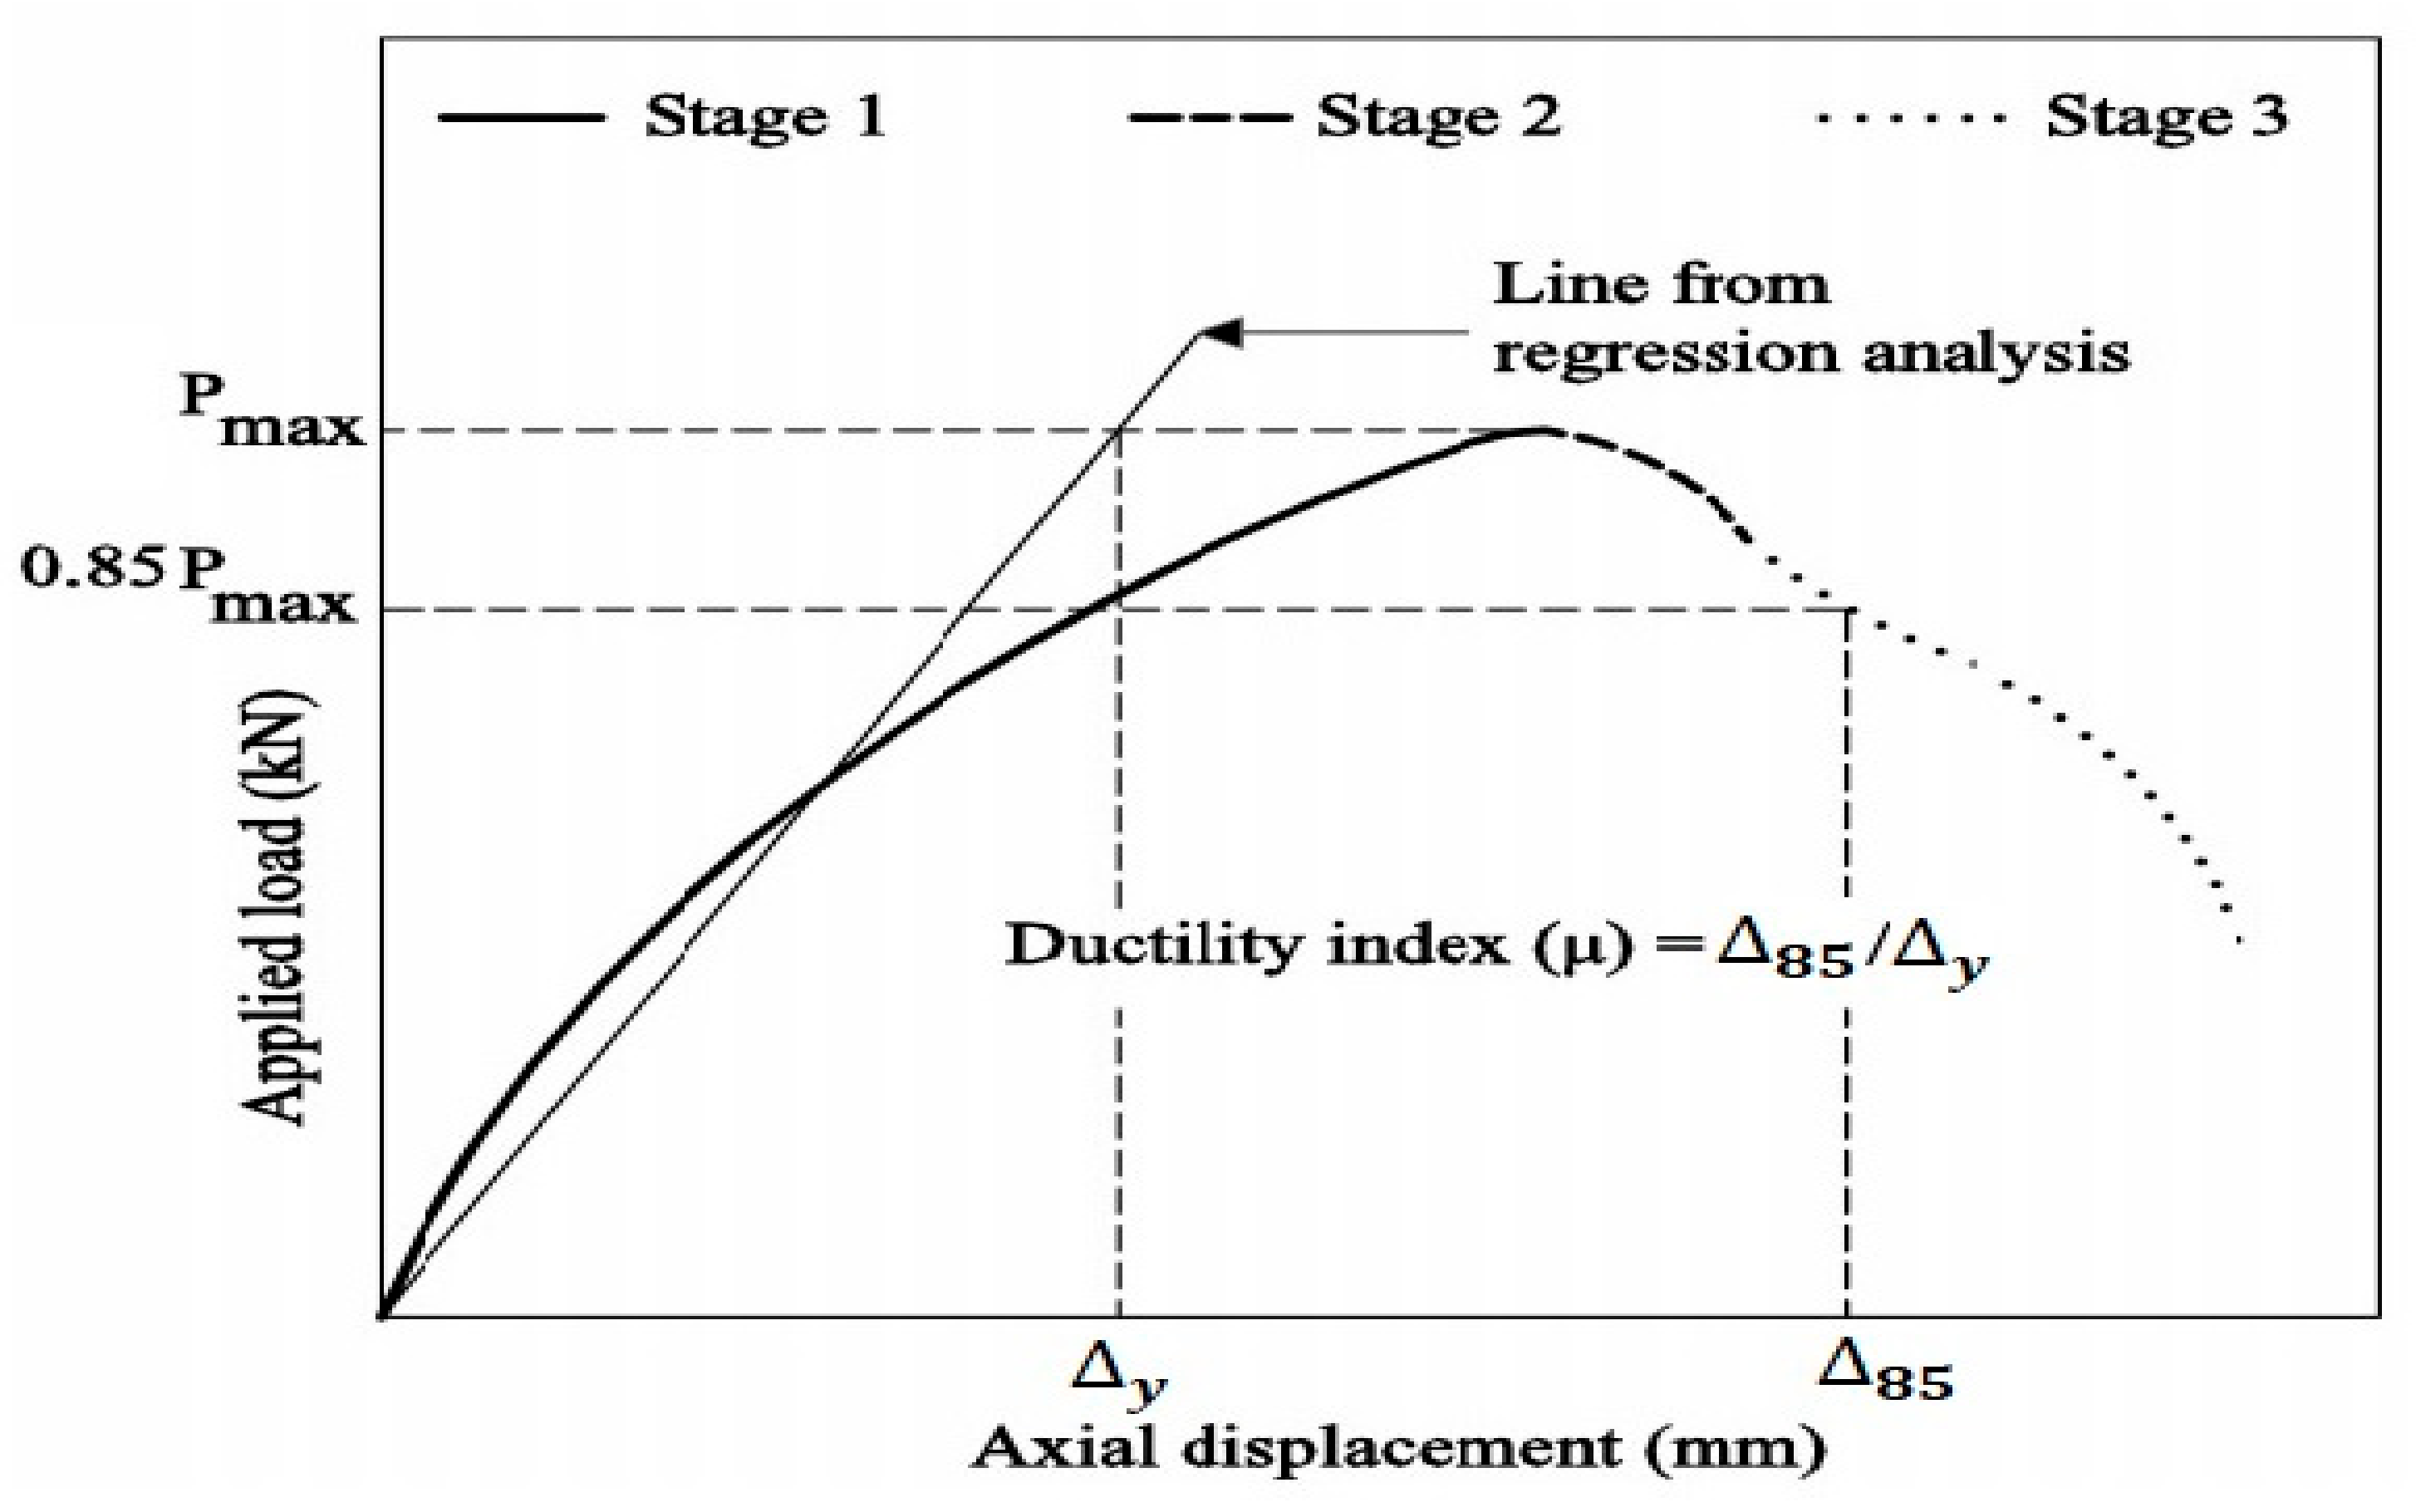
In the present study, all the columns were subjected to monotonic loading, increasing gradually till failure. The general behavior of the tested columns was assessed by the load carrying capacity, ductility, and load–displacement responses. The load-axial-displacement behavior of all columns was divided into three different stages, as presented in Figure 4 [33]. The primary stage of axial load–displacement responses denotes the load-carrying capacity of the gross cross-sectional area of the column prior to the cracking of the concrete cover. In this stage, the steel fibers and the traverse reinforcement do not affect the behavior of the tested specimens. During the second stage in load–displacement responses, a sudden decline in the axial load from the ultimate load (Pmax) can be seen, owing to the spalling of concrete cover. The last stage characterizes the behavior of the tested specimens after spalling of the concrete cover. In this stage, the load–displacement response of the tested columns is affected by the existence of fibers, steel reinforcement, and spacing of the transverse reinforcement. The incorporation of steel fibers significantly influences the post-peak load–displacement behavior of the tested columns. The addition of steel fibers softens the descendant portion of the load–displacement response and restricts the abrupt failure of the tested specimens. In order to study the effect of steel fibers on the ductility of the specimens, the ductility ratio is estimated for all specimens.
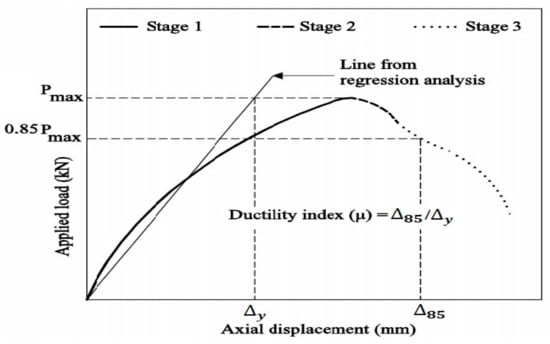
Figure 4.
The general load–displacement response of the column specimens.
The behavior of the tested specimens in terms of ductility/brittleness was evaluated by calculating the ductility of the specimens, considering a displacement ductility ratio as an index [48,49,50]. The displacement ductility index μ was computed as the ratio of the axial displacement of specimens at an axial load corresponding to 85% of the peak axial load on the descending portion of the load–displacement curve (Δ85) to the axial displacement corresponding to the yield limit of elastic behavior of the specimens (Δy). Figure 4 presents the illustration of calculating the yield displacement corresponding to the limit of the elastic behavior of specimens. The ductility index of the tested specimens was computed using the following equation (Equation (1)):
3.2. Ultimate Loading Capacity
The failure loads obtained from the experimental results are presented in Table 6 and Figure 5. It can be noted that the specimens of the GC and GCD group had lower ultimate load values than their counterparts in the CC group when fibers are not used in the GC and GCD specimens. The load-carrying capacity of concentrically loaded plain column in the GC and GCD group was 10% and 16% lower, respectively, than their counterparts of CC group. The ultimate load values of group GC specimens, GC-0F-0E (860 kN), GC-0F-15E (570 kN), GC-0F-35E (335 kN), and GC-0F-50E (250 kN) were decreased by 10%, 20%, 22%, and 25%, respectively, than CC-0F-0E (945 kN), CC-0F-15E (722 kN), CC-0F-35E (430 kN), and CC-0F-50E (330 kN) of group CC. The specimens of GCD group, GCD-0F-0E, GCD-0F-15E, GCD-0F-35E, and GCD-0F-50E, failed at ultimate loads of 790 kN, 515 kN, 292 kN, and 201 kN, respectively, which are 16%, 29%, 32%, and 39% lower than CC-0F -0E, CC-0F-15E, CC-0F-35E, and CC-0F-50E, respectively, of CC group.
Table 6.
The test results of column specimens, including ductility index.
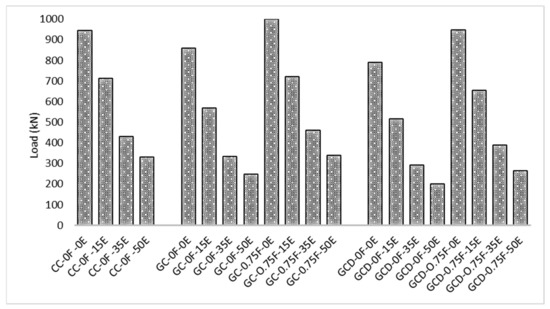
Figure 5.
The ultimate load-carrying capacities of columns.
It can be noted from Figure 5 that load values are influenced by varying the amount of eccentricity in the tested specimens. The load-carrying capacity of column has an inverse relationship with the loading eccentricity, i.e., it decreases with increasing the eccentricity of the axial load. The load values show similar trends for different eccentricities in all the columns of different groups (Figure 5). The load values were decreased drastically as eccentricity was increased from 0 to 15, 35, and 50 mm. This decreasing trend of load values against increasing eccentricities is also consistent with the previous studies [33,34]. The peak axial load sustained by eccentrically loaded columns of GC group, i.e., GC-0F-15E (570 kN), GC-0F-35E (335 kN), and GC-0F-50E (250 kN), is 30%, 61%, and 71% lower, respectively, than the ultimate load of the concentrically loaded column, i.e., ‘GC-0F-0E (860 kN)’. The peak load values of eccentrically tested columns of GCD group were decreased by 34%, 63%, and 70% for specimens GCD-0F-15E (515 kN), GCD-0F-35E (292 kN), and GCD-0F-50E (201 kN), respectively, when compared with concentrically tested column, i.e., GCD-0F-0E (790 kN). It can be observed from Figure 5 that the load-carrying capacity of GC columns is greater than the ultimate load values of GCD columns. The ultimate load values of group GCD specimens, GCD-0F-0E (790 kN), GCD-0F-15E (515 kN), GCD-0F-35E (292 kN), and GCD-0F-50E (201 kN) were decreased by 8%, 10%, 13%, and 18%, respectively, than their counterparts in group GC, viz., GC-0F-0E (860 kN), GC-0F-15E (570 kN), GC-0F-35E (335 kN), and GC-0F-50E (250 kN), respectively.
By comparing the ultimate load values of fiber-reinforced columns with their without-fiber counterparts, a considerable increase in load-carrying capacity can be observed for the former. Generally, the peak load values of fiber-reinforced GC and GCD columns were 20–30% more than the corresponding plain specimens. The load capacities of fiber-reinforced GC specimens were about 5–7% higher than their counterparts in CC group. Meanwhile, the ultimate axial load attained in fiber-reinforced GCD columns was 7–15% more than their without-fiber counterparts in GC group. The increase in strength might be owing to the effective role of fibers in improving the behavior of both the cover concrete and core concrete by arresting microcracks and bridging across the macrocracks. This crack-arresting procedure of multiple cracking lasted until the fibers failed or were pulled out [33,51]. The steel fibers also assisted in preventing the early spalling of the concrete cover that helped the core concrete to resist the higher loads [39]. The specimens GC-0.75F-0E and GCD-0.75F-0E had maximum loads of 998 kN and 950 kN in groups GC and GCD, respectively, indicating a 17% and 20% increase in load-carrying capacity than their without-fiber counterparts, i.e., GC-0F-0E (860 kN) and GCD-0F-0E (790 kN).
The fiber-reinforced specimens of group GC, GC-0.75F-15E, GC-0.75F-35E, and GC-0.75F-50E, attained maximum loads of 729 kN, 460 kN, and 340 kN, respectively, indicating a 27%, 35%, and 36% increase in load-carrying capacity as compared to their without-fiber counterparts, viz., GC-0F-15E (570 kN), GC-0F-35E (335 kN), and GC-0F-50E (250 kN). The load-carrying capacities of GCD columns, i.e., GCD-0.75F-15E (655 kN), GCD-0.75F-35E (390 kN), and GCD-0.75F-50E (265 kN), have been increased by 27%, 33%, and 33%, respectively, than their without-fiber counterparts, viz., GCD-0F-15E (515 kN), GCD-0F-35E (292 kN), and GCD-0F-50E (201 kN). The trend of load enhancements in fiber-reinforced specimens of group GC was almost identical to those of group GCD specimens.
3.3. Visual Observation and Failure Modes
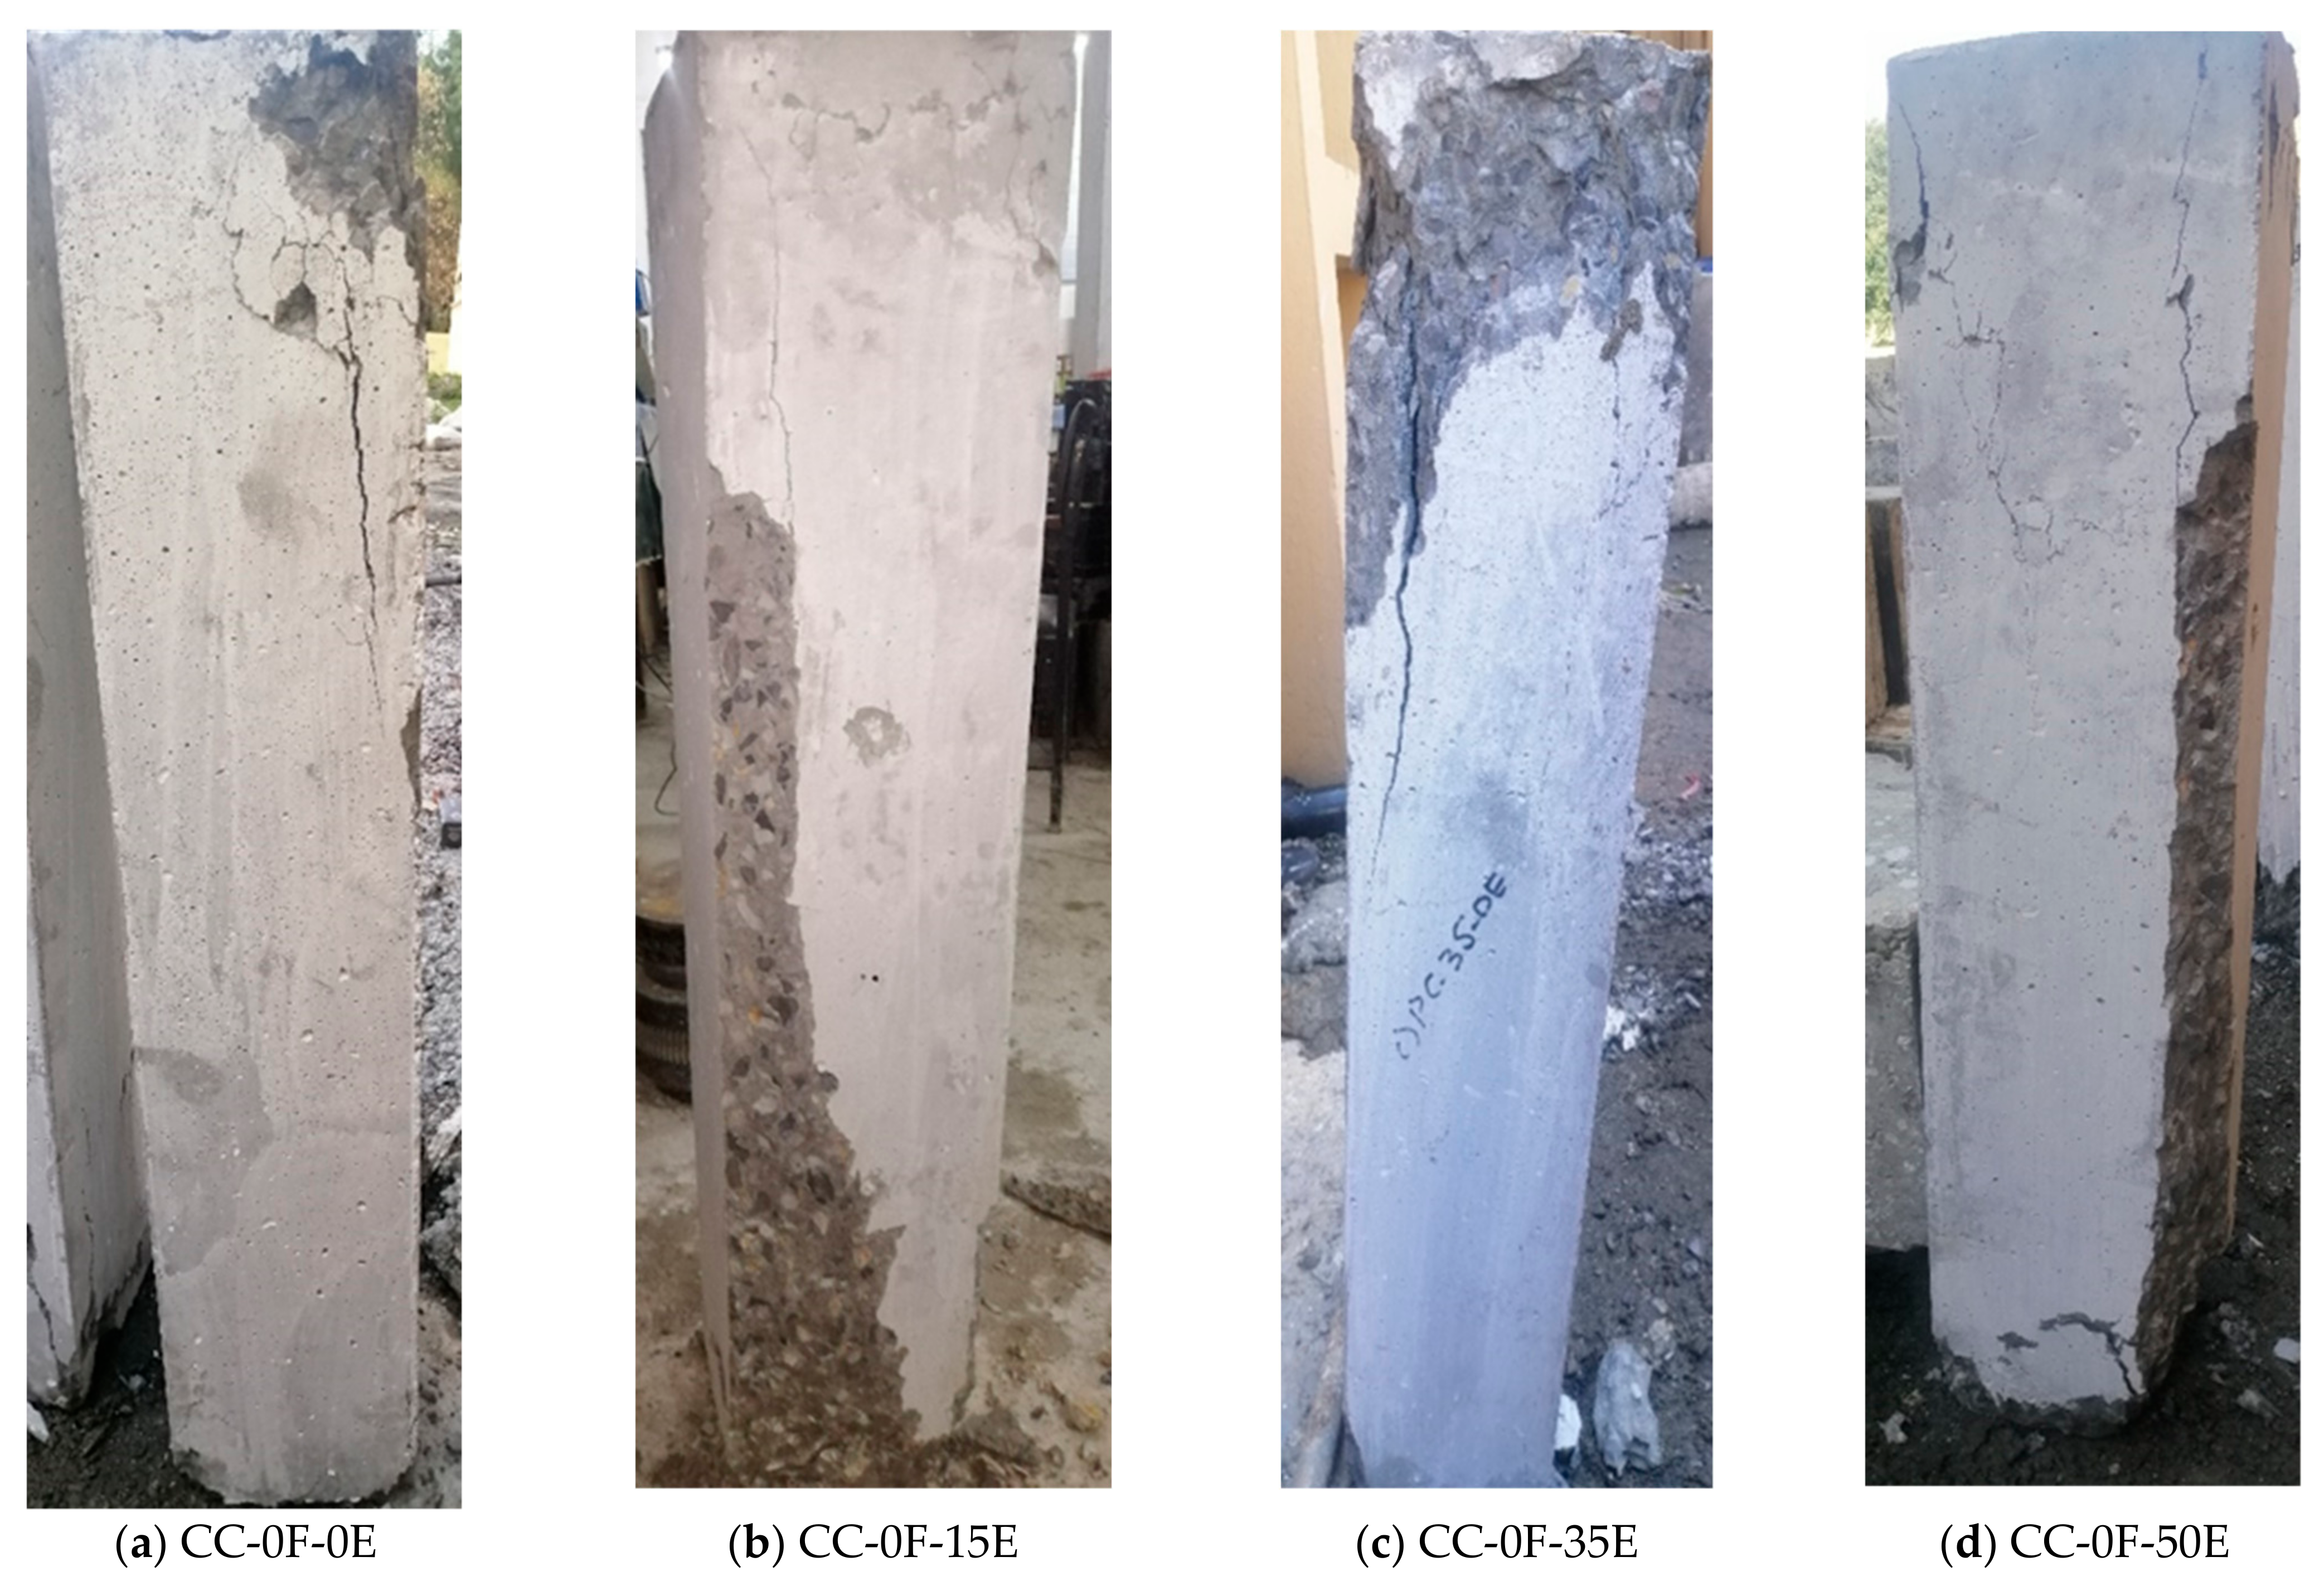
Figure 6, Figure 7 and Figure 8 show the post-failure overview of the tested columns of CC, GC, and GCD groups, respectively. The key factors that affected the failure modes of tested columns are the existence of steel fibers and loading conditions. A sudden brittle failure was observed in all the columns subjected to concentric loading with lower residual loading capacity. The concentrically loaded specimens were failed abruptly by concrete crushing, whereas typical flexural failure mode was observed in columns subjected to eccentric loading. Firstly, longitudinal cracks were observed in eccentrically loaded columns. The initial cracks were formed in between a region of 100–200 mm from the mid-height section to the ends of columns. On increasing the load, these longitudinal cracks extended along the height of the column, followed by concrete crushing. The location of the failure zone in tested columns varies from the mid-height section to an extreme of 350 mm below or above mid-height. The failure mode and crack pattern of tested columns varied depending on the eccentricity. By comparing the failure modes of columns tested under different eccentricities, it was observed that the number of cracks increased with the increase in eccentricity. The spalling of concrete cover was observed in all plain CC, GC, and GCD tested columns. It was also observed that the cover concrete of all specimens (without fibers) spalled out in between a region of 200–300 mm from the ends of columns, while the core concrete was intact. On the contrary, no cover spalling was observed in all fiber-reinforced GC and GCD columns.
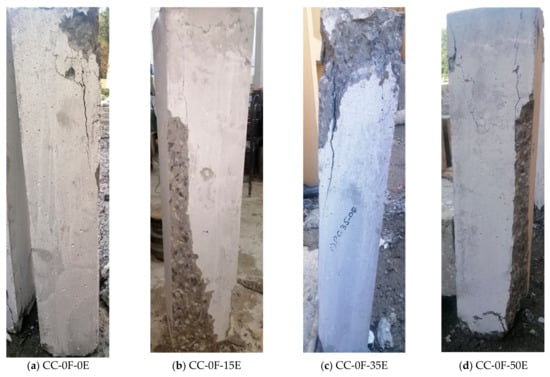
Figure 6.
The failure mode of conventional concrete (CC) columns after the test.
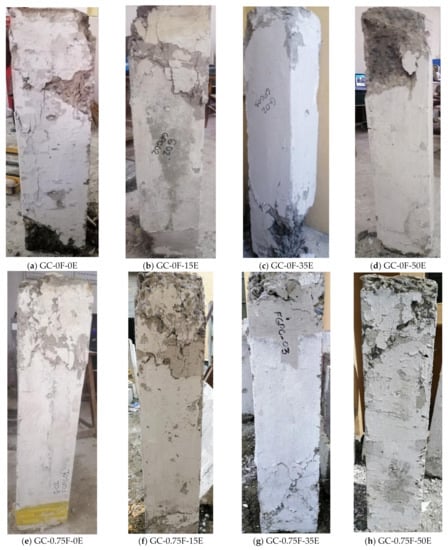
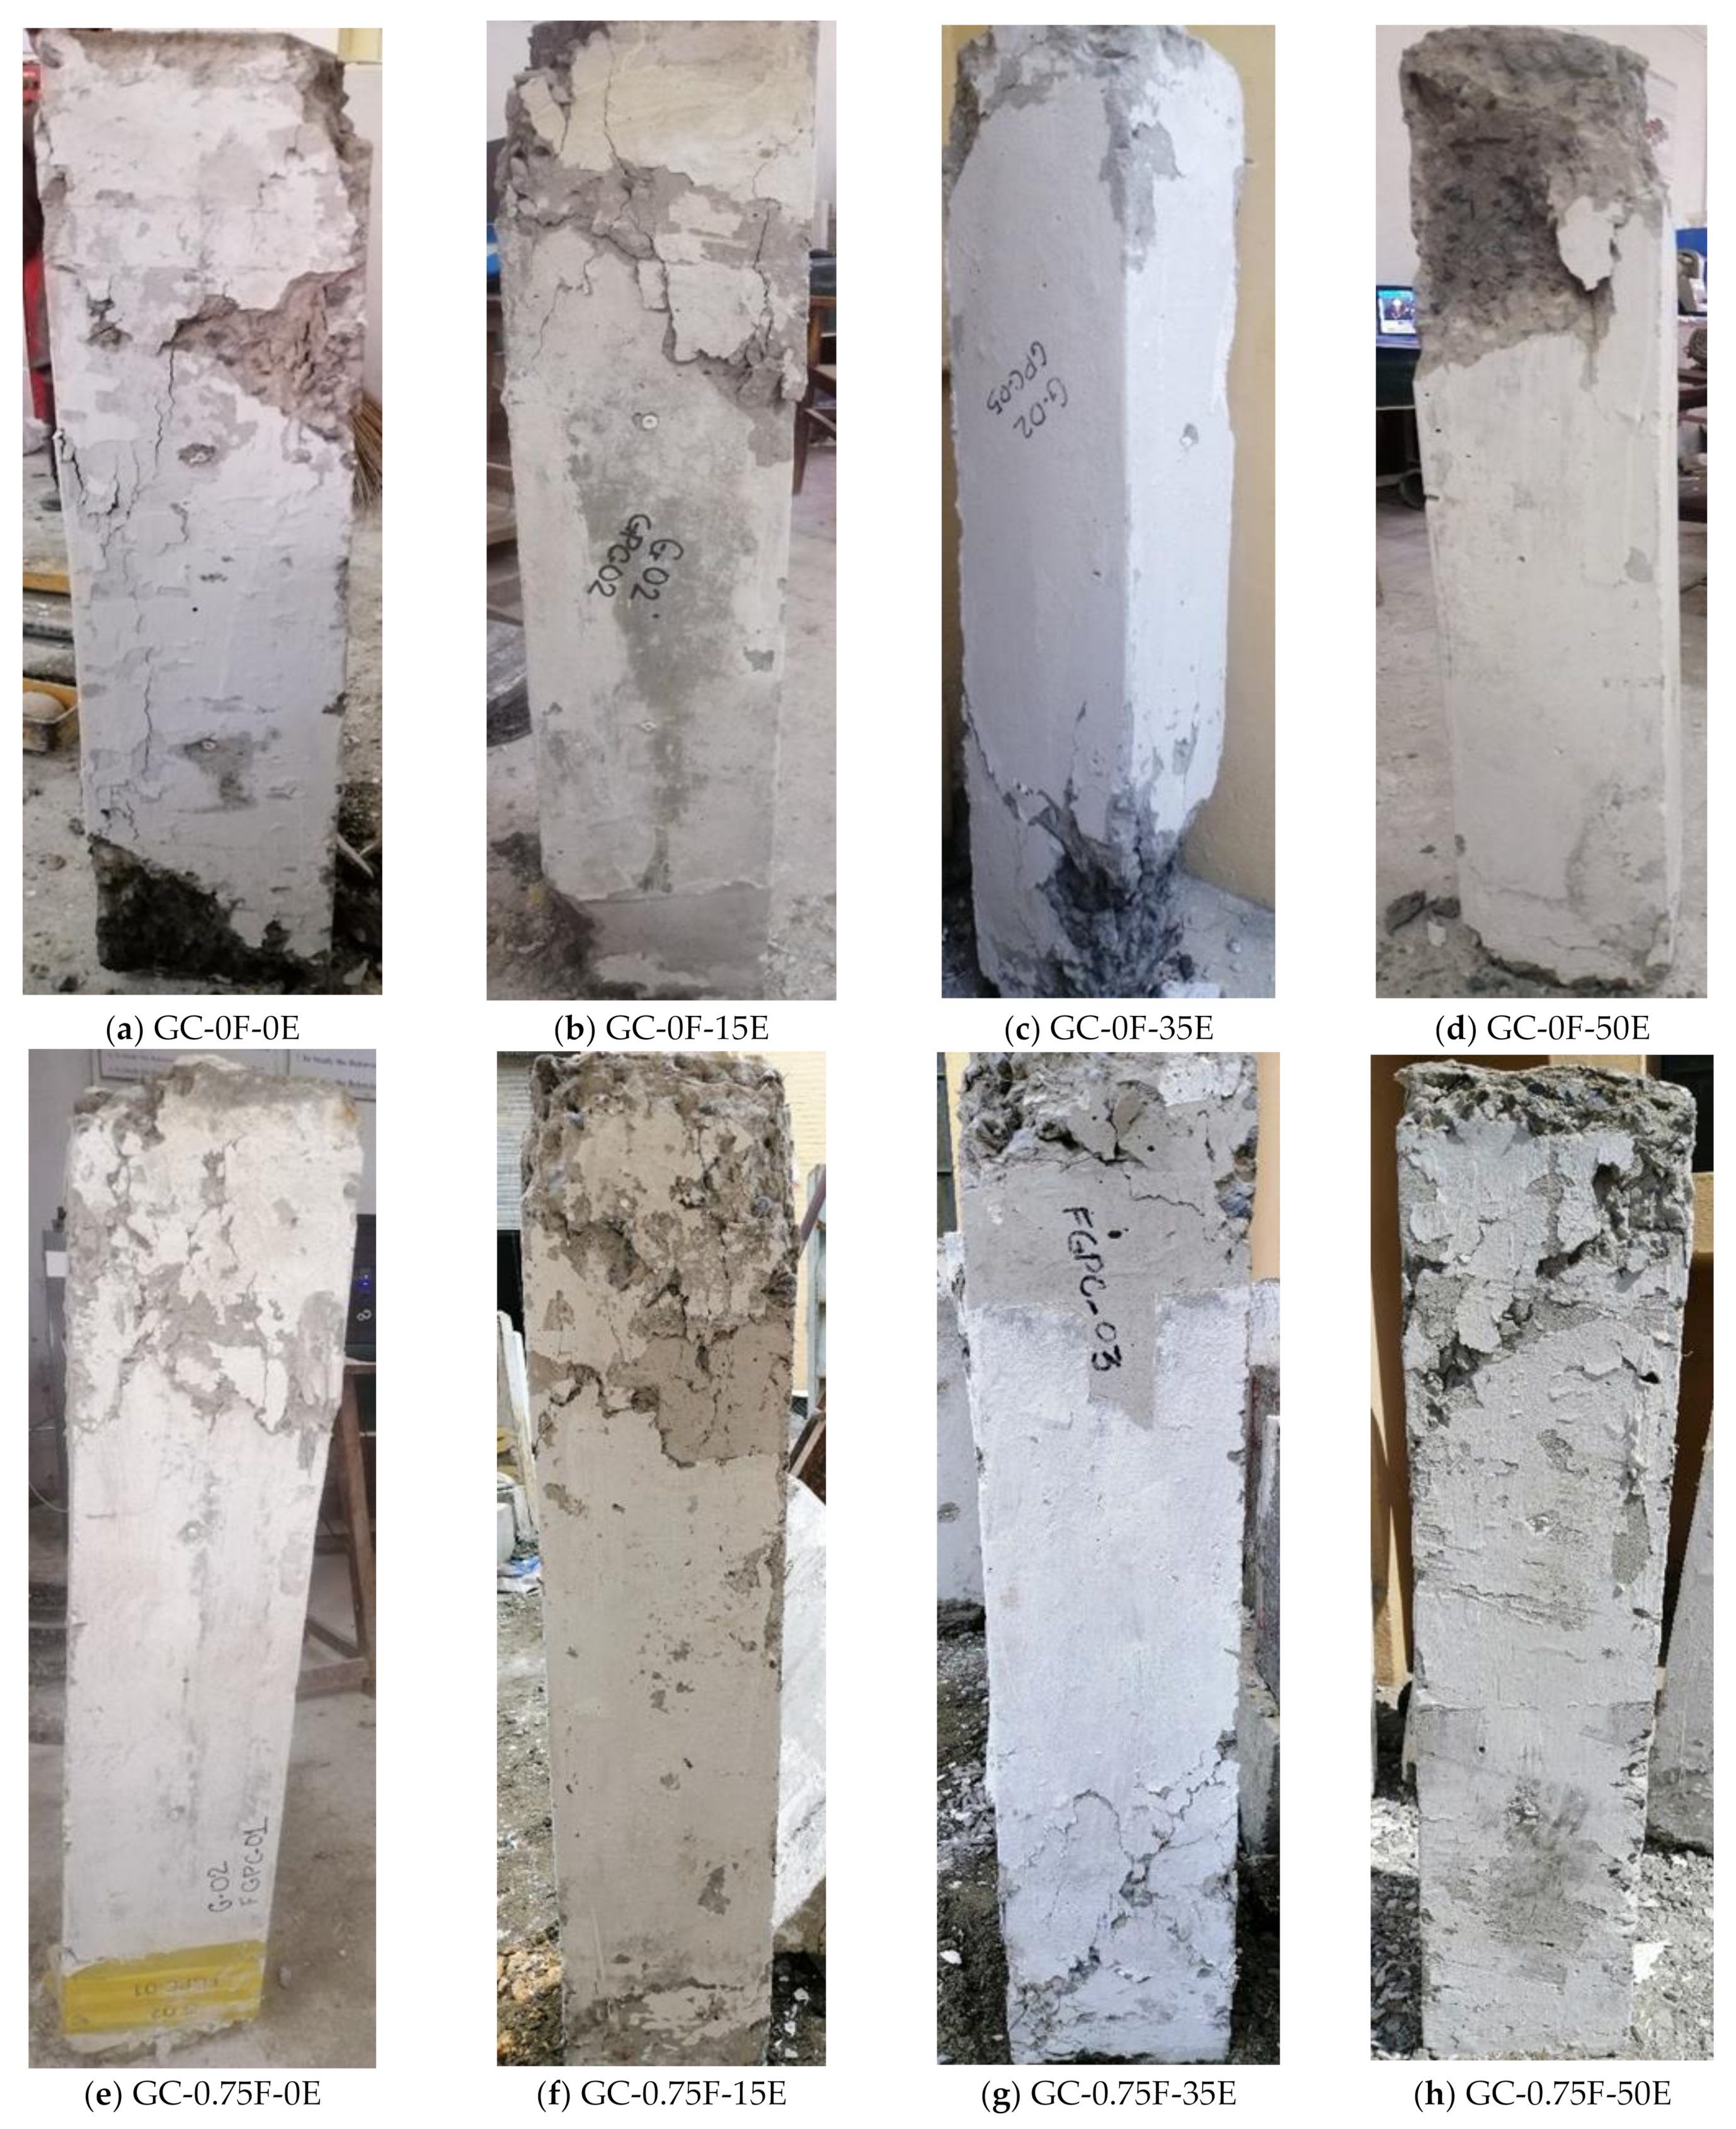
Figure 7.
The failure mode of GC columns after the test.
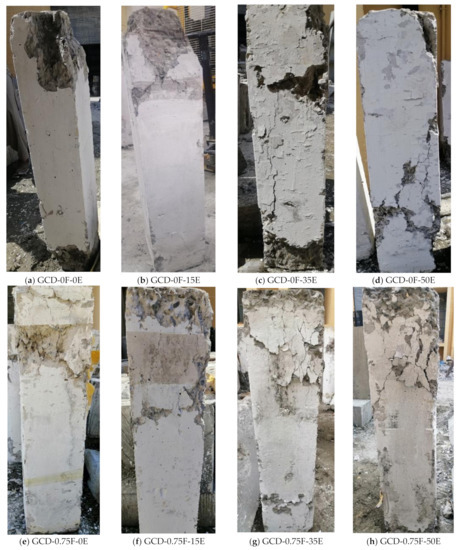
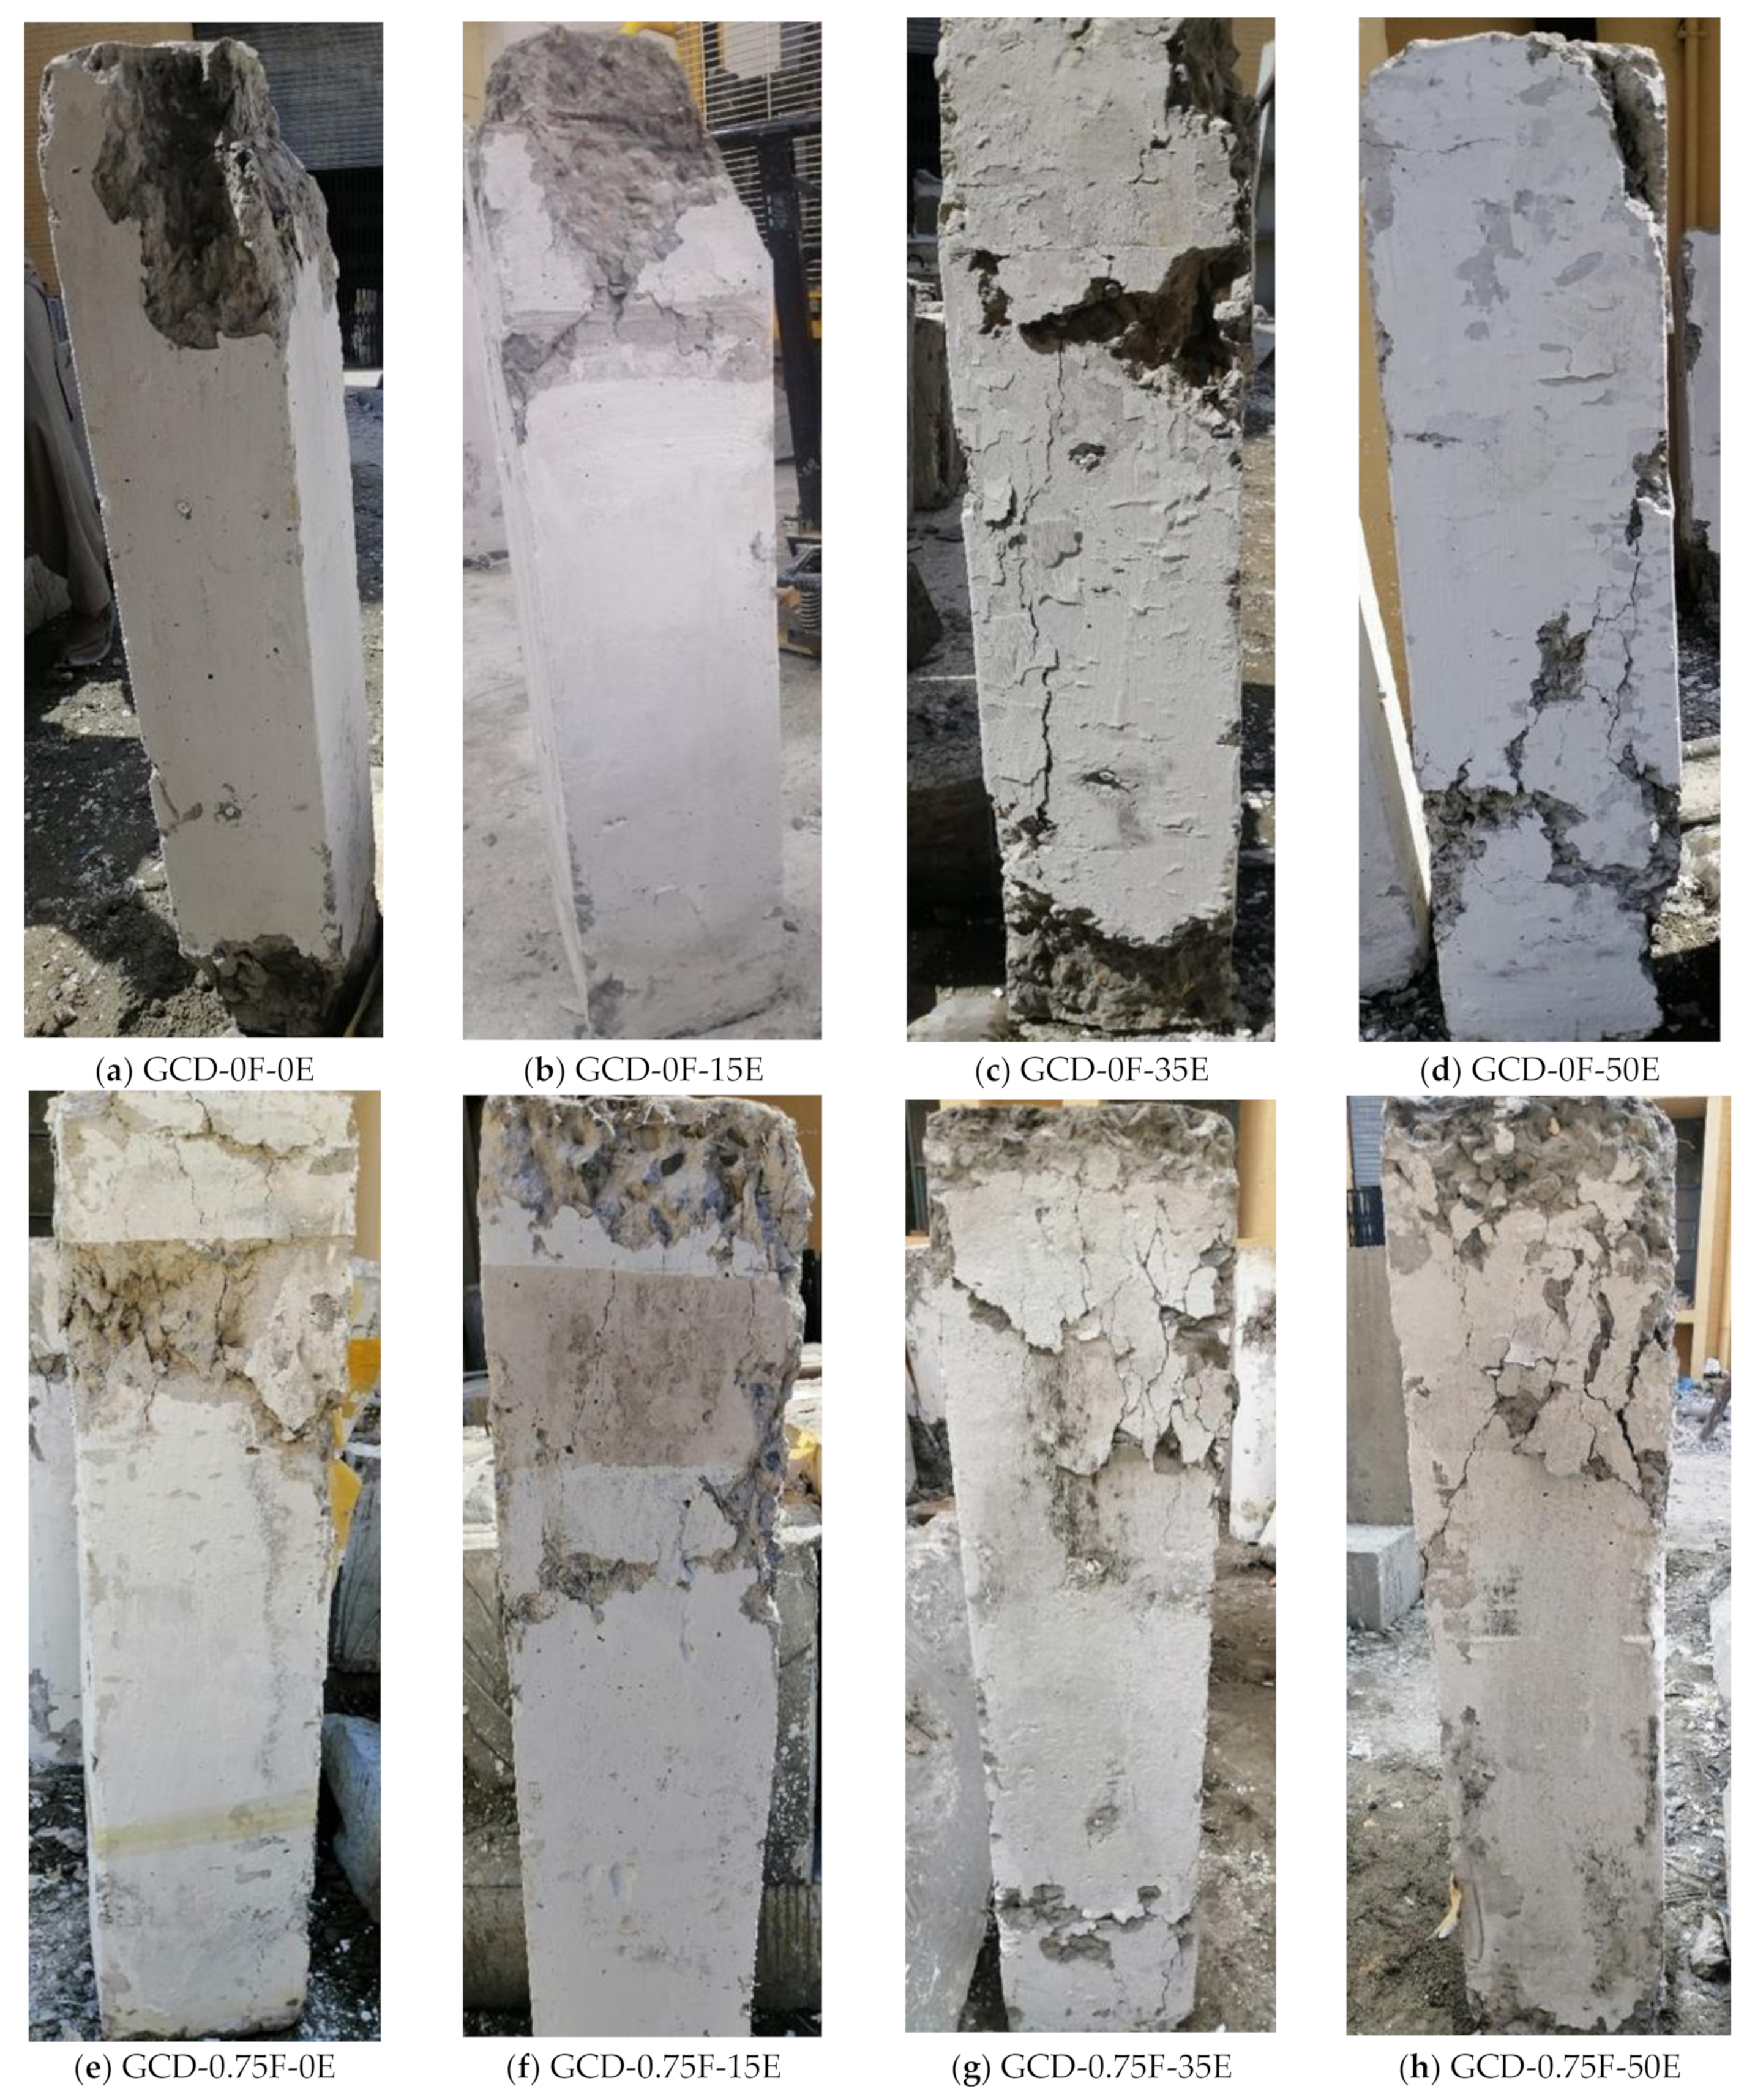
Figure 8.
The failure mode of GCD columns after the test.
All the fiber-reinforced columns of GC and GCD groups were failed in a similar manner. The columns tested under concentric loading (GC-0.75F-0E and GCD-0.75F-0E) experienced a brittle failure mode with localized concrete crushing at the top or bottom face of the column. Meanwhile, the columns tested under eccentric loading were failed with the development of longitudinal flexural cracks, followed by disintegration of the concrete cover. The failure modes of all fiber-reinforced columns of GC and GCD groups are shown in Figure 7 and Figure 8, respectively. The axial load-displacement response of CC, GC and GCD group columns are presented in Figure 9, Figure 10 and Figure 11. The cracking can be observed throughout the surface of all fiber-reinforced GC and GCD columns. Firstly, longitudinally, cracks were developed either at the top or bottom end of the fiber-reinforced columns. As the load was increased gradually, these longitudinal cracks were prolonged along the height of columns, followed by the disintegration of the concrete cover. All the fiber-reinforced specimens were characterized by the formation of surface cracks around one-third height from the support. The general behavior of the GC group columns is observed to be similar to that of GCD group columns, in which the peak axial load (Pmax) and axial displacement at peak axial load decreases with an increase in the load eccentricities (15 to 35 and 50 mm), as depicted in Figure 10 and Figure 11, respectively. Meanwhile, the lateral displacement tends to increase with the increase of eccentricity due to the tendency of columns to buckle under eccentric loading, as shown in Figure 12 and Figure 13.
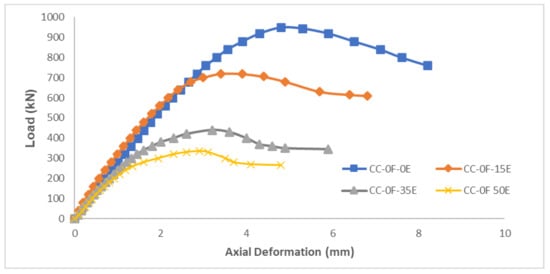
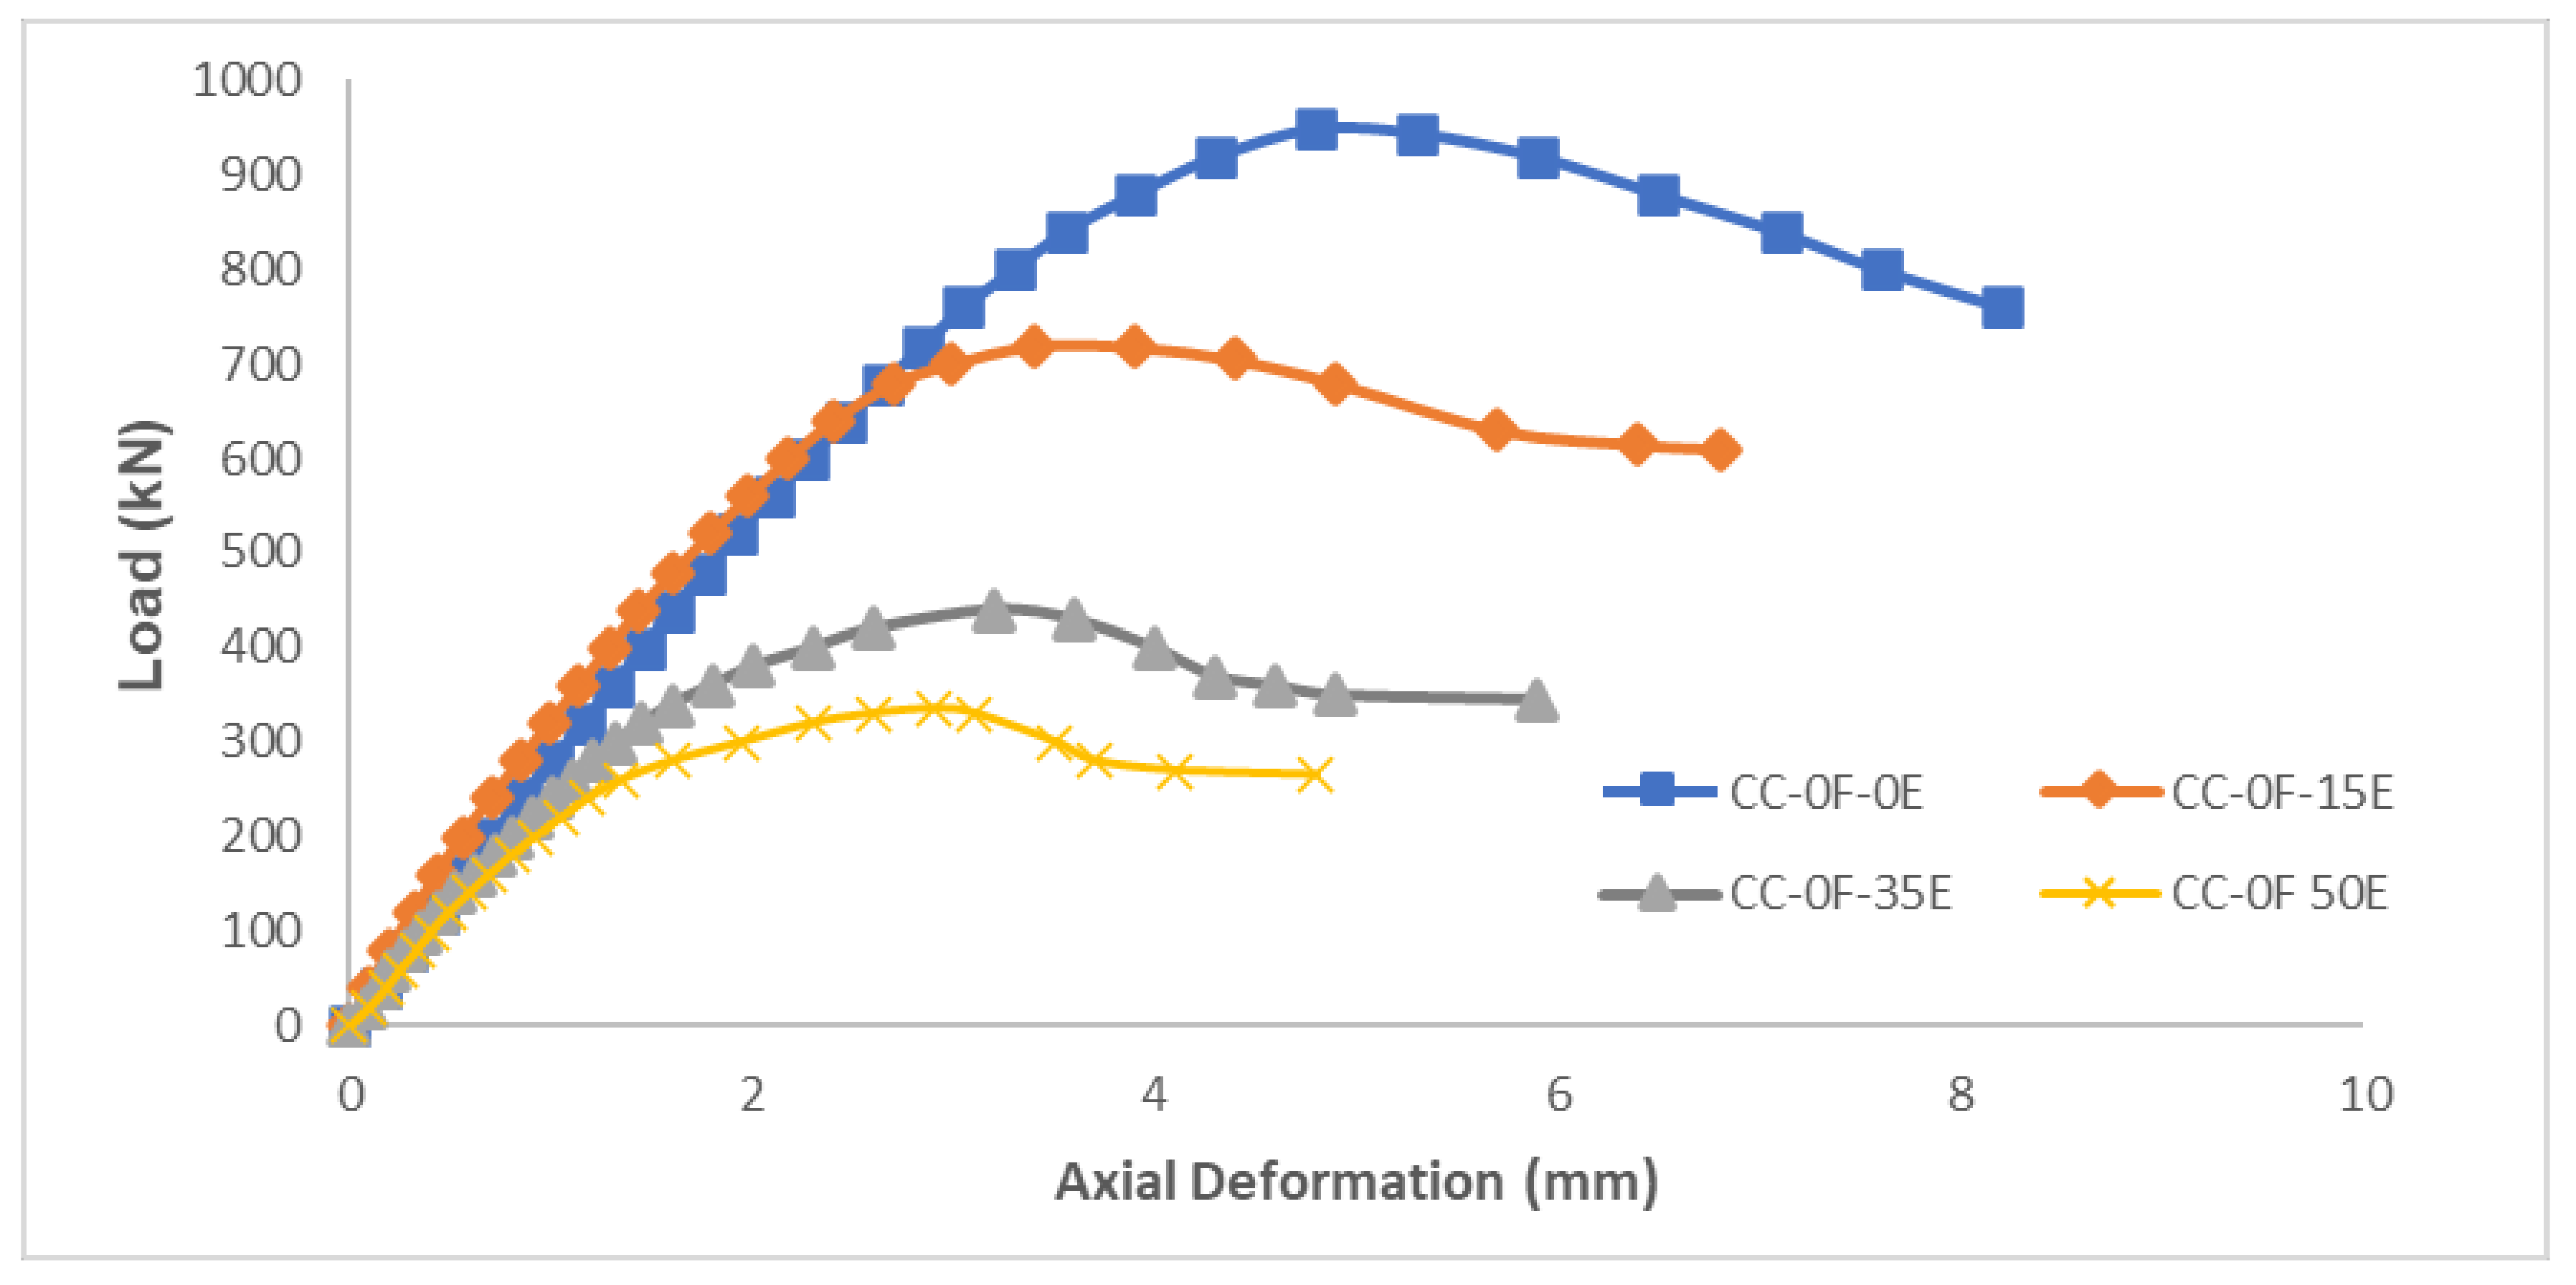
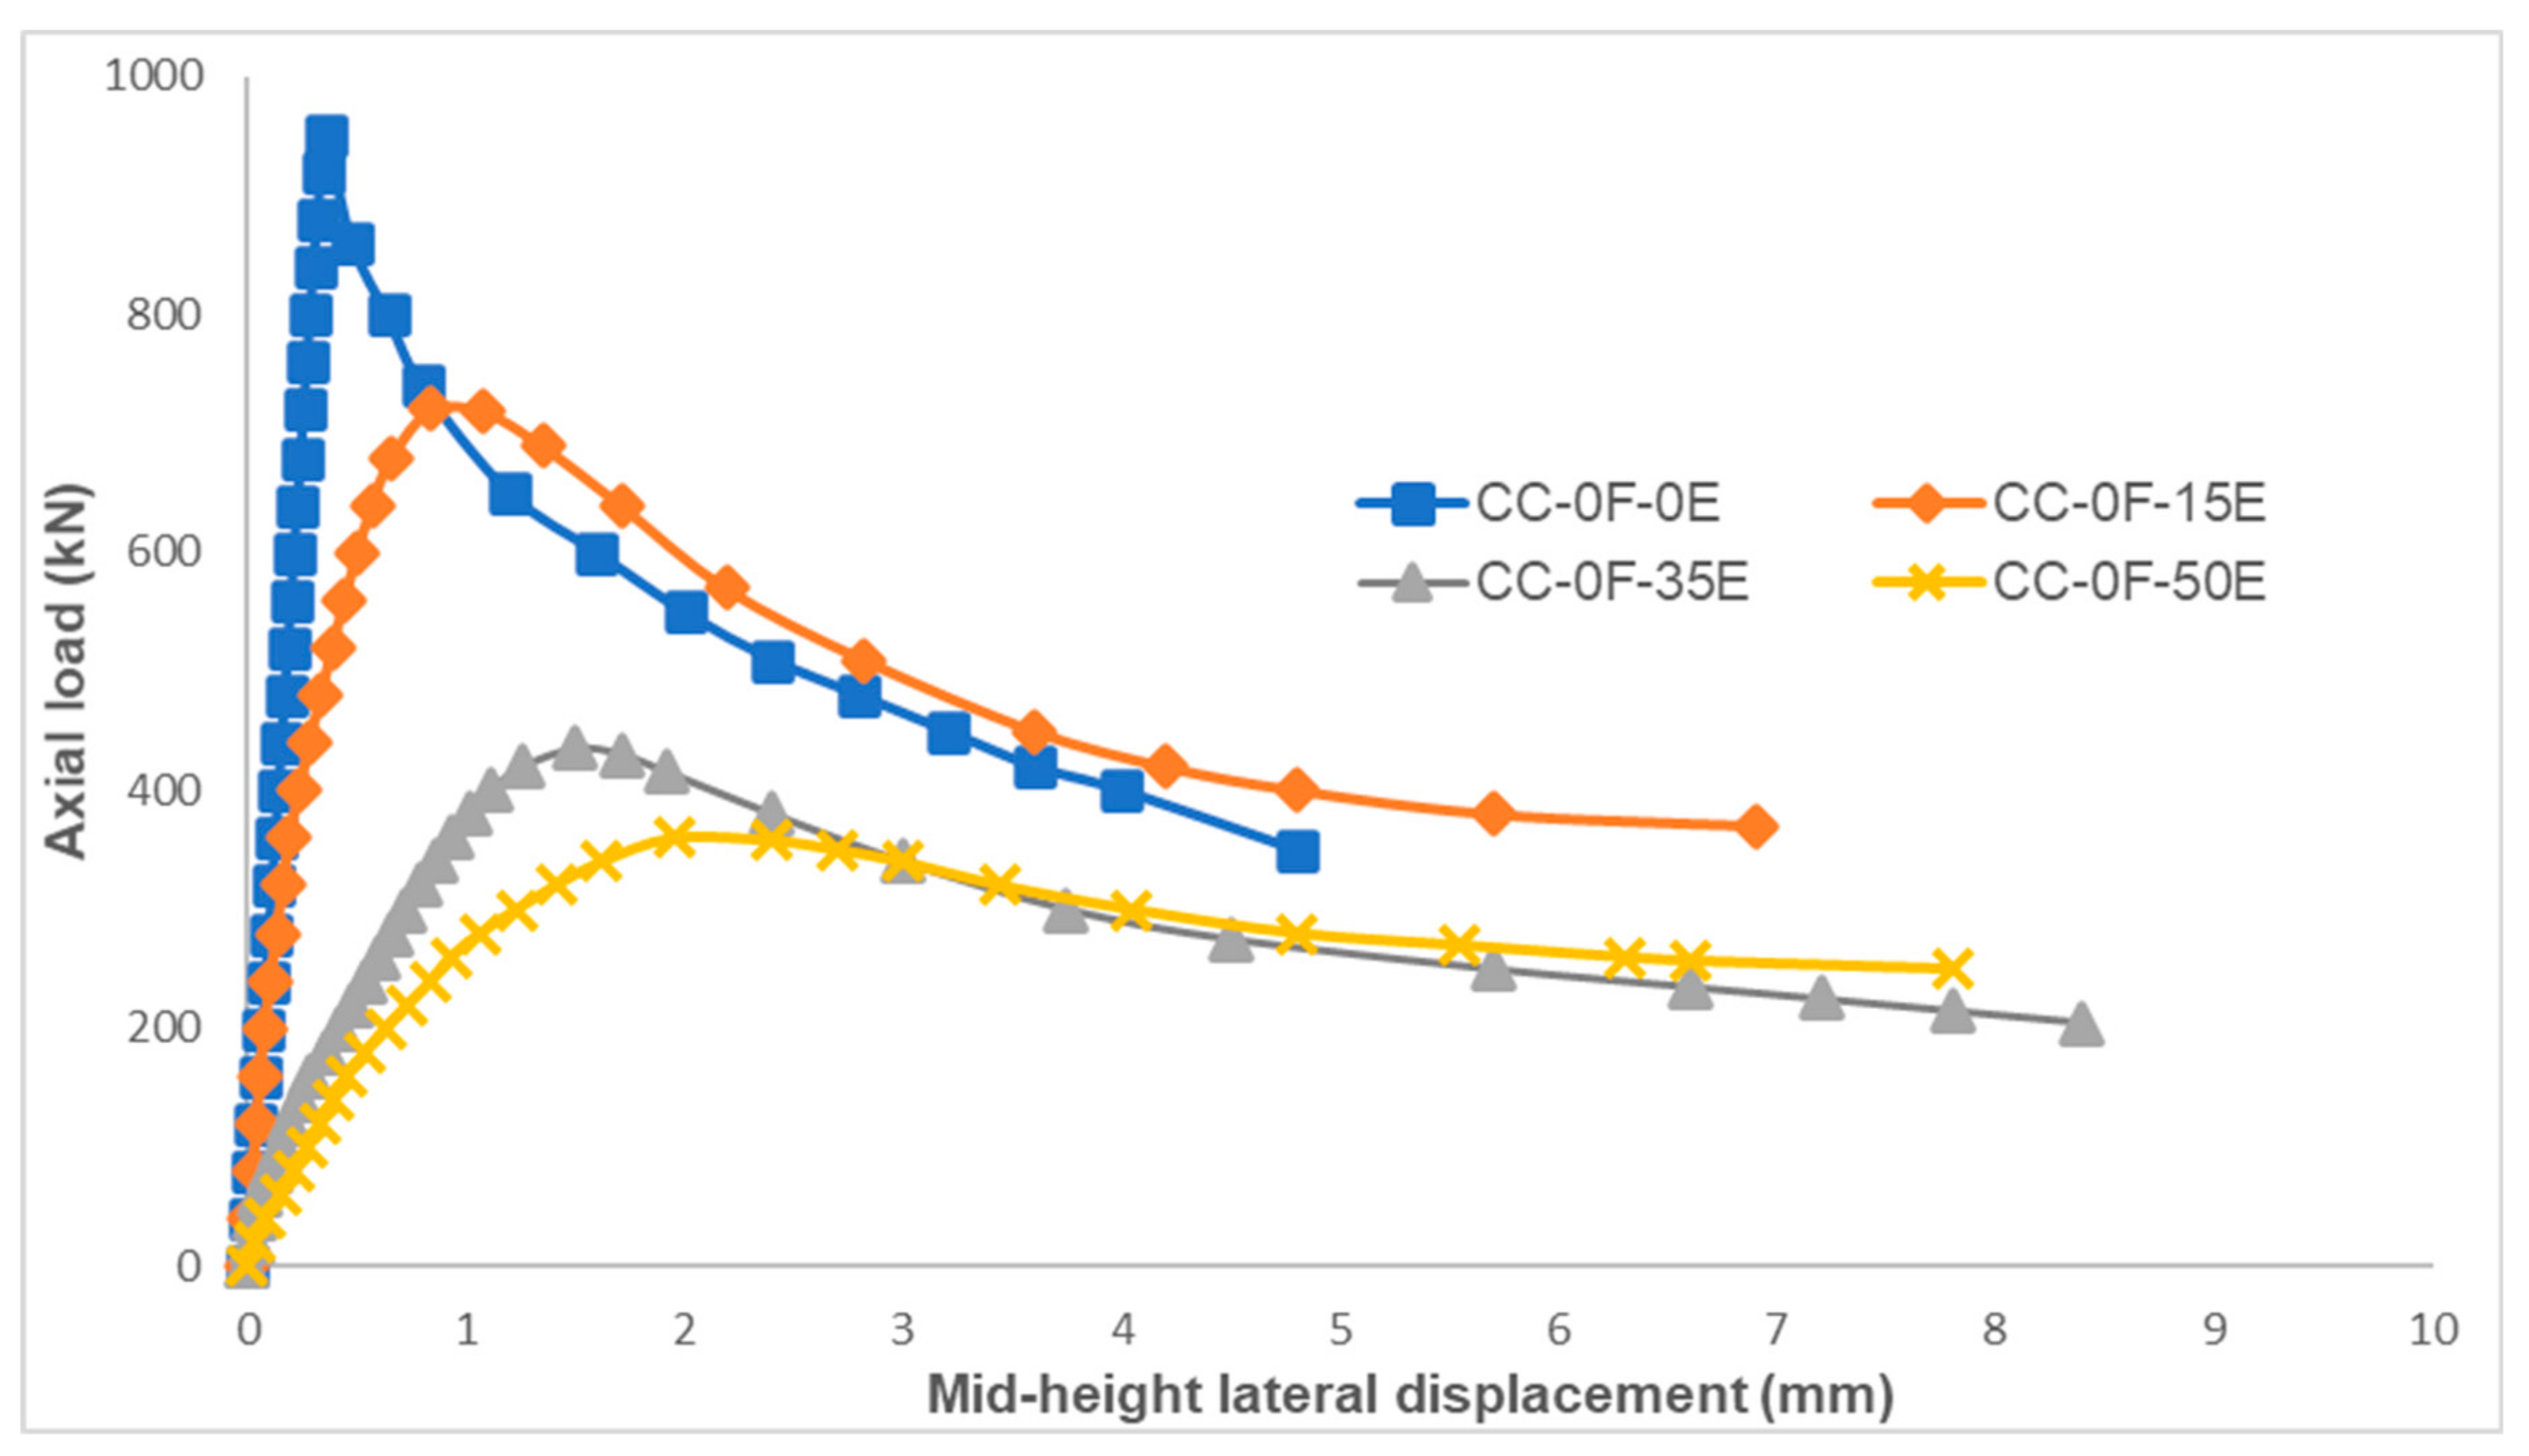
Figure 9.
The axial load–axial displacement behavior of CC columns.
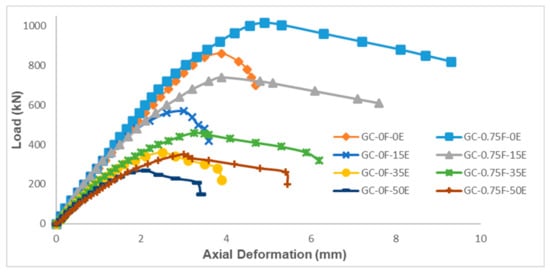
Figure 10.
The axial load–axial displacement behavior of GC columns.
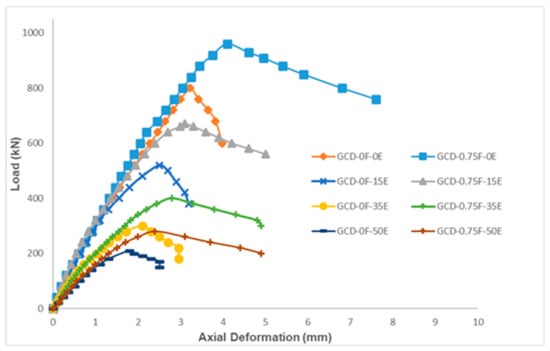
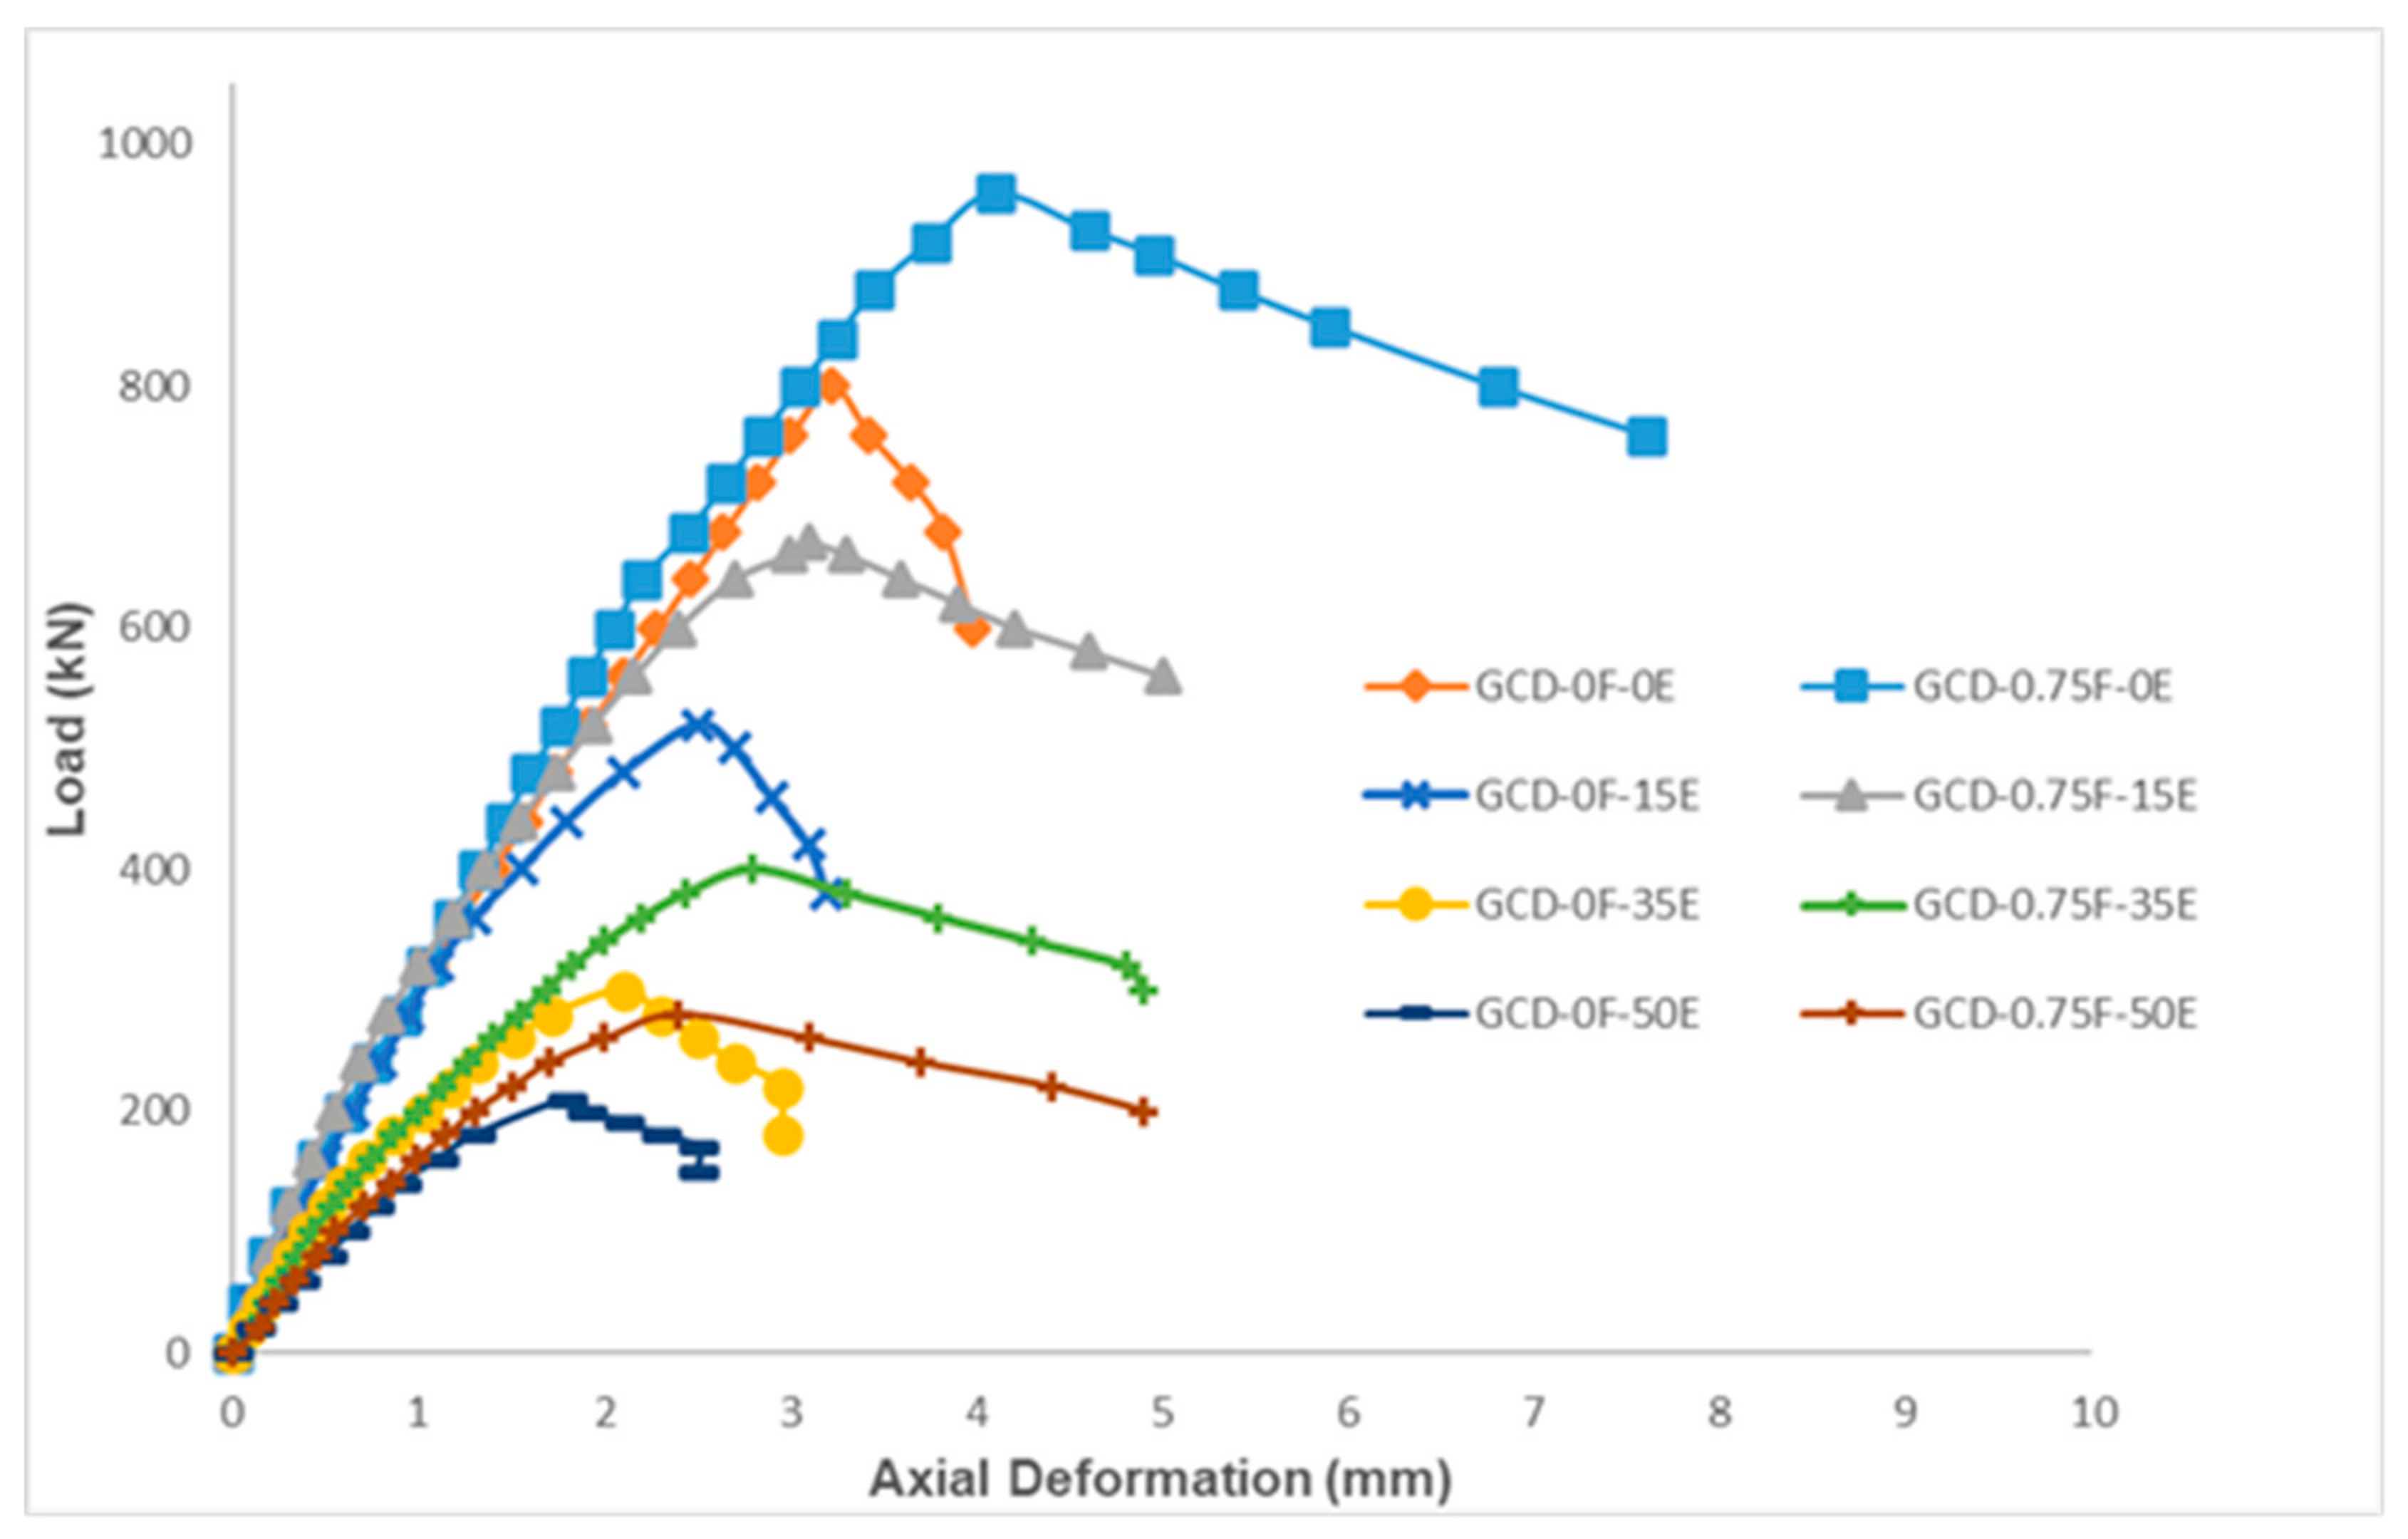
Figure 11.
The axial load–axial displacement behavior of GCD columns.
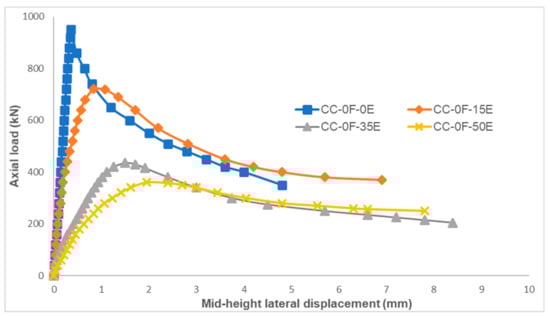
Figure 12.
The axial load–lateral displacement behavior of CC columns.

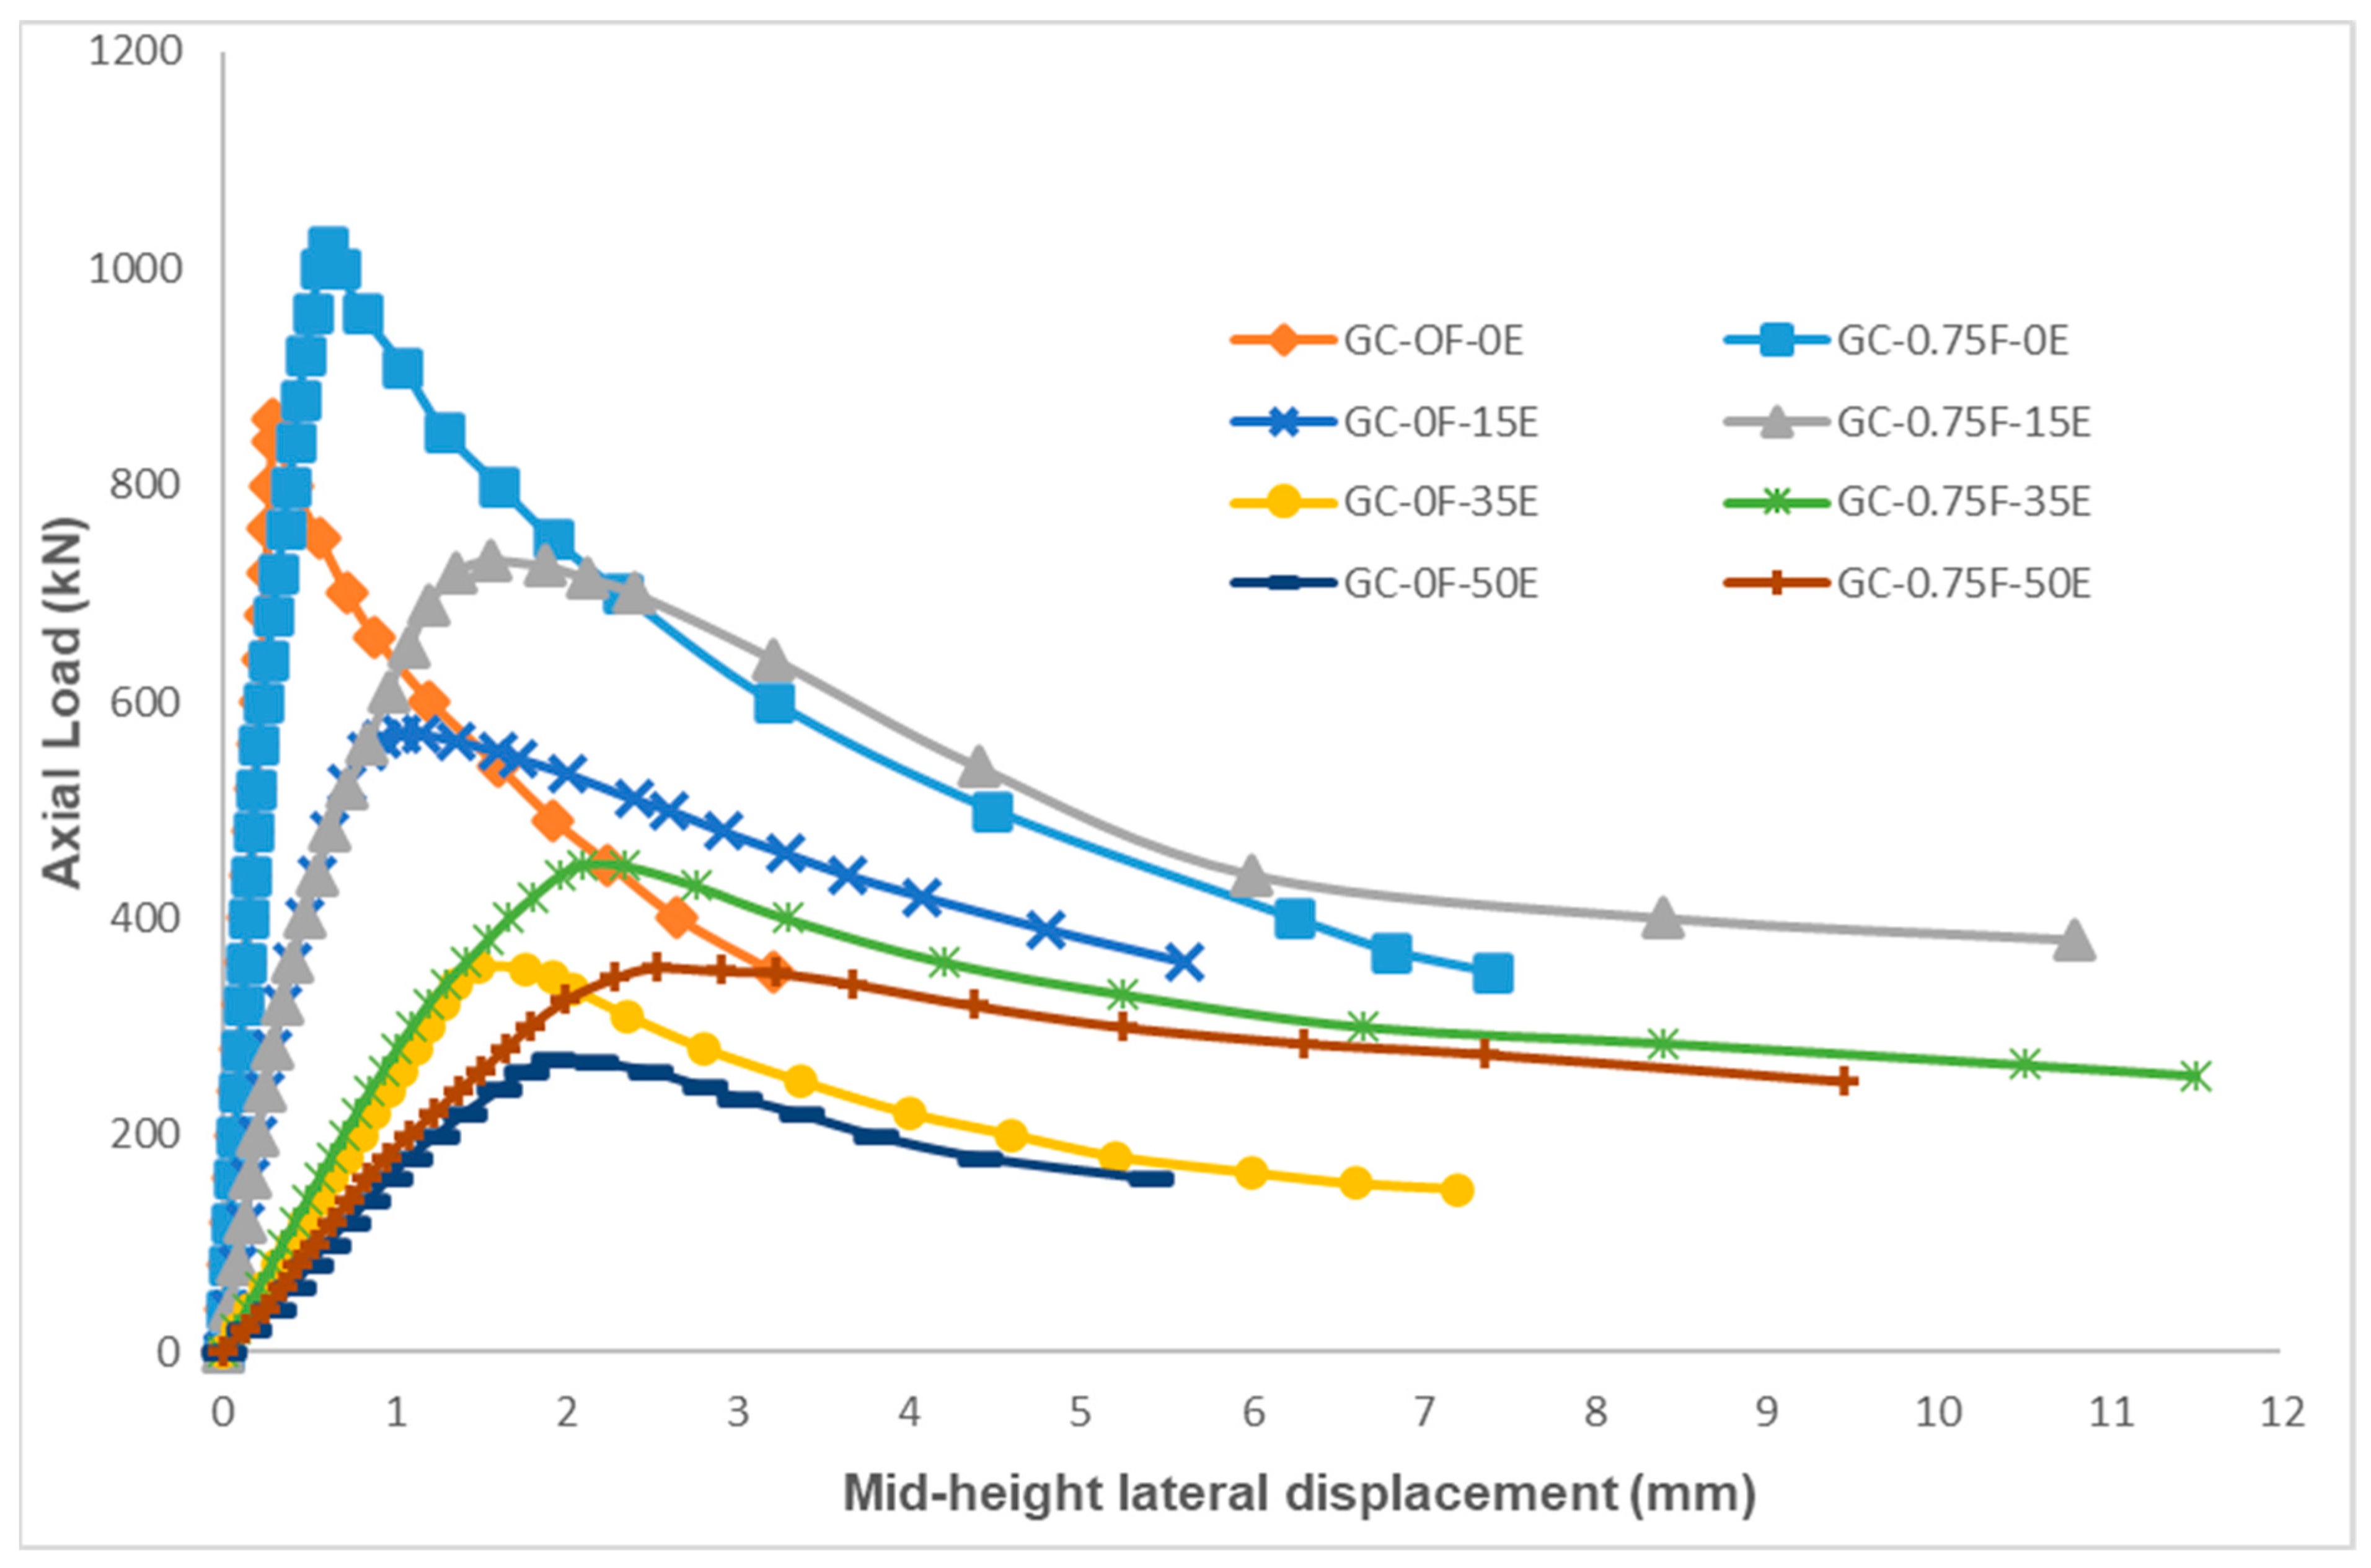
Figure 13.
The axial load–lateral displacement behavior of GC columns.
3.4. Axial Load–Displacement Behavior
Figure 9, Figure 10 and Figure 11 illustrate the axial load–axial displacement behaviors of the columns in CC, GC, and GCD groups, respectively, tested under concentric and eccentric (15, 35, and 50 mm) axial loads. The columns CC-0F-0E in CC group; GC-0F-0E and GC-0.75F-0E in GC group; and GCD-0F-0E and GCD-0.75F-0E in GCD group were subjected to concentric axial loading. It can be noted from Figure 9, Figure 10 and Figure 11 that the initial ascending phase of the load–displacement responses of the columns subjected to concentrical loading test was nearly linear till the point of peak axial load. The compressive strength of the core concrete mainly played a dominant role in this phase of the load–displacement curve. The concrete cover of the tested columns was not spalled off till the maximum axial load was attained. However, hairline cracks were observed on the face of columns at 90% of the ultimate load. When the ultimate load-carrying capacity was attained, plain columns of CC, GC, and GCD groups exhibited a drop in the axial load, owing to the spalling-off of concrete cover, whereas a mere disintegration of the cover concrete was observed in the fiber-reinforced GC and GCD columns.
The columns GC-0F-0E and GC-0F-15E experienced a sudden drop in the descending phase of the load–displacement curve after attaining the ultimate load-carrying capacity. This rapid decline can be attributed to the sudden spalling of the concrete cover at the top and bottom ends of the GC-0F-0E and GC-0F-15E specimens. All the plain specimens of GCD group, i.e., GCD-0F-0E, GCD-0F-15E, GCD-0F-35E, and GCD-0F-50E, experienced an immediate decline in the descending phase of the load–displacement curve, owing to the cover concrete spalling detected in these columns after reaching the peak load capacity. However, the fiber-reinforced columns GC-0.75F-0E, GC-0.75F-15E, GC-0.75F-35E, and GC-0.75F-50E exhibited a steady drop in the load-carrying capacity till the point of failure. Due to the presence of steel fibers, the brittle behaviors of the GC specimens were changed to gradual flexure behavior owing to the confinement effect provided by the fibers. The addition of fibers in these specimens, i.e., GC-0.75F-0E, GC-0.75F-15E, GC-0.75F-35E, and GC-0.75F-50E, resulted in improving the ductility by 55%, 40%, 35%, and 25%, respectively, which is higher than the corresponding specimens with no fibers in the same group.
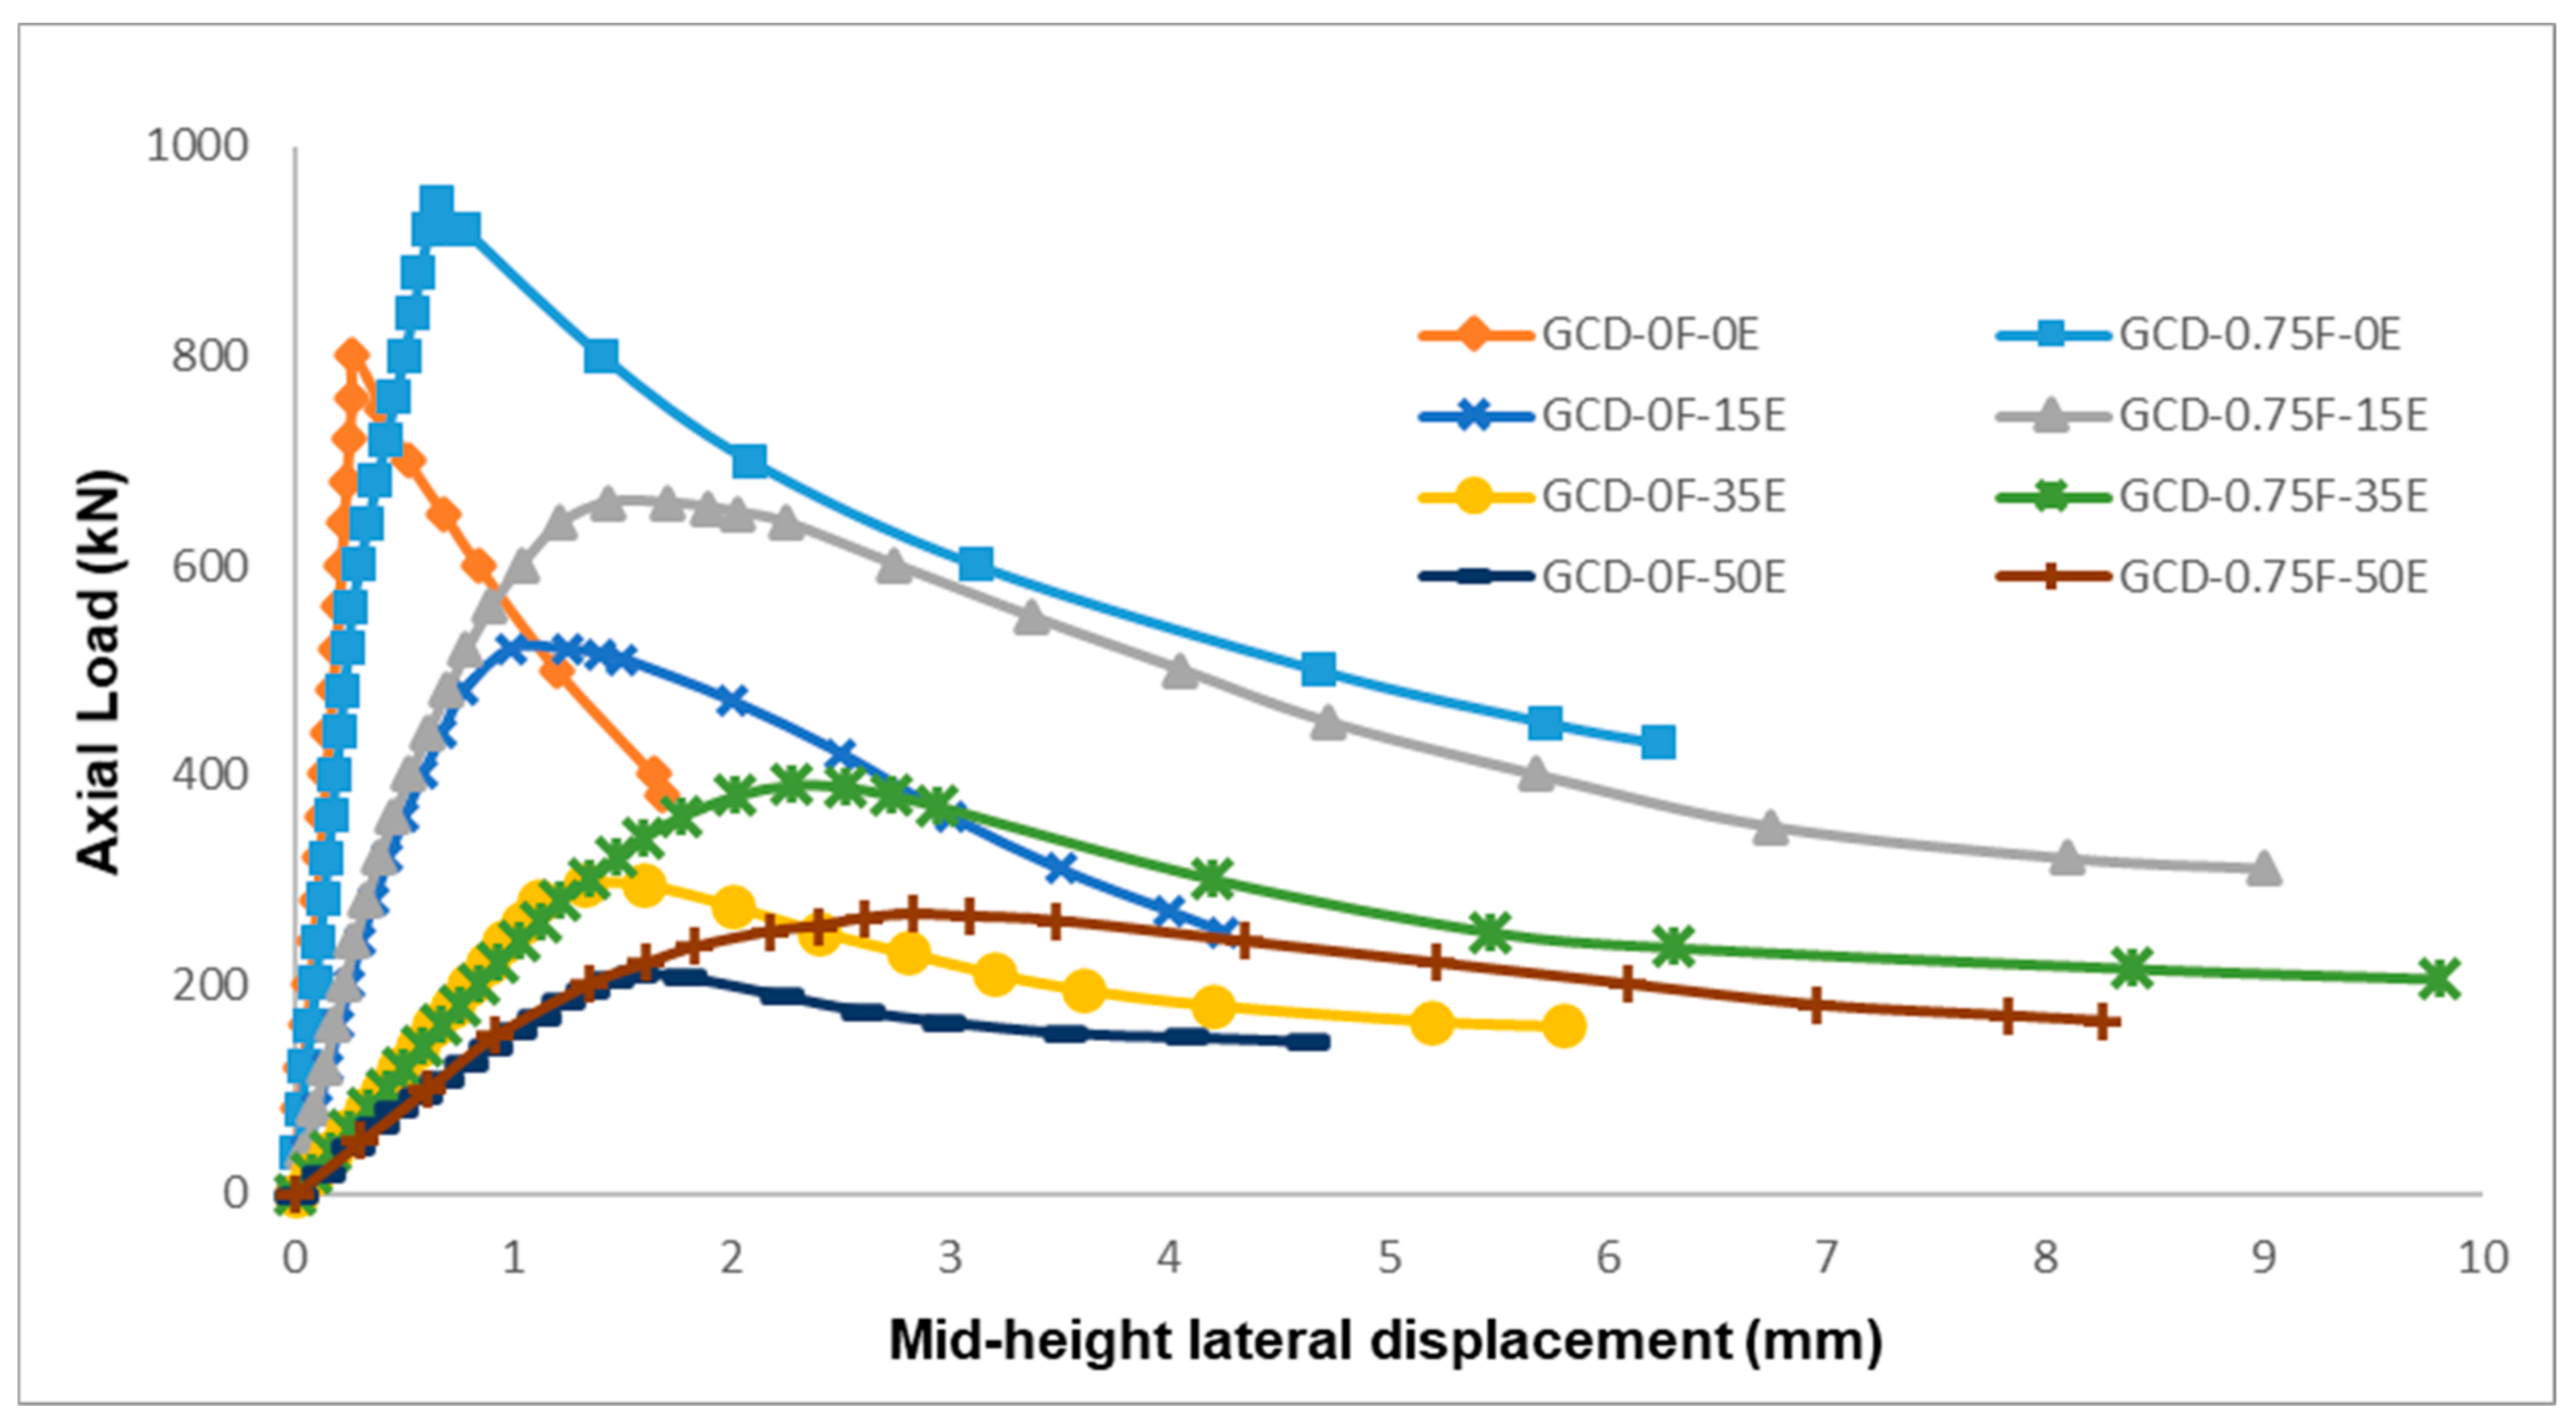
The variation of mid-height lateral deformation of the tested specimens with applied axial load is presented in Figure 12, Figure 13 and Figure 14. It is obvious that the general behavior of concentrically tested columns of CC, GC, and GCD groups is different to that of the columns tested under eccentric loading. The concentrically tested columns (i.e., CC-0F-0E, GC-0F-0E, and GCD-0F-0E) were observed to fail in a brittle manner as the peak load dropped abruptly after the ultimate load was reached. All the plain columns in the GC and GCD groups exhibited an abrupt drop in the descending phase of the axial load–lateral displacement curve after reaching the ultimate load. On the contrary, the fiber-reinforced specimens of both groups (GC and GCD) experienced a steady failure mode, as the load decline was steady with a prolonged plateau in the descending phase of the axial load–lateral displacement curve. It is evident from the axial load–lateral displacement behavior of all columns that the mid-height lateral displacements of the tested columns are increasing for all the specimens with the addition of fibers.
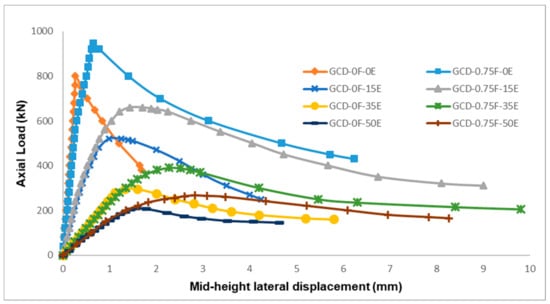
Figure 14.
The axial load–lateral displacement behavior of GCD columns.
It can be noted from Figure 13 and Figure 14 that fiber-reinforced specimens of GC and GCD groups exhibited more displacement than the corresponding plain columns in the same group. The addition of steel fibers considerably affected the post-peak load–lateral displacement behavior of the tested columns. The addition of steel fibers softens the descending phase of the axial load–lateral displacement response and restricted the abrupt failure of the tested specimens. The long plateau of the descending phase of the post-peak load–displacement response of the fiber-reinforced specimens suggested that the columns failed generally in a ductile manner. This might be attributed to the combined effect of steel fibers to delay the development of microcracks and arrest the spread of macrocracks that, in turn, improved the loading capacity and ductility of the columns [33].
3.5. Ductility of Specimens
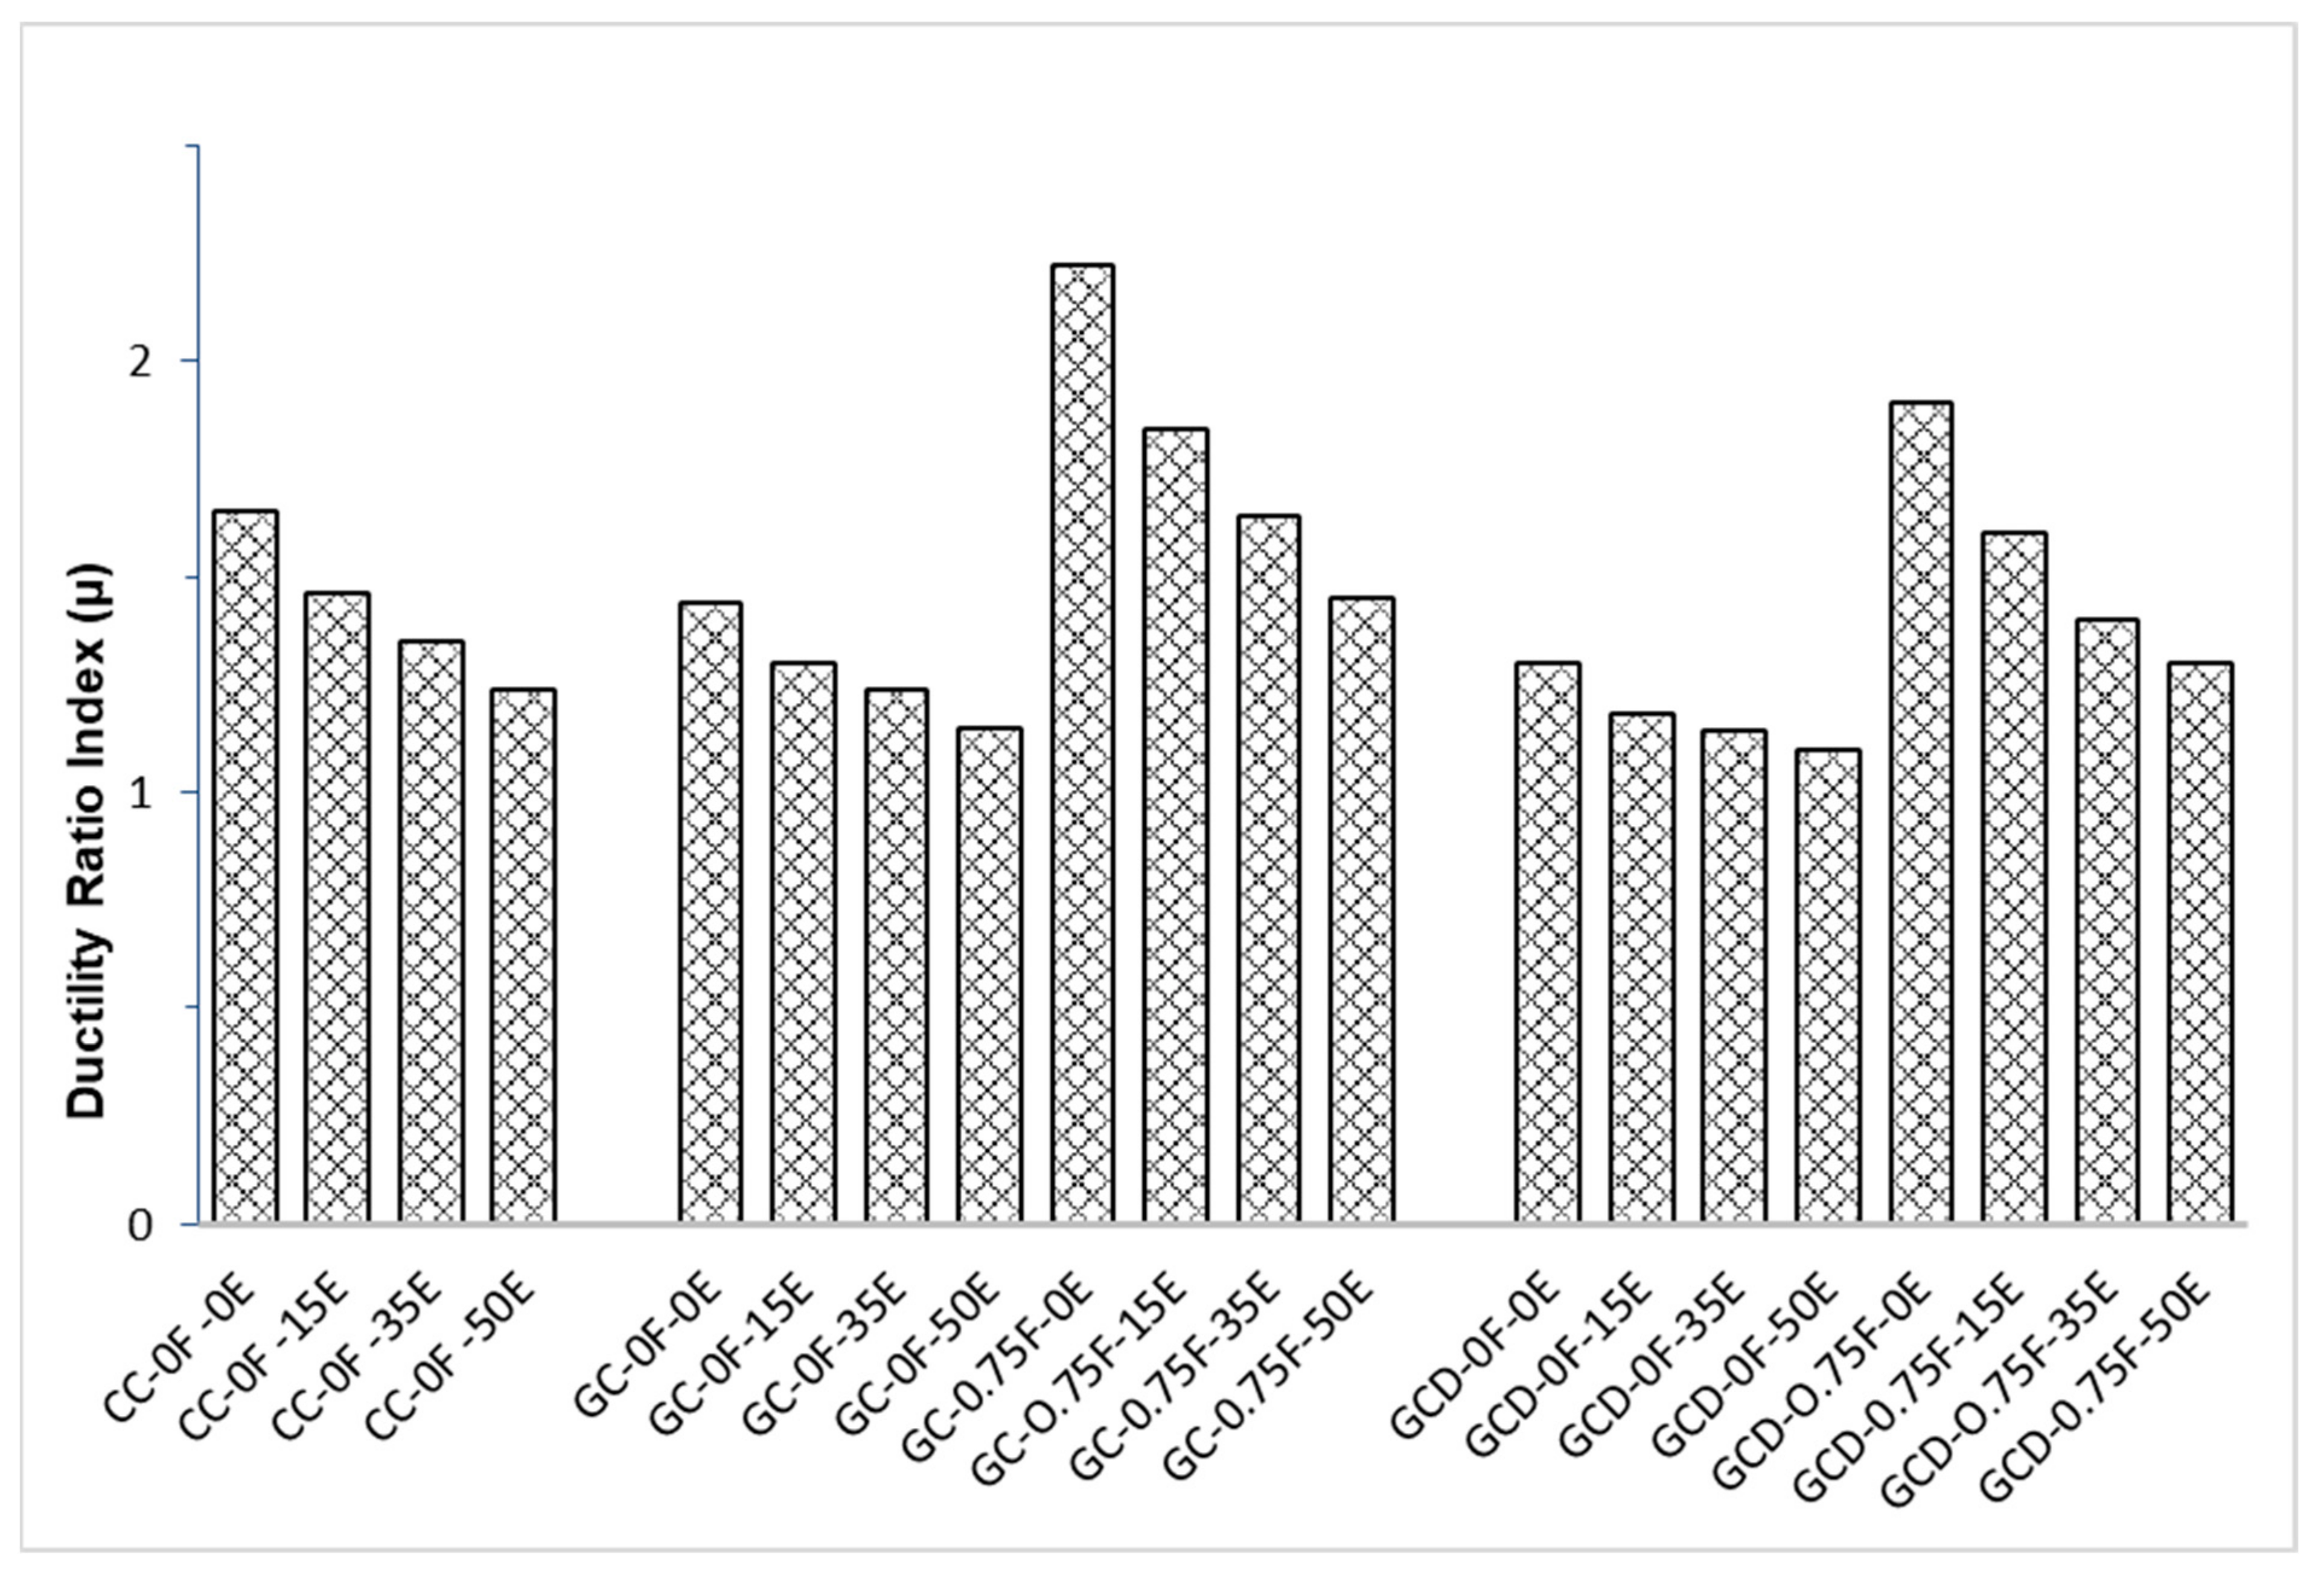
The behavior of the tested specimens in terms of ductility/brittleness was evaluated by calculating the ductility of the specimens, considering a displacement ductility ratio or index using Equation (1), as presented in Figure 4 [48,49,50]. The ductility index μ of all the columns from the test results are presented in Figure 15. It can be observed that ductility index of the tested columns was influenced by the amount of eccentricity (i.e., e = 0 to 15, 35, and 50 mm). The eccentricity has a negative effect on the ductility of columns, i.e., changing the eccentricity of the axial load from 0 to 15, 35, and 50 mm resulted in significant reduction in the ductility of the columns. For example, GC specimens, i.e., GC-0F-15E, GC-0F-35E, and GC-0F-50E tested under 15, 35, and 50 mm eccentricities, respectively, experienced an 18%, 26%, and 35% reduction in ductility in comparison to the concentrically (e = 0 mm) tested columns (GC-0F-0E). The drop in the load-carrying capacity and ductility of the tested specimens showed a similar trend for various eccentricities in GCD group columns.
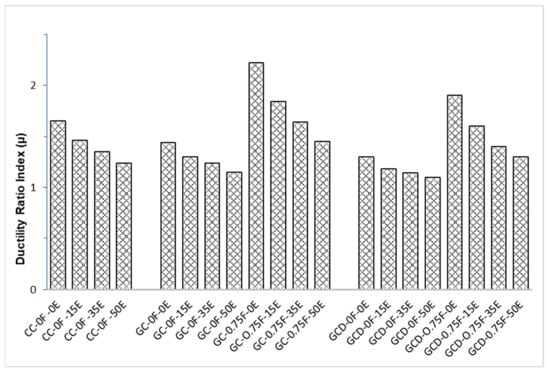
Figure 15.
The ductility index of CC, GC, and GCD columns.
It was observed that plain (without fibers) specimens of GC and GCD groups had a lower ductility index than their counterparts in the CC group. The ductility index of concentrically loaded plain columns in GC and GCD groups was 13% and 22% lower, respectively, than their counterparts in CC group columns. The ductility index of eccentrically loaded columns in the GC group, GC-0F-15E, GC-0F-35E, and GC-0F-50E, was decreased by 11%, 9%, and 8%, respectively, than CC-0F -15E, CC-0F-35E, and CC-0F-50E. The specimens of group GCD, i.e., GCD-0F-15E, GCD-0F-35E, and GCD-0F-50E, had 20%, 18%, and 12% lower ductility index, respectively, than their counterparts in CC group, viz., CC-0F -15E, CC-0F -35E, and CC-0F -50E. It was also observed that group GC specimens had higher ductility than group GCD specimens. The ductility index of group GCD specimens, GCD-0F-0E, GCD-0F-15E, GCD-0F-35E, and GCD-0F-50E, was 10%, 9%, 8%, and 5% lower, respectively, than their counterparts in group GC.
The addition of fibers in GC specimens, i.e., GC-0.75F-0E, GC-0.75F-15E, GC-0.75F-35E, and GC-0.75F-50E, resulted in improved ductility by 55%, 40%, 35%, and 25%, respectively, than the corresponding specimens with no fibers in the same group. The ductility index of GCD specimens, i.e., GCD-0.75F-0E, GCD-0.75F-15E, GCD-0.75F-35E, and GCD-0.75F-50E, has been increased by 47%, 35%, 25%, and 20%, respectively, than their corresponding counterparts with no fibers in the same group. The inclusion of steel fibers helped to arrest the microcracks and acted as a bridge across the cracks to prevent expansion; hence, they significantly enhanced the ductility of GC and GCD specimens [31,33,39,40,52]. The trend of improved ductility in GPC with the addition of fibers has also been reported in previous studies [39,40]
3.6. Conclusions
This paper presented the results of an experimental program conducted to evaluate the structural behavior of quarry rock dust (QRD)-incorporated FA/SG-based fiber-reinforced geopolymeric concrete columns tested under concentric and eccentric loading. In this study, a total of 20 columns were cast and divided into three groups depending upon their mix proportions, i.e., CC, GC, and GCD. The first group (Group CC) comprised of four square cross-section conventional concrete specimens, whereas the second and third comprised of 16 GPC columns. In the second group (GC), all the specimens were prepared with FA (50%) and SG (50%) as the source materials. In the third group (GCD), QRD was incorporated as a partial replacement (20%) of SG, along with SG (30%) and FA (50%) contents.
The following key conclusions have been drawn from this study:
- Quarry rock dust is a suitable material that can be used as a source material in GPC to manufacture structural concrete members with satisfactory performance.
- The axial load-carrying capacity of plain GPC columns in the GCD group incorporating QRD (20%) is 8–15% lower in comparison to the corresponding plain specimens of the GC group (without QRD). However, the peak axial load attained by the fiber-reinforced columns in the GCD group was 7–15% more than the corresponding plain specimens in the GC group.
- The specimens (without fibers) of GC and GCD groups had lower peak load values than their counterparts in CC group. The load-carrying capacity of concentrically loaded plain columns in GC and GCD groups was 10% and 16% lower, respectively, than their counterpart in CC group. However, the peak axial load achieved by the fiber-reinforced GC and GCD specimens was 20–30% more than their corresponding plain specimens in the same group. The load capacities of fiber-reinforced GC specimens were about 5–7% higher than their counterparts in CC group.
- Increasing the eccentricity of the applied axial load resulted in reduction of load carrying capacity and ductility of columns.
- The spalling of concrete cover at failure was observed in all plain CC, GC, and GCD columns tested under concentric and eccentric loading. On the other hand, all fiber reinforced GC and GCD specimens experienced no spalling. The cover concrete of all specimens (without fibers) spalled-off in between a region of 200–300 mm from the ends of columns, and core concrete was intact. However, the failure modes of all fiber-reinforced columns of GC and GCD groups were characterized by surface cracking, leading to disintegration of the concrete cover.
- The general performance of the GPC columns incorporating QRD (20%) is observed to be similar to that of GPC columns (without QRD) and conventional concrete columns; the peak axial load and axial deformation at peak axial load decreased with an increase in the loading eccentricity. On the other hand, the lateral displacement tends to increase with the increase of eccentricity due to the tendency of columns to buckle under eccentric loading.
- The fiber reinforced specimens of GC and GCD groups exhibited more deformation than the corresponding plain columns in the same group. The addition of steel fibers significantly improved the load-carrying capacity, ductility, and post-peak load–displacement behavior of the tested columns. The addition of steel fibers softens the descending phase of the axial load–displacement response and restricts the sudden failure of the tested specimens. The specimens (without fibers) of GC and GCD groups had lower ductility index than their counterparts in CC group. The addition of fibers in GC and GCD specimens resulted in improving the ductility by 50% compared to the corresponding CC specimens.
In view of the results of the present study, it is evident that QRD is a promising material to be used as a replacement for SG, in FA- and SG-based GPC columns. The utilization of QRD in the production of GPC will help to cope with shortage issues of the supply of FA and SG in some parts of the world. The results of this study revealed that general performance of the QRD-incorporated FA- and SG-based GPC columns is similar to that of conventional concrete columns. Hence, QRD incorporation in FA- and SG-based GPC has the potential to be used in general concreting applications, i.e., columns, beams, etc. This can have an effect on the reduction in the energy consumption due to conventional OPC production, efficient use of natural resources, less CO2 emissions, and effective consumption of waste materials.
Author Contributions
R.M.W., conceptualization, methodology, investigation, writing—original draft, formal analysis, visualization; F.B., conceptualization, methodology, writing—review and editing, visualization, supervision. All authors have read and agreed to the published version of the manuscript.
Funding
This research received no external funding.
Institutional Review Board Statement
Not applicable.
Informed Consent Statement
Not applicable.
Data Availability Statement
The data presented in this study is available on request from the corresponding author.
Acknowledgments
Not applicable.
Conflicts of Interest
The authors declare no conflict of interest.
References
- Yang, L.; Jia, Z.; Zhang, Y.; Dai, J. Effects of nano-TiO2 on strength, shrinkage and microstructure of alkali activated slag pastes. Cem. Concr. Compos. 2015, 57, 1–7. [Google Scholar] [CrossRef]
- Turner, L.K.; Collins, F.G. Carbon dioxide equivalent (CO2-e) emissions: A comparison between geopolymer and OPC cement concrete. Constr. Build. Mater. 2013, 43, 125–130. [Google Scholar] [CrossRef]
- Shahmansouri, A.A.; Bengar, H.A.; Ghanbari, S. Compressive strength prediction of eco-efficient GGBS-based geopolymer concrete using GEP method. J. Build. Eng. 2020, 31, 101326. [Google Scholar] [CrossRef]
- Zahid, M.; Shafiq, N.; Isa, M.H.; Gil, L. Statistical modeling and mix design optimization of fly ash based engineered geopolymer composite using response surface methodology. J. Clean. Prod. 2018, 194, 483–498. [Google Scholar] [CrossRef]
- Reddy, M.S.; Dinakar, P.; Rao, B.H. Mix design development of fly ash and ground granulated blast furnace slag based geopolymer concrete. J. Build. Eng. 2018, 20, 712–722. [Google Scholar] [CrossRef]
- Mathew, G.; Joseph, B. Flexural behaviour of geopolymer concrete beams exposed to elevated temperatures. J. Build. Eng. 2018, 15, 311–317. [Google Scholar] [CrossRef]
- McLellan, B.C.; Williams, R.P.; Lay, J.; van Riessen, A.; Corder, G.D. Costs and carbon emissions for geopolymer pastes in comparison to ordinary portland cement. J. Clean. Prod. 2011, 19, 1080–1090. [Google Scholar] [CrossRef] [Green Version]
- Yang, K.-H.; Song, J.-K.; Song, K.-I. Assessment of CO2 reduction of alkali-activated concrete. J. Clean. Prod. 2013, 39, 265–272. [Google Scholar] [CrossRef]
- Cohen, E.; Peled, A.; Bar-Nes, G. Dolomite-based quarry-dust as a substitute for fly-ash geopolymers and cement pastes. J. Clean. Prod. 2019, 235, 910–919. [Google Scholar] [CrossRef]
- Noushini, A.; Aslani, F.; Castel, A.; Gilbert, R.I.; Uy, B.; Foster, S. Compressive stress-strain model for low-calcium fly ash-based geopolymer and heat-cured Portland cement concrete. Cem. Concr. Compos. 2016, 73, 136–146. [Google Scholar] [CrossRef]
- Okoye, F.; Durgaprasad, J.; Singh, N. Mechanical properties of alkali activated flyash/Kaolin based geopolymer concrete. Constr. Build. Mater. 2015, 98, 685–691. [Google Scholar] [CrossRef]
- Assi, L.; Ghahari, S.; Deaver, E.E.; Leaphart, D.; Ziehl, P. Improvement of the early and final compressive strength of fly ash-based geopolymer concrete at ambient conditions. Constr. Build. Mater. 2016, 123, 806–813. [Google Scholar] [CrossRef]
- Pavithra, P.e.; Reddy, M.S.; Dinakar, P.; Rao, B.H.; Satpathy, B.; Mohanty, A. A mix design procedure for geopolymer concrete with fly ash. J. Clean. Prod. 2016, 133, 117–125. [Google Scholar] [CrossRef]
- Parveen, A.S.; Singhal, D. Mechanical properties of geopolymer concrete: A state of the art report. In Proceedings of the 5th Asia And Pacific Young Researchers and Graduate Symposium, Jaipur, India, 13 October 2013. [Google Scholar]
- Yip, C.K.; Lukey, G.; van Deventer, J.S. The coexistence of geopolymeric gel and calcium silicate hydrate at the early stage of alkaline activation. Cem. Concr. Res. 2005, 35, 1688–1697. [Google Scholar] [CrossRef]
- Nath, P.; Sarker, P.K. Effect of GGBFS on setting, workability and early strength properties of fly ash geopolymer concrete cured in ambient condition. Constr. Build. Mater. 2014, 66, 163–171. [Google Scholar] [CrossRef] [Green Version]
- Zhuang, X.Y.; Chen, L.; Komarneni, S.; Zhou, C.H.; Tong, D.S.; Yang, H.M.; Yu, W.H.; Wang, H. Fly ash-based geopolymer: Clean production, properties and applications. J. Clean. Prod. 2016, 125, 253–267. [Google Scholar] [CrossRef]
- Rangan, B.V.; Sumajouw, D.; Wallah, S.; Hardjito, D. Reinforced low-calcium fly ash-based geopolymer concrete beams and columns. In Proceedings of the 31st Conference on Our World in Concrete & Structures, Singapore, 16–17 August 2006; pp. 16–17. [Google Scholar]
- Bentz, D.P.; Ferraris, C.F.; Jones, S.Z.; Lootens, D.; Zunino, F. Limestone and silica powder replacements for cement: Early-age performance. Cem. Concr. Compos. 2017, 78, 43–56. [Google Scholar] [CrossRef] [Green Version]
- Kürklü, G.; Görhan, G. Investigation of usability of quarry dust waste in fly ash-based geopolymer adhesive mortar production. Constr. Build. Mater. 2019, 217, 498–506. [Google Scholar] [CrossRef]
- Hill, A.R.; Dawson, A.R.; Mundy, M. Utilisation of aggregate materials in road construction and bulk fill. Resour. Conserv. Recycl. 2001, 32, 305–320. [Google Scholar] [CrossRef] [Green Version]
- Yip, C.K.; Provis, J.L.; Lukey, G.C.; van Deventer, J.S. Carbonate mineral addition to metakaolin-based geopolymers. Cem. Concr. Compos. 2008, 30, 979–985. [Google Scholar] [CrossRef]
- Moseson, A.J.; Moseson, D.E.; Barsoum, M.W. High volume limestone alkali-activated cement developed by design of experiment. Cem. Concr. Compos. 2012, 34, 328–336. [Google Scholar] [CrossRef]
- Cwirzen, A.; Provis, J.L.; Penttala, V.; Habermehl-Cwirzen, K. The effect of limestone on sodium hydroxide-activated metakaolin-based geopolymers. Constr. Build. Mater. 2014, 66, 53–62. [Google Scholar] [CrossRef]
- Natali, A.; Manzi, S.; Bignozzi, M. Novel fiber-reinforced composite materials based on sustainable geopolymer matrix. Procedia Eng. 2011, 21, 1124–1131. [Google Scholar] [CrossRef] [Green Version]
- Shaikh, F.U.A. Review of mechanical properties of short fibre reinforced geopolymer composites. Constr. Build. Mater. 2013, 43, 37–49. [Google Scholar] [CrossRef] [Green Version]
- Davidovits, J. Geopolymers: Inorganic polymeric new materials. J. Therm. Anal. Calorim. 1991, 37, 1633–1656. [Google Scholar] [CrossRef]
- Alomayri, T.; Shaikh, F.; Low, I.M. Synthesis and mechanical properties of cotton fabric reinforced geopolymer composites. Compos. Part B Eng. 2014, 60, 36–42. [Google Scholar] [CrossRef] [Green Version]
- Ranjbar, N.; Mehrali, M.; Behnia, A.; Pordsari, A.J.; Mehrali, M.; Alengaram, U.J.; Jumaat, M.Z. A comprehensive study of the polypropylene fiber reinforced fly ash based geopolymer. PLoS ONE 2016, 11, e0147546. [Google Scholar] [CrossRef] [Green Version]
- Yunsheng, Z.; Wei, S.; Zongjin, L.; Xiangming, Z.; Chungkong, C. Impact properties of geopolymer based extrudates incorporated with fly ash and PVA short fiber. Constr. Build. Mater. 2008, 22, 370–383. [Google Scholar] [CrossRef]
- Farhan, N.A.; Sheikh, M.N.; Hadi, M.N. Engineering Properties of Ambient Cured Alkali-Activated Fly Ash—Slag Concrete Reinforced with Different Types of Steel Fiber. J. Mater Civ. Eng. 2018, 30, 04018142. [Google Scholar] [CrossRef] [Green Version]
- Shaikh, F. Deflection hardening behaviour of short fibre reinforced fly ash based geopolymer composites. Mater. Des. 2013, 50, 674–682. [Google Scholar] [CrossRef] [Green Version]
- Farhan, N.A.; Sheikh, M.N.; Hadi, M.N. Behaviour of ambient cured steel fibre reinforced geopolymer concrete columns under axial and flexural loads. Structures 2018, 15, 184–195. [Google Scholar] [CrossRef]
- Albitar, M.; Ali, M.M.; Visintin, P. Experimental study on fly ash and lead smelter slag-based geopolymer concrete columns. Constr. Build. Mater. 2017, 141, 104–112. [Google Scholar] [CrossRef]
- Sumajouw, M.; Rangan, B.V. Low-Calcium Fly Ash-Based Geopolymer Concrete: Reinforced Beams and Columns; Research Report; Curtin University of Technology: Perth, Australia, 2006. [Google Scholar]
- Chang, E.H. Shear and Bond Behaviour of Reinforced Fly Ash-Based Geopolymer Concrete Beams; Curtin University: Perth, Australia, 2009. [Google Scholar]
- Sofi, M.; van Deventer, J.; Mendis, P.; Lukey, G. Bond performance of reinforcing bars in inorganic polymer concrete (IPC). J. Mater. Sci. 2007, 42, 3107–3116. [Google Scholar] [CrossRef]
- Sumajouw, D.; Hardjito, D.; Wallah, S.; Rangan, B. Fly ash-based geopolymer concrete: Study of slender reinforced columns. J. Mater. Sci. 2007, 42, 3124–3130. [Google Scholar] [CrossRef]
- Sharma, U.; Bhargava, P.; Sheikh, S. Tie-confined fibre-reinforced high-strength concrete short columns. Mag. Concr. Res. 2007, 59, 757–769. [Google Scholar] [CrossRef] [Green Version]
- Ganesan, N.; Abraham, R.; Raj, S.D.; Namitha, K. Effect of fibres on the strength and behaviour of GPC columns. Mag. Concr. Res. 2016, 68, 99–106. [Google Scholar] [CrossRef]
- Shaikh, F.U.A.; Hosan, A. Mechanical properties of steel fibre reinforced geopolymer concretes at elevated temperatures. Constr. Build. Mater. 2016, 114, 15–28. [Google Scholar] [CrossRef]
- ASTM, C. 150/C150M-12. Standard Specification for Portland Cement; ASTM International: West Conshohocken, PA, USA, 2012. [Google Scholar]
- Fang, G.; Ho, W.K.; Tu, W.; Zhang, M. Workability and mechanical properties of alkali-activated fly ash-slag concrete cured at ambient temperature. Constr. Build. Mater. 2018, 172, 476–487. [Google Scholar] [CrossRef]
- ASTM, C. 127–15. Standard Test. Method for Relative Density (Specific Gravity) and Absorption of Coarse Aggregate; ASTM International: West Conshohocken, PA, USA, 2015. [Google Scholar]
- ASTM, C. 128–15. Standard Test. Method for Relative Density (Specific Gravity) and Absorption of Fine Aggregate; ASTM International: West Conshohocken, PA, USA, 2015; Volume 1. [Google Scholar]
- Deb, P.S.; Nath, P.; Sarker, P.K. The effects of ground granulated blast-furnace slag blending with fly ash and activator content on the workability and strength properties of geopolymer concrete cured at ambient temperature. Mater. Des. 2014, 62, 32–39. [Google Scholar] [CrossRef] [Green Version]
- BSI, BS EN 12390-3:2009. Testing of Hardened Concrete, Part. 3: Compressive Strength of Test Specimens; British Standard Institution: London, UK, 2009. [Google Scholar]
- Dancygier, A.N.; Berkover, E. Cracking localization and reduced ductility in fiber-reinforced concrete beams with low reinforcement ratios. Eng. Struct. 2016, 111, 411–424. [Google Scholar] [CrossRef]
- Ma, C.-K.; Awang, A.Z.; Omar, W. Flexural ductility design of confined high-strength concrete columns: Theoretical modelling. Measurement 2016, 78, 42–48. [Google Scholar] [CrossRef]
- Abdulraheem, M.S. Experimental investigation of fire effects on ductility and stiffness of reinforced reactive powder concrete columns under axial compression. J. Build. Eng. 2018, 20, 750–761. [Google Scholar] [CrossRef]
- Saranya, P.; Nagarajan, P.; Shashikala, A. Behaviour of GGBS-dolomite geopolymer concrete short column under axial loading. J. Build. Eng. 2020, 30, 101232. [Google Scholar] [CrossRef]
- Liu, F.; Ding, W.; Qiao, Y. Experimental investigation on the flexural behavior of hybrid steel-PVA fiber reinforced concrete containing fly ash and slag powder. Constr. Build. Mater. 2019, 228, 116706. [Google Scholar] [CrossRef]


Publisher’s Note: MDPI stays neutral with regard to jurisdictional claims in published maps and institutional affiliations. |
© 2021 by the authors. Licensee MDPI, Basel, Switzerland. This article is an open access article distributed under the terms and conditions of the Creative Commons Attribution (CC BY) license (https://creativecommons.org/licenses/by/4.0/).