Abstract
As an alternative to conventional artificial heads, a virtual artificial head (VAH), i.e., a microphone array-based filter-and-sum beamformer, can be used to create binaural renderings of spatial sound fields. In contrast to conventional artificial heads, a VAH enables one to individualize the binaural renderings and to incorporate head tracking. This can be achieved by applying complex-valued spectral weights—calculated using individual head related transfer functions (HRTFs) for each listener and for different head orientations—to the microphone signals of the VAH. In this study, these spectral weights were applied to measured room impulse responses in an anechoic room to synthesize individual binaural room impulse responses (BRIRs). In the first part of the paper, the results of localizing virtual sources generated with individually synthesized BRIRs and measured BRIRs using a conventional artificial head, for different head orientations, were assessed in comparison with real sources. Convincing localization performances could be achieved for virtual sources generated with both individually synthesized and measured non-individual BRIRs with respect to azimuth and externalization. In the second part of the paper, the results of localizing virtual sources were compared in two listening tests, with and without head tracking. The positive effect of head tracking on the virtual source localization performance confirmed a major advantage of the VAH over conventional artificial heads.
1. Introduction
The aim of binaural rendering technology is to provide listeners with the same spatial impression of a sound field as they would have if they were present in the actual sound field. To preserve spatial information, binaural signals are often recorded with artificial heads or are pre-processed with head related transfer functions (HRTFs), and then presented over headphones. Virtual sources generated using binaural technology are commonly subject to localization shortcomings, such as lack of externalization, and localization ambiguities, such as front–back reversals. Previous studies have shown the advantage of using individual HRTFs to reduce localization ambiguities and improve externalization [1,2,3]. However, Oberem et al. [3] showed that when incorporating head tracking during signal playback, individualization is not very important. Dynamic binaural rendering, i.e., with head tracking, was shown to greatly enhance quality with respect to externalization and reduction of front–back reversals, regardless of using individual or non-individual HRTFs [4,5]. If sufficient care is taken regarding system latency for head tracking, the spatial resolution of head orientations, and the correct compensation of headphone transfer functions, it is possible to achieve similar localization performances with dynamically presented virtual sources and real sources [6,7,8].
This study aimed to assess the localization performance when listening to virtual sources generated with virtual artificial head (VAH) technology [9,10]. A VAH, as an alternative to conventional artificial heads, is a microphone array using filter-and-sum beamforming in order to synthesize the directivity patterns of individual left and right HRTFs. This is done by applying complex-valued spectral weights to the microphone signals and adding them. In [9,10,11], it was proposed to calculate the spectral weights by minimizing a least-squares-based narrow-band cost function, which measures the deviation between the desired and the synthesized HRTF directivity patterns. In order to achieve a small synthesis error, the cost function is minimized, subject to constraints imposed on the spectral error in a number of directions. An additional constraint is applied to the mean white noise gain to increase the robustness. Compared to conventional artificial heads, the VAH offers not only the possibility to adjust to individual HRTFs by using individually optimized spectral weights, but also the possibility to adjust to different head orientations during playback. This can be achieved by calculating spectral weights for different head orientations, such that the same recording, captured for a single orientation of the VAH during the recording, can be presented dynamically during playback, i.e., with head tracking. For a binaural recording with a conventional artificial head, on the other hand, the recording can be presented only for a fixed head orientation of the listener, namely, the orientation of the artificial head during the recording.
Previous studies [12,13] reported good perceptual performance of the VAH in dynamic scenarios for speech signals with respect to different perceptual attributes, including the perceived source position. The evaluations were based on direct comparisons between binaural VAH signals played back through headphones and signals from real sources. In those studies, non-individual binaural signals generated with binaural room impulse responses (BRIRs) of a conventional artificial head were evaluated as well. Dynamic presentation was artificially enabled by BRIRs measured for different head-above-torso orientations of the artificial head, which is quite unrealistic and different from the typical application of an artificial head in practice. The signals generated with such non-individual BRIRs also showed good perceptual performance. Since in [12,13], the subjects could see the real sources in the room, the first open question was to which extent the visual information about the sound sources contributed to the successful performance of the VAH and the non-individual binaural signals, especially with respect to the perceived source position. The second open question concerned the possibly positive impact of head tracking on the perceptual results. This paper aims to answer both questions.
The paper consists of two parts. In Part I, localizing virtual sources in the absence of visual cues is assessed. A localization experiment was performed with dynamically presented virtual sources generated with VAH technology and with a conventional artificial head (the same artificial head as evaluated in previous studies [12,13]). Subjects were asked to localize the virtual sources while listening to dynamic headphone signals in the darkness, i.e., without being supplied with any visual information about the sources. Subjects mapped the perceived source position on a graphical user interface (GUI). The same localization test was also performed with hidden real sound sources in order to verify the GUI employed. In Part II, the impacts of dynamic presentation on the localization performances attained via virtual sources generated with VAH technology and the conventional artificial head, were assessed by two separate localization experiments, one with and one without head tracking.
The paper continues in Section 2 with a review of the methods and parameters used to calculate the individual VAH spectral weights. Section 3 and Section 4 present the methods, and the results and discussion of the results for both localization experiments. Finally, some general discussion is offered in Section 5.
2. Virtual Artificial Head: Review of Methods and Configurations Chosen for the Present Study
In Section 2.1, a brief review of VAH technology and the optimization methods for calculating the spectral weights is provided (detailed information can be found in [11]). In Section 2.2, the microphone arrays and the parameters used to calculate the spectral weights for the localization experiments in this paper are presented.
2.1. Calculation of Spectral Weights Using Constrained Optimization
The virtual artificial head (VAH) consists of N spatially distributed microphones and is designed as a filter-and-sum beamformer. The aim of the VAH is to synthesize the desired directivity pattern of the left or right HRTFs, where f denotes the frequency and , with azimuth and elevation , denotes P discrete directions. Considering the 1 steering vector d(), defined as the free-field acoustic transfer function between a source at direction and N microphones in the array, the resulting directivity pattern of the VAH is given by
where denotes the Hermitian transpose operator and the 1 vector contains the complex-valued spectral weights for N microphones. These spectral weights were calculated by minimizing the narrow-band least-squares cost function:
where both the amplitudes and the phases of and were considered. In this study, the cost function in Equation (2) was minimized, subject to two sets of constraints [11]. One set of constraints was imposed onto the spectral distortion (SD), defined as the spectral difference in dB between the desired and synthesized HRTFs in each direction , i.e.,
where and denote the upper and lower boundaries, respectively. The constraints on SD were imposed to achieve good synthesis accuracy in a large number of directions. An additional constraint was imposed onto the mean white noise gain (), defined as the ratio between the mean output power of the microphone array in the P considered directions and the output power for spatially uncorrelated noise [9], i.e.,
where denotes the minimum desired . The constraint on was applied to increase the robustness of the VAH synthesis against microphone self-noise or deviations in the microphone characteristics and positions [9]. An interior-point algorithm was used to minimize the cost function in Equation (2) subject to the constraints defined in Equations (3) and (4).
2.2. VAH Implementations and Constraint Parameters Used in This Study
In this study, two different microphone arrays, referred to as VAH1 (a planar array with N = 24 microphones, 20 cm × 20 cm [10]) and VAH2 (a 3D array with N = 31 microphones, 11 cm × 11 cm × 6 cm), as shown in Figure 1, were used. In both VAHs, the microphones were spatially distributed such that the inter-microphone distances were as different as possible in all possible directions. This was achieved by placing the microphones using a Golomb ruler [14]. A Golomb ruler is a numerical series such that the distance between any two points in this series is different than the distance between any other two points. It was shown in [15] that the Golomb-based microphone distribution for a VAH leads to smaller synthesis errors over a wider frequency range compared to a randomly chosen microphone distribution. Due to the smaller extension of VAH2 compared to VAH1 and consequently smaller microphone spacing, grating lobes appeared for VAH2 at higher frequencies than for VAH1. However, for both VAHs, the grating lobes appeared at frequencies above 5 kHz, which was assumed to be above the frequency range of interest for the test signal (speech—see Section 3.1.5) used in this study.
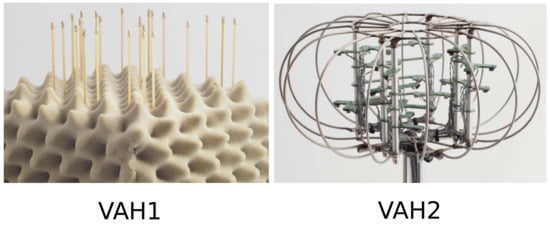
Figure 1.
VAHs used in this study. VAH1: a planar microphone array with 24 microphones. VAH2: a 3D microphone array with 31 microphones.
Throughout this study, the SD constraint parameters and in Equation (3) were chosen as 0.5 and −1.5 dB, respectively, as in [11,13]. This led to a maximum deviation of 2 dB in the interaural level difference (ILD) in all directions P, which was assumed to be reasonable based on the reported just noticeable differences in ILD deviations [16]. The minimum desired in Equation (4) was chosen as = 0 dB, based on the results in [13]. Although this value of was evaluated in [13] for VAH1 only, the same value was chosen for VAH2 as well.
Consistently with the previous study in [13], two sets of directions were considered in the optimization (Equations (2)–(4)): P = 72 directions, equally spaced along the horizontal plane (i.e., 5 resolution), and P = 3 × 72 = 216 directions, i.e., the 72 directions from the horizontal plane and the same 72 azimuths at two elevations ±15. A summary of the constraint parameter P and the VAHs used in this study is given in Table 1. The cases V11 and V13 were already evaluated in a previous study [13]. VAH2 was not evaluated previously.

Table 1.
An overview of parameter P and the VAHs used to calculate the spectral weights.
As discussed in Section 1, the VAH can be virtually rotated to a specific head orientation of the listener simply by adjusting the spectral weights. For a given head orientation , spectral weights can be calculated by using the HRTF directivity pattern and the shifted steering vector with in Equations (1)–(4). For both VAHs in this study, spectral weights labeled as V11, V13, V21 and V23 (see Table 1) were each calculated for 37 × 5 = 185 head orientations, corresponding to 37 azimuth angles of −90 to +90 in 5 steps and 5 elevation angles of −15 to +15 in 7.5 steps. The chosen spatial resolutions for head orientations were assumed to be sufficient for speech signals, given findings in a previous study [13].
It should be noted that the directions included in the calculation of the spectral weights influence the localization performances in these and other directions. On the one hand, the spectral distortion is typically lower in the directions included in the calculation of spectral weights than in other directions. On the other hand, the more directions included, the more difficult it becomes to satisfy the number of SD constraints. In [13] it was shown that this leads to deterioration of the phase accuracy, referred to as temporal distortion (TD).
For the parameter sets considered in the present study, this meant that V11 and V21 provided more accurate synthesis (smaller SD and TD) in horizontal directions and less accurate synthesis (higher SD and TD) in non-horizontal directions, because the non-horizontal directions were not included in the calculation of the spectral weights. In contrast, when including both horizontal and non-horizontal directions in V13 and V23, the overall accuracy was distributed over a larger number of directions. As a result, the spectral synthesis accuracy improved in non-horizontal directions compared to V11 and V21, and it degraded in horizontal directions. However, the large number of directions in V13 and V23 led to higher TDs at all directions compared to V11 and V21. The localization performance was therefore expected to be less accurate with V13 and V23 compared to V11 and V21, at least with respect to azimuth accuracy and externalization. The results of the previous study in [13] showed that for sound sources inside and outside the horizontal plane, speech signals synthesized with V11 (i.e., including only 72 horizontal directions) perceptually outperformed the signals synthesized with V13 (i.e., including 216 directions in horizontal and non-horizontal directions).
3. Part I: Localization of Real and Virtual Sources in the Absence of Visual Cues
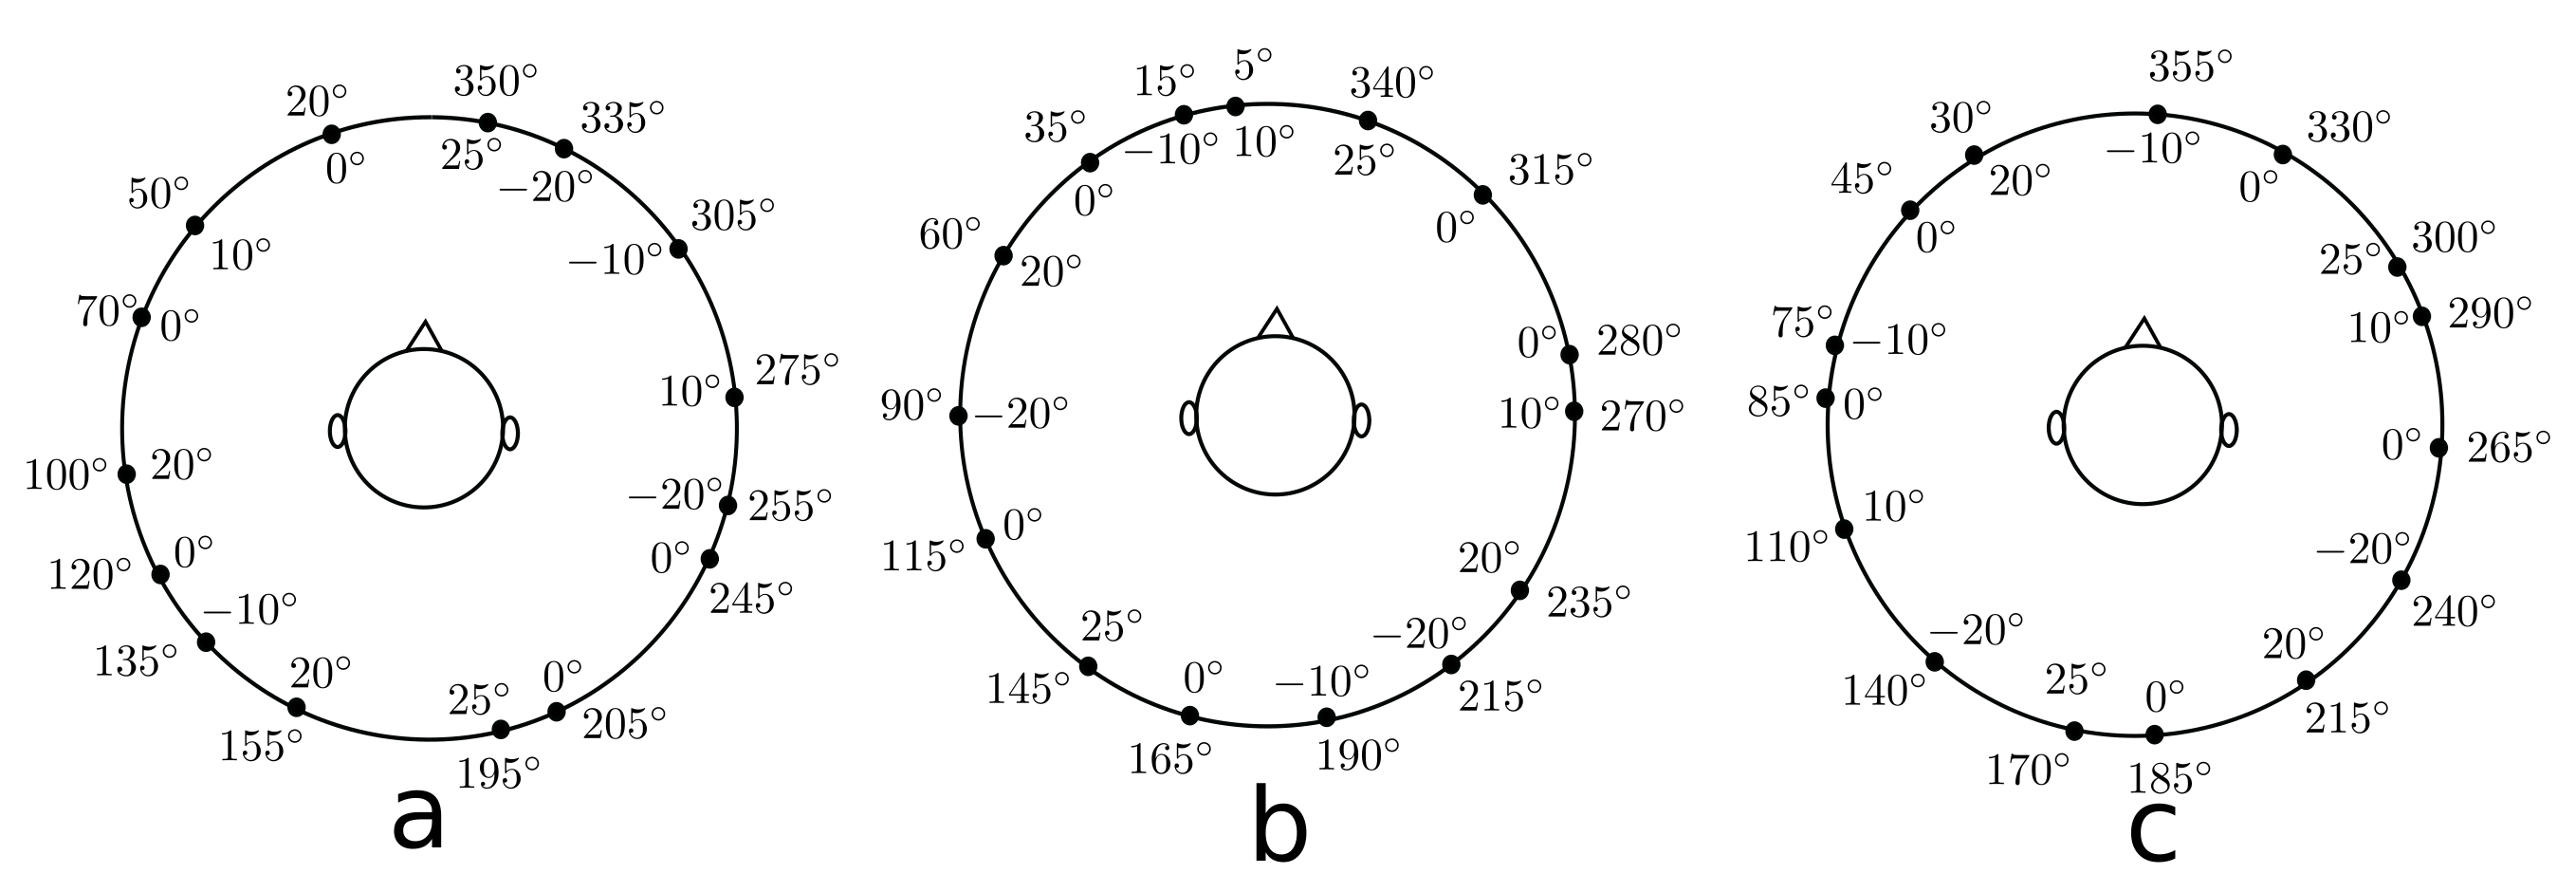
The localization study in Part I consisted of two listening tests. The first listening test, referred to as TestVR, was performed to assess the localization performance when listening to individual binaural signals generated with both VAHs and non-individual binaural signals of a conventional artificial head, for which the BRIRs were measured for different head orientations. During TestVR, the virtual sound source was presented at different target positions dynamically, i.e., with head tracking, through headphones. Subjects sat in a darkened room with very limited visual information about the surroundings and were asked to indicate the perceived source position using a graphical user interface (GUI). In the second listening test, referred to as TestReal, subjects listened to signals played back in the same darkened room from real (hidden) sound sources and were asked to indicate the perceived source positions using the same GUI as in TestVR. Both listening tests, and the measurements of room impulse responses with both VAHs and the BRIRs of the conventional artificial head, were performed in the anechoic room (3.1 m × 3.4 m × 2 m, = 200 Hz) at Jade University of Applied Sciences in Oldenburg. For each test, a different set of 15 target positions, as shown in Figure 2a,b, was considered; azimuthal target positions were chosen randomly in multiples of 5 between 0 and 355, and target elevations at one of the elevations 0, ±10, ±20 or +25. VAH steering vectors and individual HRTFs in 864 directions, including the ones listed in Table 1, and individual headphone impulse responses (HPIRs), were acquired with the methods described in [13].

Figure 2.
Target positions when localizing with (a) real sources in TestReal, (b) virtual sources in TestVR and (c) virtual sources in TestDyamic and TestStatic. Numbers outside and inside the circle indicate the azimuth angles and the levels of elevation of the target sources, respectively.
3.1. Experiment Design
3.1.1. Target Sources’ Positions in the Room
A loudspeaker arc of 1.2 m radius, hanging vertically from a turntable installed in the ceiling of the anechoic room, was used to represent the target source positions in TestReal. The center of the loudspeaker arc at 1.24 m height was defined as the listener position. Six loudspeakers (SPEEDLINK XILU SL-8900-GY) were mounted in the arc at elevations 0, ±10, ±20 and +25. The loudspeaker arc could be rotated by the turntable to any azimuth. Signals were played back through loudspeakers over an ADI-8DS RME audio interface. Loudspeakers were individually equalized (in amplitude and phase) using 256-tap FIR filters, calculated as the regularized inverse [17] of transfer functions measured with a calibration microphone (GRAS 40AF).
3.1.2. Localization of Real Sound Sources (TestReal)
During TestReal, each subject sat with his interaural center in the listener position in the anechoic room. In order to eliminate any visual information about the source positions, subjects sat inside an acoustically transparent tent (see Figure 3a,b) and the room was darkened. The only source of light was a tablet monitor, installed in front of the subjects and used by them to conduct the listening test and to give their responses. The loudspeaker arc was rotated to one of the 15 azimuthal target positions shown in Figure 2a. The test signal was played back from the loudspeaker channel corresponding to the target elevation. Subjects were encouraged to rotate their heads when listening to the signals within an allowable range of ±90 horizontally and ±15 vertically and to not exceed this range even if they perceived the sound source as behind them. Each of the 15 target source positions was presented once, and the presentation order was randomized. Five target positions were chosen randomly to be presented at the beginning for familiarization. Responses given to these five target positions were discarded from the evaluation. No feedback was given to the subjects during the familiarization or during the listening test.
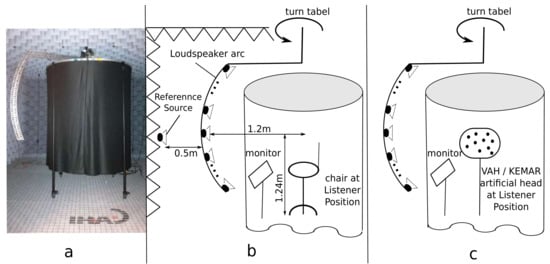
Figure 3.
(a) An acoustically transparent tent and the loudspeaker arc in the anechoic room. (b) Experimental setup during TestReal and TestVR (during TestReal, the loudspeaker arc was used to represent the target sources. During TestVR, virtual target sources were presented over headphones). (c) Setup for room impulse response measurements. VAHs or BRIR measurements for the KEMAR artificial head were performed inside the acoustically transparent tent.
3.1.3. Localization of Virtual Sources (TestVR)
To generate the binaural signals for TestVR, both VAHs were positioned at the listener position in the anechoic room. The same loudspeaker arc in combination with the turntable as described in Section 3.1.2 was used to measure the room impulse responses among the microphones of VAH1 and VAH2 and each of the target source positions shown in Figure 2b. In order to keep the acoustic conditions comparable to TestReal, the VAHs were placed inside the acoustically transparent tent during the measurements of room impulse responses (see Figure 3c). These room impulse responses were used together with spectral weights calculated individually for 37 × 5 = 185 head orientations with VAH1 and VAH2, using the parameters listed in Table 1, to synthesize individual binaural room impulse responses (BRIRs) as follows: the N individually calculated left and right spectral weights for a given head orientation were transformed to left and right FIR filter coefficients using the inverse Fourier transform. The measured room impulse response between a given target source and each of the N microphones was convolved with the associated FIR filter. The sum of the filtered room impulse responses over the N channels resulted in left and right BRIRs for the given target source and the given head orientation. This resulted in four sets of individually synthesized VAH BRIRs, synthesized with V11, V13, V21 and V23, each for 185 head orientations.
In addition, for each of the target source positions shown in Figure 2b, BRIRs were acquired with the two ears of a KEMAR artificial head (GRAS KEMAR type 45BB) placed at the listener position inside the acoustically transparent tent. In order to enable a dynamic presentation and similarly to the previous studies in [12,13], for each of the target source positions shown in Figure 2b, the BRIR measurement was repeated for 37 horizontal head-above-torso orientations of the KEMAR artificial head (−90 to +90 in 5 steps), resulting in 37 × 15 = 555 measurements. It should be mentioned again that for signals recorded with conventional artificial heads, dynamic presentation of the recordings is not possible in practice. The additional effort to measure BRIRs for different head-above-torso orientations of the KEMAR artificial head was only accepted in the present study because otherwise, signals generated with KEMAR BRIRs would clearly lose out against signals generated with the VAH BRIRs during the localization experiments. The BRIRs measured for 37 head-above-torso orientations of the KEMAR artificial head were referred to as HTK (head-tracked KEMAR).
During TestVR, each subject sat with his interaural center at the listener position inside the acoustically transparent tent and the room was darkened. Subjects wore headphones (Sennheiser HD800—the same as used to measure the individual HPIRs) with a custom-made head tracker mounted on top. The real-time head-tracked binaural playback was generated with a custom C++ program based on [18]. BRIRs corresponding to the current head orientation were filtered with the inverse individual HPIRs prior to being convolved with the test signal within the real-time dynamic playback program. Audio signals were presented over an RME Fireface UC sound card and a Lake People Phone-Amp G103 headphone amplifier. Subjects were instructed to reset the head tracker before listening to the virtual source by keeping their heads oriented forward, indicated with a mark on the top of the tablet monitor in front of them, and pressing the “Reset” button on the GUI. Subjects were encouraged to make use of the ability to rotate their heads within an allowable range of ±90 horizontally and ±15 vertically. Each of the 15 target source positions was presented five times, i.e., once with each of the five BRIRs (V11, V13, V21, V23 and HTK), which resulted in 75 virtual sources, presented in a randomized order. Five of these 75 virtual sources were chosen randomly to be presented at the beginning for familiarization. Responses given to these five target positions were discarded from the evaluations. No feedback was given to the subjects during the familiarization or during the listening test.
3.1.4. Response Method
The localization task consisted of providing information about the perceived azimuth, elevation and distance of each real or virtual source. The GUI shown in Figure 4 was used to collect the responses. This GUI was presented on the tablet monitor positioned in front of the subject. For collecting the azimuth responses, the GUI showed the head as seen from above, with a circle around it. To enter in the perceived source azimuth, subjects could click on any point on this circle. For collecting the elevation responses, the GUI showed an equivalent depiction of the head as seen from the side. To give the perceived source distances, subjects were supplied with a real reference sound source (the same loudspeaker type as mounted on the loudspeaker arc), which was positioned at a fixed position in front of the subject outside the acoustically transparent tent (see Figure 3b). By clicking the “Play” and “Reference” buttons, subjects could switch between the (real or virtual) target source and the reference source, respectively. In TestVR, subjects were asked to take off the headphones while listening to the reference source. Subjects had to judge the perceived distance using an ordinal scale from 0 to 4, corresponding to perception (0) in the head, (1) outside but near the head, (2) outside the head and closer than the reference, (3) outside the head and at the reference distance or (4) outside the head and at a further distance than the reference, inspired by similar scales commonly used in studies investigating externalization of virtual sources [19,20]. The reference and target sources were adjusted to have the same level at listener position (55 dB SPL). Subjects had no information about the exact position of the reference source and were instructed not to consider this source as a reference for azimuth and elevation, but only for the perceived distance. The “Reset” button was used during TestVR to reset the head tracker. For TestReal, this button was omitted from the GUI.
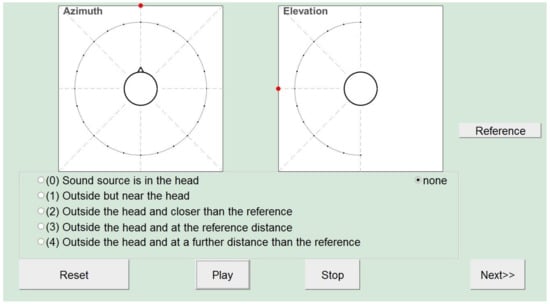
Figure 4.
GUI for collecting the responses on source azimuth, elevation and distance. By clicking the “Reference” button, subjects could switch to the signal coming from the reference source in the room, to give the perceived source distance between 0 (inside the head) and 4 (outside the head and at a further distance than the reference). The “Reset” button was active only during TestVR and was used to reset the head tracker. The frontal direction of azimuth = 0 and elevation = 0, corresponding to the forward head orientation, was marked with a colored point on the GUI.
3.1.5. Subjects and Test Signal
A total of 14 (self-reported) normal-hearing subjects (nine male, five female; aged between 22 and 54) took part in TestReal and TestVR. Nine of these 14 subjects had already participated in the listening tests in the previous study [13]. For all subjects, individual HRTFs and HPIRs were measured, and the VAH BRIRs V11, V13, V21 and V23, each for 185 head orientations, were prepared as described in Section 3.1.3. Seven subjects started with TestReal, whereas the other seven subjects started with TestVR. For each subject, there was at least a pause of one day between the two tests.
The test signal was a dry recorded speech of 15 s duration, spoken by a female speaker (the same speech as used in the previous studies of authors [12,13]). This speech was repeated for a total duration of about three minutes to provide the subjects with enough time to give their responses.
3.2. Results
Figure 5 shows response vs. target azimuths and elevations for TestReal (Real Source) and TestVR (V11, V13, V2, V23, HTK). Each circle represents an individual response of a subject. If a pair of target and response azimuths were on different sides of the interaural axis, a front–back reversal was suspected. Responses classified as front–back reversals are indicated with × in the upper row of Figure 5, for which target and response pairs within ±7.5 off the interaural axis were not checked for reversals. For one subject, some target and response azimuths were swapped in the front–back and left–right directions. These cases, indicated with ◇ in Figure 5, were suspected to be caused either by wearing the headphones inversely (left and right ears switched) or not resetting the head tracker, and were therefore classified as invalid and discarded from further analysis.
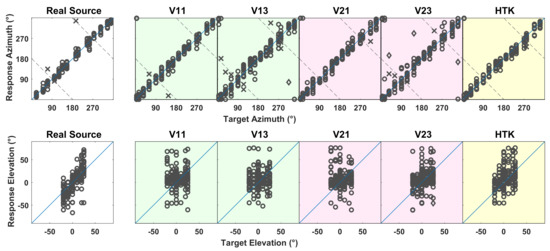
Figure 5.
(Top) Response azimuth (ordinate) vs. target azimuth (abscissa) and (Bottom) response elevation (ordinate) vs. target elevation (abscissa), when listening to real sources in TestReal (Real Source) or to virtual sources in TestVR (generated with V11, V13, V21, V23 and HTK). The circles represent the responses of the 14 subjects. Responses marked with ◇ indicate invalid localizations. Responses classified as front–back reversals are marked with × in the top row. Dashed lines represent possible subject responses in cases of perfect front–back confusion.
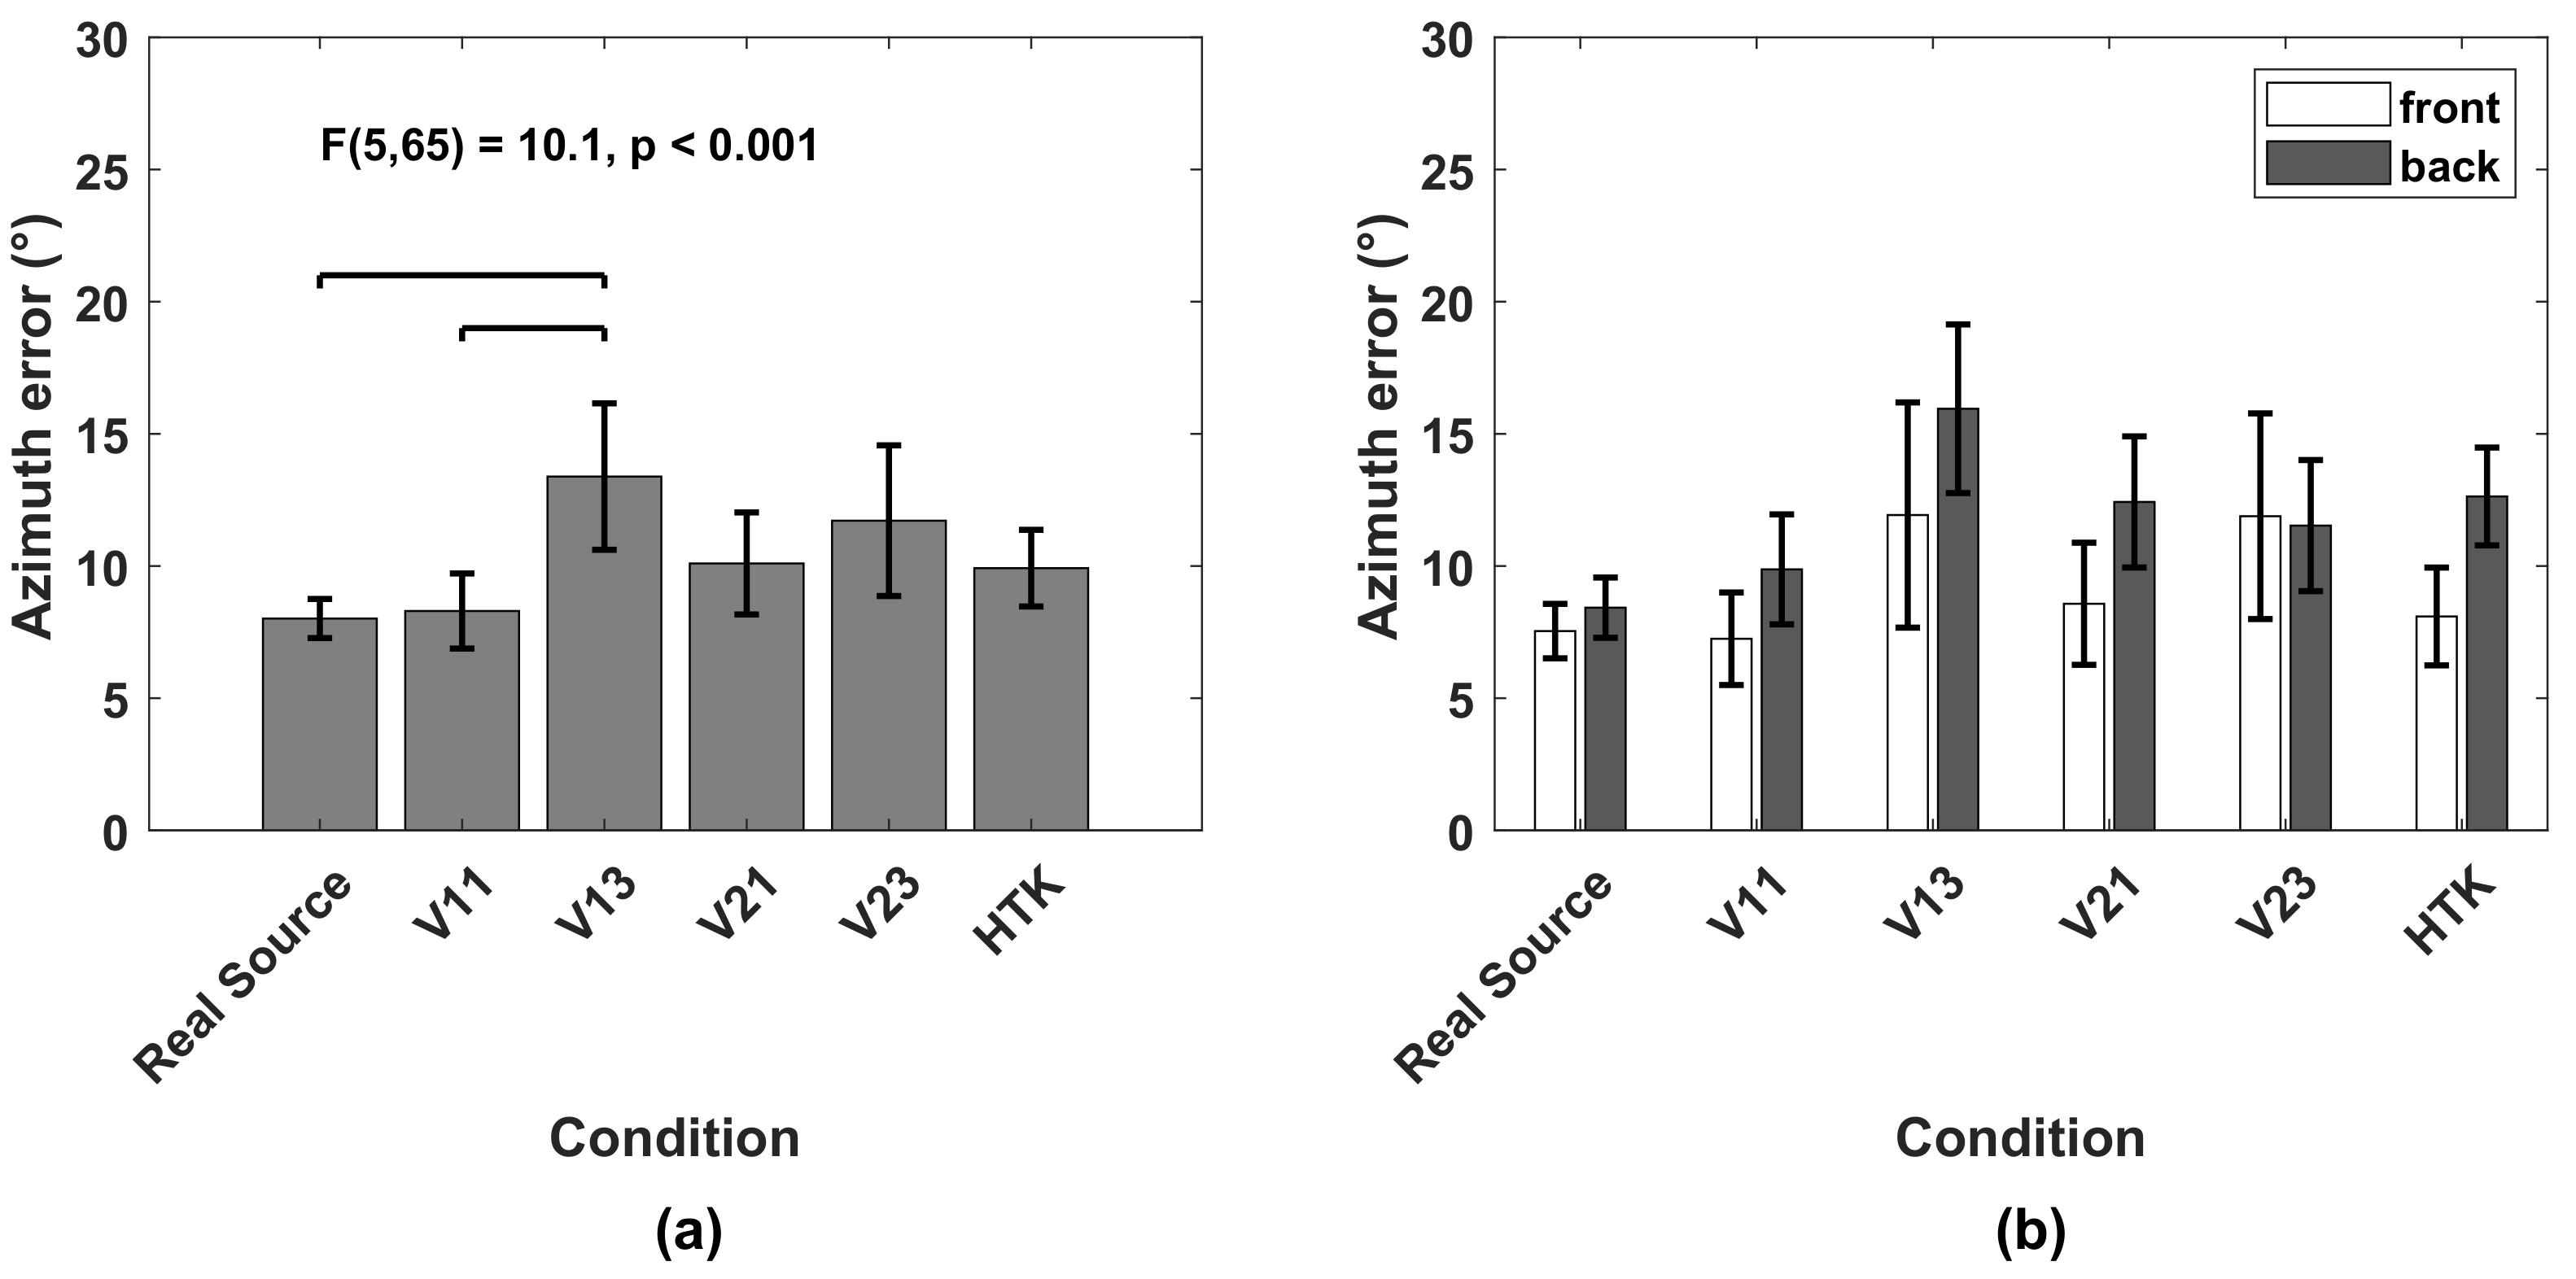
Azimuth: The azimuth error was calculated as the absolute difference between target and response azimuths. Front–back reversals were excluded from the error calculation. Figure 6a shows the azimuth error averaged over 14 subjects and 15 target positions. With real sources in TestReal, the average azimuth error was 8. In TestVR, a comparable average azimuth error as that of real sources was achieved with V11 (8.3). The largest average azimuth errors occurred with HTK (9.9) and with V21 (10.1), followed by V23 (11.7) and V13 (13.3). VAH syntheses including horizontal and non-horizontal directions in the calculation of the spectral weights (V13 and V23) led to larger average azimuth errors compared to real sources and VAH syntheses including only horizontal directions (V11 and V21). According to the Shapiro–Wilk test of normality, the azimuth error could be assumed to be normally distributed. Accordingly, a one-way repeated-measures ANOVA was performed, which revealed a significant difference in the azimuth error when localizing real or different virtual sources (F(5, 65) = 10.1, p < 0.001). The post-hoc multiple comparison with Bonferroni correction (p < 0.05) indicated significantly higher average azimuth errors for V13 compared to V11 and real sources.

Figure 6.
(a) Azimuth error, averaged over 14 subjects and all target sources, when localizing real sources in TestReal (Real Source) and virtual sources in TestVR (generated with V11, V13, V21, V23 and HTK). Horizontal bars indicate significant differences (post-hoc multiple comparisons with Bonferroni correction, p < 0.05). (b) Azimuth error, averaged over 14 subjects for target sources grouped into front and back. All error bars indicate 95% confidence intervals.
In Figure 6b, the average azimuth error over 14 subjects is shown separately for target positions grouped into front and behind. Remember that virtual sources in TestVR were rendered for horizontal head orientations restricted to the frontal range (−9090), and in TestReal, subjects were asked not to move their heads beyond this range. With the exception of V23, the average azimuth errors were lower for sources in front than sources behind. For target sources in the frontal hemisphere, the subject could rotate his head towards the target source to a region where the interaural differences and the minimum audible angle were the smallest. When facing the sound source directly, subjects could give more accurate azimuth responses than they could to target sources behind.
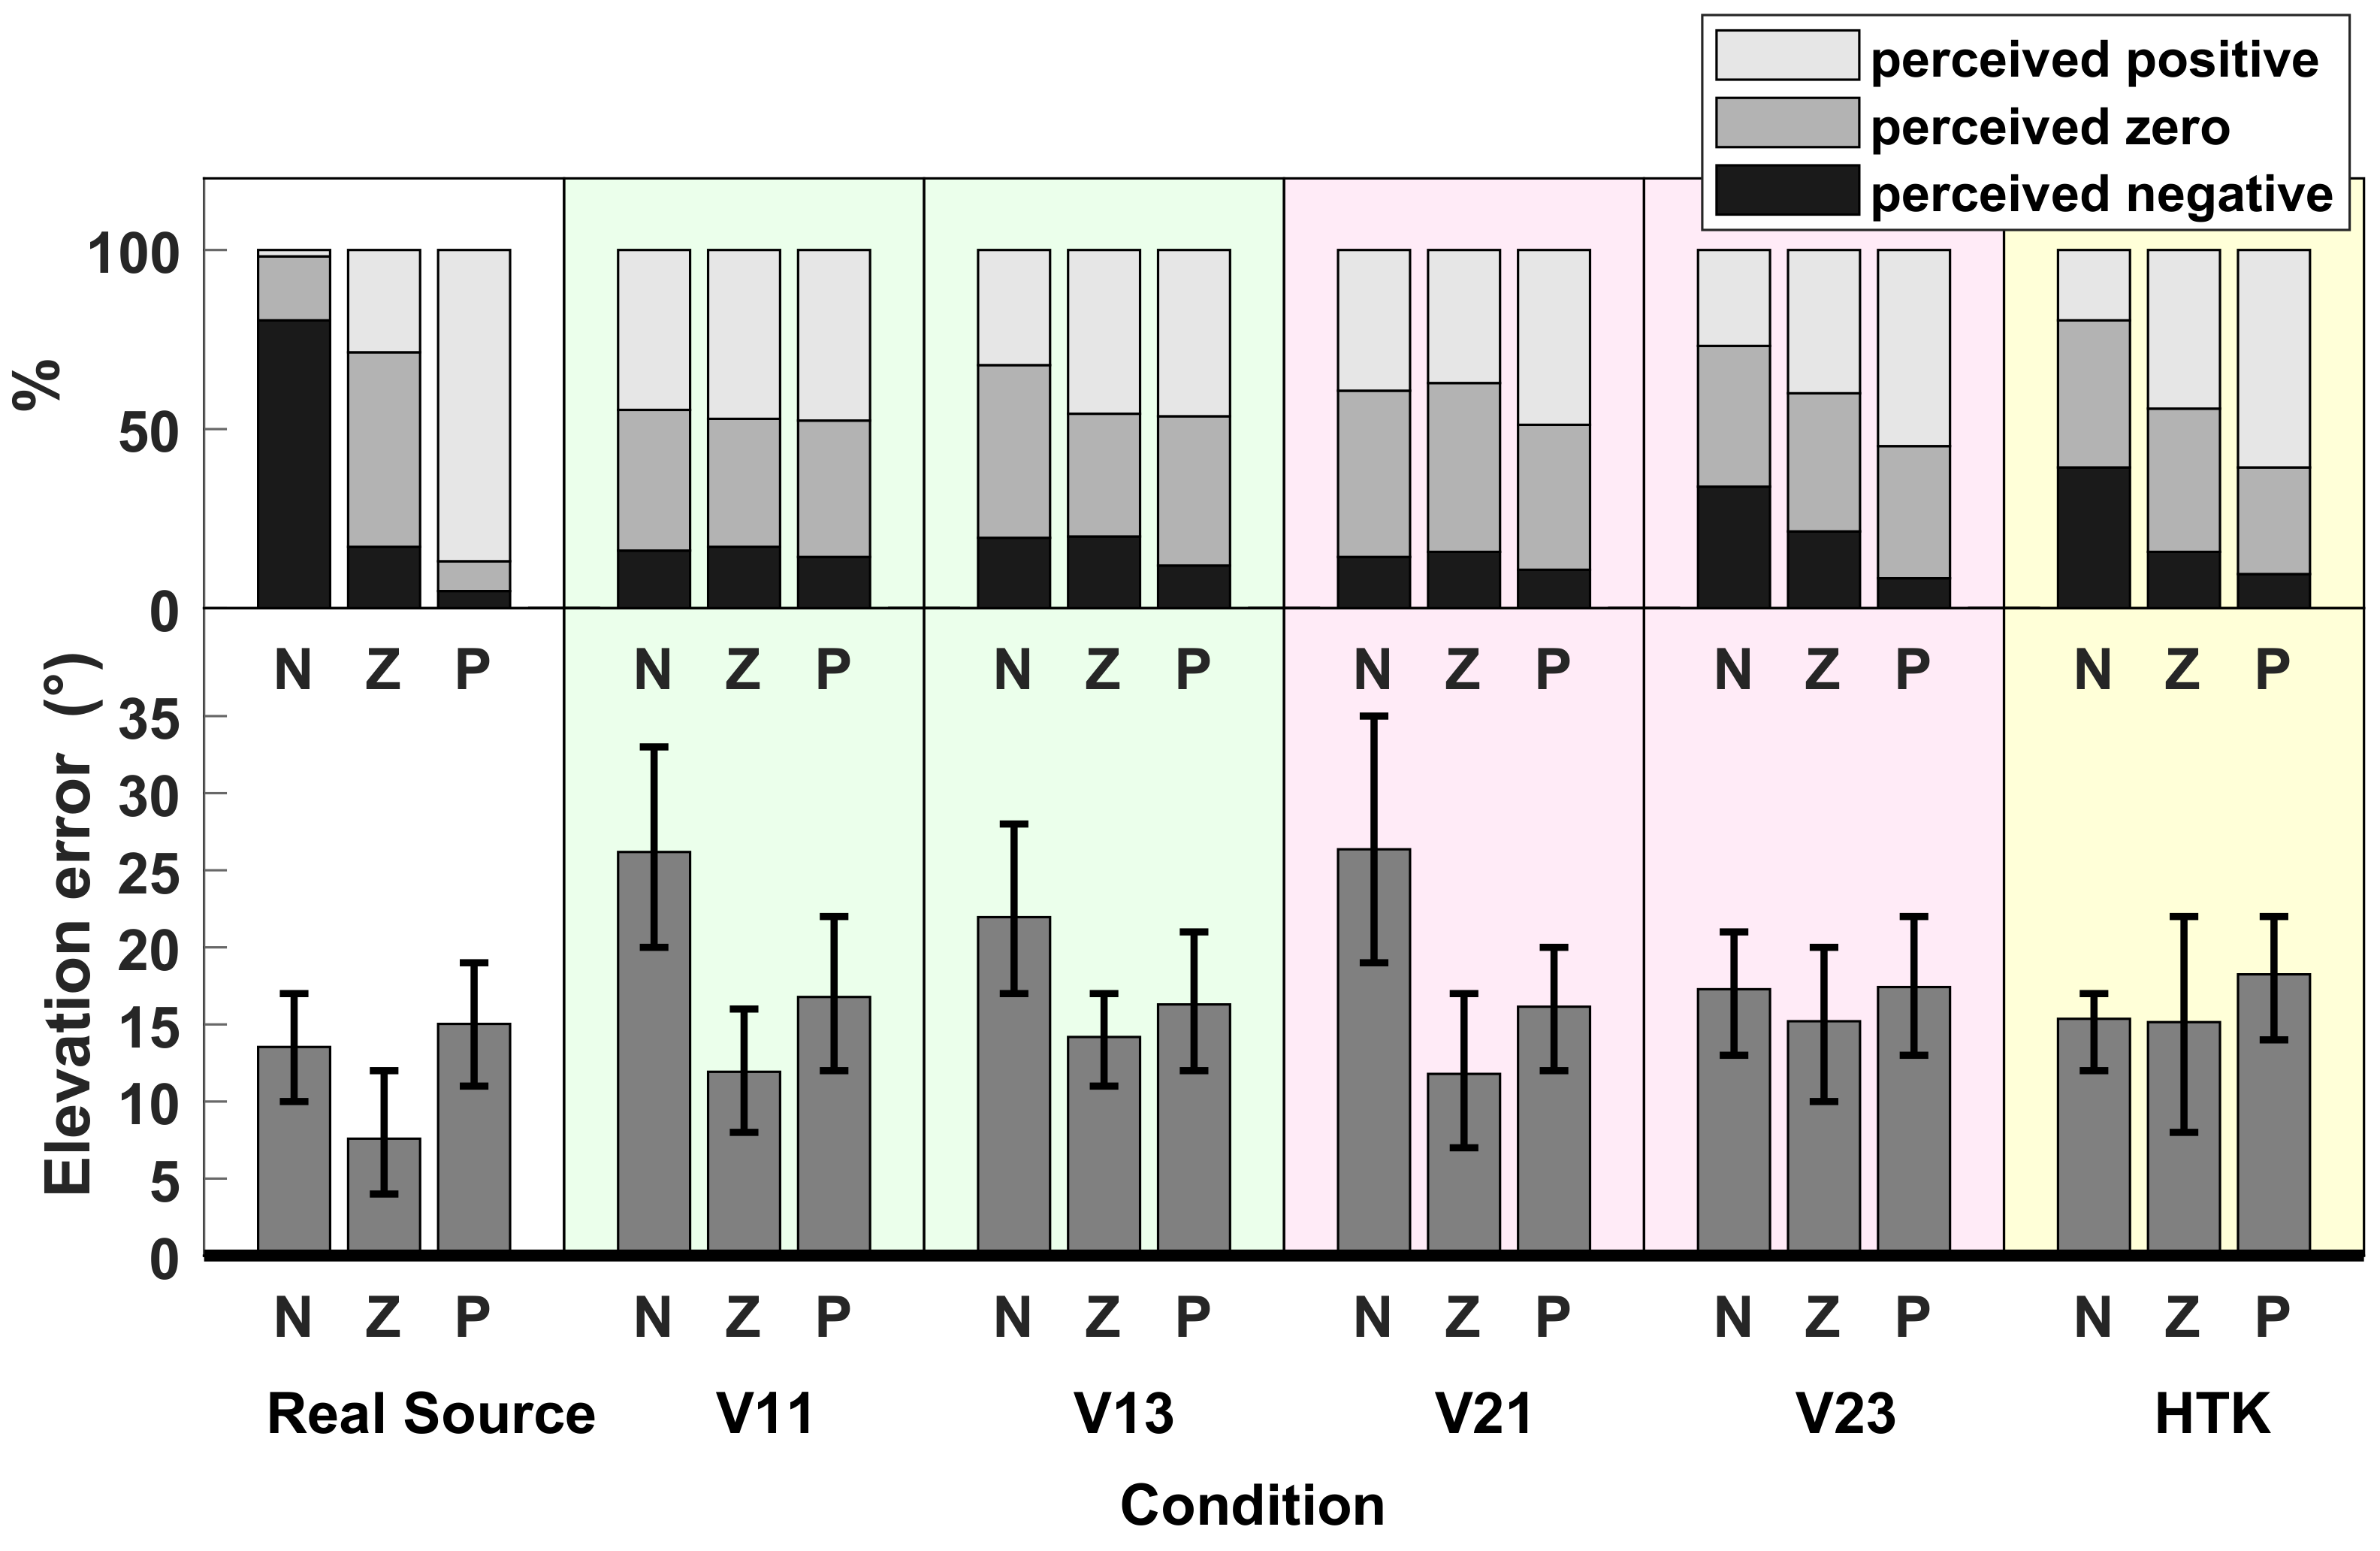
Elevation: The elevation error was calculated as the absolute difference between target and response elevations, separately for negative (<0, N), zero (=0, Z) and positive (>0, P) target elevations. The lower part of Figure 7 shows the elevation error averaged over 14 subjects. According to the Shapiro–Wilk test of normality, the elevation errors could not be assumed to be normally distributed. Therefore, the Friedman test was applied, according to which there were significant differences in the average elevation error when localizing real or different virtual sources for negative (p < ) and zero (p = 0.01) target elevations. The multiple comparison after the Friedman test (function friedmanmc in R [21]) revealed significantly different average elevation errors between real sources and V11, between real sources and V21 (for negative target elevations) and between real sources and V23 (for zero target elevations).
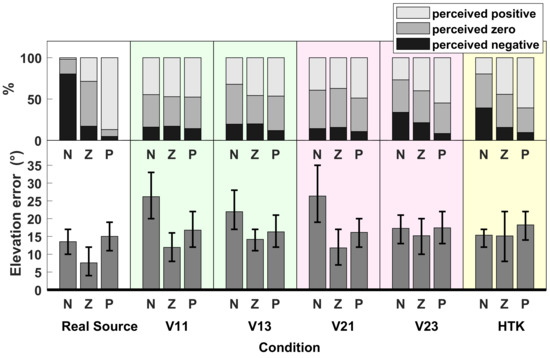
Figure 7.
Average elevation error, when localizing real sources in TestReal (Real Source) and virtual sources in TestVR (generated with V11,V13, V21, V23 and HTK). (Bottom) Absolute error, averaged over 14 subjects for negative (N), zero (Z) and positive (P) target elevations. Error bars indicate 95% confidence intervals. (Top) Percentages of response elevations, which were perceived as negative (below −5), zero (between −5 and +5) or positive (above +5).
To offer some information about the signs of the response elevations, the upper part of Figure 7 shows, for each average elevation error split into N, Z and P, the percentages of response elevations which were positive, zero or negative. To calculate these percentages, response elevations were classified as positive or negative, if they were above +5 or below −5, respectively; and they were classified as zero if they were between −5 and +5.
With real sources, the signs of response elevations were in good agreement with the signs of target elevations, i.e., the majority of negative, zero and positive real target sources were perceived correctly as negative, zero and positive, respectively. Nevertheless, it should be noted that, as shown in the lower part of Figure 5, the response elevations for TestReal extended from below −50 to above +70, although the target elevations varied between −20 and +25 only. Indeed, subjects tended to underestimate negative elevations and overestimate positive elevations. This was presumably caused by response mapping to the GUI, which included the additional step of translating the perceived elevation in the vertical angle to the horizontal plane, which apparently could not be performed correctly by the subjects.
With virtual sources, on the other hand, accordance of the signs between target and response elevations could be observed only in a weak form for V23 and HTK; for V11, V13 and V21, target elevations were perceived as zero or positive most of the time, regardless of the sign of the target elevation. Additionally, with HTK, a large percentage of zero target elevations were perceived as positive.
Externalization rate: Externalization rate was defined as the percentage of the time a target source was perceived as outside the head. The responses given for the source distance were converted into an externalization rate by dividing them into two groups: “not externalized” (scores 0 and 1) and “externalized” (scores 2, 3 and 4), and then calculating the percentage of responses classified as externalized. Figure 8 shows the externalization rate over target azimuths.
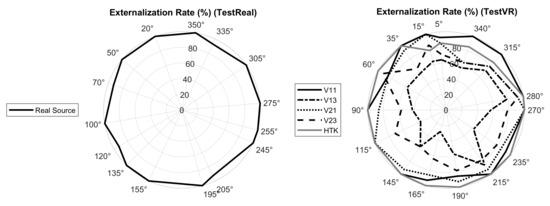
Figure 8.
Externalization rate, defined as the percentage of responses classified as externalized, when localizing real sources in TestReal (Real Source) and virtual sources in TestVR (generated with V11, V13, V21, V23 and HTK).
As the polar diagrams in Figure 8 show, real sources were almost always externalized, which was an expected result. Externalization rates for virtual sources generated with V11, V21 and HTK were comparable to externalization rates for real sources, whereas for virtual sources generated with V13 and V23, externalization rates were markedly lower. Figure 9 shows the externalization rates averaged over target positions. According to the Shapiro–Wilk test of normality, the average externalization rates could not be assumed to be normally distributed. Therefore, the Friedman test was applied, which revealed significant differences in the average externalization rates when listening to real or different virtual sources (p < ). According to the multiple comparison after the Friedman test, virtual sources generated with V13 and V23 were significantly less externalized than other sources. There were no significant differences between the externalization rates of virtual sources generated with V11, V21 and HTK and the real sources.
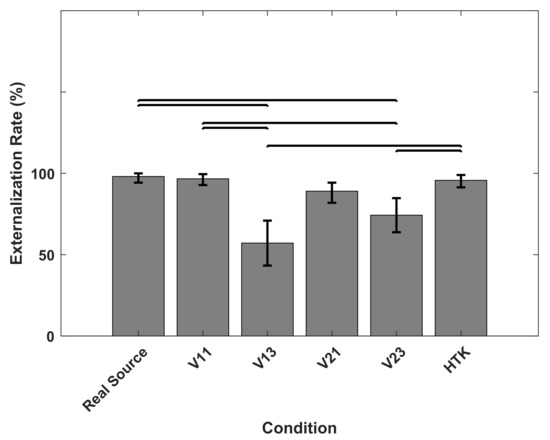
Figure 9.
Externalization rate averaged over target positions, when listening to real sources in TestReal (Real Source) and to virtual sources in TestVR (generated with V11, V13, V21, V23 and HTK). Horizontal bars indicate significant differences (multiple comparison after Friedman test, p < 0.05). Error bars indicate 95% confidence intervals.
Reversal rates:Table 2 shows the reversal rates, defined as the percentages of responses classified as front–back reversals. With real sources, this rate was equal to 1.4%. For virtual sources generated with V11, V21 and HTK, reversal rates were smaller or comparable to those of real sources (between 0.47% and 1.4%). Reversal rates were slightly higher for V23 (1.9%) and much higher for V13 (4.2%).
Table 2.
Reversal rate when localizing real sources in TestReal (Real Source) and virtual sources in TestVR (generated with V11, V13, V21, V23 and HTK).
3.3. Discussion
According to the results, average azimuth errors and externalization and reversal rates were similar among the real sources and virtual sources generated with V11 and V21. In the two previous studies which reported a good perceptual performance for the VAH [12,13], not only could subjects see the sound sources, but the experiment task was also different. In those studies, subjective ratings were given for the matches between positions of real and virtual sources rather than giving direct judgments about the perceived azimuth angles and elevation. Nevertheless, the results in the present study showed that in the absence of visual cues and for a more challenging localization task, it is possible to generate virtual sources with the VAH with comparable externalization and azimuth localization performances as real sound sources. In line with the previous study [13], VAH BRIRs synthesized with spectral weights with only horizontal directions included (V11 and V21) performed better than the syntheses with horizontal and non-horizontal directions included (V13 and V23). As already discussed in Section 2.2, the inclusion of horizontal and non-horizontal directions introduced increased spectral and temporal distortions, which impacted the localization performance negatively. The degradation in binaural cues, due to temporal and spectral distortions, led to a lack of externalization with V13 and V23. In addition, regarding the important dynamic cues provided by low frequency interaural time differences (ITDs) when listening to speech signals [22,23], the deteriorated low frequency ITDs could also explain the higher reversal rates of V13 and V23, despite a dynamic presentation with head tracking.
According to the results, azimuth accuracy, externalization and reversal rates were very convincing for virtual sources generated with BRIRs of the KEMAR artificial head (HTK), despite the non-individuality of these BRIRs. Listening to non-individual recordings can degrade the externalization and increase front–back reversals in static scenarios without head tracking [1,2,3]. In contrast, it has been shown that when head movements are enabled, externalization is improved and reversal rates can be reduced, regardless of whether the subject is listening to individual or non-individual binaural signals [3,4,24]. The fact that the non-individual signals of HTK could be presented dynamically was advantageous for improving externalization and reducing the reversals. In general, the results confirm previous studies of the authors [12,13], in that for speech signals and with head tracking, individual binaural signals do not constitute a major advantage over non-individual signals of a conventional artificial head. However, the effort to acquire the non-individual BRIRs of the artificial head for different head orientations should not be neglected.
Elevation perception with virtual sources was in general not very convincing in comparison to the results with real sources. When listening to virtual sources, subjects seemed to have difficulty dealing with the task of vertical localization. This will be discussed more thoroughly in Section 5.
4. Part II: The Impact of Head Tracking on the Localization Performance
Although in the first part head tracking was included, in the second part we wanted to explicitly assess the impact of head tracking by comparing the localization performances of virtual sources in two listening tests, either with head tracking (referred to as TestDynamic) or without head tracking (referred to as TestStatic). The same VAHs as in Part I (see Figure 1) were used to synthesize individual BRIRs with spectral weights calculated with the parameters listed in Table 1. Since the BRIRs synthesized with V13 in Part I performed worse than the other VAH BRIRs with respect to azimuth accuracy and externalization rates, V13 was not considered in Part II.
For both listening tests, BRIRs individually synthesized with V11, V21 and V23, each for 185 head orientations, and KEMAR BRIRs acquired for 37 horizontal head orientations (HTK), were considered. Measurements were performed in the same way as for TestVR described in Section 3.1.3, but for another set of 15 target source positions (see Figure 2c). The BRIRs were the same in TestDynamic and TestStatic; the difference between both tests concerned solely the presentation method, i.e., with or without head tracking. In order to distinguish between the BRIRs in both tests, for TestStatic, BRIRs were assigned with subscripts V11, V21, V23 and HTK.
4.1. Experiment Design
4.1.1. Response Method: GUI
The GUI used in Part I, shown in Figure 4, was used with a few modifications. Since the experiments were designed to have only virtual presentations, no reference signal was provided for the perceived source distance. Therefore, the button “Reference” was omitted from the GUI. Subjects had to judge the perceived distance solely with respect to their own bodies, using an ordinal scale ranging from 0 to 3, corresponding to (0) in the head, (1) outside but near the head, (2) outside the head and within reach and (3) outside the head and further away. The frontal direction of azimuth = 0 and elevation = 0, corresponding to the forward head orientation, was marked in front of the subjects in the room. In TestDynamic, subjects were asked to orient their heads towards this point in the room and click the “Reset” button on the GUI to reset the head tracker before listening to the virtual sources. In TestStatic, the “Reset” button was omitted from the GUI.
4.1.2. Experimental Setup, Subjects and Test Signal
Both listening tests, TestDynamic and TestStatic, were performed in the control room of the recording studio at Jade University of Applied Sciences (4.7 m × 5.1 m × 3 m, average reverberation time: 0.35 s). The choice of using different recording and listening environments was in line with practical applications, since in general it is not always straightforward to listen to binaural signals in the same environment as where they were captured, e.g., signals recorded in a moving vehicle or during a concert. During listening tests, the room was normally illuminated and subjects could see the room and the objects in it (desk, mixing console, loudspeakers, etc.). Subjects were informed that there was no association between the virtual target sources and any objects in the room. Subjects were in addition informed that the signals had been captured in an anechoic environment, and that they should imagine themselves in an anechoic room to judge the distances from the presented sources. The GUI was presented to the subjects via a laptop, connected to the audio interface and headphone amplifier. In each test, each of the 15 target source positions was presented four times, i.e., once with each of the four BRIRs (V11, V21, V23 and HTK in TestDynamic and V11, V21, V23 and HTK in TestStatic). This resulted in a total of 60 virtual sources for each test, presented in a randomized order. Prior to each test, five of these 60 virtual sources were chosen randomly to be presented for familiarization and were discarded from the evaluations. No feedback was given to the subjects during the familiarization and during the listening test.
The same 14 subjects who participated in TestReal and TestVR in Part I, took part in the new listening tests. Seven subjects started with TestDynamic, whereas the other seven subjects started with TestStatic. For each subject, there was a pause of at least one day between both tests. During TestDynamic, subjects were encouraged to move their heads within the allowable range of ±90 horizontally and ±15 vertically. During TestStatic, subjects were made aware that head tracking was switched off.
The test signal was the same speech signal spoken by a female speaker as in TestReal and TestVR in Part I.
4.2. Results
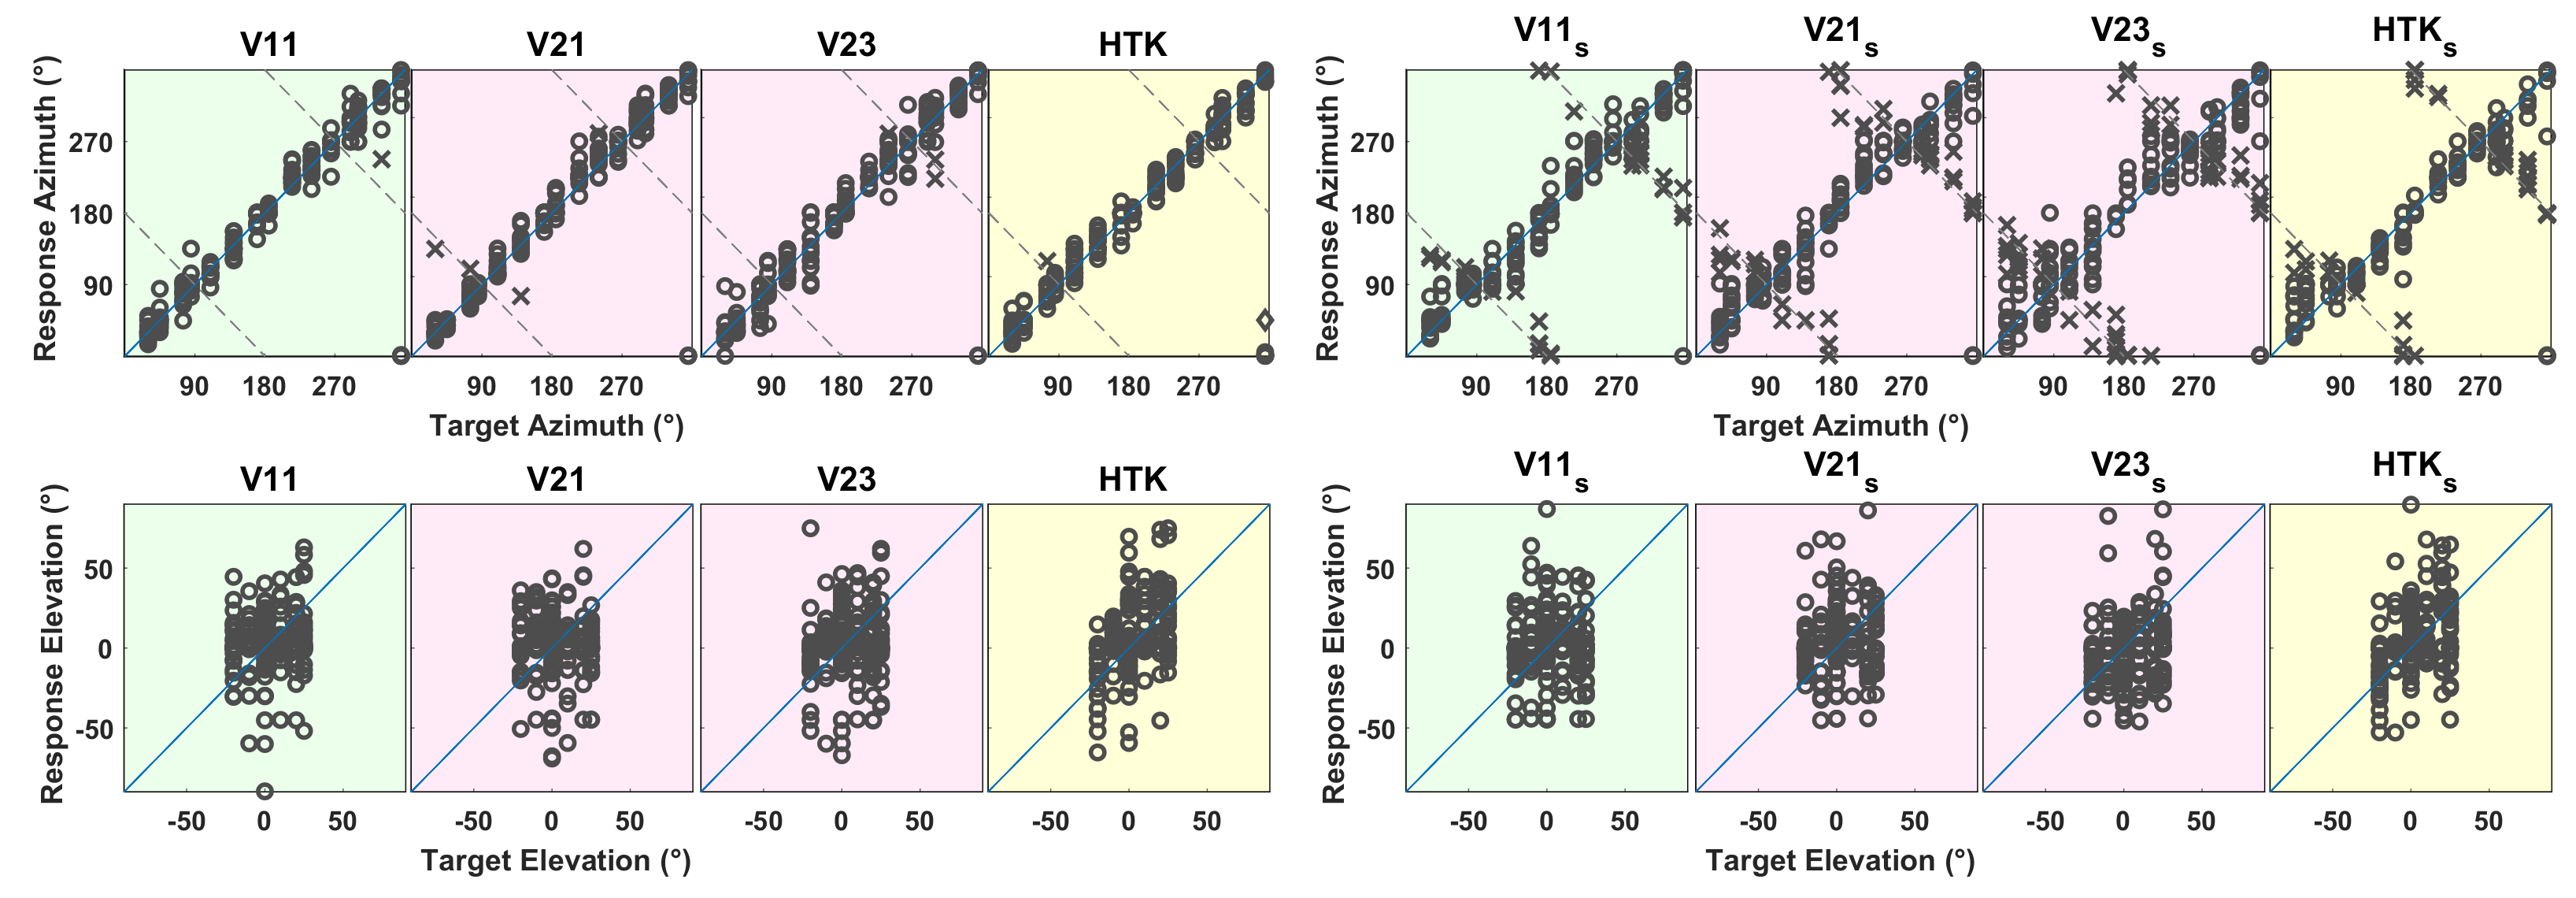
Figure 10 shows response vs. target azimuths and elevations reported by 14 subjects in TestDynamic and Teststatic. Responses marked with a × indicate front–back reversals and the response marked with a ◇ for HTK indicates an invalid localization (for the same subject as in Part I) and was excluded from further analysis.

Figure 10.
Response azimuth or elevation (ordinate) vs. target azimuth or elevation (abscissa). (Left) Results when listening to virtual sources generated with V11, V21, V23 and HTK in TestDynamic. (Right) Results when listening to virtual sources generated with V11, V21, V23 and HTK in TestStatic. Responses marked with a × indicate front–back reversals and the response marked with a ◇ indicates an invalid localization. Dashed lines represent possible subject responses in case of a perfect front–back confusion.
Azimuth:Figure 11a shows the azimuth error averaged over 14 subjects and 15 target source positions for different BRIRs in TestDynamic and TestStatic. Front–back reversals were excluded from the error calculation. According to the Shapiro–Wilk test of normality, the azimuth error could be assumed to be normally distributed. Therefore, a paired t-test was applied which revealed that for all BRIRs, the average azimuth error was significantly higher in TestStatic compared to TestDynamic (t-values shown in Figure 11a). In Figure 11b, the average azimuth error is shown for the 14 subjects separately for target positions grouped into front and back. For target sources both in front and behind, the average azimuth error was higher in TestStatic compared to TestDynamic. Since front–back reversals were excluded from the azimuth error calculation, the results indicate that for cases where no front–back reversals occurred, the azimuth error was smaller with head movement, though limited to the frontal hemisphere, than without head movement.
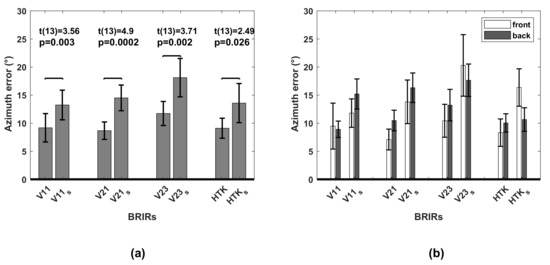
Figure 11.
(a) Azimuth error, averaged over 14 subjects and all target sources when localizing virtual sources generated with V11, V21, V23 and HTK in TestDynamic and with V11, V21, V23 and HTK in TestStatic. Horizontal bars indicate significant differences (according to paired t-test). (b) Azimuth error in TestDynamic and TestStatic, averaged over 14 subjects for target sources grouped into front and back. All error bars indicate 95% confidence intervals.
Elevation: The lower part of Figure 12 shows the elevation error averaged over 14 subjects in both tests, separately for negative, zero and positive target elevations. The upper part of Figure 12 shows the percentages of response elevations which were positive, zero or negative, calculated in a similar way as in Section 3.2. According to the Shapiro–Wilk test of normality, the average elevation errors could not be assumed to be normally distributed. Therefore, the Wilcoxon signed-rank test was applied separately to the negative, zero and positive target elevations, which revealed no significant differences in the average elevation error in TestDynamic compared to TestStatic for any of the groups of positive, zero and negative target elevations and for any of the BRIRs. This means that there was apparently no effect of head movement on the vertical localization accuracy. The accordance of the signs between target and response elevations could be observed, though in a weak form, only for HTK and HTK and for V23 and V23.
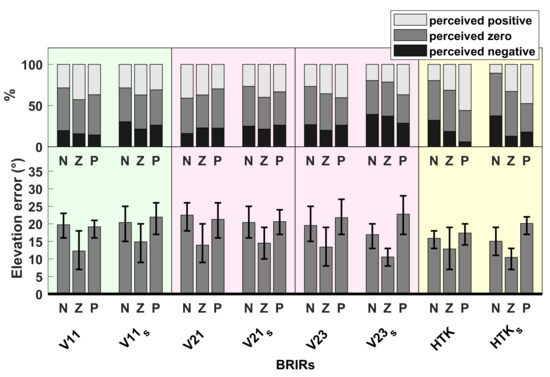
Figure 12.
Average elevation error, when localizing virtual sources generated with V11, V21, V23 and HTK in TestDynamic and with V11, V21, V23 and HTK in TestStatic. (Bottom) Absolute error, averaged over 14 subjects for negative (N), zero (Z) and positive (P) target elevations. Error bars indicate 95% confidence intervals. (Top) Percentages of response elevations which were perceived as negative (below −5), zero (between −5 and +5) or positive (above +5).
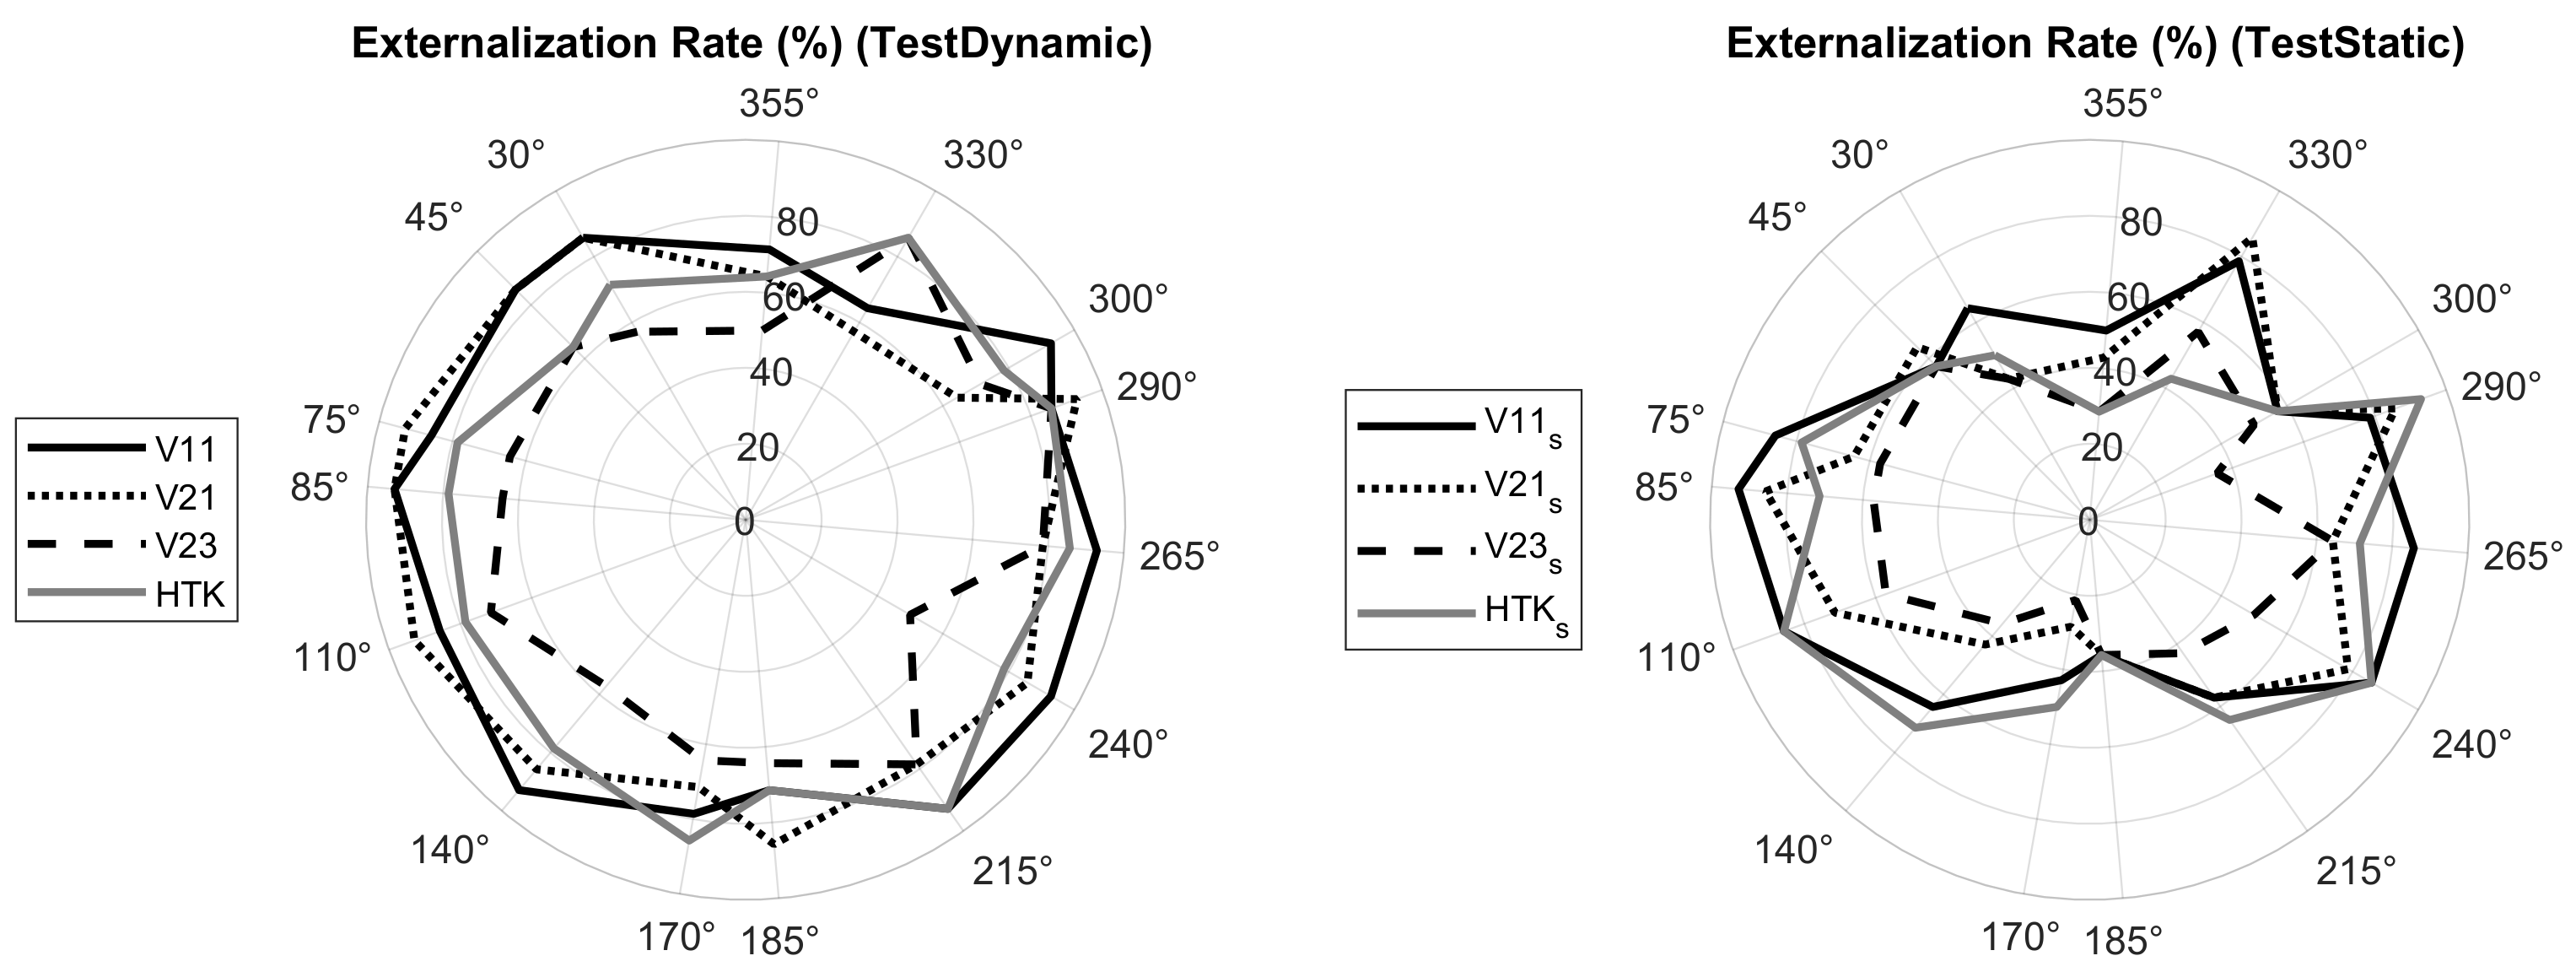
Externalization rate: To calculate the externalization rate as defined in Part I, the responses given for the source distance were divided into two groups: “not externalized” (scores 0 and 1) and “externalized” (scores 2 and 3). Figure 13 shows the externalization rate over the target azimuths.

Figure 13.
Externalization rate when localizing virtual sources generated with V11, V21, V23 and HTK in TestDynamic (left) and with V11, V21, V23 and HTK in TestStatic (right).
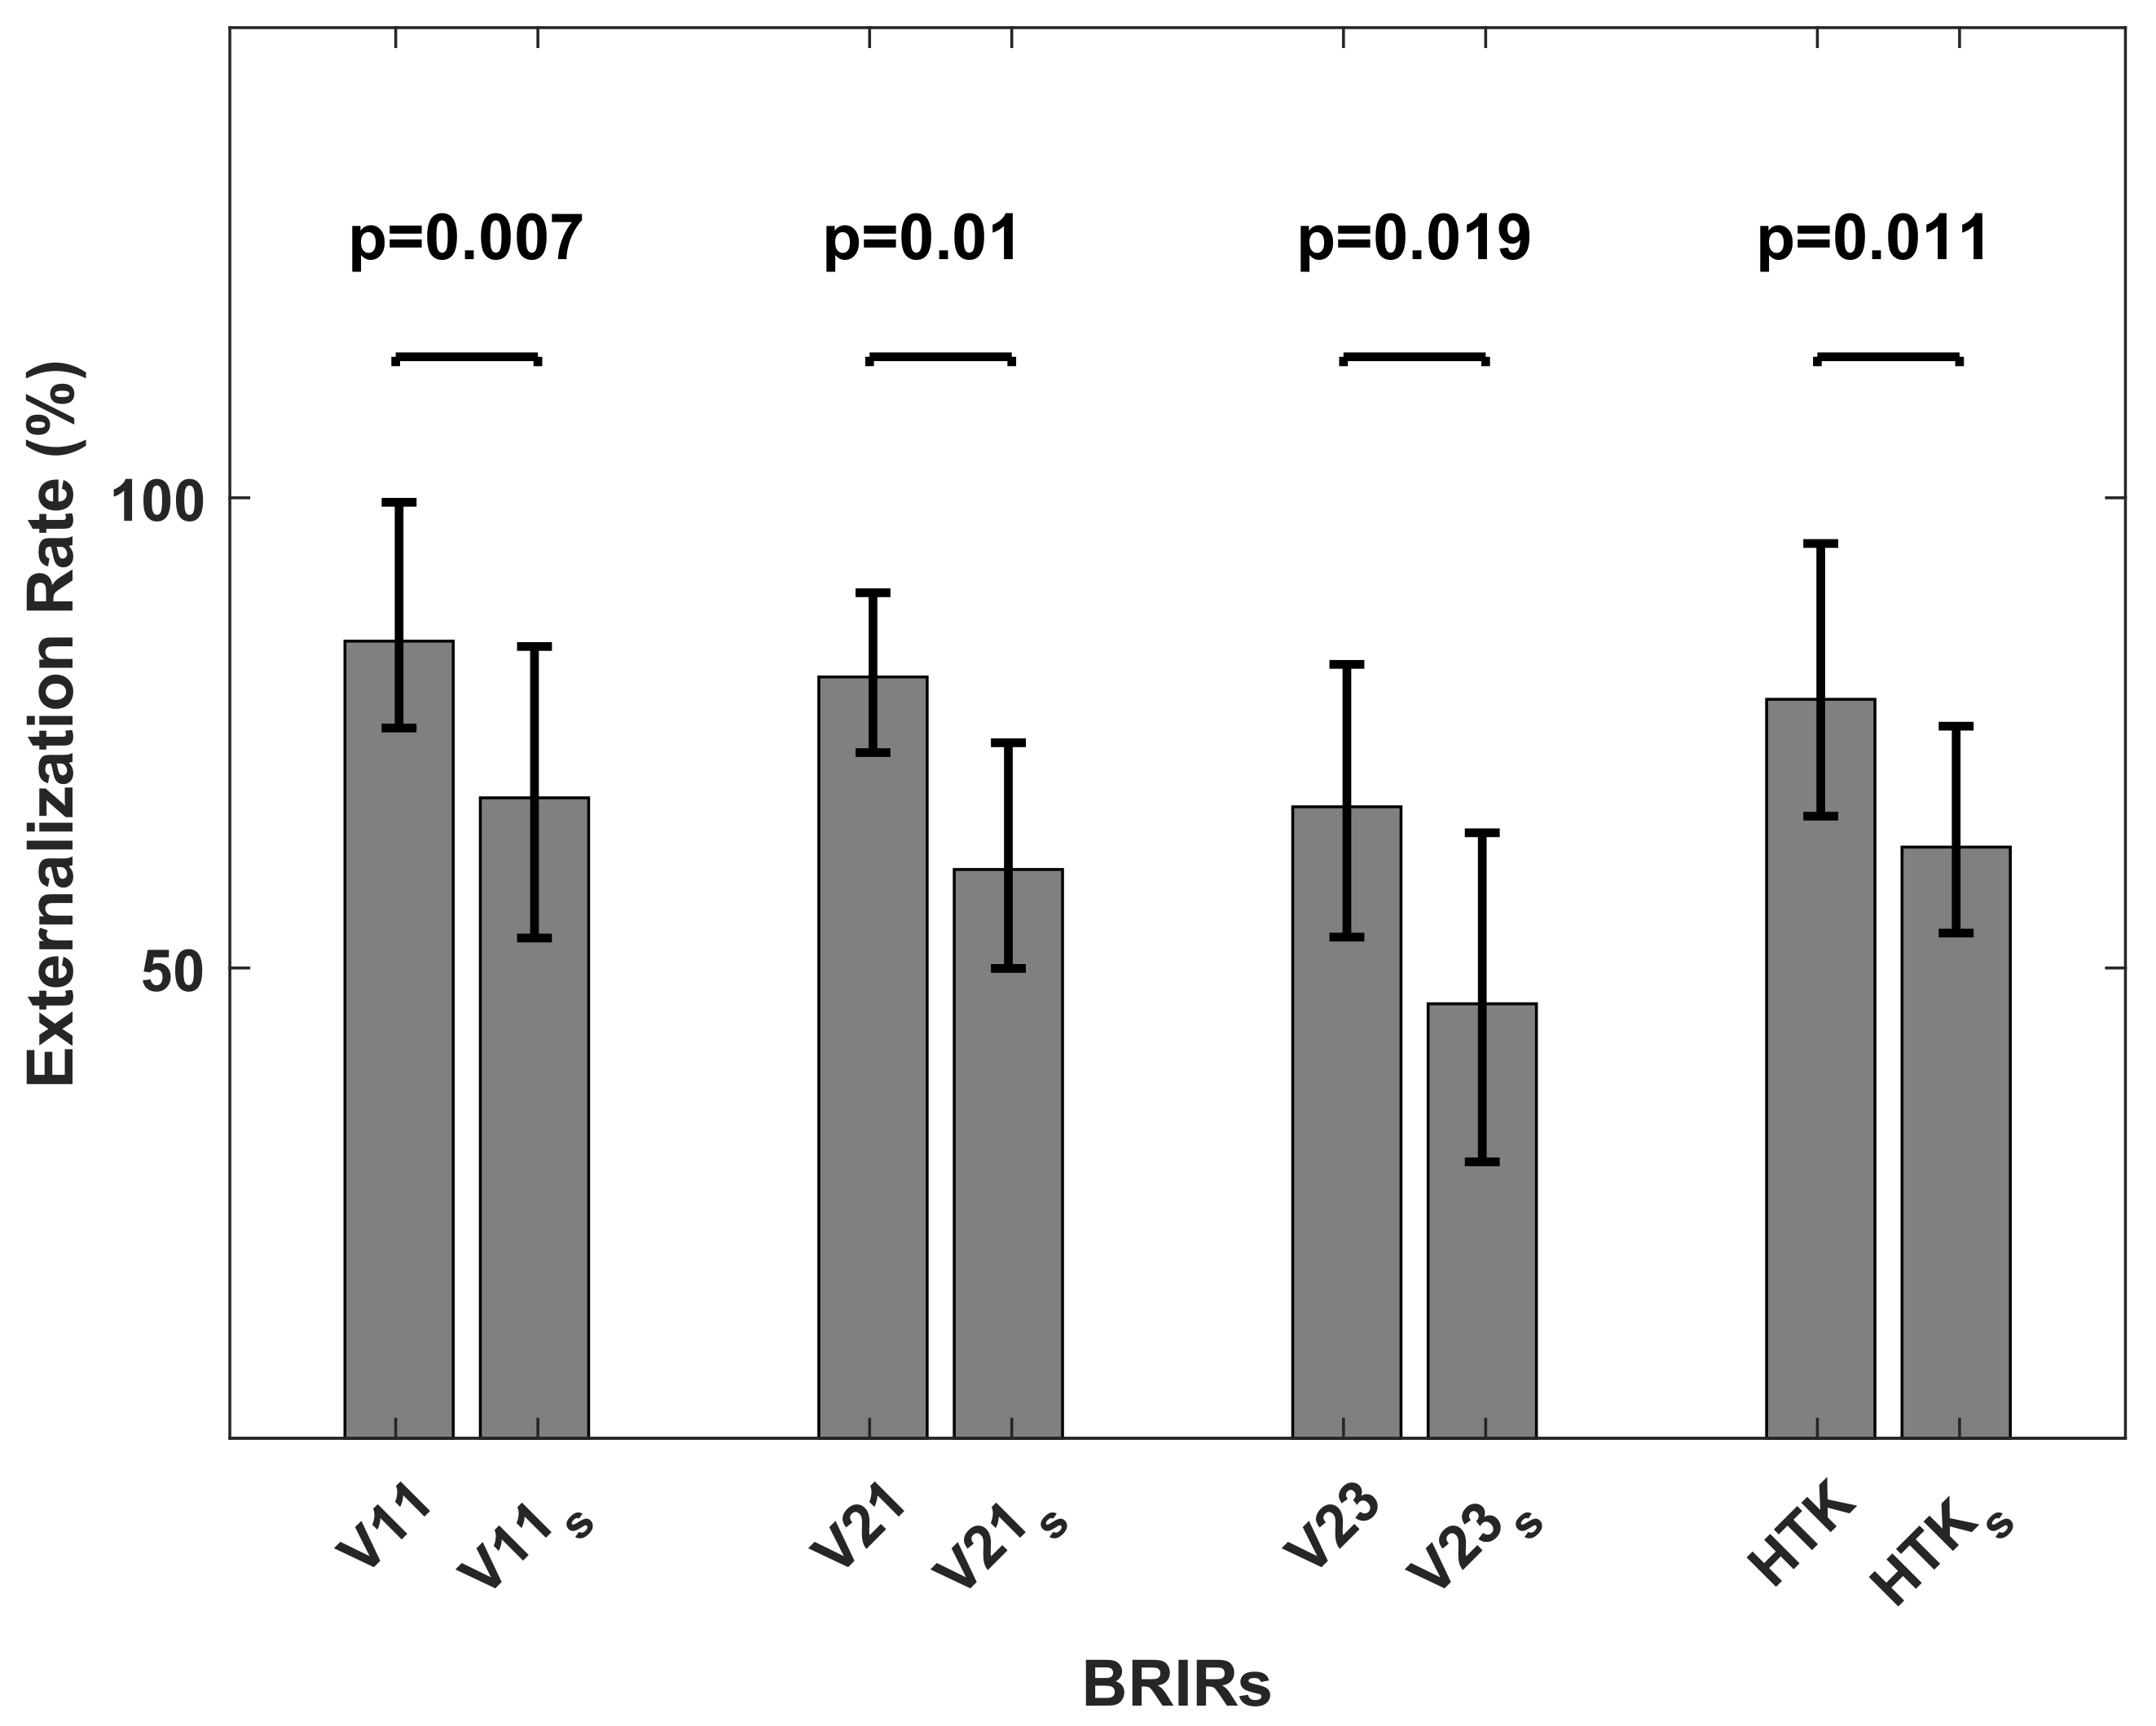
The polar diagrams in Figure 13 show that externalization rates were in general lower in TestStatic than in TestDynamic. Figure 14 shows the externalization rates averaged over the target positions. According to the Shapiro–Wilk test of normality, the average externalization rates could not be assumed to be normally distributed. Therefore, the Wilcoxon signed-rank test was applied, which revealed that for all BRIRs, average externalization rates were higher in TestDynamic than in TestStatic (p-values shown in Figure 14). The results confirm the positive impact of head tracking on the externalization of virtual sources presented through headphones [3,5,20].
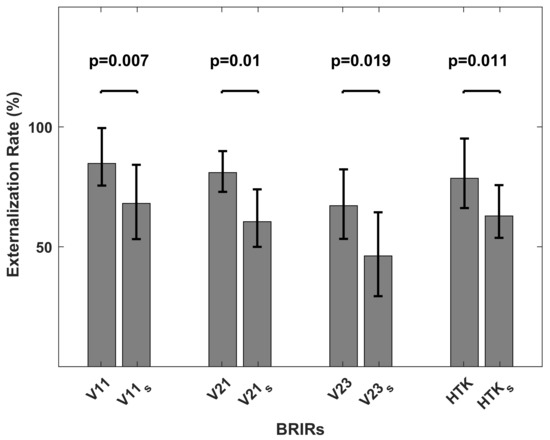
Figure 14.
Externalization rate, averaged over target positions, when listening to virtual sources generated with V11, V21, V23 and HTK in TestDynamic and with V11, V21, V23 and HTK in TestStatic. Horizontal bars indicate significant differences (according to the Wilcoxon signed-rank test). Error bars indicate 95% confidence intervals.
Reversal rates:Table 3 shows the reversal rates in both tests. When localizing virtual sources generated with V11, V21, V23 and HTK in TestStatic, the reversal rates were considerably larger than when localizing virtual sources generated with V11, V21, V23 and HTK in TestDynamic. This result clearly confirmed the positive impact of head movements on the reduction of front–back reversals [3,4,25].
Table 3.
Reversal rate when localizing virtual sources generated with V11, V21, V23 and HTK in TestDynamic and with V11, V21, V23 and HTK in TestStatic.
4.3. Discussion
In line with previous studies [3,4,5,20,25], the dynamic presentation in TestDynamic improved the localization performance of virtual sources with respect to azimuth, externalization and the reduction of front–back reversals compared to TestStatic. Horizontal head movements limited to the frontal hemisphere were also advantageous for the localization accuracy of virtual sources located to the rear.
No effect of head movement on the vertical localization accuracy could be observed. Some previous studies reported a positive impact of horizontal head movements on vertical localization. Such an advantage, however, was only found for sources limited to the median plane or the left lateral plane [23,26] or only for low-frequency noise signals [27]. In the current study, target sources were distributed all around the listener and a more broadband signal (speech) was used. Therefore, the results were more in line with localization studies using speech signals [4] or a wider range of source positions [25], which also reported no specific effect of head movements on the elevation error. The unconvincing performances in vertical localization in TestDynamic and TestStatic were similar to the performance in TestVR in Part I, and suggested that independently of the presentation method, subjects had difficulty dealing with the task of vertical localization.
Apart from the generally poor elevation results, the localization performance of virtual sources generated with the non-individual BRIRs (HTK or HTK) was comparable to the localization performance of virtual sources generated with the individually synthesized VAH BRIRs (V11 and V21 or V11 and V21). When considering the results of TestDynamic and TestStatic separately, the individually synthesized VAH BRIRs offered no special advantage over the non-individual KEMAR BRIRs. It should, however, be kept in mind that the dynamic presentation of KEMAR BRIRs was artificially enabled in this study. In standard applications of conventional artificial heads, dynamic presentation of binaural recordings is not possible; in contrast, the VAH straightforwardly allows one to dynamically present recordings. Therefore, from a practical point of view, one should compare the localization performance of VAH BRIRs in TestDynamic with KEMAR BRIRs in TestStatic. Not only was the reversal rate higher for HTK in TestStatic (20%) compared to VAH BRIRs in TestDynamic (below 2%), but also the average azimuth error for HTK was significantly higher than for V11 (t(13) = 3.21, p = 0.006) and V21 (t(13) = 2.94, p = 0.014). Furthermore, according to the Wilcoxon signed-rank test, the average externalization rate for HTK was significantly lower compared to V11 (p = 0.002) and V21 (p = 0.034). This analysis indicated that besides individualization, an important advantage of the VAH technology over conventional artificial heads is the dynamic presentation of recorded signals, a feature shown in this study to largely improve the localization performance with virtual sources.
5. General Discussion
This section provides some general discussion which applies to both parts of this study.
With respect to the correct perception of the target elevation sign, the performance for virtual sources was poorer than for real sources. On average, virtual target sources both inside and outside the horizontal plane were often perceived as higher than they were. The tendency to perceive virtual sources with a positive bias was reported in some previous studies using non-individual HRTFs [28,29,30]. The missing individual features in BRIRs could not have been the only reason for the elevation bias in the present study, since otherwise this phenomenon should not have occurred for horizontal virtual sources generated with the VAHs that included horizontal directions in the calculation of the spectral weights (V11 and V21), because the monaural spectral and temporal features of individual horizontal BRIRs could be preserved well with these syntheses.
However, the elevation bias observed in the present study was an average tendency and did not apply to all subjects. One subject, for instance, perceived over 60% of all virtual target elevations as negative, whereas the two other subjects mostly gave elevation responses zero, independently of target’s elevation or the BRIR. The pattern of elevation perception was not consistent among all subjects. The clear trend is that the elevation localization was more difficult with virtual sources than with real sources. One can argue that when listening to speech signals, the main elevation cues related to the pinna reflections (above about 5 kHz [31,32]) cannot be presented well. However, the elevation localization performance was quite impressive with the same speech signal when listening to real sources. It is not clear whether the poor elevation localization with virtual sources was solely related to the synthesis inaccuracy of VAH BRIRs and the non-individuality of KEMAR BRIRs, nor whether also factors related to the rendering process played a role. The localization experiment should be repeated with individually measured BRIRs in order to provide more details.
Despite the generally unconvincing elevation perception with the VAH BRIRs, the target elevation sign could be better perceived with VAH2 with horizontal and non-horizontal directions included (V23 in TestVR) compared to other VAH BRIRs. This was, however, not the case for VAH1 with horizontal and non-horizontal directions included (V13 in TestVR). The three-dimensional topology of VAH2 was suspected to have contributed to the better elevation perception compared to VAH1. It seemed that the sound incidence from different elevations could be better recognized with microphones having different positions along the z-axis than with microphones distributed at the same height. The additional seven microphones of VAH2 compared to VAH1 could also have been advantageous. Further investigations with VAH1 and VAH2 or other array topologies are required to confirm these statements.
An important point to be mentioned is that the results achieved in both parts of this study were obtained using speech signals. In general, the synthesis accuracy of the VAHs decreases towards higher frequencies [11,13]. In addition, in case of measured BRIRs of a conventional artificial head, the non-individuality gets more prominent at higher frequencies. In applications with signals with more pronounced high-frequency spectral content, the localization performance with synthesized VAH BRIRs or non-individual BRIRs of a conventional artificial head could be different from the current study.
6. Conclusions
In this study, the localization performance when dynamically rendering virtual sources generated with a virtual artificial head (VAH) was evaluated. We investigated both the difference in performance in regard to real sources and the impact of head tracking. Two different VAHs were used to capture the room impulse responses for different three-dimensional source positions in an anechoic room. Spectral weights calculated for 185 head orientations of individual listeners were applied to the measured room impulse responses to result in individually synthesized BRIRs, which were convolved with the test signal (speech) and presented through headphones.
The major conclusions of the study can be summarized as follows: (i) Even in the absence of visual cues, similar localization accuracies as with real sources could be achieved with the VAHs with respect to azimuth, externalization and number of front–back reversals. The vertical localization performance using virtual sources generated with the VAHs was not as convincing as the vertical localization performance using real sources. (ii) The localization experiments with and without head tracking confirmed the importance of dynamic presentation for the localization accuracy when listening to virtual sources generated with the VAHs or with a conventional artificial head, even if head movements were limited only to the forward directions. (iii) With dynamic presentation being artificially enabled for speech signals, the non-individual BRIRs of the conventional artificial head performed similarly to individually synthesized BRIRs. (iv) Regarding the fact that in practical applications, binaural recordings with conventional artificial heads cannot be presented dynamically, the possibility of presenting binaural signals recorded with the VAH dynamically is the major advantage of virtual artificial heads over conventional ones.
Author Contributions
Conceptualization, M.F., M.H., S.D. and M.B.; Methodology, M.F., M.H., S.D., S.v.d.P. and M.B.; Software, M.F. and M.B.; Validation, M.F., M.H., M.B.; Formal analysis, M.F.; Investigation, M.F.; Writing—Original draft preparation, M.F.; Writing—Review and Editing, M.F., M.H., S.D., S.v.d.P. and M.B.; Visualization, M.F.; Supervision, M.H., S.D., S.v.d.P., D.P. and M.B.; Project Administration, M.B.; Funding Acquisition, M.H., D.P. and M.B.; All authors have read and approved the submitted manuscript.
Funding
This research was funded by Bundesministerium für Bildung und Forschung under grant number 03FH021IX5.
Institutional Review Board Statement
The study was conducted according to the guidelines of the Declaration of Helsinki, and approved by the Ethics Committee of the Carl von Ossietzky University of Oldenburg (Drs. 1r72/2018).
Data Availability Statement
Informed consent was obtained from all subjects involved in the study.
Acknowledgments
We would like to thank all our subjects for their voluntary participation in the listening tests.
Conflicts of Interest
The authors declare no conflict of interest.
References
- Wenzel, E.M.; Arruda, M.; Kistler, D.J.; Wightman, F.L. Localization using nonindividualized head-related transfer functions. J. Acoust. Soc. Am. 1993, 94, 111–123. [Google Scholar] [CrossRef]
- Møller, H.; Sørensen, M.F.; Jensen, C.B.; Hammershøi, D. Binaural Technique: Do we need individual recordings? J. Audio Eng. Soc. 1996, 44, 451–469. [Google Scholar]
- Oberem, J.; Richter, J.G.; Setzer, D.; Seibold, J.; Koch, I.; Fels, J. Experiments on localization accuracy with non-individual and individual HRTFs comparing static and dynamic reproduction methods. bioRxiv 2020. [Google Scholar] [CrossRef] [Green Version]
- Begault, D.R.; Wenzel, E.M.; Anderson, M.R. Direct Comparison of the Impact of Head Tracking, Reverberation, and Individualized Head-Related Transfer Functions on the Spatial Perception of a Virtual Speech Source. J. Audio Eng. Soc. 2001, 49, 904–916. [Google Scholar] [PubMed]
- Brimijoin, W.O.; Boyd, A.W.; Akeroyd, M.A. The Contribution of Head Movement to the Externalization and Internalization of Sounds. PLoS ONE 2013, 8, e83068. [Google Scholar] [CrossRef] [PubMed] [Green Version]
- Romigh, G.D.; Brungart, D.S.; Simpson, B.D. Free-Field Localization Performance With a Head-Tracked Virtual Auditory Display. IEEE J. Sel. Top. Signal Process. 2015, 9, 943–954. [Google Scholar] [CrossRef]
- Sandvad, J. Dynamic aspects of auditory virtual environments. In Proceedings of the 100th AES Convention, Copenhagen, Denmark, 11–14 May 1996. [Google Scholar]
- Bronkhorst, A.W. Localization of real and virtual sound sources. J. Acoust. Soc. Am. 1995, 98, 2542–2553. [Google Scholar] [CrossRef]
- Rasumow, E.; Hansen, M.; van de Par, S.; Püschel, D.; Mellert, V.; Doclo, S.; Blau, M. Regularization Approaches for Synthesizing HRTF Directivity Patterns. IEEE/ACM Trans. Audio, Speech Lang. Process. 2016, 24, 215–225. [Google Scholar] [CrossRef]
- Rasumow, E.; Blau, M.; Doclo, S.; van de Par, S.; Hansen, M.; Püschel, D.; Mellert, V. Perceptual Evaluation of Individualized Binaural Reproduction Using a Virtual Artificial Head. J. Audio Eng. Soc. 2017, 65, 448–459. [Google Scholar] [CrossRef]
- Fallahi, M.; Hansen, M.; Doclo, S.; van de Par, S.; Mellert, V.; Püschel, D.; Blau, M. High spatial resolution binaural sound reproduction using a virtual artificial head. In Proceedings of the Fortschritte der Akustik-DAGA, Kiel, Germany, 6–9 March 2017; pp. 1061–1064. [Google Scholar]
- Blau, M.; Budnik, A.; Fallahi, M.; Steffens, H.; Ewert, S.D.; van de Par, S. Toward realistic binaural auralizations-perceptual comparison between measurement and simulation-based auralizations and the real room for a classroom scenario. Acta Acust. 2021, 5. [Google Scholar] [CrossRef]
- Fallahi, M.; Hansen, M.; Doclo, S.; van de Par, S.; Püschel, D.; Blau, M. Evaluation of head-tracked binaural auralizations of speech signals generated with a virtual artificial head in anechoic and classroom environments. Acta Acust. 2021, 5. [Google Scholar] [CrossRef]
- Golomb, S.W.; Taylor, H. Two-Dimensional Synchronization Patterns for Minimum Ambiguity. IEEE Trans. Inf. Theory 1982, 28, 600–604. [Google Scholar] [CrossRef]
- Rasumow, E.; Blau, M.; Hansen, M.; Doclo, S.; van de Par, S.; Mellert, V.; Püschel, D. Robustness of virtual artificial head topologies with respect to microphone positioning. In Proceedings of the Forum Acusticum, Aalborg, Denmark, 27 June–1 July 2011; pp. 2251–2256. [Google Scholar]
- Blauert, J. Spatial Hearing: The Psychophysics of Human Sound Localization, revised ed.; MIT Press: Cambridge, MA, USA, 1997; Chapter 2; pp. 36–200. [Google Scholar]
- Kirkeby, O.; Nelson, P.A. Digital Filter Design for Inversion Problems in Sound Reproduction. J. Audio Eng. Soc. 1999, 47, 583–595. [Google Scholar]
- Jaeger, H.; Bitzer, J.; Simmer, U.; Blau, M. Echtzeitfähiges binaurales Rendering mit Bewegungssensoren von 3-D Brillen. In Proceedings of the Fortschritte der Akustik-DAGA, Kiel, Germany, 6–9 March 2017. [Google Scholar]
- Hartmann, W.M.; Wittenberg, A. On the externalization of sound images. J. Acoust. Soc. Am. 1996, 99, 3678–3688. [Google Scholar] [CrossRef] [PubMed]
- Hendrickx, E.; Stitt, P.; Messonnier, C.; Lyzwa, J.M.; Katz, B.F.; de Boishéraud, C. Influence of head tracking on the externalization of speech stimuli for non-individualized binaural synthesis. J. Acoust. Soc. Am. 2017, 141, 2011–2023. [Google Scholar] [CrossRef] [PubMed] [Green Version]
- Siegel, S.; Castellan, N.J. Non Parametric Statistics for Behavioural Sciences, 2nd ed.; McGraw-Hill, Inc.: New York, NY, USA, 1988; Chapter 7; pp. 168–189. [Google Scholar]
- Macpherson, E.A. Cue weighting and vestibular mediation of temporal dynamics in sound localization via head rotation. Proc. Meet. Acoust. 2013, 19, 050131. [Google Scholar]
- Wallach, H. The role of head movements and vestibular and visual cues in sound localization. J. Exp. Psychol. 1940, 27, 339–368. [Google Scholar] [CrossRef] [Green Version]
- Ackermann, D.; Fiedler, F.; Brinkmann, F.; Schneider, M.; Weinzierl, S. On the Acoustic Qualities of Dynamic Pseudobinaural Recordings. J. Audio Eng. Soc. 2020, 68, 418–427. [Google Scholar] [CrossRef]
- Wightman, F.L.; Kistler, D.J. Resolution of front-back ambiguity in spatial hearing by listener and source movement. J. Acoust. Soc. Am. 1999, 105, 2841–2853. [Google Scholar] [CrossRef] [PubMed]
- Perrett, S.; Noble, W. The effect of head rotations on vertical plane sound localization. J. Acoust. Soc. Am. 1997, 102, 2325–2332. [Google Scholar] [CrossRef]
- Thurlow, W.R.; Runge, P.S. Effect of induced head movements on localization of direction of sound. J. Acoust. Soc. Am. 1967, 42, 480–488. [Google Scholar] [CrossRef] [PubMed]
- Begault, D.R.; Wenzel, E.M. Headphone localization of speech. Hum. Factors 1993, 35, 361–376. [Google Scholar] [CrossRef]
- Folds, D.J. The elevation illusion in virtual audio. In Proceedings of the Human Factors and Ergonomics Society 50th Annual Meeting, San Francisco, CA, USA, 16–20 October 2006; pp. 1576–1579. [Google Scholar]
- Middlebrooks, J.C. Virtual localization improved by scaling nonindividualized external-ear transfer function in frequency. J. Acoust. Soc. Am. 1999, 106, 1493–1510. [Google Scholar] [CrossRef] [PubMed]
- Asano, F.; Suzuki, Y.; Sone, T. Role of spectral cues in median plane localization. J. Acoust. Soc. Am. 1990, 88, 159–168. [Google Scholar] [CrossRef] [PubMed]
- Shaw, E.A.G.; Teranishi, R. Sound pressure generated in an external-ear replica and real human ears by a nearby point source. J. Acoust. Soc. Am. 1968, 44, 240–249. [Google Scholar] [CrossRef] [PubMed]


Publisher’s Note: MDPI stays neutral with regard to jurisdictional claims in published maps and institutional affiliations. |
© 2021 by the authors. Licensee MDPI, Basel, Switzerland. This article is an open access article distributed under the terms and conditions of the Creative Commons Attribution (CC BY) license (https://creativecommons.org/licenses/by/4.0/).