Abstract
To realize high-efficiency CO2 absorption by fresh cement paste, ultrasonic vibration technology is introduced into the CO2 absorption test device used in this study. Influences of ultrasonic frequency on the CO2 absorption rate (CO2 AR) and the ultimate absorption amount of fresh cement paste are analyzed. Furthermore, the influencing laws of the CO2 absorption amount (CO2 AA) on the fluidity, pore distribution, and mechanical properties of cement paste under ultrasonic vibrating agitation are analyzed by measuring the variations of the CO2 AA of cement paste. Results demonstrate that ultrasonic vibrating agitation not only can increase the CO2 AR and ultimate absorption amount of fresh cement paste, but also can optimize the internal pore structure of materials and compressive strength of cement-based materials.
1. Introduction
The greenhouse effect which is caused by excessive CO2 emissions has brought many hazards. Global warming has become a primary issue of the top 10 global environmental problems. Nowadays, many methods exist to decrease global CO2 emissions, such as changing the energy structure, chemical absorption, and blocked curing [1]. However, all of these methods have some technological defects. They all incur relatively high costs and cannot solve carbon emission problems within a short period of time. Portland cement is a traditional building material used most extensively around the world which has also attracted wide attention for reducing CO2 emissions [2]. Cement production comes at the cost of great consumption of limestone and fuels, the pyrolysis and combustion of which release CO2. According to the statistics, approximately 1 ton of CO2 emissions during the production of 1 ton of clinkers is produced [3]. From 2013 to 2016, the global cement output exceeded 4 billion tons, equating to about 16 million tons of global CO2 emissions [4,5]. Decreasing CO2 emissions in the Portland cement industry is therefore an important part of the global CO2 emission reduction project [6].
Some studies have pointed out that cement in concrete can produce a significant amount of Ca(OH)2 during the hydration process, accounting for about 20–30% of total hardened cement pastes, and largely exists in the pores of hardened cement pastes in their crystal form. In solution, Ca(OH)2 can extremely easily react with CO2 to produce CaCO3. As a result, concrete has considerable potential for CO2 absorption [7,8]. Compared with mineral carbonisation and ocean storage, increasing the operability and application prospects of CO2 absorption by concrete has recently become a hot research topic. However, realising high-efficiency CO2 absorption by concrete is still a huge challenge [9].
Studies on CO2 absorption of fresh cement pastes have been reported. It is found that the stirring rate, water-cement ratio and addition order of water reducing agents can significantly influence the CO2 AR and ultimate absorption amount of fresh cement paste significantly. More importantly, the CO2 AR and ultimate absorption amount of fresh cement paste can increase by appropriately setting these parameters [10]. Nevertheless, the stirring time of concrete is very short in practice, which is generally in the range of 30–90 s. Furthermore, reasonable settings of the stirring rate, water-cement ratio and addition order of water reducing agents alone cannot meet the fast CO2 absorption rate required in practical concrete production [11,12]. Hence, the CO2 absorption efficiency and ultimate absorption amount of fresh concrete still have room for development. Increasing the CO2 absorption efficiency of fresh concrete more effectively is thus the key focus of this study.
In this study, an ultrasonic vibration device is introduced into the original CO2 absorption device [13,14]. The CO2 AR and absorption amount of fresh cement paste under ultrasonic vibrating agitation as well as the influences of ultrasonic vibration on the fluidity and porosity of CO2 absorption are discussed through the unique ultrasonic performances. The collaborative action mechanism of fresh cement paste under ultrasonic vibrating agitation and CO2 absorption was analysed through SEM observation. The variation laws of the internal microstructure after CO2 absorption of fresh cement paste for different amounts are observed [15,16,17]. On this basis, the variation mechanism of basic performances of cement-based materials as a response to ultrasonic vibration is disclosed and the influences of cement flocculates on the crystal size of solution under ultrasonic waves were are analysed thoroughly [18,19,20].
2. Materials and Methods
2.1. Raw Materials
The P·O 42.5 cement, which is produced by the Xuzhou Zhonglian Cement Group, was chosen for this study. The mean grain size, density, standard-consistency water need, fineness (0.08 mm square hole sieve), and specific surface area were 14.813% Xav (μm), 3.14 g/cm3, 28.1%, 1.02%, and 3300 cm2/g, respectively. The specific chemical composition and mineral composition are listed in Table 1 and Table 2. In this experiment, CO2 is the high-purity CO2 which is produced by a special gas plant in Xuzhou, the purity of which is ≥99.5%. The sand used in this experiment was the ISO cement test standard sand and the water used was tap water.

Table 1.
Chemical composition of cement.

Table 2.
Mineral composition of clinkers.
2.2. Reconstruction of the CO2 Absorption Device
Two CO2 absorption devices were manufactured to discuss the influences of ultrasonic agitation on the CO2 AR and the ultimate absorption amount of fresh cement paste. One is a mechanical agitation device (Figure 1a) and the other is an ultrasonic vibrating agitation tank. The manufacturing process is introduced as follows. Firstly, the ultrasonic vibrating agitation tester with different ultrasonic vibrational frequencies is manufactured by connecting the ultrasonic vibrator into the original CO2 absorption device. Next, a transducer, ultrasonic power supply, and qualified amplitude transformer are designed and selected according to the requirements of the vibration system on amplitude and vibration frequency. Finally, the ultrasonic power supply, transducer, amplitude transformer, and agitation tank are connected (Figure 1b).
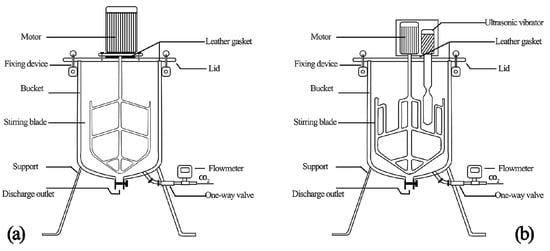
Figure 1.
Stirring device: (a) Mechanical agitation device, (b) ultrasonic vibrating agitation device. Reprinted with permission from ref. [21]. Copyright 2021 Elsevier.
2.3. Fresh Cement Paste Preparation for CO2 Absorption
Cement paste with a water-cement ratio of 0.5 was prepared. The stirring rate was set 210 ± 5 r/min. After the paste was stirred evenly, the ultrasonic vibrator and CO2 flow valve were opened and CO2 was supplied while stirring. The CO2 AR and absorption amount of cement paste were measured by a CO2 flowmeter. In this way, cement paste that meets the required CO2 AA was prepared.
2.4. Determination of the Optimum Ultrasonic Frequency
Ultrasonic waves are acoustic waves with frequencies higher than 20 kHz, usually ranging between 20–100 kHz. The cavitation effect of an ultrasonic wave is related to its frequency. The ultrasonic frequency is negatively related to the cavitation effect of an ultrasonic wave. To reach a better ultrasonic cavitation effect, this research group developed three ultrasonic agitation devices with low ultrasonic frequencies of 20, 28, and 40 kHz [22,23,24].
The specimens were divided into four groups: A1, A2, A3, and A4. Groups A1, A2, and A3 were moulded using ultrasonic vibrating agitation. The ultrasonic frequencies of these three groups were 20, 28, and 40 kHz, respectively. Group A4 was used as a control group and moulded by mechanical agitation. The CO2 AR and CO2 AA were measured every 5 s to study the influences of ultrasonic frequency on real-time changes of the CO2 AR and CO2 AA. On this basis, the optimal ultrasonic frequency could be determined.
2.5. Experimental Procedure
2.5.1. Specimen Grouping
The test was divided into Groups B and C. Group B used ultrasonic vibrating agitation and Group C was moulded by mechanical agitation as a control group. The corresponding CO2 AA were 0%, 0.44%, 0.88%, 1.32%, 1.76%, and 2.20%, respectively. Cement pastes in Group B were numbered as B1, B2, B3, B4, B5, and B6. Cement pastes in Group C were C1, C2, C3, C4, C5, and C6. The fluidity, mechanical properties, pore structures, and microstructures of cement pastes in Groups B and C were tested to study the influences of ultrasonic vibrating agitation on the CO2 absorption of cement pastes.
2.5.2. Fluidity of Cement Paste after CO2 Absorption
The fluidity of Groups B and C was tested according to the Cement and Water Reducing Agent Compatibility Test Method (JC/T1083-2008) [25]. First, we poured the cement paste after CO2 absorption into the truncated cone and scraped flat. Then, we lifted the truncated cone in the vertical direction and let the paste flow. Thirty seconds later, the maximum diameters of the paste were measured in two directions perpendicular to each other. Finally, the fluidity of the cement paste is the average of the two maximum diameters.
2.5.3. Pore structure of Hardened Cement Paste after CO2 Absorption
The 40 × 40 × 160 mm standard cement mortar specimens were prepared using fresh cement pastes of Groups B and C according to Method of Testing Cements-Determination of Strength (GB/T17671-1999) [26,27,28]. All specimen moulds were removed after curing for 24 h, followed by standard curing to the regulated age under 20 ± 2 °C and humidity > 95%. At this moment, the compressive strength at 3, 7, and 29 d were determined by a LS80-65–160 hydraulic compression tester to discuss the influences of ultrasonic vibration on the mechanical properties of fresh cement paste after CO2 absorption [29,30,31].
2.5.4. Mechanical Properties of Hardened Cement Paste after CO2 Absorption
Cement pastes of Groups B and C were filled with cubic test moulds in a size of 40 × 40 × 40 mm. The cement paste was made compact by vibration. Then, 24 h later, the mould was removed and specimens were cured under standard conditions of 20 ± 2 °C and humidity > 95% to the regulated age, followed by 24 h of drying in an oven at a temperature of 120 °C. Specimens were crushed into blocks or cylinders. Pore structural distribution and porosity after 28 d were determined by mercury intrusion porosimeter, a PoreMaster33 with a testing range of 3.5 nm to 400 μm. The effects of ultrasonic vibration on the porosity of cement paste after CO2 absorption are discussed [32,33,34].
2.5.5. Characterization of the Hydration Products in Cement Paste after CO2 Absorption
The fresh cement paste of Groups B and C was put into cubic test moulds of 40 × 40 × 40 mm dimension. The cement paste was then compacted by vibration and cured under standard conditions for 12 h to prepare the cement paste samples. At this time, the strength of the cement paste sample is first established, which is conducive to sample preparation. Furthermore, the hydration reaction in the cement is in its initial stages and the internal structure is relatively loose, which makes it an ideal time to observe the products produced by the reaction of cement hydration products with CO2.
The cement paste samples were made into 1-mm-thick pieces, which were then immersed in absolute ethanol for 48 h to prevent the hydration of the cement. The pieces were dried in a constant temperature blast oven at 65 °C for 24 h and then placed in an ion sputtering apparatus for surface gold spraying. Then, scanning electron microscopy (SEM) and energy spectrum analysis were performed with a scanning electron microscope Quanta 250.
3. Results
3.1. Effects of Ultrasonic Frequency on the CO2 Ultimate Absorption Amount and AR
3.1.1. Effects of Ultrasonic Frequency on the CO2 Ultimate Absorption Amount
The effects of ultrasonic vibration on the CO2 ultimate absorption amount are shown in Figure 2. It can be seen that under mechanical agitation, the CO2 AA in the cement paste increased gradually. When the CO2 absorption reached 5, 10, 15, and 20 s, the CO2 AA were 0.77%, 1.35%, 1.87%, 2.15%, and 2.47% of the cement mass, respectively. After an absorption time of 35 s, the cement paste could not further absorb CO2 due to thickening and lost fluidity. At this point, the CO2 AA of the cement paste reached 2.64% of the ultimate absorption amount.
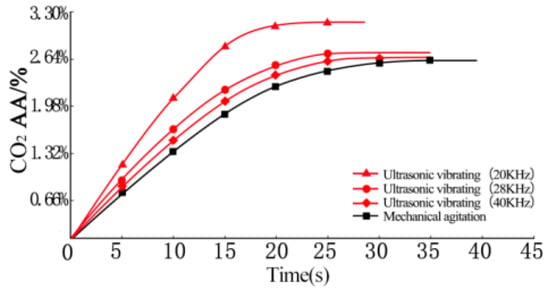
Figure 2.
Effects of ultrasonic vibration on the CO2 ultimate absorption amount.
Compared with mechanical agitation, the CO2 AR of fresh cement paste is significantly increased under ultrasonic vibrating agitation. At 5, 10, 15, 20, and 25 s, the CO2 AA of fresh cement pastes under the fixed ultrasonic frequency of 40 kHz were 0.85%, 1.41%, 2.07%, 2.42%, and 2.61% of cement mass, respectively. These are 10.4%, 4.4%, 10.7%, 12.6%, and 5.7% higher than those under mechanical agitation at the same absorption times. The CO2 AA reached a maximum at 30 s, approximately 2.66% of the ultimate absorption amount. Compared with mechanical agitation, the CO2 ultimate absorption amount of fresh cement pastes under ultrasonic vibrating agitation is significantly increased with the shortening of absorption time.
With the reduction of ultrasonic frequency, the CO2 ultimate absorption amount of cement paste is increased to some extent. At 5, 10, 15, and 20 s, the CO2 AA of fresh cement pastes at the fixed ultrasonic frequency of 28 kHz were 0.94%, 1.65%, 2.2%, and 2.53% of the cement mass. These increased to 1.19%, 2.09%, 2.84%, and 3.12% by decreasing the ultrasonic frequency to 20 kHz. At an ultrasonic frequency of 28 kHz, the CO2 AA of fresh cement pastes reached 2.73% of the ultimate absorption amount at 25 s. At an ultrasonic frequency of 20 kHz, the CO2 AA of fresh cement pastes reached 3.17% of the ultimate absorption amount at 25 s.
3.1.2. Effects of Ultrasonic Vibration on CO2 AR
The effects of ultrasonic vibration on CO2 AR are shown in Figure 3. It can be seen that under mechanical agitation, the CO2 AR was 0.063, 0.061, 0.058, 0.053, 0.046, and 0.035 ν(%/s) at the absorption times of 5, 10, 15, 20, 25, and 30 s, respectively. By increasing the absorption time, the cement paste gradually thickens causing the CO2 AR to decrease accordingly. The cement paste changed from a fluid to pasty fluid gradually after 30 s. At 35 s, the CO2 absorption of the paste reached saturation and the pastes could not absorb CO2 any further.
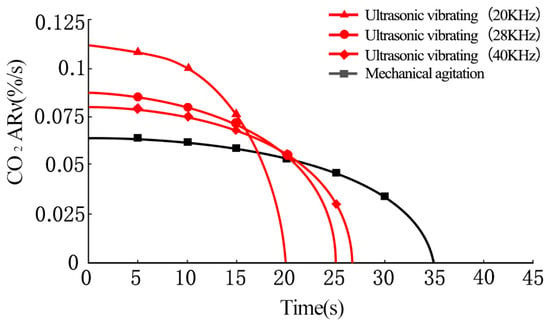
Figure 3.
Effects of ultrasonic vibration on CO2 AR.
The CO2 AR of fresh cement paste increased significantly under ultrasonic vibrating agitation compared to that under mechanical agitation. At an ultrasonic frequency of 40 kHz, the CO2 AR of the cement paste was 0.08, 0.075, 0.067, and 0.055 ν(%/s) at the absorption times of 5, 10, 15, and 20 s, respectively, which are 27%, 23%, 15.5%, and 3.8% higher compared to those under mechanical agitation. After 20 s, the cement paste changes from fluid to pasty fluid and the CO2 absorption of paste reaches saturation at 27 s.
At an ultrasonic frequency of 28 KHz, the CO2 AR of cement paste is 0.085, 0.08, 0.072, and 0.054 ν(%/s) at the absorption times of 5, 10, 15, and 20 s, respectively. The CO2 AR of cement paste increases to some extent with the decrease of ultrasonic frequency. At an ultrasonic frequency of 20 kHz, the CO2 AR of cement paste is 0.108, 0.1, and 0.077 ν(%/s) at 5, 10, and 15 s respectively. The CO2 AR of cement paste increases significantly.
According to the results, it can be concluded that the CO2 absorption time of cement paste gradually shortens, while the CO2 AR and CO2 AA further increase when the ultrasonic frequency gradually decreases from 40 kHz to 28 and 20 kHz. This is due to the fact that when the ultrasonic frequency increases, the ultrasonic intensity will increase accordingly. When the increased ultrasonic intensity is excessive, there are excessive bubbles produced, which conversely increase attenuation of scattering, forming barriers of the ultrasonic wave. On the other hand, increasing of ultrasonic intensity will also lead to increasing of nonlinear attenuation, which is disadvantageous for uniform agitation. Consequently, particles of the cement paste are not well distributed. Therefore, when the ultrasonic frequency is 20 kHz, the cavitation effect of ultrasonic agitation is best, and the corresponding CO2 AR and CO2 AA is highest.
3.2. Effects of Ultrasonic Vibration on the Fluidity of Cement Paste after CO2 Absorption
3.2.1. Divergence of Cement Paste after CO2 Absorption
The changes of divergence of cement paste with CO2 AA are shown in Figure 4. From Figure 4a, it can be seen that under mechanical agitation, the divergence values of cement paste are 159, 140, 131, 122, 106, and 98 mm when the CO2 AA are 0%, 0.44%, 0.88%, 1.32%, 1.76%, and 2.20%, respectively. Figure 4b shows that the cement paste surface looks finer and more watery after ultrasonic vibrating agitation. Under ultrasonic vibrating agitation, divergence values of the cement paste are 174, 154, 143, 133, 115, and 105 mm, respectively. These are 9.4%, 10% 9.2%, 8.5%, and 7.1% higher than those under mechanical agitation. Ultrasonic vibration can increase the divergence of cement paste effectively. The divergence of cement paste decreases gradually with the increase of CO2 AA and the paste loses fluidity slowly to gradually become a pasty fluid.
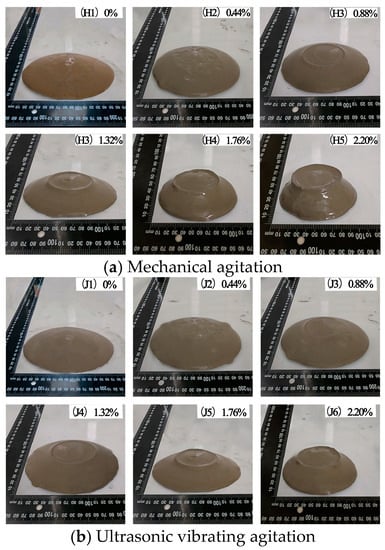
Figure 4.
Changes of divergence of cement paste with CO2 AA.
3.2.2. Effects of Ultrasonic Vibration on the Fluidity of Cement Paste after CO2 Absorption
The effects of ultrasonic vibration on the divergence of cement paste after CO2 absorption were drawn according to test results of divergence (Figure 5). Clearly, under the same CO2 AA, the divergence of fresh cement paste under the ultrasonic vibrating agitation is higher than that under mechanical agitation. Moreover, the divergence of cement paste values were 174, 154, 143, 133, 115, and 105 mm when the CO2 AA were 0%, 0.44%, 0.88%, 1.32%, 1.76%, and 2.20%, respectively, which decreased by 13.0%, 7.7%, 7.5%, 15.7%, and 9.5%, respectively.
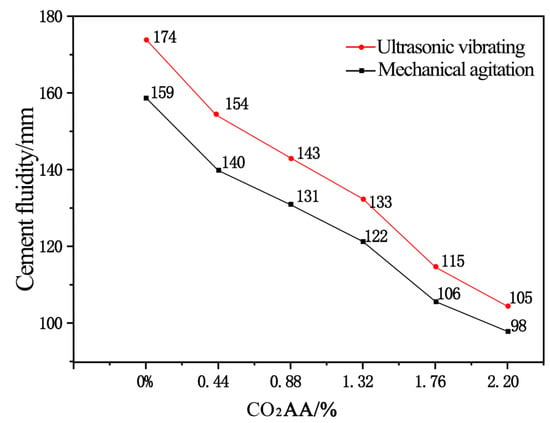
Figure 5.
Effects of CO2 AA on the fluidity of cement paste.
The above results indicate that the ultrasonically agitated fluidity of cement paste is increased compared with that mechanically agitated. Cement particles in unit volume of cement paste is significantly increased when ultrasonic agitation is adopted, which means that ultrasonic agitation is better to break the flocculation structures formed by cement particles compared with mechanical agitation. The break of flocculation structures means that there is more free water in the paste to ensure fluidity of cement paste. However, both fluidities of cement paste agitated ultrasonically and mechanically decreases with an increase in CO2 AA and the decrement is significant. This is due to the fact that the structure of the cement paste gradually changes when CO2 AA gradually increases, which is disadvantageous for fluidity of cement paste.
3.3. Effects of Ultrasonic Vibration on Pore Distribution and Porosity of Hardened Cement Paste after CO2 Absorption
3.3.1. The Most Available Geometric Diameter of Pore Distribution
The differential curve of the pore diameter of hardened cement paste under CO2 AA was tested by the mercury intrusion method (Figure 6). For CO2 AA of 0%, 0.44%, 0.88%, 1.32%, 1.76%, and 2.20%, the most available geometric diameters in the pore distribution differential curve of hardened cement paste are 112.5, 118.5, 92.5, 83.1, 80.7, and 72.7 nm under mechanical agitation. Under ultrasonic vibrating agitation, the most available geometric diameters in the pore distribution differential curve of hardened cement paste are 78.7, 83.3, 70.5, 60.6, 49.4, and 48.2 nm, respectively, which are decreased by 30%, 29.7%, 23.8%, 27.1%, 38.8%, and 33.7% compared to those under mechanical agitation.
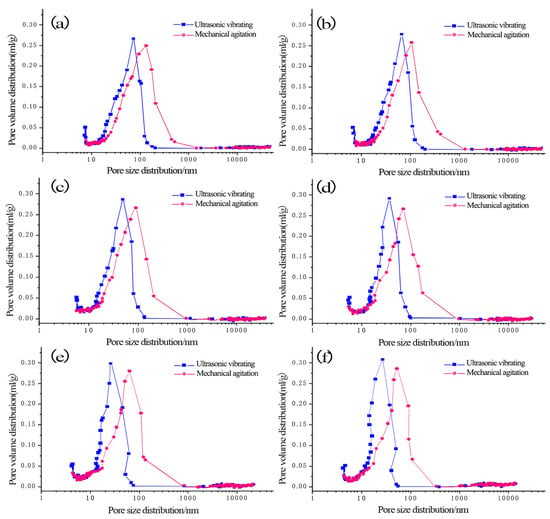
Figure 6.
Differential curve of pore distributions of hardened cement paste under different CO2 AA: (a) 0%; (b) 0.44%; (c) 0.88%; (d) 1.32%; (e) 1.76%; (f) 2.20%.
It can be obtained according to Figure 6 that the most available geometric diameter of pore distribution of the hardened carbonized cement paste with ultrasonic agitation is lower than that with mechanical agitation. When the CO2 AA is respectively 0.44%, 0.88%, 1.32%, 1.76%, and 2.20%, the most available geometric diameter of pore distribution of the hardened carbonized cement paste with ultrasonic agitation gradually decreases by 15.4%, 14%, 18.5%, and 2.4% compared to that with mechanical agitation, which indicates that the most available geometric diameter of pore distribution of the hardened carbonized cement paste with ultrasonic agitation gradually decreases with an increase in CO2 AA. Therefore, the most available geometric diameter of pore distribution of the hardened carbonized cement paste can effectively be reduced with ultrasonic agitation.
3.3.2. The Most Available Geometric Diameter of Pore Distribution
Wu Zhongwei divided the concrete pore into four types according to influences of pore size on the durability of concretes: Harmless pores (<20 nm), slightly harmful pores (20~100 nm), harmful pores (100~200 nm), and multi-harmful pores (>200 nm). Influences of ultrasonic vibration on pore distribution in the hardened cement paste after CO2 absorption are shown in Figure 7. Clearly, the percentages of harmless pores are 4%, 5%, 6%, 8%, 9%, and 9% under mechanical agitation when the CO2 AA increases from 0% to 2.20% at a rate of 0.44%. Meanwhile, the percentages of slightly harmful pores are 58%, 60%, 61%, 63%, 65%, and 67%, respectively. The percentages of harmful pores are 34%, 31%, 29%, 26%, 23%, and 21%, respectively. The percentages of multi-harmful pores are 4%, 4%, 4%, 3%, 3%, and 3%. Under ultrasonic vibrating agitation, the percentages of harmless pores are 6%, 6%, 8%, 9%, 10%, and 10% when the CO2 AA increases from 0% to 2.20% at a rate of 0.44%. Meanwhile, the percentages of slightly harmful pores are 70%, 72%, 74%, 77%, 77%, and 78%, respectively. The percentages of harmful pores are 21%, 19%, 15%, 12%, 11%, and 10%, respectively. The percentages of multi-harmful pores are 3%, 3%, 3%, 2%, 2%, and 2%, respectively.
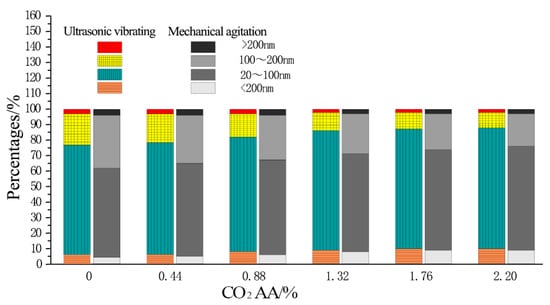
Figure 7.
Pore distributions in hardened cement paste under different CO2 AA.
According to the test results, slightly harmful pores and harmful pores change mostly in the pore distribution in hardened cement paste after CO2 absorption under ultrasonic vibrating agitation. Specifically, the proportion of slightly harmful pores increases significantly, while the proportion of harmful pores decreases dramatically. When the CO2 AA are 0%, 0.44%, 0.88%, 1.32%, 1.76%, and 2.20%, the percentages of slightly harmful pores are increased by 20.7%, 20%, 21.3%, 22.2%, 18.8%, and 16.4%, respectively, and the percentages of harmful pores are decreased by 38.2%, 38.7%, 48.3%, 53.8%, 52.2%, and 52.4%, respectively.
It can be obtained from Figure 7, with an increase in CO2 AA, that harmless pores and slightly harmful pores of the hardened carbonized cement paste will increase, while harmful pores and multi-harmful pores will decrease. However, the increment of harmless pores and slightly harmful pores and the decrement of harmful pores and multi-harmful pores are more significant when ultrasonic agitation is adopted.
3.3.3. Porosity
The total porosity of hardened cement pastes after different CO2 AA under ultrasonic vibrating agitation is shown in Figure 8. Clearly, the porosities of the hardened cement paste under mechanical agitation are 17.5%, 17.1%, 16%, 15.1%, 14.3%, and 13.8% when the CO2 AA are 0%, 0.44%, 0.88%, 1.32%, 1.76%, and 2.20%, respectively. Under ultrasonic vibrating agitation, the porosities of the hardened cement paste are 15.6%, 15.1%, 14.6%, 13.4%, 12.1%, and 11.5%, which are 10.9%, 11.7%, 8.8%, 1.3%, 15.4%, and 16.7% lower compared to those under mechanical agitation, respectively. Moreover, the porosities of hardened cement paste decrease by 3.2%, 3.3%, 8.2%, 9.7%, and 5% when the CO2 AA increases at the rate of 0%, 0.44%, 0.88%, 1.32%, 1.76%, and 2.20% continuously under ultrasonic vibrating agitation.
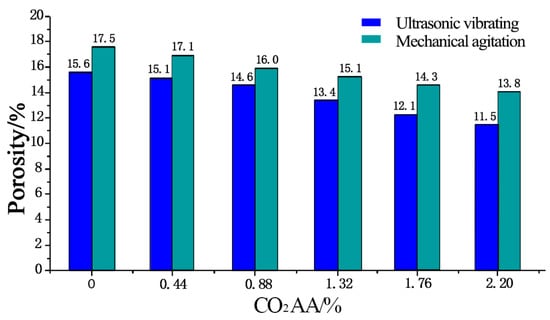
Figure 8.
Porosity of hardened cement paste after CO2 absorption.
According to the above analyses, conclusions can be drawn that the porosity of the hardened carbonized cement paste whether mechanically agitated or ultrasonically agitated decreases when CO2 AA increases. However, the porosity decrement is more obvious when ultrasonic agitation is applied. Reasons for the significant porosity decrement when ultrasonic agitation is applied lies in two aspects. On the one hand, cement particles can be minimized by ultrasonic waves, which is advantageous for the hydration degree of cement particles. On the other hand, the flocculation structures formed by cement particles can be broken by ultrasonic agitation, which is advantageous for cement particles to get accesses to water to improve the hydration degree. The improved hydration degree of cement particles indicates that more hydration products of C-S-H and CH are formed, which improves the density of the hardened cement paste, thus reducing porosity of the hardened cement paste.
3.3.4. Mean Pore Size
The mean pore sizes of hardened cement paste after different CO2 AA under ultrasonic vibrating agitation are shown in Figure 9. It can be seen that under mechanical agitation, the mean pore sizes of hardened cement paste are 88, 79, 75, 68, 65, and 60 nm when CO2 AA are 0%, 0.44%, 0.88%, 1.32%, 1.76%, and 2.20%, respectively. Meanwhile, the mean pore sizes of hardened cement paste are 80, 73, 65, 56, 50, and 45 nm under ultrasonic vibrating agitation, which are decreased by 9.1%, 7.6%, 13.3%, 17.6%, 23.1%, and 25% compared to those under mechanical agitation. Furthermore, the mean pore sizes of hardened cement paste under ultrasonic vibrating agitation decrease by 8.8%, 23.3%, 13.8%, 10.7%, and 10% when the CO2 AA increases at the rate of 0%, 0.44%, 0.88%, 1.32%, 1.76%, and 2.20%, continuously.
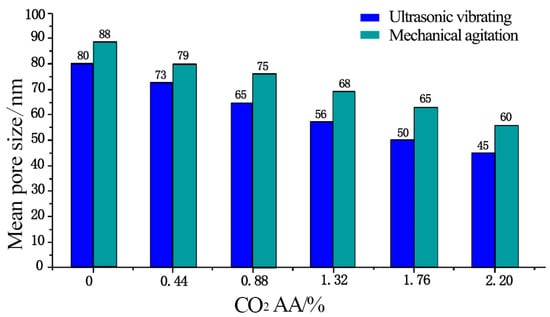
Figure 9.
Mean pore size.
According to the above analyses, it can be obtained that both mechanical and ultrasonic agitation is helpful to minimize the mean pore size and that the mean pore size gradually decreases with an increase in CO2 AA. However, the decrement in mean pore size when ultrasonic agitation is applied is more obvious. This is due to the fact that the products of CaCO3 crystals are helpful to minimize pore sizes and optimize pore size distribution of the hardened carbonized cement paste.
3.4. Effects of Ultrasonic Vibration on the Mechanical Properties of Cement-Based Materials after CO2 Absorption
3.4.1. Compressive Strength
The effects of ultrasonic vibration on the compressive strength of cement-based materials after CO2 absorption are shown in Figure 10. At the age of 3 d, the CO2 AA are 0%, 0.44%, 0.88%, 1.32%, 1.76%, and 2.20% with a corresponding compressive strength of the hardened cement paste of 5.9, 5.4, 5.7, 5.2, 5.6, and 5.3 MPa under mechanical agitation. According to the data, the compressive strength may increase and decrease with the increase of CO2 AA, but the fluctuation amplitude is not very large. At the age of 7 and 28 d, the compressive strength of hardened cement paste is increased to some extent. At 7 d, the compressive strengths are 6.9, 6.7, 6, 6.1, 6.5, and 6.5 MPa, respectively. The variation law of the compressive strength firstly decreases slowly but decreases significantly when the CO2 AA is 0.88%. Subsequently, it increases with the increase of CO2 AA.

Figure 10.
Effects of ultrasonic vibration on the compressive strength of cement-based materials after CO2 absorption: (a) 3 d; (b) 7 d; (c) 28 d.
At the age of 28 d, the compressive strengths of the hardened cement paste are 7.4, 7.4, 7.6, 7.6, 7.2, and 7.1 MPa, respectively. In view of the data, the compressive strength changes stably and even presents a slowly increasing trend in the early stages of CO2 absorption as the absorption amount increases. However, the compressive strength decreases to a small extent with the increase of absorption amount, though the variation amplitude is not evident. At different ages, the compressive strength of fresh cement paste does not increase significantly with an increase of CO2 AA. It does change to some extent in the middle, however, it does not change greatly with CO2 AA.
When the CO2 AA are 0%, 0.44%, 0.88%, 1.32%, 1.76%, and 2.20%, under ultrasonic vibrating agitation, the compressive strengths of the hardened cement paste at 3 d are 6, 5.5, 5.9, 5.3, 5.8, and 5.4 MPa, respectively. In view of the data, the variation law of compressive strength is very close to that under mechanical agitation. At 7 d, the compressive strengths of hardened cement paste are 6.9, 6.7, 6, 6.1, 6.5, and 6.5 MPa, respectively, which then increases to 7.4, 7.6, 7.5, 7.9, 7.5, and 7.4 MPa at 28 d, respectively. Meanwhile, the compressive strength at 7 and 28 d under ultrasonic vibrating agitation approaches the results under mechanical agitation as the CO2 AA increases.
The variation laws of compressive strength under mechanical agitation and ultrasonic vibrating agitation are essentially identical. The compressive strength of hardened cement paste under ultrasonic vibrating agitation is increased to some extent compared with those after equal CO2 AA at the same age under mechanical agitation. With the increase of CO2 AA, the compressive strength changes slightly, indicating that ultrasonic vibration influences the compressive strength of cement paste after CO2 absorption slightly.
3.4.2. Compressive Strength
The effects of ultrasonic vibration on the comprehensive strength of cement-based materials after CO2 absorption are shown in Figure 11. It can be seen that when the CO2 AA are 0%, 0.44%, 0.88%, 1.32%, 1.76%, and 2.20%, under mechanical agitation, the compressive strength of hardened cement paste at 3 d are 24.9, 24.4, 24.9, 24, 25, and 24.9 MPa, respectively. In view of the data, the compressive strength of cement paste after CO2 absorption within the curing stage changes slightly. Even though it fluctuates to some extent, the fluctuation range is very small. At 7 d, the compressive strengths of hardened cement paste are 32.6, 33.4, 32.1, 32.8, 33.8, and 33.8 MPa, respectively. At 28 d, the compressive strengths of hardened cement paste are 45, 44.1, 45.8, 47, 46.5, and 46.7 MPa, respectively. In a word, the compressive strength of hardened cement paste after CO2 absorption does not change with the increase of CO2 AA as the curing age increases.

Figure 11.
Effects of ultrasonic vibration on comprehensive strength of cement-based materials after CO2 absorption: (a) 3 d; (b) 7 d; (c) 28 d.
When the CO2 AA are 0%, 0.44%, 0.88%, 1.32%, 1.76%, and 2.20%, under ultrasonic vibrating agitation, the compressive strengths of hardened cement paste at 3 d are 25.5, 26.4, 26.6, 26.8, 27, and 27.1 MPa, respectively. The compressive strength under ultrasonic vibrating agitation is increased to some extent compared to that of mechanical agitation. Moreover, the compressive strength is positively related to the CO2 AA. At 7 d, the compressive strengths of hardened cement paste are 33, 34, 34.5, 34.8, 35.5, and 36.5 MPa. At 28 d, the compressive strengths of hardened cement paste are 45.4, 47, 47, 49.5, 51, and 51.7 MPa.
According to the above experimental results, it can be obtained that the increment in compressive strength of the hardened carbonized cement paste is more significant when ultrasonic agitation is applied compared with that when mechanical agitation is applied. Under ultrasonic agitation, cement particles are broken to smaller ones and flocculation structures formed by cement particles are broken by ultrasonic waves, which can promote cement hydration to produce more C-S-H. Therefore, the compressive strength is significantly increased by applying ultrasonic.
4. Microstructural Analysis of Cement Paste after CO2 Absorption under Ultrasonic Vibration
4.1. Mechanical Agitation Molding
SEM images of the mechanical agitation moulded specimens of cement paste after 10,000 amplifications are shown in Figure 12. Obviously, the microstructure of cement paste without CO2 absorption in the early hardening stage shows relatively sparse cement particle distribution and gelatinization structures in the paste compared with the microstructure when CO2 AA is 0.44%. Moreover, a significant number of pores in the paste and hydration products are scattered around, revealing poor structural integrity (Figure 12a). In contrast, cement paste with a CO2 AA of 0.44% shows few CaCO3 crystals under SEM. After amplification, there are few CaCO3 needle-like crystal whiskers in the microstructure which penetrate in gel substances (Figure 12b) [35]. However, no crystal whiskers are found in cement paste that has not absorbed CO2.
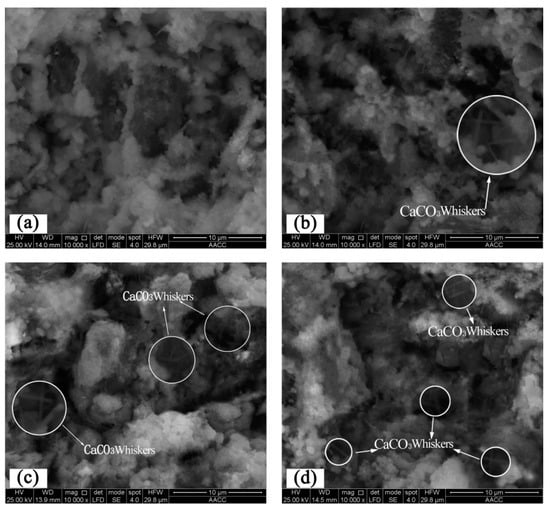
Figure 12.
Microstructures of mechanical agitation moulded cement paste in the early hardening stage: (a) 0%; (b) 0.44%; (c) 0.88%; (d) 1.32%.
When the CO2 AA is increased to 0.88%, hydration products are distributed more extensively in the paste. The CaCO3 crystals of hydration products and CaCO3 needle-like crystal whiskers are increased, while the number of pores is decreased (Figure 13c). When the CO2 AA increases to 1.32%, the internal structure becomes more compact in the early stage of CO2 absorption of the paste. Additionally, CaCO3 needle-like crystal whiskers of hydration products are increased, which interweave both vertically and horizontally (Figure 12d).
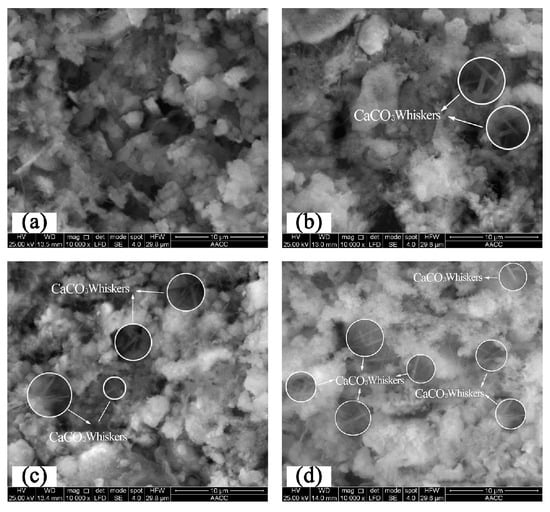
Figure 13.
Microstructures of ultrasonic agitation moulded specimens of cement paste in the early hardening stage: (a) 0%; (b) 0.44%; (c) 0.88%; (d) 1.32%.
4.2. Ultrasonic Vibrating Agitation Moulding
SEM images of ultrasonic vibrating agitation moulded specimens of cement paste after 10,000 amplifications are shown in Figure 13. It can be seen that under ultrasonic vibrating agitation, the microstructure of cement pastes without CO2 absorption in the early hardening stage shows relatively uniform distributions of cement particles and gel structures compared with the microstructure when the CO2 AA is 0.44%. Moreover, there are no big pores, and the pores are in a relatively uniform distribution accompanied by a reduction of distances among flocculating constituents (Figure 13a). In contrast, the cement paste with a CO2 AA of 0.44% shows some CaCO3 crystals and the existence of some CaCO3 needle-like crystal whiskers penetrating in the gel substances, which are similar to those of mechanical agitation moulded specimens (Figure 13b).
When the CO2 AA is 0.88%, CO2 and Ca2+ react continuously as CO2 is supplied continuously, accelerating the hydration process of cement and producing hydration products continuously. As a result, pores in the paste are filled continuously, effectively decreasing the quantity and diameter of pores at the same time as increasing the volume of flocculating constituents and quantity of CaCO3 needle-like crystal whiskers (Figure 13c). When the CO2 AA is 1.32%, the flocculating constituents increase in uniform distribution and the number of pores is decreased significantly in view of the microstructure. Furthermore, the CaCO3 whiskers continue to increase and interact to form cubic network structures (Figure 13d). Compared with mechanical agitation, the distributions of cement particles and hydration products under ultrasonic vibration are more uniform, and the number of pores decreases, whilst the production of CaCO3 needle-like crystal whiskers increases. Hence, cement becomes more compact in the early hardening stage [36].
4.3. Energy Dispersive Spectrum (EDS) Analysis
In order to better understand the content changes of the elements of the paste after CO2 absorption by adopting ultrasonic vibration technology, EDS analysis was conducted with the needle-like production in cement paste without CO2 absorption, respectively and the cement paste with 1.32% CO2 absorption by mechanical agitation, as well as that with 1.32% CO2 absorption by ultrasonic agitation, as illustrated in Figure 14a–c. The contents of each element are shown in Table 3.
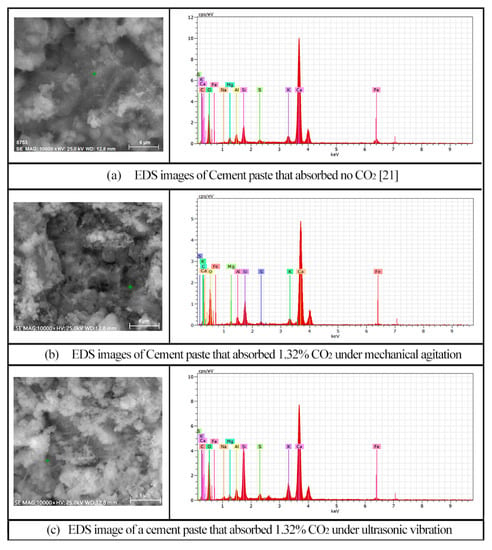
Figure 14.
EDS analysis.

Table 3.
EDS analysis results.
According to Table 3, the main elements of the measure points in Figure 14a–c are C, O, and Ca, respectively. Meanwhile, there are also some Si and Al elements. It can be obtained from Table 3 that the contents of C, Ca, and Si elements are increased, while that of Al element is obviously reduced when CO2 is absorbed by the cement paste under mechanical agitation. However, under ultrasonic agitation, the contents of C and Ca elements are increased more obviously and that of Al element continues to decrease.
According to the above results, it can be concluded that with the absorption of CO2, the content of C element of the cement paste is increased and there are CaCO3 crystals in the cement paste. Moreover, due to the “cavitation effect” of ultrasonic agitation, CO2 is effectively dispersed in cement paste, leading to more CaCO3 crystals being produced by adopting ultrasonic agitation. Therefore, cement paste is able to absorb more CO2, thus forming more CaCO3, when ultrasonic agitation is applied compared with that when mechanical agitation is applied.
5. Mechanism Analysis
5.1. Hydration Mechanism of Cement Paste under Mechanical Agitation
5.1.1. Cement Paste without CO2 Absorption
The hydration process of cement paste without CO2 absorption is shown in Figure 15. Clearly, a gel film that is composed of calcium silicate hydrate (C-S-H) gel and calcium hydroxide (CH) crystals is formed on the surface of cement particles in the early hydration stage. With the continuous increase of hydration time, the gel film thickens day by day due to the increasing gels. Meanwhile, the cement begins to harden slowly until finishing the hydration of the cement.

Figure 15.
Hydration mechanism of fresh cement paste under mechanical agitation: (a) Initial state of fresh cement paste; (b) early hydration stage of cement paste; (c) late hydration stage of cement paste. (Note:  cement particles;
  hydration products of flocculating gel).
 cement particles;
  hydration products of flocculating gel).
5.1.2. Cement Paste after CO2 Absorption under Mechanical Agitation
The hydration process of cement paste after CO2 absorption under mechanical agitation is shown in Figure 16. It can be seen that under mechanical agitation, CO2 gases scatter uniformly in the cement paste and firstly dissolve into H2CO3. H2CO3 reacts with Ca(OH)2 which is precipitated from the initial hydration of cement to produce flocculent CaCO3 crystals which adhere to the surface of cement particles (Figure 16a). With the increase of CO2 AA, the CaCO3 gel layer on the cement particle surface thickens and the cement paste viscosifies gradually, decreasing the fluidity accordingly [37].

Figure 16.
Hydration mechanism of fresh cement paste after CO2 supply under mechanical agitation: (a) Carbonization reaction stage of cement paste after CO2 supply; (b) early hydration stage of cement paste after CO2 supply; (c) late hydration stage of cement paste after CO2 supply. (Note:  Cement particle;
  the supplied CO2 gases;
  flocculent gel hydration products;
  CaCO3 crystals;
  CaCO3 needle-like crystal whiskers).
 Cement particle;
  the supplied CO2 gases;
  flocculent gel hydration products;
  CaCO3 crystals;
  CaCO3 needle-like crystal whiskers).
The CaCO3 gel layer on the cement particle surface has a loosened structure and then the cement particles begin to hydrate gradually. Calcium metasilicate (C-S-H) gel and CaCO3 gel which are the hydration products of cement combine on the cement particle surface into a gel layer. Some flocculent CaCO3 gel crystals penetrate the C-S-H and flocculent CaCO3 gels as needle-like whiskers, forming a skeletal network (Figure 16b).
In the late hydration stage of cement, hydration products on the cement particle surface increase significantly and the wrapper thickens accordingly. Moreover, CaCO3 crystals are wrapped in the hydration products. Meanwhile, the CaCO3 needle-like crystal whiskers are still in the paste to form an effective network structure (Figure 16c), which improves the gelling performance among cement particles.
5.2. Hydration Mechanism of Cement Paste under Ultrasonic Agitation
The hydration mechanism of cement paste under ultrasonic agitation is shown in Figure 17. When CO2 gases are supplied under ultrasonic vibration, they firstly react with Ca(OH)2 which is precipitated from the initial hydration to produce flocculent CaCO3 crystals. The solid surfaces suspended in the liquid are damaged dramatically due to the “cavitation effect” of the ultrasonic wave [38]. When an ultrasonic wave radiates and spreads throughout the paste, it will produce numerous small bubbles in the paste, which will break continuously. More than 1000 instant high pressure regions can be produced at the rupture of bubbles [39,40,41]. The rupture explosions in the series will release a considerable amount of energy to cause great impacts on the surrounding areas. On the one hand, this causes continuous impacts on the cement particle surfaces which have not hydrated completely in the cement paste to make the gel hydration products on the surface peel off quickly, thus getting new cement particles. On the other hand, CaCO3 flocculating constituents are cut effectively under the ultrasonic wave effect and the abundant “nano” crystals are produced scattered among cement particles (Figure 17a).

Figure 17.
Hydration mechanism of cement paste under ultrasonic agitation: (a) Carbonization reaction stage of cement paste after CO2 supply under ultrasonic agitation; (b) early hydration stage of cement paste after CO2 supply under ultrasonic agitation; (c) late hydration stage of cement paste after CO2 supply under ultrasonic agitation. (Note:  Cement particle;
  the supplied CO2 gases;
  flocculent gel hydration products;
  CaCO3 crystals;
  CaCO3 needle-like crystal whiskers).
 Cement particle;
  the supplied CO2 gases;
  flocculent gel hydration products;
  CaCO3 crystals;
  CaCO3 needle-like crystal whiskers).
In the early reaction stage of CO2, the CaCO3 gel layer on the cement particle surface has a relatively loose structure. When CO2 gases are consumed completely, the cement particles begin to hydrate gradually, producing hydration products continuously including “nano” CaCO3 crystals and a certain quantity of CaCO3 whiskers. Due to the “cavitation effect” of ultrasonic vibration, the “nano” CaCO3 crystals cannot adhere to the cement particle surface. Since the surfaces of hydration products from the reaction of cement particles and water are positively or negatively charged and the crystal nucleus has some adsorption capacity, some hydration products can adhere onto “nano” CaCO3 crystal surfaces. These “nano” CaCO3 flocculating constituents are effectively filled in the spaces among the cement particles. Moreover, CaCO3 whiskers depend on flocculating constituents and form a dense networked structure (Figure 17b).
In the late hydration stage of the cement, hydration products on the cement particle surfaces increase, thus thickening the wrapper on the cement particle surface. The “nano” CaCO3 crystals become wrapped by hydration products of the cement which are produced continuously. Consequently, flocculating constituents in the spaces of cement particles become tighter. Moreover, the microstructure of the cement after hydration seems to have better gelling performances and a more compact structure than that under mechanical agitation since the CaCO3 needle-like crystal whiskers interweave between the cement particles (Figure 17c).
6. Conclusions
The results of our previous investigation of CO2 absorption performance of fresh cement paste indicate that the CO2 absorption rate and the ultimate absorption amount of fresh cement paste can effectively be increased. However, the mixing process of concrete is relatively very short in practice. Therefore, the rapid and significant CO2 absorption by concrete cannot be realized only by reasonably setting the mechanical mixing rate and water-cement ratio.
As a consequence, a new method of ultrasonic agitation is applied to facilitate the CO2 absorption performance of cement paste in this investigation. Meanwhile, the CO2 absorption rate and the ultimate absorption amount of cement paste under ultrasonic agitation is thoroughly studied. The results indicate that by applying ultrasonic agitation, the CO2 absorption rate and the ultimate absorption amount of cement paste can be effectively increased. Once the carbonized cement paste is hardened, the hardened cement paste increases the compressive strength and decreases the porosity and pore sizes, indicating the refined pore structure of the hardened cement paste.
Due to the limited investigation on CO2 absorption of cement paste, there are few literatures reporting about it. Moreover, due to the limitation of the experimental device, only some critical problems are studied in this investigation regarding the CO2 absorption of cement paste. However, there are still many problems that require thorough investigations.
Author Contributions
Study design, Y.J.; conduct of the study, L.L. and F.G.; conceptualization, Z.M.; data collection, Z.X.; methodology, L.L.; writing—original draft preparation, L.L. and Y.J. All authors have read and agreed to the published version of the manuscript.
Funding
This work was funded by the National Natural Science Foundation of China (51972337) and National Key R&D Program of China (2019YFE0118500, 2019YFC1904304).
Institutional Review Board Statement
Not applicable.
Informed Consent Statement
Not applicable.
Data Availability Statement
Not applicable.
Acknowledgments
The authors would like to thank the technical staff of the Jiangsu Key Laboratory Environmental Impact and Structural Safety in Engineering for their technical support.
Conflicts of Interest
The authors declare no conflict of interest.
References
- Damtoft, J.S.; Lukasik, J.; Herfort, D.; Sorrentino, D.; Gartner, E.M. Sustainable development and climate change initiatives. Cem. Concr. Res. 2008, 38, 115–127. [Google Scholar] [CrossRef]
- Barcelo, L.; Kline, J.; Walenta, G.; Gartner, E. Cement and carbon emissions. Mater. Struct. 2014, 47, 1055–1065. [Google Scholar] [CrossRef]
- Shtepenko, O.; Hills, C.; Brough, A.; Thomas, M. The effect of carbon dioxide on beta-dicalcium silicate and Portland cement. Chem. Eng. J. 2006, 118, 107–118. [Google Scholar] [CrossRef]
- Jarvis, K.; Carpenter, R.W.; Windman, T.; Kim, Y.; Nunez, R.; Alawneh, F. Reaction Mechanisms for Enhancing Mineral Sequestration of CO2. Environ. Sci. Technol. 2009, 43, 6314–6319. [Google Scholar] [CrossRef] [PubMed]
- Sabbie, A.M.; Vanderley, M.J.; Sergio, A.P.; Arpad, H. Carbon dioxide reduction potential in the global cement industry by 2050. Cem. Concr. Res. 2018, 114, 115–124. [Google Scholar] [CrossRef]
- Costa, B.; Freitas, J.; Santos, P.; Melo, D.; Oliveira, Y. Effects of carbon dioxide in Portland cement: A relation between static sedimentation and carbonation. Constr. Build. Mater. 2017, 150, 450–458. [Google Scholar] [CrossRef]
- Fernandezbertos, M.; Simons, S.; Hills, C.; Carey, P. A review of accelerated carbonation technology in the treatment of cement-based materials and sequestration of CO2. J. Hazard. Mater. 2004, 112, 193–205. [Google Scholar] [CrossRef]
- Shi, C.; Wu, Y. Studies on some factors affecting CO2 curing of light-weight concrete products. Resour. Conserv. Recycl. 2008, 52, 1087–1092. [Google Scholar] [CrossRef]
- Ming, F.; Ming, D. Influence of Conventional Dispersed Nano-CaCO3 on Performance of Concrete. J. Highw. Transp. Res. Dev. 2019, 36, 25–30. [Google Scholar]
- Markus, S.; Johann, P. A TEM study on the very early crystallization of C-S-H in the presence of polycarboxylate superplasticizers: Transformation from initial C-S-H globules to nanofoils. Cem. Concr. Res. 2018, 106, 33–39. [Google Scholar] [CrossRef]
- Alireza, R.; Papadakis, G.V.; Hamid, N. Rate of carbonation in cement modified base course material. Constr. Build. Mater. 2017, 15, 646–652. [Google Scholar] [CrossRef]
- Monkman, S.; MacDonald, M. On carbon dioxide utilization as a means to improve the sustainability of ready-mixed concrete. J. Clean. Prod. 2017, 167, 365–375. [Google Scholar] [CrossRef]
- Beitzel, H.; Charonnat, Y.; Beitzel, M. Assessment and classification of performance mixers. Mater. Struct. 2003, 36, 250–264. [Google Scholar] [CrossRef]
- Vandanjon, P.O.; Larrard, F.D.; Dehousse, B.; Villain, G.; Maillot, R.; Laplante, P. Homogenisation of concrete in a batch plant: The influence ofmixing time and method on the introduction of mineral admixtures. Mag. Concr. Res. 2003, 55, 112–137. [Google Scholar] [CrossRef]
- Izadifar, Z.; Babyn, P.; Chapman, D. Mechanical And biological Effects of ultrasound: A review of present knowledge. Ultrasound Med. Biol. 2017, 43, 1085–1104. [Google Scholar] [CrossRef] [Green Version]
- Vaitkevicius, V.; Serelis, E.; Kersevicius, V. Effect of ultra-sonic activation on early hydration process in3D concrete printing technology. Constr. Build. Mater. 2018, 169, 354–363. [Google Scholar] [CrossRef]
- Hemalatha, T.; Sundar KR, R.; Murthy, A.R.; Iyer, N.R. Influence of mixing protocol on freshand hardened properties of self-compacting concrete. Constr. Build. Mater. 2015, 98, 119–127. [Google Scholar] [CrossRef]
- Yao, Y.; Pan, Y.; Liu, S. Power Ultrasound and Its Applications: A State-of-the-art Review. Ultrason. Sonochem. 2020, 104722. [Google Scholar] [CrossRef]
- Wu, X.F.; Zhang, G.A.; Wu, F.F. Microstructural Characteristics of Mg2Si/Al Composite under different superheat and electromagnetic stirring. Rare Met. Mater. Eng. 2015, 44, 576–580. [Google Scholar]
- Bia, G.Z.; Yu, Z.F.; Liu, Z. Stirring Time on Solidification Microstructure and Mechanical Properties of In-situ Mg2 Si/Al composit. Nonferrous Met. Mater. Eng. 2016, 37, 14–20. [Google Scholar]
- Liu, L.; Ji, Y.; Gao, F.; Zhang, L.; Zhang, Z.; Liu, X. Study on high-efficiency CO2 absorption by fresh cement paste. Constr. Build. Mater. 2021, 270. [Google Scholar] [CrossRef]
- Gao, H.X.; Wang, X.H.; Zhang, Y.H. Comparative Analysis of SiC Particles Reinforced Aluminum Matrix Composites Fabricated by Mechanical Stirring and by Ultrasonic Stirring. Spec. Cast. Nonferrous Alloy 2013, 33, 669–672. [Google Scholar]
- Xiong, G.; Wang, C.; Zhou, S.; Jia, X.; Luo, W.; Liu, J.; Peng, X. Preparation of high strength lightweight aggregate concrete with the vibration mixing process. Constr. Build. Mater. 2019, 229, 116936. [Google Scholar] [CrossRef]
- Aileen, V.; Kay, W. Evaluation of resonance acoustic mixing technology using ultra highperformance concrete. Constr. Build. Mater. 2018, 164, 716–730. [Google Scholar] [CrossRef]
- Kamal, H.K.; Weina, M.; Kavya, V.; Teng, L. Rheological properties ofultra-high-performance concrete—An overview. Cem. Concr. Res. 2019, 124, 105828. [Google Scholar] [CrossRef]
- GB/T17671-1999. Method of Testing Cements-Determination of Strength; Standards Press of China: Beijing, China, 1999. [Google Scholar]
- Devi, S.C.; Khan, R.A. Effect of graphene oxide on mechanical and durability performance of concrete. J. Build. Eng. 2020, 27, 101007. [Google Scholar] [CrossRef]
- Chang, G.; Liang, H.; Libo, Y. Mechanical properties of recycled aggregate concrete modified by nano-particles. Constr. Build. Mater. 2020, 118030. [Google Scholar] [CrossRef]
- Ding, J.W. Effects of the replacement ratio of carbonized recycled fine aggregate on the compressive strength of recycled concrete. J. Fujian I Technol. 2019, 17, 13–16. [Google Scholar]
- Chan, X.Y.; Lu, A.H.; Hu, S.C.; Wang, Y.R.; Zhang, L.; Jiang, R.F.; Zhao, Z.H. Influence of porosity on mechanical properties and energy dissipation of concrete. New Build Mater. 2019, 046, 12–15. [Google Scholar]
- Li, C.; Nie, J.; Feng, Z.; Deng, S.; Lei, Z.; Zhang, Y. Effect of Vibratory Mixing on the Construction and Mechanical Properties of Ultra-High Performance Concrete. Silic. Bull. 2019, 38, 2586–2594. [Google Scholar] [CrossRef]
- Gaëtan, R.; Véronique, B.G.; Olivier, P.; Bruno, G.; Fabrice, B. Heterogeneous porosity distribution in Portlandcement exposed to CO2-rich fluids. Cem. Concr. Res. 2008, 38, 1038–1048. [Google Scholar] [CrossRef]
- Cha, X.X.; Wang, H.Y.; Feng, G.L. Effects of supercritical carbonation on the property and pore structure of cement-based materials. J. Harbin I Technol. 2014, 46, 52–57. [Google Scholar]
- Wang, Z.P.; Yang, H.Y.; Zhao, Y.T.; Xu, L.L. Effect of porosity and moisture content on the permeability coefficient of concrete. Concrete 2019, 6, 8–12. [Google Scholar]
- Luque, M.D.; Priego-Capote, F. Ultrasound-assisted crytallization (sonocrystallization). Ultrason. Sonochem. 2007, 14, 717–724. [Google Scholar] [CrossRef]
- Dietemann, M.; Baillon, F.; Espitalier, F. Amorphous magnesium silicate ultrasound-assisted precipitationin a mixing system: Population balance modelling and crystallization rates identification. Powder Technol. 2019, 356, 83–96. [Google Scholar] [CrossRef] [Green Version]
- Nguyen, V.S.; Rouxel, D.; Vincent, B. Dispersion of nanoparticles: From organic solvents to polymer solutions. Ultrason. Sonochem. 2014, 21, 149–153. [Google Scholar] [CrossRef]
- Ganjian, E.; Ehsani, A.; Mason, T.J.; Tyrer, M. Application of power ultrasound to cementitious materials:Advances, issues and perspectives. Mater. Des. 2018, 160, 503–513. [Google Scholar] [CrossRef]
- Richards, W.T.; Loomis, A.L. The chemical effects of high frequency sound waves I. a preliminary survey. J. Am. Chem. Soc. 1927, 49, 3086–3100. [Google Scholar] [CrossRef]
- Harvey, E.N.; Loomis, A.L. The destruction of luminous bacteria by high frequency sound waves. J. Bacteriol 1929, 17, 373–376. [Google Scholar] [CrossRef] [Green Version]
- Newman, A.P.; Lorimer, J.P.; Mason, T.J.; Hunt, K.R. An investigation into the ultrasonic treatment of polluted solids. UItrason. Sonochem. 1997, 4, 153–156. [Google Scholar] [CrossRef]
Publisher’s Note: MDPI stays neutral with regard to jurisdictional claims in published maps and institutional affiliations. |
© 2021 by the authors. Licensee MDPI, Basel, Switzerland. This article is an open access article distributed under the terms and conditions of the Creative Commons Attribution (CC BY) license (https://creativecommons.org/licenses/by/4.0/).