1. Introduction
Flat panel loudspeakers are a promising alternative to conventional loudspeakers. Invisible integration, wide and diffuse radiation and improved room interaction are the advantages of a flat panel loudspeaker design [
1]. Furthermore, larger and more powerful devices can be integrated without disturbing customers’ views or the aesthetics of a room [
2]. In addition to invisible integration, the customer of an audio device expects that an audio signal can be reproduced with sufficient amplitude and quality [
3]. The acoustic quality can be expressed in terms of the frequency limits, maximum sound pressure level (SPL), flatness of the pressure response, harmonic and nonlinear distortions and directivity response [
4,
5]. This study focuses on improving the directivity response of flat panel loudspeakers.
Evans [
6] examined numerous studies regarding the influence of loudspeaker directivity on perceived sound quality. A central result is that the spatial uniformity of reflections as a function of frequency is the most important factor. The perceived sound quality of a loudspeaker is a combination of direct sound, slightly delayed and attenuated early reflections, and a progressively delayed reverberant sound field [
7]. Olive [
8] developed a model based on objective measurements to assess the subjective preference of loudspeakers. He concluded that the uneven radiation of sound energy into a room produces discoloration and unusual spatial artifacts. In addition, loudspeakers with inhomogeneous directivity response are rated worse than loudspeakers with a more uniform response.
Resonance in loudspeakers affects the temporal and frequency-dependent radiation [
7]. Therefore, a resonance-based speaker system will result in a strong frequency-dependent directivity response, which has been shown in an earlier study [
9]. Especially in the higher frequency range (>1 kHz), flat panel loudspeakers tend to radiate more sound off-axis (
) than into the listening window (LW,
), which can cause coloration and a worse subjective preference rating. An example of such a frequency-dependent directivity response is shown in
Figure 1, which presents a comparison of the Genelec 8250A studio monitor (left) and a simple flat panel loudspeaker prototype with a single exciter (right).
The studio monitor represents a cone loudspeaker with uniform directivity response at low frequencies. If the acoustic wavelength is much larger than the size of the loudspeaker (width = 286 mm), then the radiation can be described as a monopole radiation. With increasing frequency, becomes shorter, and the loudspeaker can start to beam if is half the size of the loudspeaker dimensions. More sound pressure is radiated to the front than to the side angles. The directivity response of flat panel loudspeakers is much more complicated. At low frequencies, the directivity is also close to monopole directivity. With increasing frequency, the directivity is strongly mode dependent. Even with dimensions that are three times larger (width = 855 mm), the loudspeaker stops beaming to the front for higher frequencies. In contrast, with rising frequency and a much shorter than the speaker dimensions, more sound pressure radiates off-axis.
This behavior can also be visualized with the directivity index (DI). In this study, the DI is defined as the difference in the frequency response of the LW (
) to the total radiation in the front hemisphere (FH,
), as plotted in
Figure 2. At low frequencies (<100 Hz), the first eigenmode dominates, and the directional characteristics correspond to that of a monopole with a DI value of zero. In the mid-frequency range (100 Hz–1 kHz), the DI is not constant but fluctuates around the value of zero. At higher frequencies (>1 kHz), the DI tends towards a negative value, and more sound radiates off-axis than on-axis. This behavior can cause coloration and unusual spatial artifacts [
8] and needs to be improved. The frequency with the lowest DI is the coincidence frequency
, where the acoustic wavelength equals the bending wavelength in the structure.
Several approaches have already been used to investigate the problem of inhomogeneous radiation. Differentiation between the frequency ranges below coincidence and above coincidence is important. Both frequency ranges tend to have a negative DI, but improving the DI requires significantly different constructive changes. Above
, the acoustic wavelength
is shorter than the bending wavelength
, and the sound can only be radiated in a frequency-dependent spatial direction. This behavior can be solved by decreasing
and increasing
by using different panel properties [
10] or by using a complex panel layup, e.g., a sandwich structure [
11]. These changes are not considered in this paper. Below
, the sound radiation can be predominantly described by near-field effects [
12]. The radiation is dominated by the mode shape and amplitude distribution and can be optimized by changing the vibration pattern of the panel. Bai [
13] combined a genetic algorithm with a numerical simulation model to calculate the ideal exciter position in terms of the best possible efficiency and directivity. An optimized exciter position improves the directivity result, but strong radiation to the sides remains. Kournoutos [
14] investigated the possibility of generating a directional sound field by using an exciter array on a clamped panel. The authors were able to experimentally demonstrate that an appropriate directivity can be achieved by using multiple exciters. This option results in a higher cost and higher complexity due to the multiple exciters, amplifiers and digital signal processor (DSP) outputs. A simpler method was investigated in an earlier study, which considered the influence of boundary conditions on the DI [
9]. A more homogeneous characteristic of the DI was achieved by decoupling the edge with rubber and bitumen.
The aim of the present paper was to improve the directivity response below the coincidence of an existing panel by changing the resulting vibration pattern using edge damping. This approach changes the proportion of traveling waves relative to standing waves, which causes amplitude redistribution. Both effects influence the sound radiation and the directional characteristics of the flat panel loudspeaker. In
Section 2, the directivity of a flat panel loudspeaker prototype is analyzed in detail by comparing the frequency-dependent surface acceleration with the radiated sound pressure. In the third section, numerical investigations are conducted to understand the root causes of the off-axis radiation and the influence of damping. With numerical simulation methods, the DIs of individual modes are calculated, and the root cause of the negative DI is visualized. Furthermore, the simulation model is used to differentiate between standing waves and traveling waves to analyze the impact of damping on the directivity characteristics. In the last section, different prototypes with edge damping are built, and measurements of directivity and surface acceleration are performed with real prototypes. This experiment demonstrates that additional damping significantly improves the directivity in the region below the coincidence frequency without losing sensitivity in the LW. Accordingly, edge damping is a simple, robust, inexpensive and effective approach for improving the directivity of flat panel loudspeakers.
2. Theoretical Analysis of the Directivity Response
The following section describes the basis of the frequency-dependent directivity response of flat panel loudspeakers. A numerical simulation model was set up to analyze the frequency-dependent radiation mechanism of individual modes and to derive the different radiation mechanisms of the near-field effect above and below the coincidence frequency . Furthermore, the frequency-dependent DI values of several modes were compared. The findings show that the standing wave pattern especially tends to increase off-axis radiation. Therefore, traveling waves or a combination of standing and traveling waves are preferred. The differences in both wave types for the panel displacement and the directivity response are described and visualized.
2.1. Far Field Radiation of Plane Waves
Theoretically, the propagation of structure-borne sound by bending waves and the subsequent sound radiation can be represented in the wavenumber space (also referred to as k-space), enabling the consideration of the ratio of the bending wavelength
to the acoustic wavelength
according to Williams [
15]. The wavenumbers in the three-dimensional space are related to the wavenumber of the plane airborne sound wave:
where
and
represent the wavenumbers of the bending wavelength in the x direction and y direction, respectively, and
is the wavenumber for the radiated sound field perpendicular to the vibrating surface and is a dependent value. The parameter
k defines the propagating acoustic wavenumber with the propagating speed of sound
defined as follows:
The ratio of
and
is frequency dependent, caused by the dispersion of bending waves. Therefore, three interesting cases exist: subsonic radiation (
); coincidence (
); and supersonic radiation (
). Depending on the ratio of the bending wavenumber and the acoustic wavenumber, different panel areas are sources for the acoustic far field [
15]. To visualize this dependency, a simple comparison of a mode without a nodal line (mode 1 × 1) and a mode with nodal lines (mode 1 × 7) is made, as schematically shown in
Figure 3 and by numerical simulation in
Figure 4.
For the special case of “subsonic radiation” or “below coincidence”
, the following relation results for the wavenumber
:
For this special case, the wave field decays with an increase in distance (evanescent wave), and the bending waves on the surface cancel each other, which results in inefficient radiation into the far field. By assuming an infinite panel with subsonic wave components no radiation would occur. In the case of a finite panel, uncancelled sources on the panel exist, as shown in
Figure 3. If the bending wavelength or the distance between the “individual sources” on the surface is smaller than the acoustic wavelength, sound sources at the edges will remain, which have no corresponding source to cancel—as shown in
Figure 4.
When , the mode 1 × 7 radiates less sound because an acoustic short circuit dominates the near-field region. Nevertheless, the radiation corresponds to that of a monopole. At this frequency, the 1 × 1 mode is almost an ideal monopole with a uniform spherical radiation pattern. As the frequency increases and the acoustic wavelength decreases (), the directivity response becomes more complex. In this region, the acoustic wavelength is no longer large enough to eliminate all local sources on the panel due to the acoustic short circuit. As a result, the edges remain as sources for the acoustic far field. The sound pressure distribution of mode 1 × 7 indicates that the sources are located at the left and right edges of the panel. Their interference generates radiation to the front, and to a large extent, to the side.
If the bending wavelength corresponds to the acoustic wavelength (
), then coincidence occurs. In this case, the wavefronts of the airborne sound wave propagate in parallel to the surface, and grazing radiation is present, in which the bending waves can supply maximum power to the surrounding fluid [
16]. The coincidence frequency
of rectangular plates can be described with Equation (
4), which depends on the ratio of mass per unit area
to the bending stiffness
B:
In the case of “supersonic radiation” or “above coincidence”
, the whole surface is a radiator. The wavenumber
for the radiated sound field can thus be described by
The acoustic wavelength is smaller than the bending wavelength, and the acoustic short circuiting of the local sources on the panel does not occur. Instead, the entire panel radiates sound to the acoustic far field.
Figure 4 shows that the radiation to the side dominates, whereas only a small part is radiated on-axis.
2.2. Far Field Radiation of Individual Modes
In the following section, the directivity of individual modes is investigated. The simulation model described in the previous section is now employed to determine the DI of individual modes. This is a purely numerical analysis, in which only one corresponding eigenmode was extracted and solved in the frequency range between 20 Hz and 5 kHz. For a real panel, the total surface vibration is the superposition of all driven modes and not only one mode is radiating. In this example, only symmetric (odd) modes are investigated since the antisymmetric (even) modes are not excited due to the central exciter position. For this purpose, microphones were placed at a distance of 2 m in 2° steps on the central horizontal plane, and from this, the DI is calculated according to Equation (
8). The DI is determined from the difference in the averaged SPL in the LW (
) relative to the entire angular range (
).
Figure 5 shows the DIs for different panel eigenmodes.
Mode 1 × 1 behaves as a monopole radiator since the panel moves in phase at all times. As a result, the DI is never negative. With increasing frequency, beaming occurs, which yields a positive, nonzero DI. All other eigenmodes exhibit a characteristic progression of the DI and always have both positive and negative DIs. This result is due to the interference of individual sources on the panel. All eigenmodes have a DI of zero at low frequencies; i.e., the loudspeaker radiates evenly in all directions as a monopole. This effect can be explained by the significantly larger wavelength of the airborne sound wave than the path difference between the individual sources. All eigenmodes have the first peak in the DI at approximately 350 Hz. This peak is produced by the interference of the outermost two sources, which are almost equally spaced for all eigenmodes. The strong dip, which occurs in all modes (except mode 1 × 1), corresponds to a quasi coincidence frequency. At this frequency, the bending wavelength in the x direction coincides with the wavelength of the air. As the mode order increases, decreases, and is shifted to higher frequencies. The dip becomes deeper and more sound is radiated off-axis. Furthermore, the maxima and minima of different eigenmodes are observed on vertical lines since similar source spacings occur among the different eigenmodes.
Every eigenmode, except mode 1 × 1, generates a negative DI due to the constructive interference of individual wave paths outside the LW. For a real panel, the first eigenmode, in particular, dominates at lower frequencies, emitting sound relatively homogeneously, similarly to a monopole radiator. With increasing frequency, higher eigenmodes also drive sound radiation. If the bending wavenumber of these eigenmodes is close to the acoustic wavenumber k, then an increased amount of off-axis radiation occurs.
2.3. Standing Waves versus Traveling Waves
As shown in the previous section, undamped eigenmodes or standing waves tend towards a negative DI. In order to prevent individual sources from being perfectly canceled, it is essential to change the panel’s vibration pattern. The presented solution uses edge damping to reduce the proportion of standing waves and to increase the amount of traveling waves.
Figure 6 visualizes the wave pattern at 5 kHz for a high-pressure laminate (HPL) panel in the cases of low damping (left) and high damping (right). If the panel exhibits low damping, then the traveling waves reflect from the boundaries and form a standing wave pattern. In the case of high damping, the traveling wave is damped while propagating from the excitation point to the boundaries, and the reflected wave has an almost negligible amplitude. As a result, the distribution of the deflection corresponds to a traveling wave with the maximum at the point of excitation.
Increasing the damping does not directly minimize the acoustic output. Xie [
17] calculated the total panel radiance, taking into account both the standing waves and the point force radiation component, for various damping measures. He concluded that damping has no effect below the first eigenmode and above the coincidence frequency. Furthermore, below coincidence, an increase in modal damping also yields an improvement in the radiation efficiency.
In a real panel, the superposition of standing and traveling waves is present.
Figure 7 shows the deflection distribution on the HPL panel for the weak damping case (left) and moderate damping case (right). Increasing the damping increases the proportion of traveling waves relative to standing waves, depending on the degree and spatial distribution of the damping [
12]. An amplitude redistribution occurs, and the deflection in the center of the panel is significantly higher than that at all other locations.
4. Evaluation of Prototypes with Edge Damping
The following sections introduce the real prototypes used to evaluate the influence of edge damping on the surface acceleration and sound field radiation. Furthermore, the measurement methods used employed for the acoustic sound field and the mechanical displacement measurements are described and the surface acceleration and sound field radiation are evaluated for all three variants. The improvements in reduced off-axis radiation and a more homogeneous directivity response become visible when using additional damping. The mean value and standard deviation of the directivity response as well as the sensitivity are calculated to evaluate the differences of all three variants.
4.1. Introduction of the Adaptable Prototype
All measurements in this paper are performed with the adaptable prototype shown in
Figure 11 and described in earlier publications [
20]. The adaptable prototype enables the exchange of different parts of the flat panel loudspeaker for comparison, e.g., different panels with the same boundary conditions. A subsequent section of the framed panel is exchanged with panels that have additional damping. To guarantee sufficient input force at higher frequencies, the chosen exciter Dayton Audio DAEX25FHE-4 has an upper-frequency limit above 15 kHz, as measured in [
10]. The influence of edge damping is evaluated with two additional variants. Both variants are depicted in
Figure 11 in comparison to the simple construction without any damping applied. The option of bitumen inside the frame (BIF) has a layer of bitumen impregnated paper with a width of 40 mm width and a thickness of 2 mm directly attached to the panel. The HPL panel is glued to the frame. Because of the fixed boundary conditions, a similar standing wave pattern is expected. Furthermore, the additional mass of the bitumen impregnated paper increases the mass of the moving panel, which can cause a rise in the coincidence frequency
. The second prototype featuring bitumen on the frame (BOF) has a damping layer between the frame and the panel, and the panel is decoupled. However, this construction might have similar fixed boundary conditions at lower frequencies, where the bending wavelength is large. If the bending wavelength decreases, these boundary conditions can be softened, and a different frequency-dependent wave pattern can occur. No additional mass is attached to the moving panel, and therefore,
should be equal to that of the raw undamped panel.
4.2. Acoustic Measurements
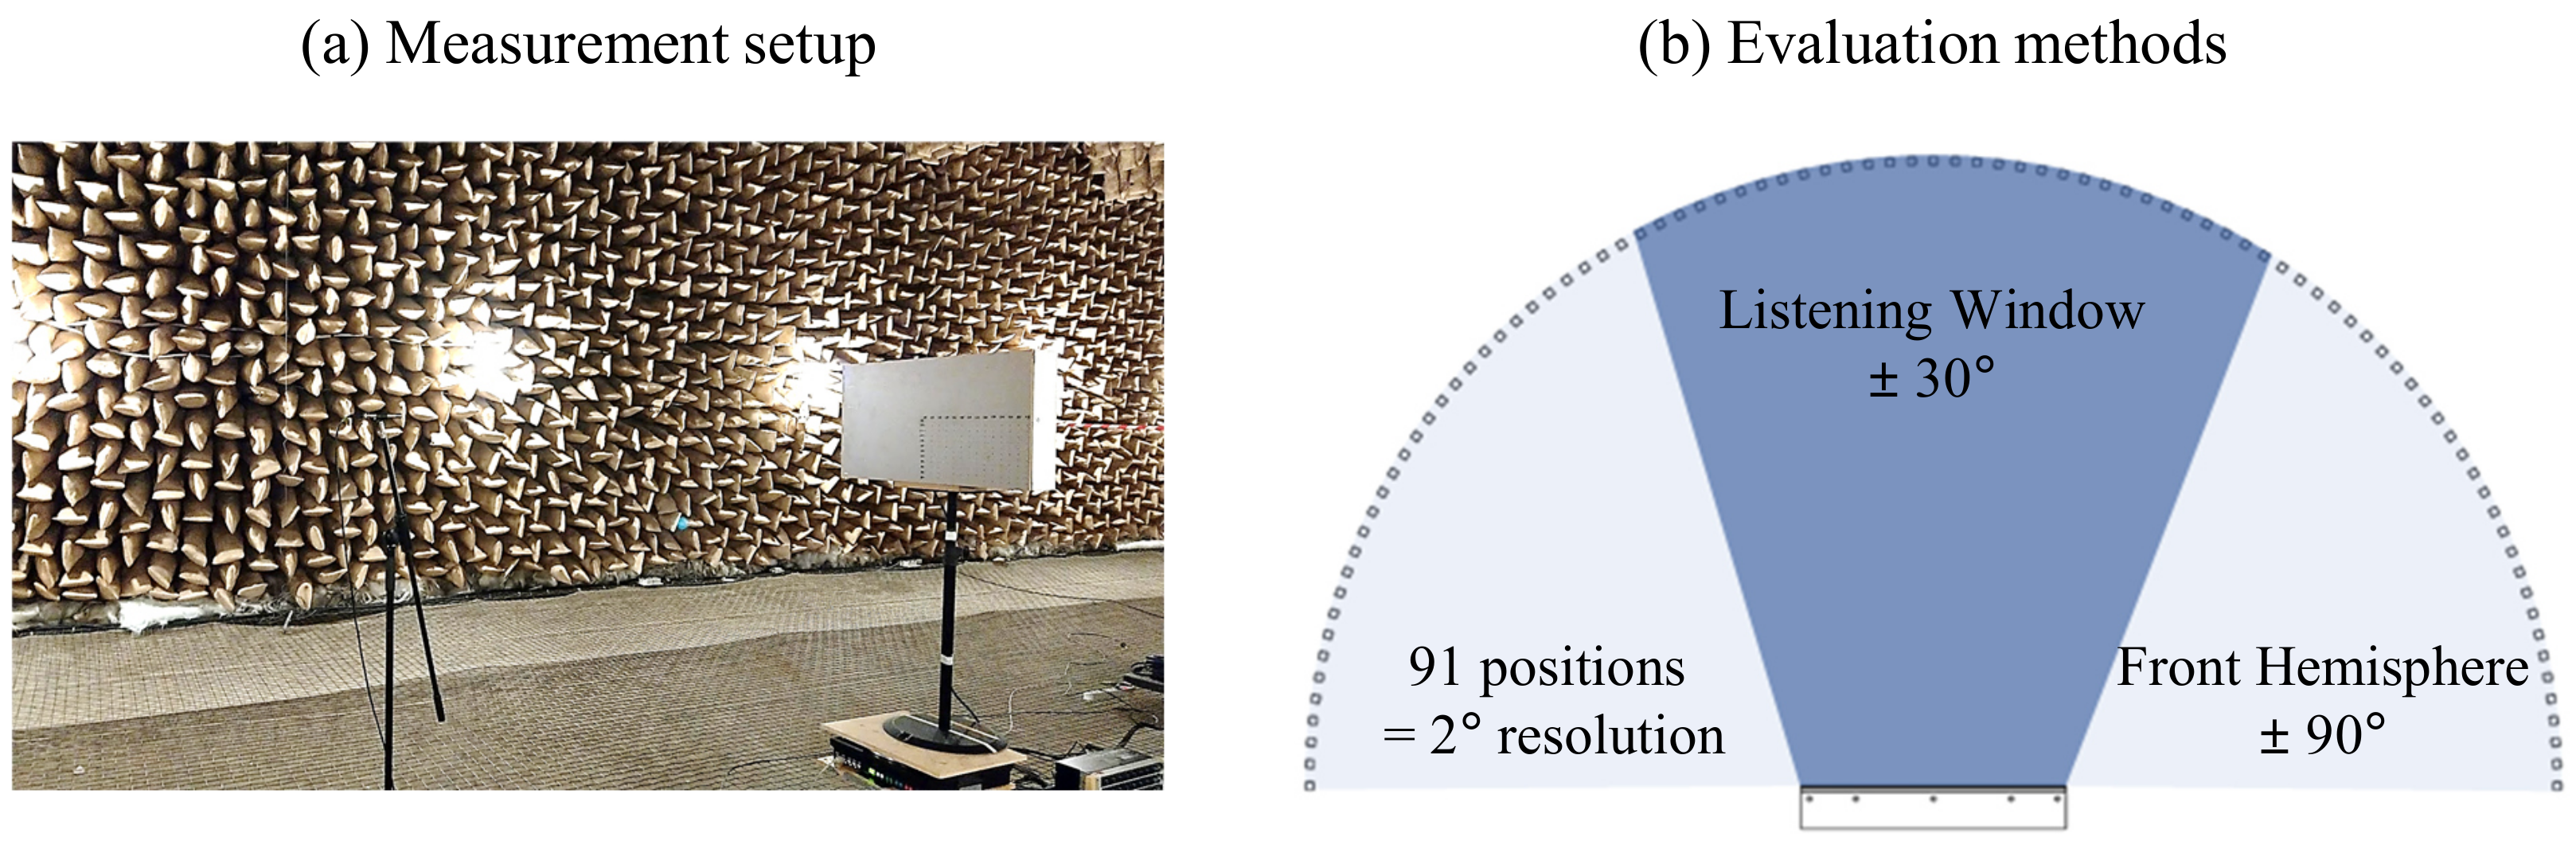
All acoustic measurements were performed in the anechoic chamber at the Technical University of Dresden, as shown in
Figure 12, by using a Klippel DA2 analyzer. The microphone (Gras 40HL) was placed at a distance of 2 m, focusing on the panel’s center, and the measurements were performed with a 4 Vrms input signal in the form of a sweeping sine wave averaged four times. The speakers were placed on a rotating turntable (LinearX LT360EX) to measure the radiation with a resolution of
.
The evaluation process is based on the ANSI-CEA-2034 standard [
22], but two significant changes were made. Flat panel loudspeakers tend to have a much more complex directivity pattern at higher frequencies than conventional loudspeakers [
23]. Therefore, the spatial resolution is increased from an angular resolution of
to
to provide sufficient data points to evaluate sharp directivity beams. Furthermore, the DI only considers the radiation in the horizontal hemisphere in the range of
. The DI is calculated from the spatial average of the LW (
) and the front hemisphere (
) response, as shown in
Figure 12.
Compared to an on-axis response (single point), the LW represents a wider listening zone, which is more realistic for the use case of a flat panel loudspeaker, and small fluctuations caused by acoustic interference are attenuated. The LW is a spatial average of the amplitude responses in the
horizontal angular range. The results are calculated as averages over squared sound pressure values measured at equidistant angle positions
k with a resolution of
with the following common expression:
where
N represents the total number of measured angles (91 positions for FH and 31 positions for LW). The mean SPL for each evaluation window is calculated from the root mean square sound pressure by
The equation of the DI is defined as the difference between the LW
and the FH curve
:
4.3. Mechanical Vibration Measurement
All laser measurements were performed at the Technical University of Dresden with the Keyence HK-052 triangulation laser head and the Klippel KA3 measurement system, as shown in
Figure 13. The triangulation laser is optimized for displacement measurements, and the displacement decreases by approximately 12 dB per octave above the fundamental resonance frequency, which reduces the signal-to-noise ratio (SNR). A sufficient SNR of the measured signal to 10 kHz with a 10 dB overhead can be reached by averaging the signal 256 times and shaping the stimulus to increase the displacement at higher frequencies. Due to the short time signal at higher frequencies, the signal voltage can be increased to 8 Vrms in the frequency range from 5 kHz to 10 kHz. Furthermore, the following data are displayed instead of displacement in acceleration to guarantee a more straightforward evaluation. The decay of 12 dB per octave of the displacement response is removed in the acceleration domain. The acceleration is the second derivative in the frequency domain calculated from the displacement signal multiplied by minus omega squared.
4.4. Measurement of the Surface Acceleration and Sound Field Radiation
Figure 14 shows the results of the surface acceleration and sound field radiation measured according to
Section 4.2 and
Section 4.3 for all three variants. The acceleration level displays the acceleration at different positions on the panel versus frequency. The central axis represents the center position, and the upper and lower values of the y axis represent the positions on the panel. The acceleration data are valid only until 10 kHz. For a more straightforward evaluation, the same frequency range as in the sound radiation measurement is displayed.
Below 1 kHz, the radiation is similar for all three variants, caused by the large acoustic wavelength compared to the shorter bending wavelength . However, if becomes shorter, then off-axis radiation becomes dominant. Starting at 1 kHz, the off-axis radiation is larger for the Raw Panel than the radiation in the LW, which produces a negative DI. However, if the center acceleration is the largest, especially in the frequency range between 1 kHz and 5 kHz, then off-axis radiation is dominant.
By comparing the surface acceleration, the additional damping layer in the BIF or BOF construction has a smaller impact at lower frequencies (below 1 kHz) and a larger impact at higher frequencies (above 1 kHz). A similar acceleration pattern and standing waves are visible for all variants at low frequencies. With an increase in the wavenumber, the impact of the damping increases. Even if the damping layer is applied to the edges, the impact on the average surface acceleration is large, especially at accelerations close to the boundary. This finding implies that the amount of the standing wave pattern is reduced. The reduced amount of surface acceleration close to the boundary also significantly impacts the directivity response. For both variants BIF and BOF, especially between 1 kHz and 5 kHz, the off-axis radiation is significantly reduced. The effect of coincidence is minimized but cannot be avoided. Damping does not change the bending wavelength, only the ratio of standing waves to traveling waves. Therefore, only the amplitude of the radiated wave can be reduced. This effect can be clearly seen by comparing the results of Panel-Raw to those of Panel-BIF or Panel-BOF. Furthermore, the prototype BIF shows a slight shift of
compared to those of RAW and BOF. The increased coincidence frequency results from the additional mass of the damping layer, even when it is placed close to the frame. The impact of the additional damping layer below 1 kHz is negligible, and the same directivity response occurs. The upper-frequency limit of 15 kHz is caused by the break-up mode of the exciter voice-coil former, which is similar for all variants.
Figure 15 shows the calculated DI for all variants. The results are confirmed, and the prototypes with additional damping have a better DI than the raw panel below
. Above
, the damping has less influence.
Both variants with additional damping layer generate an improved directivity response, which can be expressed by the mean value and the standard deviation. The results of the mean value and standard deviation are presented in
Table 2. It becomes visible that the edge damping has the largest influence in the frequency range below the coincidence frequency (1 kHz–7.5 kHz). The mean value of the DI is increased from −3.94 dB to −1.40 dB by 2.54 dB for the variant BIF and to −1.49 dB by 2.45 dB for the variant BOF. Furthermore, the standard deviation is also reduced from 3.03 dB to 1.92 dB by 1.14 dB (BIF) and to 2.92 dB by 0.11 dB (BOF). Both variants have a higher mean value and a lower standard deviation, which leads to a more homogeneous directivity response. The variant BIF has better results than the variant BOF and a larger impact can be achieved by attaching the damping directly to the moving surface of the panel. In the frequency range of 100 Hz–1.0 kHz and above coincidence (7.5 kHz–20 kHz), the impact of damping is low.
4.5. Evaluation of the Sensitivity
In addition to the DI, the impact on the sensitivity should be considered. If the damping minimizes the total sound pressure, then this compromises the maximum power handling and preference rating. If damping only occurs in the nonpreferred directions of radiation, then no trade-off arises.
Table 3 shows the averaged SPL
in the frequency range of 1 kHz to 10 kHz for the LW and FH. The additional damping substantially impacts only the FH sensitivity and has a minimal impact on the LW sensitivity. The reduced sensitivity value in the LW is approximately 0.7 dB, which is within an acceptable range. The reduction in the FH is approximately 3 dB.
This finding underlines that the additional damping has a greater impact on the FH and a lower impact on the LW response. Therefore, the results with additional damping can be interpreted as results with similar sensitivity but improved directivity. Any damping is assumed to be a loss of energy. In this case, the damping affects the radiation range exactly, which causes a lower listening preference rating. To further reduce the losses, more complex methods are necessary, e.g., the use of several exciters, which would result in higher complexity and higher production costs.
5. Summary
This paper focuses on optimizing the directivity of flat panel loudspeakers below the coincidence frequency by minimizing the off-axis radiation. This problem can be solved with additional damping on the panel, which changes the proportion of traveling waves relative to standing waves. Furthermore, this approach leads to amplitude redistribution on the panel. Above the coincidence frequency, only the panel properties are dominant, which cannot be affected without changes in mass or stiffness. This robust and straightforward method is comprehensively described in the sections of this paper.
In
Section 2, the directivity responses of individual modes are analyzed and provide knowledge about the negative DI. The directivity is the result of the ratio of the bending wavelength to the acoustic wavelength. Therefore, differentiating between the frequency ranges below and above coincidence is important. Above coincidence, the acoustic wavelength is shorter than the bending wavelength, and the sound wave couples almost perfectly to the air with maximum radiation efficiency. However, the energy can be radiated in only one frequency-dependent spatial direction. The behavior can be improved by using different panel properties or a complex panel layup. Below the coincidence frequency, the sound radiation can be predominantly described by near-field effects, and the radiation is dominated by the mode shape and amplitude distribution on the panel. Especially symmetrical mode shapes tend to a perfect acoustic cancellation in the panel center and sources at the edges remain. Due to the distance between the remaining sources, complex directivity responses are generated. A redistribution of the deflections can be achieved by constructive modifications or by damping. Increasing the damping changes the wave pattern from standing waves towards traveling waves.
In the following section, a numerical simulation model is set up to analyze the frequency-dependent radiation mechanism of three different damped HPL-panels. The numerical simulation models have shown that an increased damping value reduces the sources at the edge of the panel compared to the center of the panel. The decreased amount of standing waves will generate less off-axis radiation, and the panel motion is concentrated in the region of the force application point.
In the last section, real prototypes with two different types of edge damping are introduced and compared with the initial state without damping. For this purpose, the results were determined by measuring the panel motion using laser vibrometry and the directivity in an anechoic chamber. In principle, the existence of specific eigenmodes can be demonstrated by the panel motion at low frequencies. With increasing frequency, the modal pattern has a higher complexity, and the deflection is concentrated at the center of the panel. Between 1 kHz and 6.2 kHz, the dominant radiation off-axis is particularly noticeable, which yields a negative DI. The additional damping optimizes the DI, especially in the angular range, which would yield a lower listening preference rating. The impact on the LW radiation is low. The directivity response of the damped panel is more homogeneous, measured by a higher mean value and lower standard deviation. The best result can be achieved with damping attached to the panel on the inside of the frame.
This finding underlines the result that the additional damping applies more to the FH and has a lower impact on the LW response. Therefore, the results with additional damping can be interpreted as results with similar sensitivity but improved directivity. Optimizing the DI without any losses requires more complex methods, e.g., the use of several exciters, which would result in higher complexity and higher production costs. Accordingly, the presented method of edge damping is a simple, robust, inexpensive and effective approach for improving the directivity of flat panel loudspeakers.


