Article

Amperometric Biosensors for L-Arginine Determination Based on L-Arginine Oxidase and Peroxidase-Like Nanozymes

1
Institute of Cell Biology, National Academy of Sciences of Ukraine, 79005 Lviv, Ukraine
2
Faculty of Veterinary Hygiene, Ecology and Law, Stepan Gzhytskyi National University of Veterinary Medicine and Biotechnologies, 79000 Lviv, Ukraine
3
Department of Chemical Engineering, Ariel University, Kyriat-ha-Mada, Ariel 4070000, Israel
*
Authors to whom correspondence should be addressed.
Appl. Sci. 2021, 11(15), 7024; https://doi.org/10.3390/app11157024
Submission received: 20 June 2021 / Revised: 26 July 2021 / Accepted: 27 July 2021 / Published: 29 July 2021
(This article belongs to the Special Issue World of Biosensing)

Abstract

:
There are limited data on amperometric biosensors (ABSs) for L-arginine (Arg) determination based on oxidases that produce hydrogen peroxide (H2O2) as a byproduct of enzymatic reaction, and artificial peroxidases (POs) for decomposition of H2O2. The most frequently proposed Arg-sensitive oxidase-based ABSs contain at least two enzymes in the bioselective layer; this complicates the procedure and increases the cost of analysis. Therefore, the construction of a one-enzyme ABS for Arg analysis is a practical problem. In the current work, fabrication, and characterization of three ABS types for the direct measurement of Arg were proposed. L-arginine oxidase (ArgO) isolated from the mushroom Amanita phalloides was co-immobilized with PO-like nanozymes (NZs) on the surface of graphite electrodes. As PO mimetics, chemically synthesized NZs of CeCu (nCeCU) and NiPtPd (nNiPtPd), as well as green-synthesized hexacyanoferrate of copper (gCuHCF), were used. The novel ABSs exhibited high sensitivity and selectivity to Arg, broad linear ranges and good storage stabilities. Two ABSs were tested on real samples of products containing Arg, including the pharmaceutical preparation “Tivortine”, juices, and wine. A high correlation (R = 0.995) was demonstrated between the results of testing “Tivortine” and juice using nCeCU/GE and nNiPtPd/GE. It is worth mentioning that only a slight difference (less than 1%) was observed for “Tivortin” between the experimentally determined content of Arg and its value declared by the producer. The proposed ArgO-NZ-based ABSs may be promising for Arg analysis in different branches of science, medicine, and industry.

1. Introduction

L-arginine (Arg) concentration is an important indicator of food and food-supplement quality, as well as an important biomarker in clinical diagnostics and nutritional status assessment [1,2,3,4,5,6]. A variety of optical and electrochemical methods for Arg determination have been developed to date [7,8,9,10,11,12,13,14,15]. To improve their selectivity, enzymatic approaches have been developed, including electrochemical biosensors [10,11,12,13,14,15,16].
Biosensor systems have many advantages over other techniques [17]. In general, enzyme-based biosensors for Arg determination rely on the measurement of reactants consumed or products generated from enzymatic cascade reactions, including ammonium ions or H2O2 [13,18].
The highly selective enzymes of Arg metabolism are promising tools for biosensor construction. For Arg analysis, arginine decarboxylase, L-arginase, with urease [12,14,19,20,21,22,23,24,25], arginine deiminase (ADI) [26,27,28], and L-arginine oxidase (ArgO) with peroxidase [29,30,31,32,33] may be utilized. However, the necessity of several enzymes in the bioselective layer complicates the process of biosensor fabrication, increases the cost of analysis, and causes losses in bioelectrode stability and sensitivity. Thus, using only one enzyme may be a more promising method for the fabrication of biosensors.
Alternately, many efforts have been devoted in recent years to the development of non-enzymatic sensors. This approach is based on functional materials of different compositions, including nanomaterials. A limitation of this method is insufficient selectivity to the target analyte [34,35,36,37,38]. Nanomaterials with intrinsic enzyme-like activities or nanozymes (NZs) are promising alternatives to natural enzymes in biosensor construction. Artificial POs are the most urgently needed type of NZs for this goal.
A limited number of amperometric biosensors (ABSs), especially mono-enzyme ABSs, have been developed to date to measure Arg concentrations [13,27]. Yet a simple construction of stable ABSs based on one oxidase, namely ArgO, co-immobilized with H2O2-sensitive NZs in a bioselective layer, remains a real problem.
ArgO (L-arginine: oxygen oxidoreductase, EC 1.4.3.25) belongs to a class of oxidases of L-amino acids, that are accumulated in the tissues of some mammals, marine mollusks, and fish, in fungi, algae, bacteria, in the venoms of insects and snakes in the fruiting bodies of poisonous mushrooms [39,40,41,42,43,44]. Oxidases of L-amino acids are promising analytical tools for quantifying the concentrations of the corresponding L-amino acids in different samples [30,31].
ArgO is a poorly studied enzyme to date, as evidenced by a limited list of publications on the problem [29,30,39].
ArgO is a FAD-containing enzyme that catalyzes the conversion of Arg to 5-guanidino-2-oxopentanoate, ammonia and hydrogen peroxide. The enzymatic conversion of Arg is presented in Scheme 1.
In the current work, we report the development and application of ArgO-based ABSs for the direct measurement of Arg. The fabricated ABSs contain purified mushroom ArgO, co-immobilized with H2O2-sensitive nanoparticles on the surfaces of graphite electrodes. A laboratory prototype of the proposed ABSs was tested for Arg determination in samples of juices, wine, and a commercial pharmaceutical.

2. Materials and Methods

2.1. Reagents

Nickel(II) sulfate (NiSO4), cerium(IV) bicarbonate (Ce(HCO3)4), chloroplatinic acid (H2PtCl6), copper(II) sulfate (CuSO4), L-arginine, o-dianisidine, hydrogen peroxide (H2O2, 30%), palladium chloride (PdCl3), sodium borohydride (NaBH4), Nafion (5% solution in 90% low-chain aliphatic alcohols), and all other reagents and solvents used in this work were purchased from Sigma-Aldrich (Steinheim, Germany). All reagents were of analytical grade and were used without further purification. All solutions were prepared using ultra-pure water obtained with the Milli-Q® IQ 7000 Water Purification system (Merck KGaA, Darmstadt, Germany).

2.2. Enzyme Isolation and Purification

Purified mushroom enzyme—L-arginine oxidase (ArgO) was used for the fabrication of the amperometric biosensor. ArgO was isolated from an extract of the fruiting body of the wild forest mushroom Amanita phalloides by a two-step ammonium sulfate fractionation (at double 70% of saturation), followed by ion exchange chromatography on Toyopearl DEAE-650M resin [45]. The scheme of the procedure for obtaining ArgO and the method of monitoring enzymatic activity are presented in Scheme A1.
Activity of ArgO was determined by the rate of hydrogen peroxide formation in reaction with Arg, as monitored by the peroxidative oxidation of o-dianisidine. Activity was measured in a reaction mixture with a final volume of 1.0 mL, containing 50 mM phosphate buffer, pH 7.5, 0.25 mM o-dianisidine, horseradish peroxidase (0.07 mg/mL), 25 mM Arg, and appropriate amount of enzyme. After incubation for an exact time (1–10 min) at 30 °C, and upon appearance of the orange color, the reaction was stopped by the addition of 0.26 mL of 12 M HCl. The generated pink color was determined at 525 nm using a spectrophotometer. The millimolar extinction coefficient of the resulting dye in the acidic solution was 13.38 mM−1·cm−1. One unit of ArgO activity is defined as the amount of enzyme releasing 1 μmol H2O2 per 1 min under standard assay conditions. Protein concentration is determined by the Lowry method. Partially purified ArgO with the specific activity 7.9 mU⋅mg−1 of protein was kept as suspension in 70% sulfate ammonium, 50 mM phosphate buffer, pH 7.5, at 4 °C.

2.3. Synthesis of PO-Like NZs

Nanoparticles of CeCu (further—nCeCu) were synthesized as described earlier [46]: 1 mL of 0.1 M CeCl3·7H2O was mixed with 0.2 mL 10 mM Na2S, followed by adding 1 mL of 100 mM CuSO4, and incubation without stirring for 1 h at 20 °C.
Green hexacyanoferrate of copper (gCuHCF) was synthesized via the enzyme flavocytochrome b2 as described earlier [47]. A reaction mixture containing 6 mM K3Fe(CN)6, 20 mM sodium lactate, and 0.1 U/mL enzyme in 50 mM phosphate buffer, pH 8.0, was incubated at 37 °C for 30 min. Formation of gCuHCFs was initiated by addition of CuSO4·5H2O to a final concentration of 10 mM.
Nanoparticles of NiPtPd (further—nNiPtPd) were synthesized according to the following protocol: to prepare the solution A, 2 mL 2% H2PtCl6 mixed with 2 mL 2% PdCl3 were vigorously stirred for 15 min at 20 °C, followed by adding 0.1 mL 100 mM NaBH4; to prepare the solution B, 2 mL 2% CuSO4 or NiSO4·7H2O or FeCl3·6H2O were vigorously stirred for 15 min at 20 °C, followed by adding 0.05 mL 100 mM NaBH4; to obtain nNiPtPd, solutions A and B were mixed, 0.02 mL of 10 mM NaOH was added, and the reaction mixture was incubated without stirring for 24 h at 20 °C.
All synthesized NZs were collected with centrifugation. The precipitates were rinsed twice with water and were stored as a water suspension at +4 °C until used.

2.4. Assay of Enzyme-Like Activities of the Synthesized PO-Like NZs in Solution

PO-like activity of the nanoparticles was measured by the colorimetric method, with o-dianisidine as a chromogenic substrate in the presence of H2O2. The procedure was as described earlier [47]. One unit (U) of PO-like activity was defined as the amount of NZs decomposing 1 µmol H2O2 per 1 min at 30 °C under standard assay conditions. To estimate special enzyme-like activity (U/mg), the NZs were dried. The tested solution/suspension was prepared by weighing the solid substance and adding water until the needed concentration was obtained.
The assay of PO-like activity: 10 μL of the aqueous suspension of NZs(1 mg·mL−1) was incubated with 1 mL of 0.17 mM o-dianisidine in water (as a control), and with the same substrate in the presence of 8.8 mM H2O2 (as a substrate for PO). Addition of NZs to the substrate stimulated the development of an orange color over time, indicating an enzymatic reaction. The enzyme-mimetic activity could be assessed qualitatively with the naked eye and was measured quantitatively with a spectrophotometer. After incubation for an exact time (1–10 min) at 30 °C, and upon appearance of the orange color, the reaction was stopped by the addition of 0.26 mL 12 M HCl. The generated pink color was determined at 525 nm using a spectrophotometer. The millimolar extinction coefficient of the resulting pink dye in the acidic solution was 13.38 mM−1·cm−1.

2.5. Sensor Evaluation

2.5.1. Apparatus and Measurements

The amperometric sensors were evaluated as described in [47]. In brief, constant–potential amperometry was performed in a three-electrode configuration with an Ag/AgCl/KCl (3 M) as an reference electrode, a Pt-wire as a counter electrode, and a working graphite electrode
Amperometric measurements were carried out as described in [47].
All the experiments were carried out in triplicates. Analytical characteristics of the electrodes were statistically processed using the OriginPro 8.5 software. Error bars in the graphs represent standard errors derived from three independent measurements. Calculation of the apparent Michaelis–Menten constants (KMapp) was performed as described in [47].

2.5.2. Immobilization of NZs and Enzyme on the GE Surface

The NZs and ArgO were co-immobilized on the GEs using the physical adsorption method.
For development of the NZs-based electrode, 5–10 μL of NZs solution with PO-like activity of 1 U/mL was dropped onto the surface of bulk GEs. After drying for 10 min at room temperature, the layer of NZs on the electrode was covered with 10 μL of Nafion. The modified electrodes were rinsed with 50 mM phosphate buffer, pH 7.0, and kept in this buffer with 0.1 mM EDTA at 4 °C until used.
To fabricate the ArgO-based biosensor, 5–10 μL of ArgO solution in 50 mM phosphate buffer, pH 7.0 (0.7 U/mL), was dropped onto the dried surface of the NZ-modified GE. The dried composite was covered by a Nafion membrane. The coated bioelectrode was rinsed with water and stored in phosphate buffer, pH 7.0, until used.

2.6. Preparation of the Real Samples for Biosensor Analysis

The samples used for Arg analysis included the pharmaceutical preparation “Tivortine” (Yuria-Pharm LLC., Cherkasy, Ukraine); freshly prepared apple juice (Wax apple fruit); commercial juices by “Sadochok” (LtD Sandora, Odessa, Ukraine)—peach, multifruit, grape with apple; by “Galicia” (T.B. Fruit Company, Gorodok, Ukraine)—apple with pear; and “Tempranillo” dry red wine (TM “Vina Cruz”, Ukraine). All samples were analyzed using a standard addition test (SAT). Before assay, all samples were diluted stepwise in 50 mM phosphate buffer, pH 7.0, containing 1 mM EDTA. Each assay was performed for two dilutions of the sample and repeated three times. The analytical results were statistically processed using the OriginPro 2021 software.

3. Results and Discussion

3.1. Amperometric Characteristics of the PO-Like NZs/GE

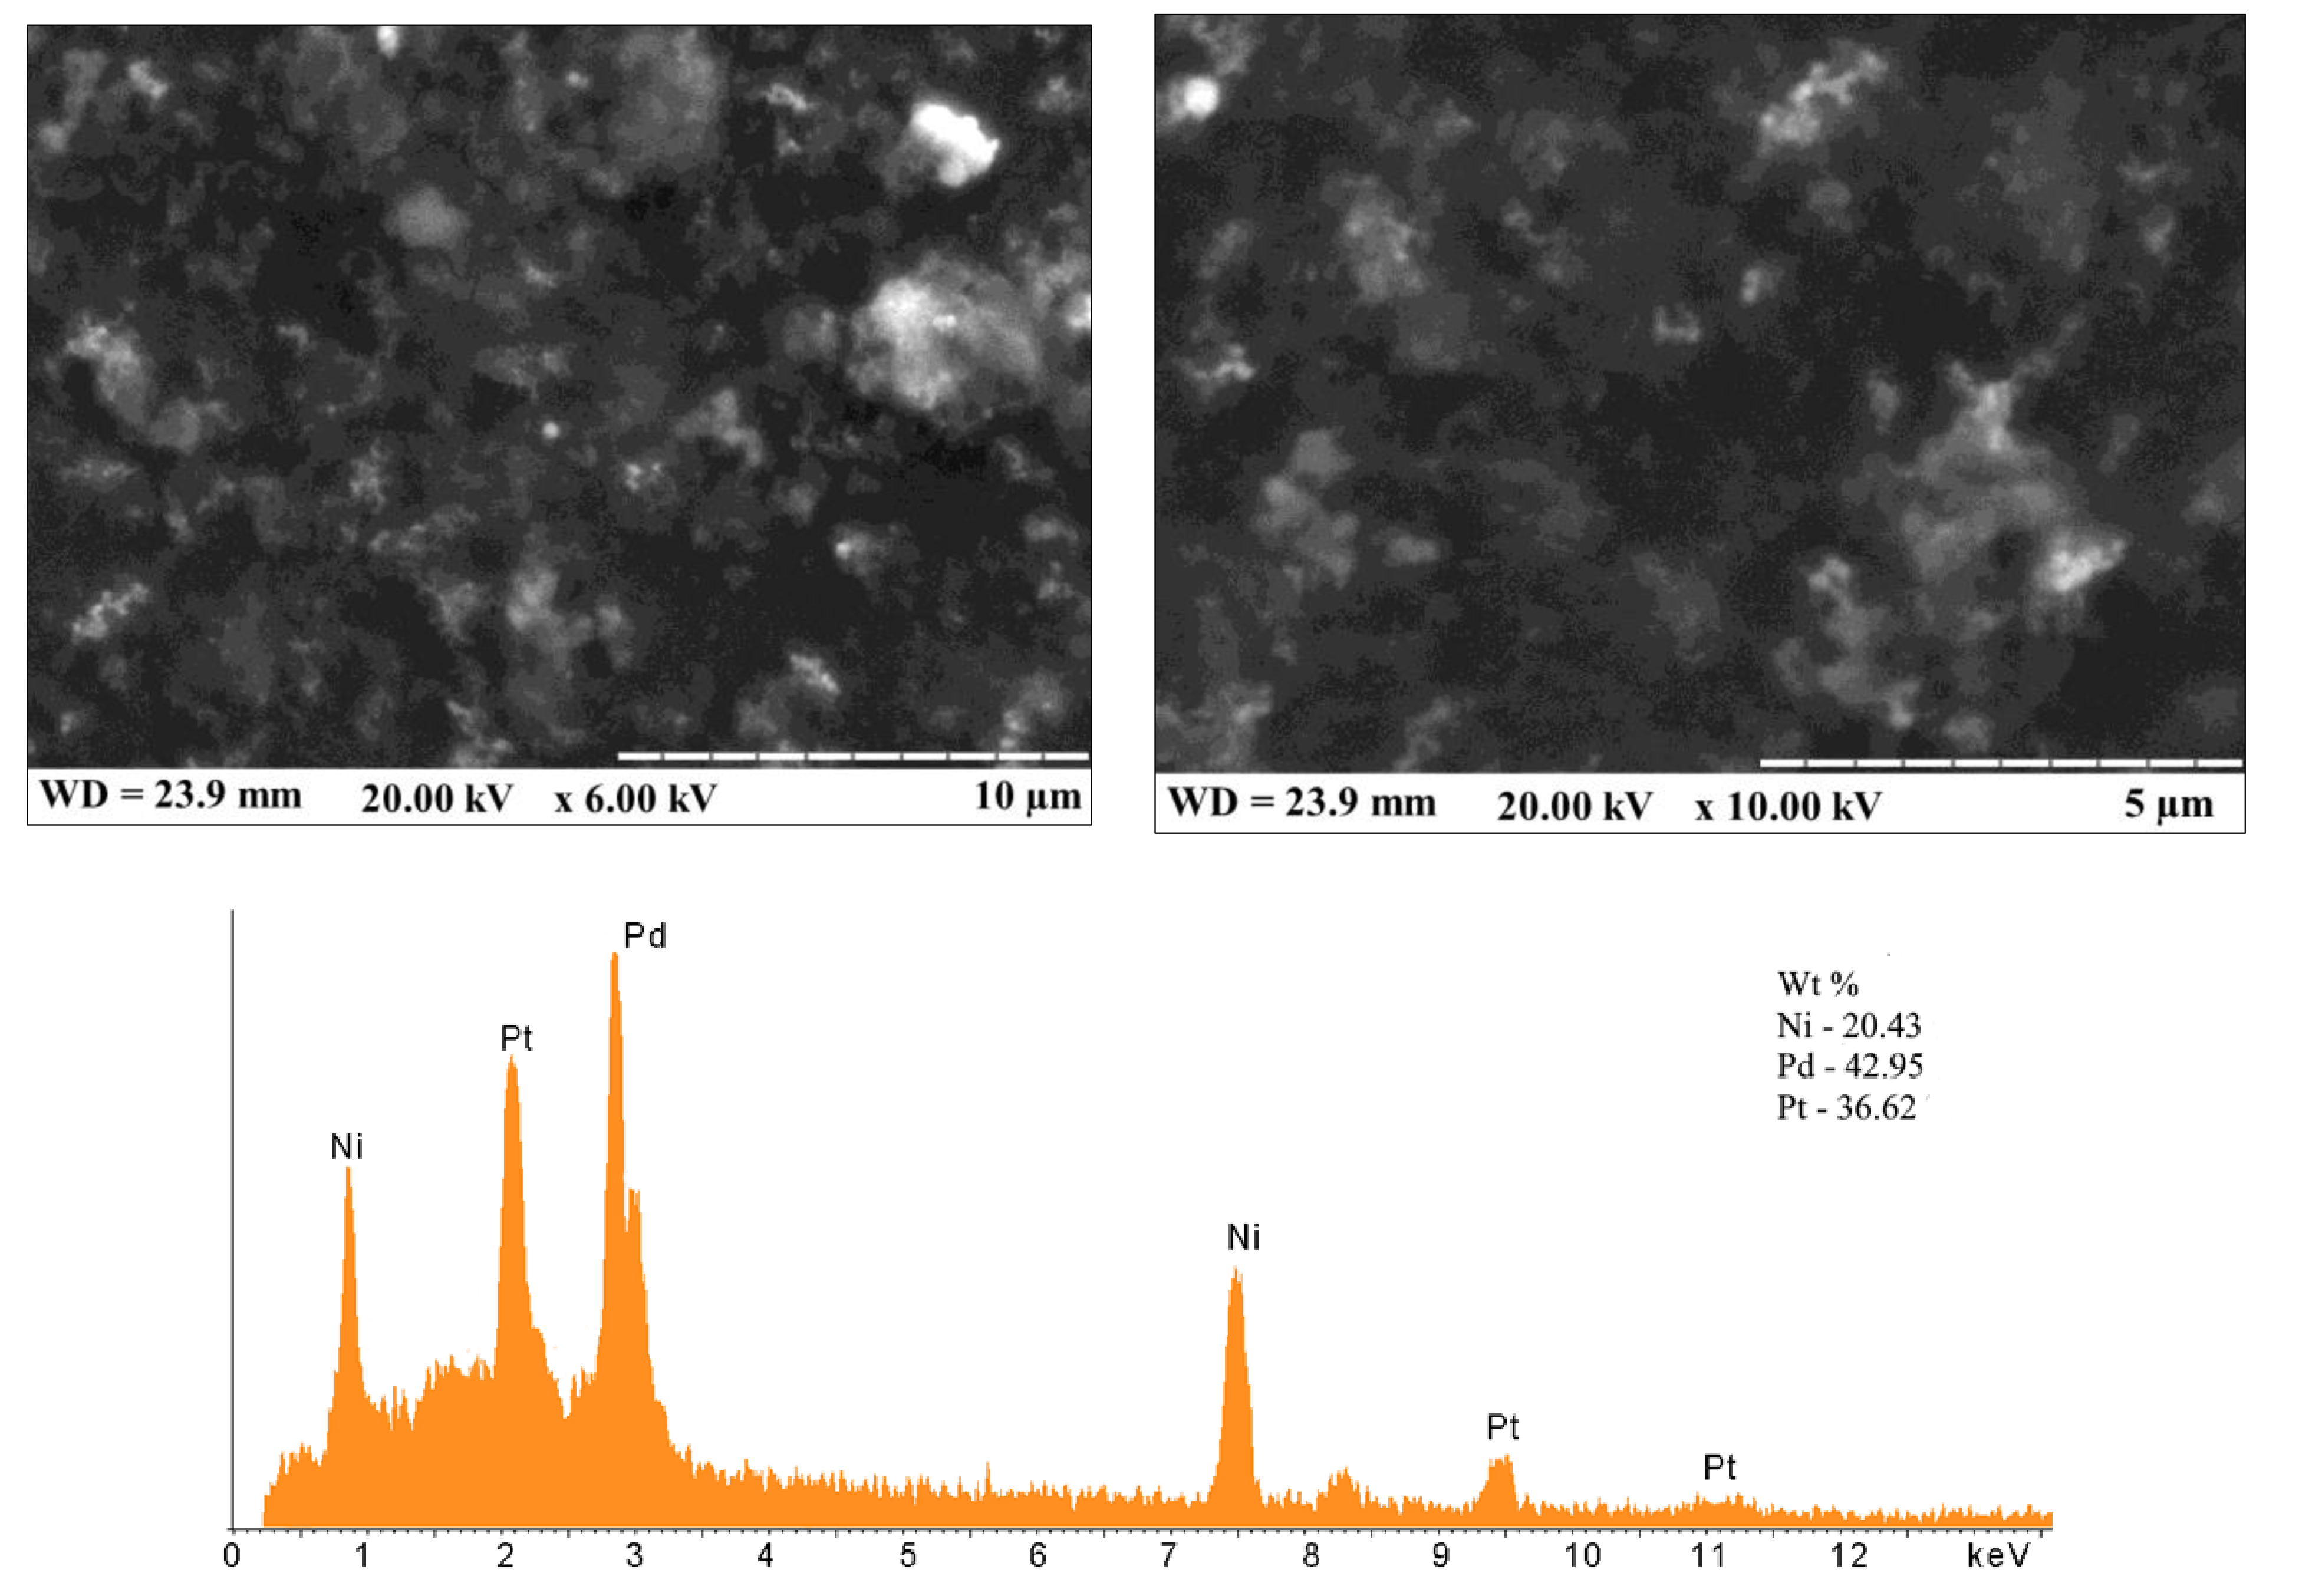
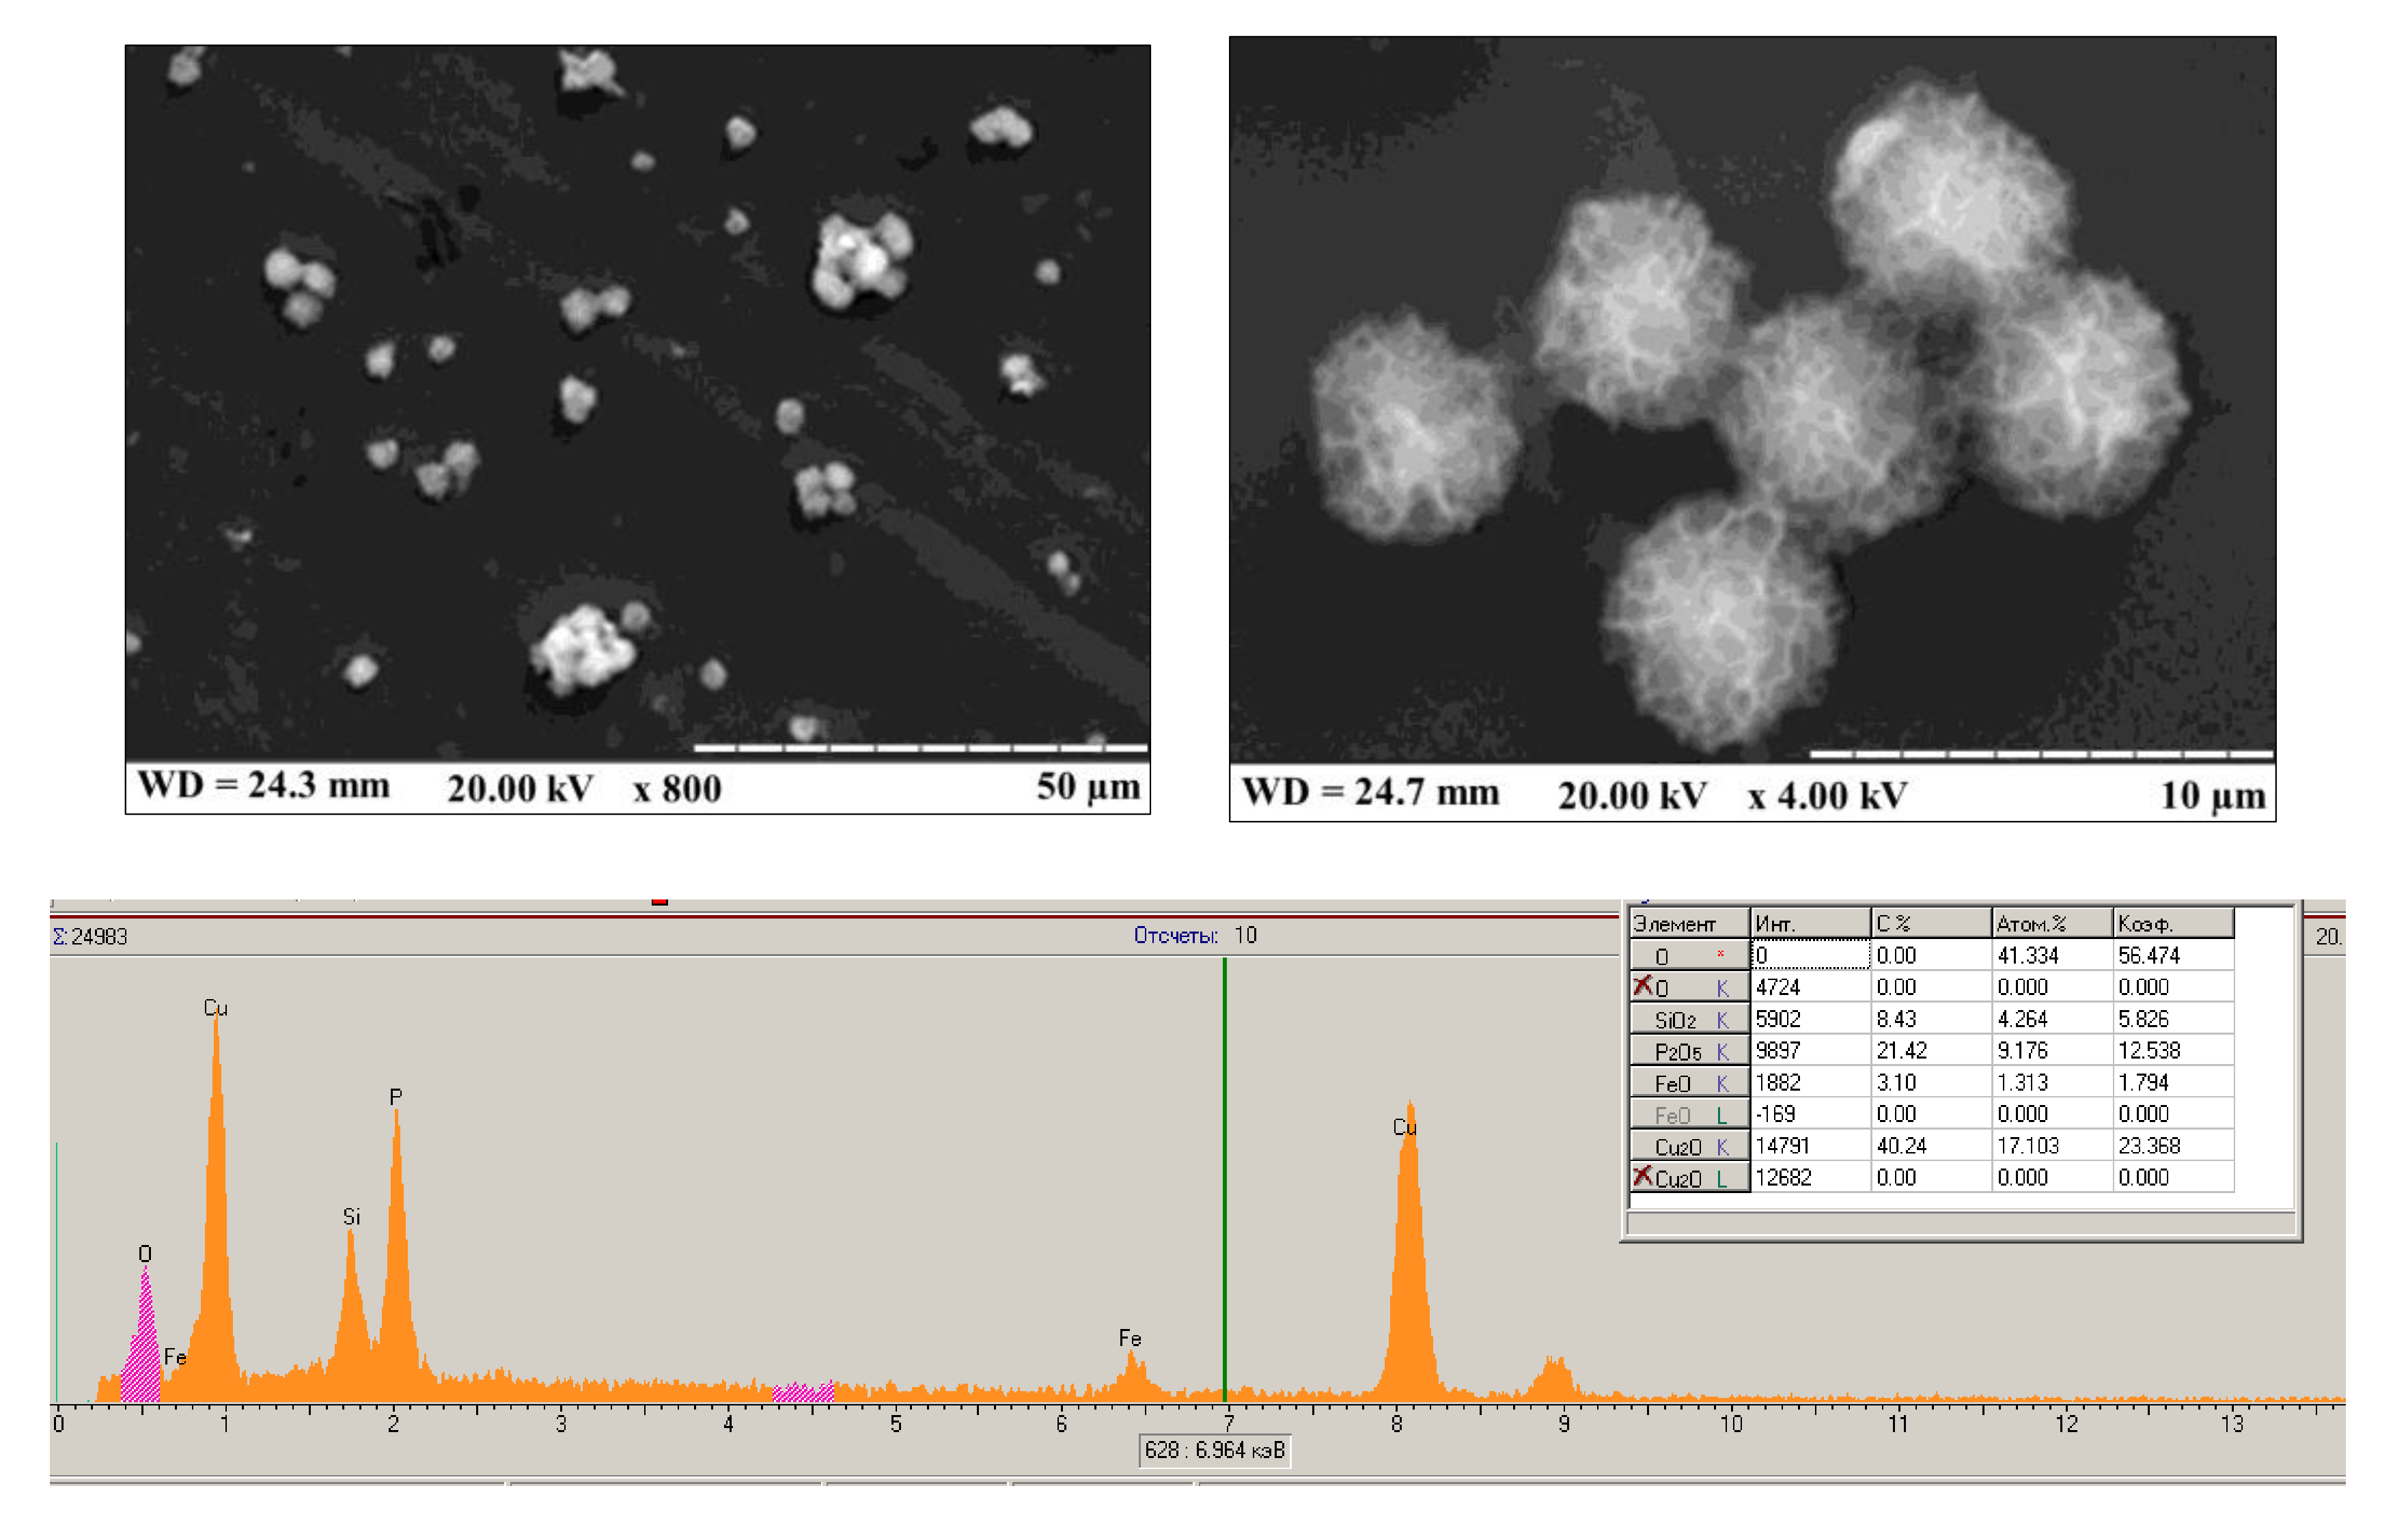
In our previous works, different types of PO-like NZs were described: a chemically synthesized NZs [46] and a ‘green’ synthesized one [47]. The most effective electroactive NZs, nCeCu, and gCuHCF, were chosen for further study. These and the newly obtained promising artificial PO, nNiPtPd, were characterized by Scanning electron microscopy (SEM) coupled with X-ray microanalysis (SEM-XRM) and were used here as potential platforms for construction of Arg-sensitive ArgO-based ABSs. SEM provided information on the size, distribution, and shape of the tested sample. Figure A1, Figure A2 and Figure A3 present the overall morphology of the formed hybrid particles, namely, nCeCu, nNiPtPd, and gCuHCF, respectively. The XRM images of the synthesized NZs showed the characteristic peaks for metals of the composites.
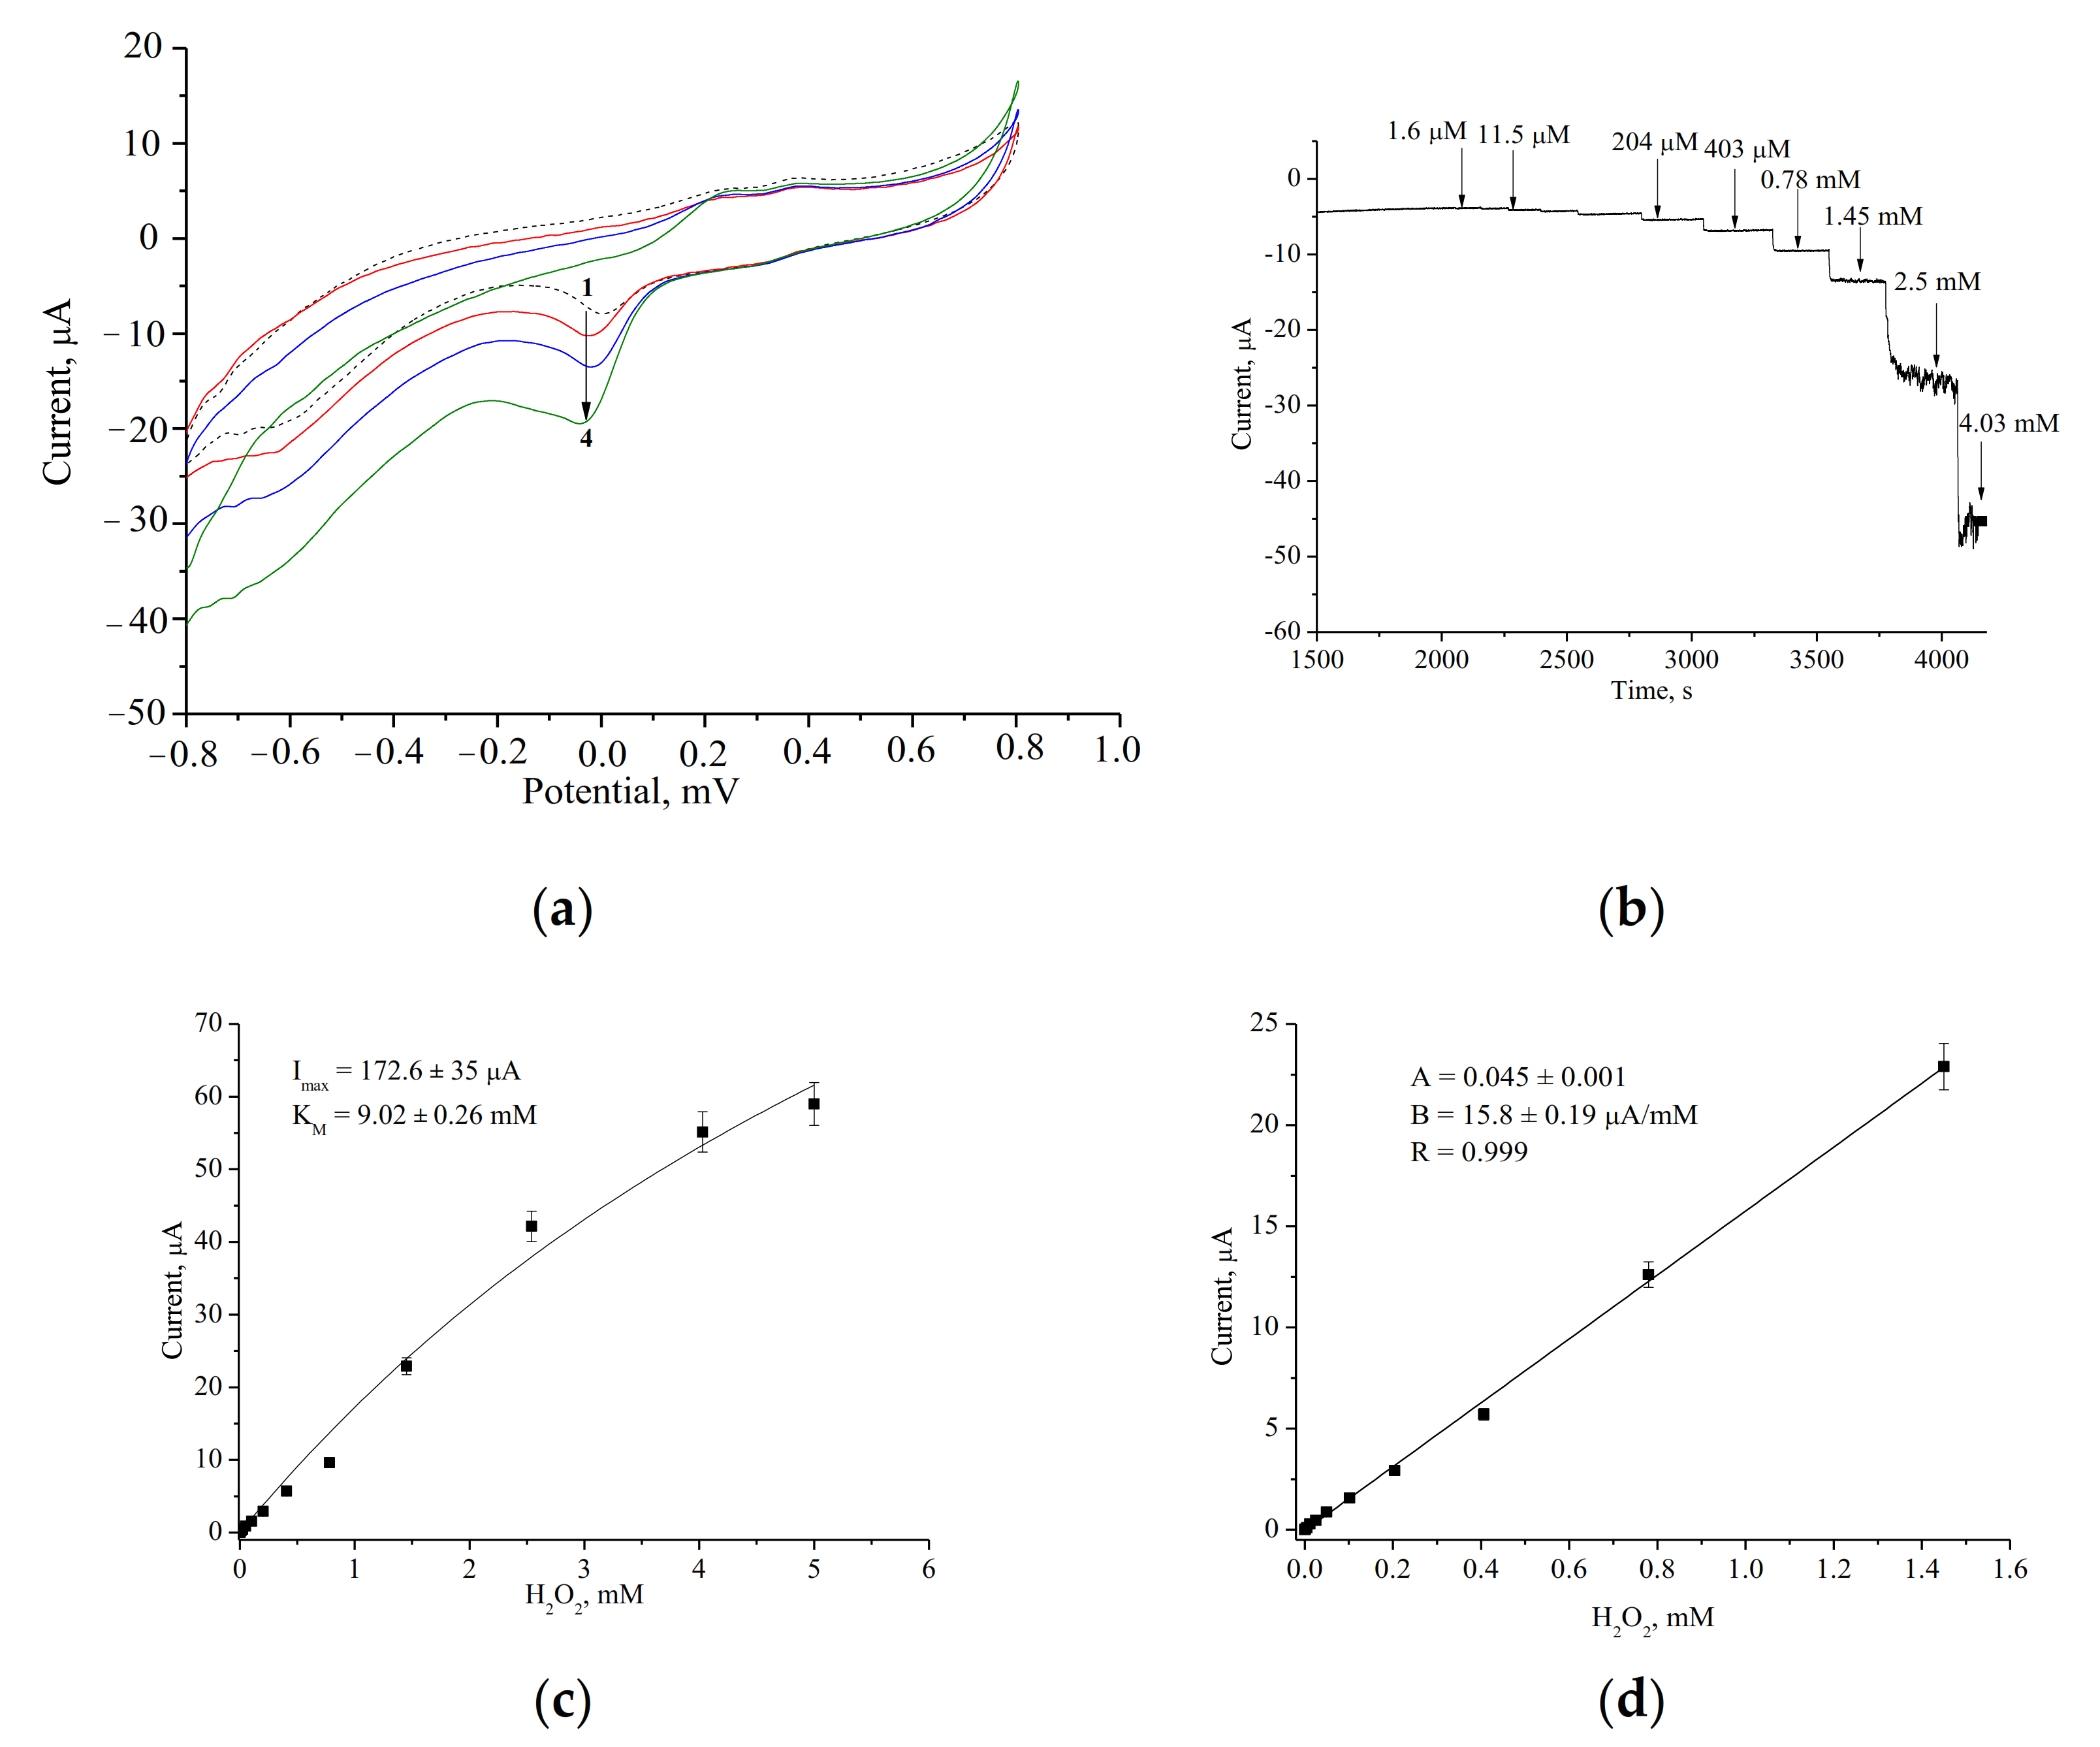
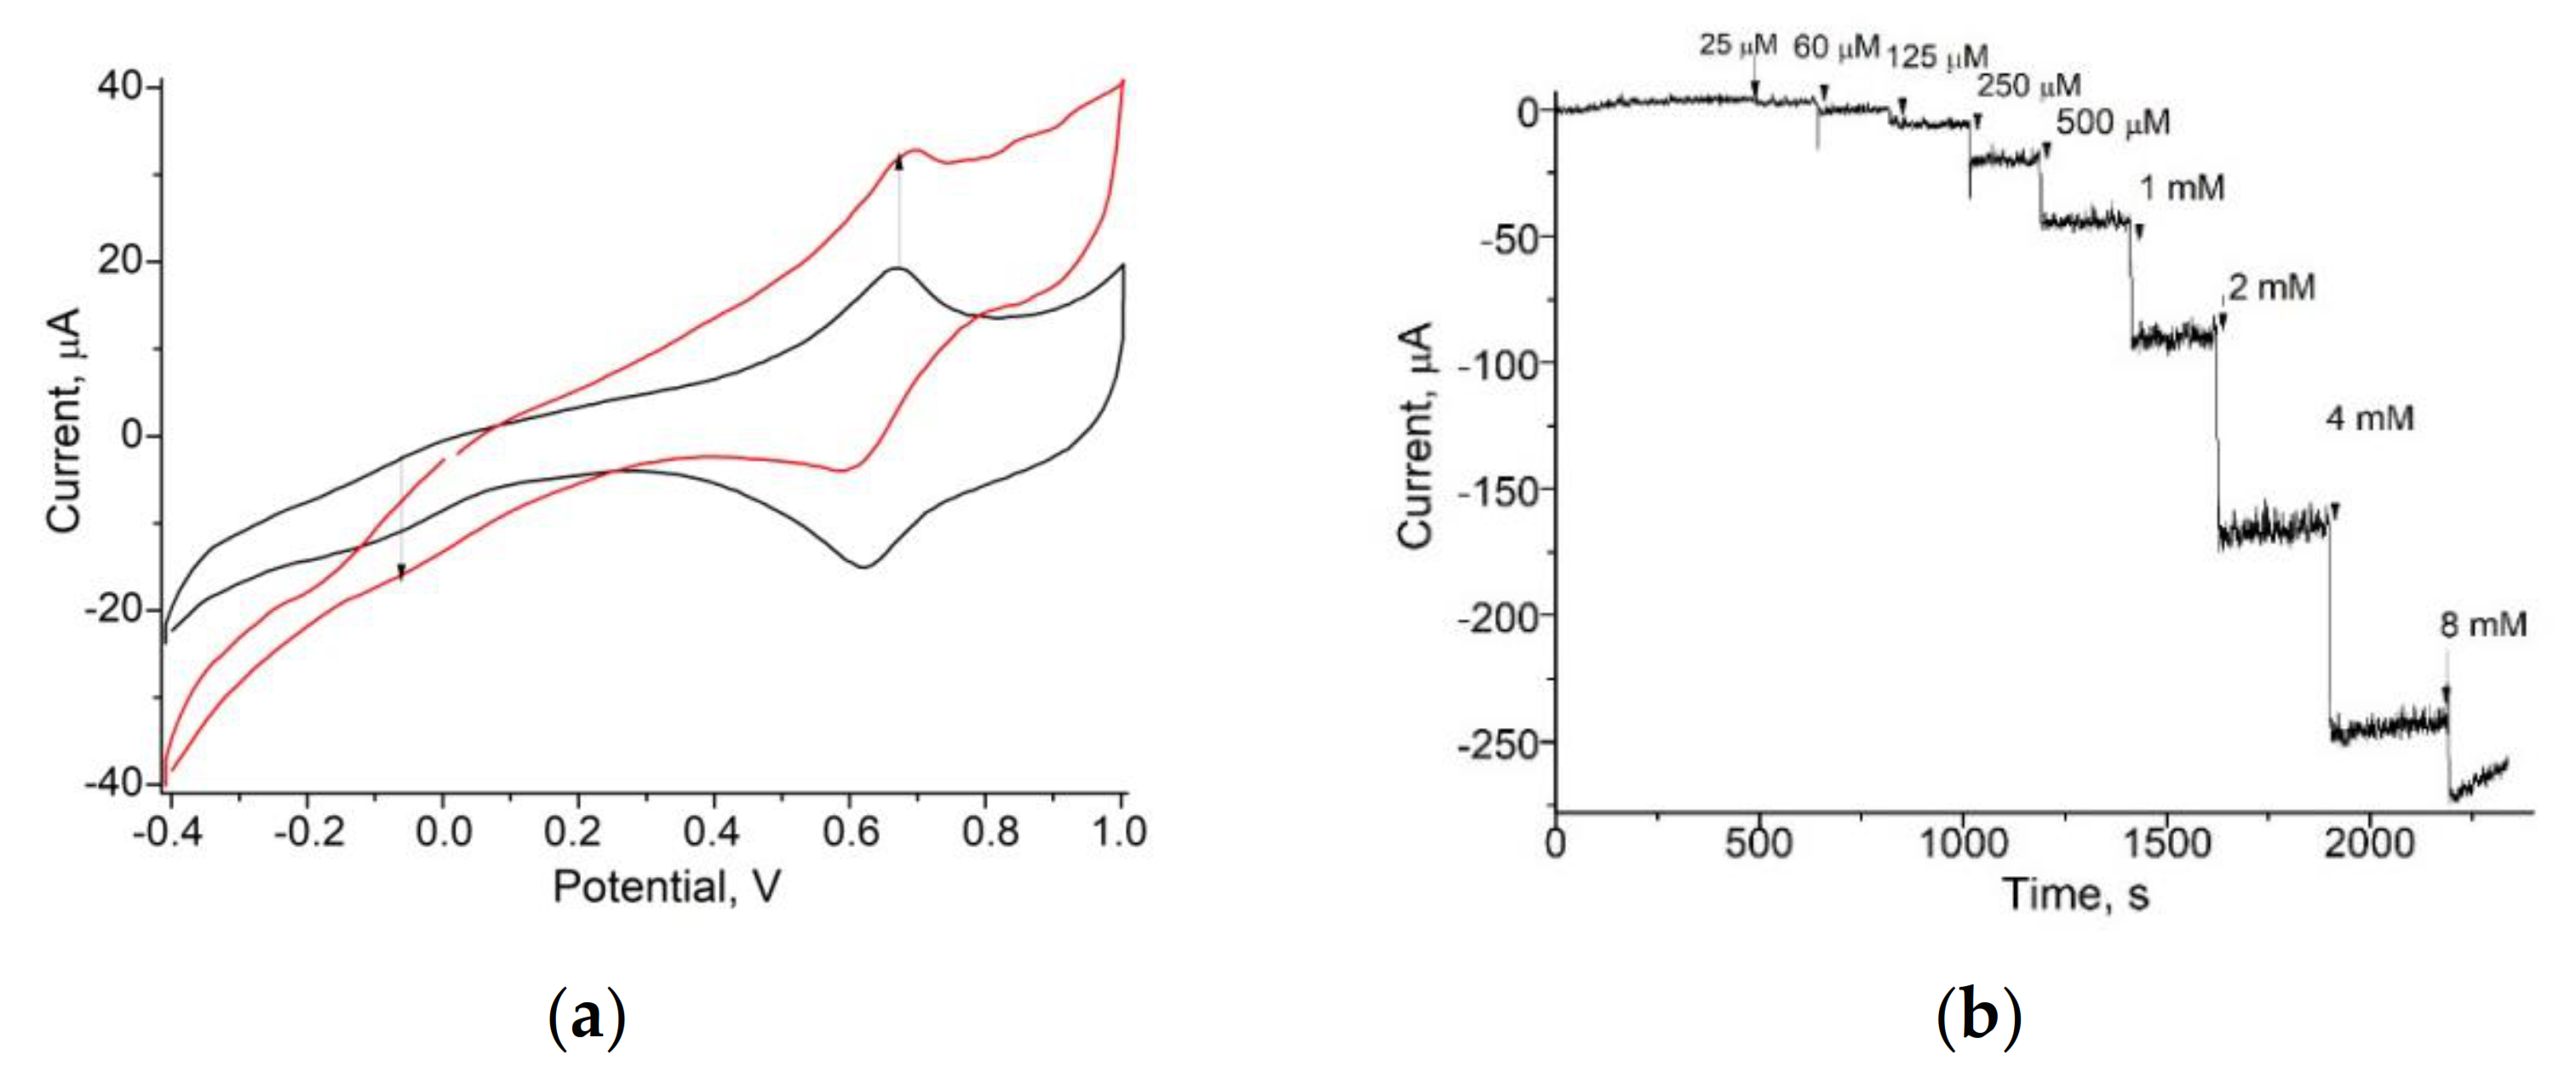
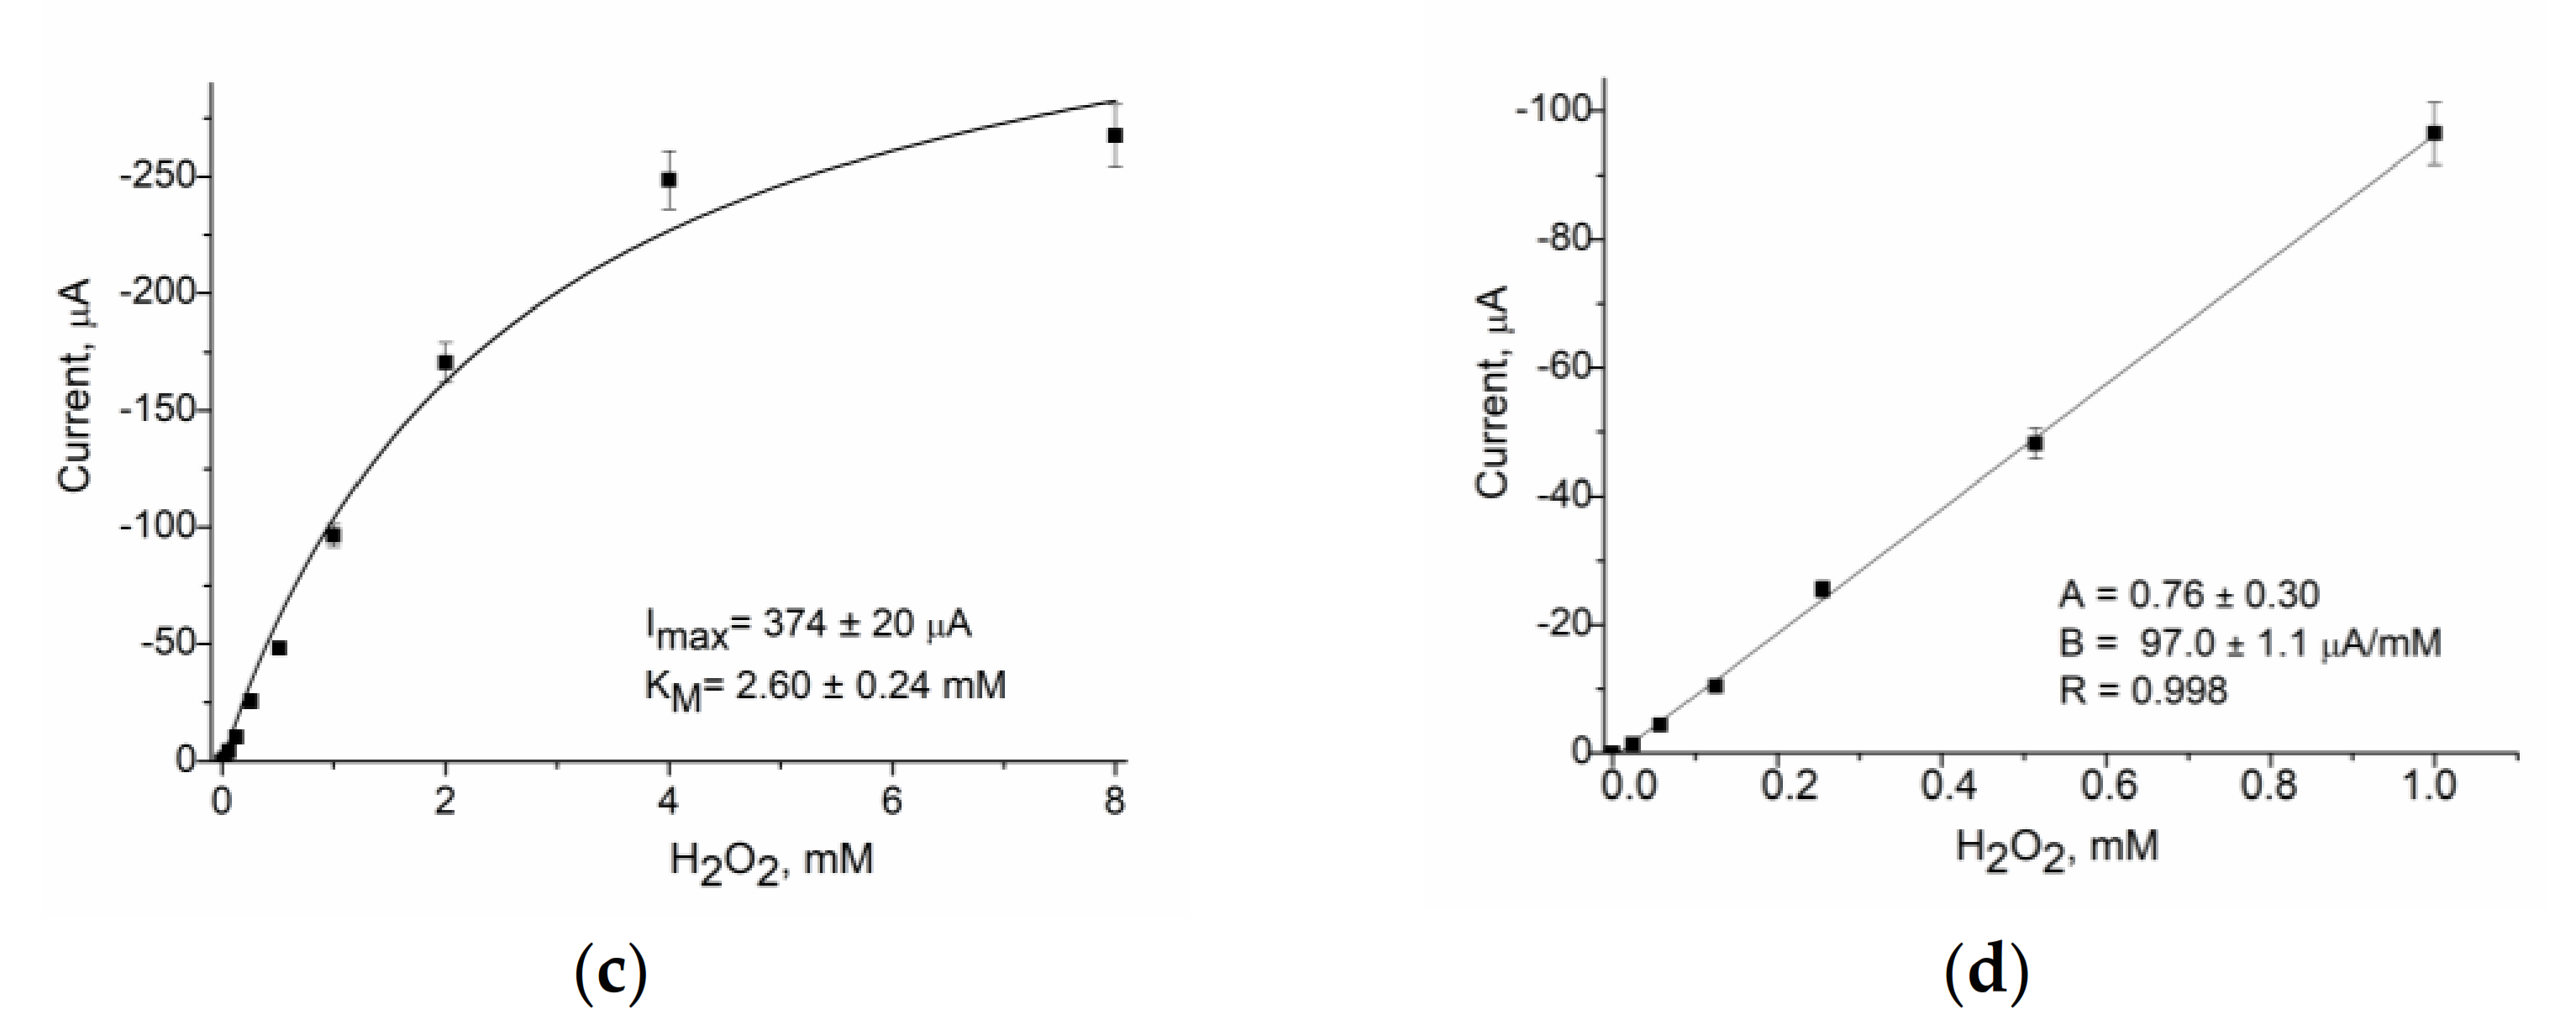
The amperometric characteristics of the nCeCu/GE and nNiPtPd/GE as effective chemosensors for H2O2 determination were studied (Figure 1 and Figure 2, respectively). The cyclic voltammograms (CV) for the nCeCu/GE (Figure 1a) and for the nNiPtPd/GE (Figure 2a) demonstrated that cathodic reduction peaks contributed from H2O2 decomposition arose at potentials of approximately −50 mV and −200 mV, respectively (vs. Ag/AgCl). The chronamperometric dependences and calibration graphs for H2O2 determination are shown in Figure 1 and Figure 2b–d, respectively. As a control, unmodified GE was tested, and no signal was detected upon H2O2 addition (data not shown).
The analytical characteristics of the developed amperometric NZ-based chemosensors for H2O2 are summarized in Table 1. It is worth mentioning that the apparent value of the Michaelis–Menten constant (KMapp) represents the analyte concentration yielding an amperometric response equal to half of its maximum value (Imax). Sensitivity of an amperometric electrode is usually calculated from the linearity graph as a ratio of slope (B) to the active surface area of the working electrode. Sensitivity data are expressed in standard SI units, A·M−1·m−2. This parameter, contrary to Imax, does not depend on the electrode area; it characterizes the specific activity of the electrode. The limit of detection (LOD) of a (bio)sensor is the triplicated standard deviation value of blank samples divided by the slope of the calibration graph.
Thus, our results demonstrated that the synthesized PO-like NZs which have excellent sensitivities (nNiPtPd and nCeCu) and wide linear ranges for H2O2 detection may be promising artificial POs for the construction of oxidase-based ABSs.

3.2. Evaluation and Optimization of the Arg-Sensitive Bioelectrodes

The aim of our work was to construct ArgO-based ABSs for Arg determination using NZs as PO-mimetics. To form an enzymatic layer of the bio-electrode, NZs were coupled with ArgO on a GE and covered with Nafion, as described in the experimental part (see Section 2.5.2). The general principle of Arg assay by the developed ABSs is based on the detection of H2O2 generated as a result of Arg hydrolysis under ArgO catalysis (Scheme 1).
The efficiency of freely defusing electron transfers from the oxidized ArgO to the electrode via PO-like NZs (as mediator) was evaluated using CV (Figure 2a or Figure 3a). As it was shown there, the potential −150 mV vs. Ag/AgCl was chosen as the optimal working potential for ArgO reduction in our system.
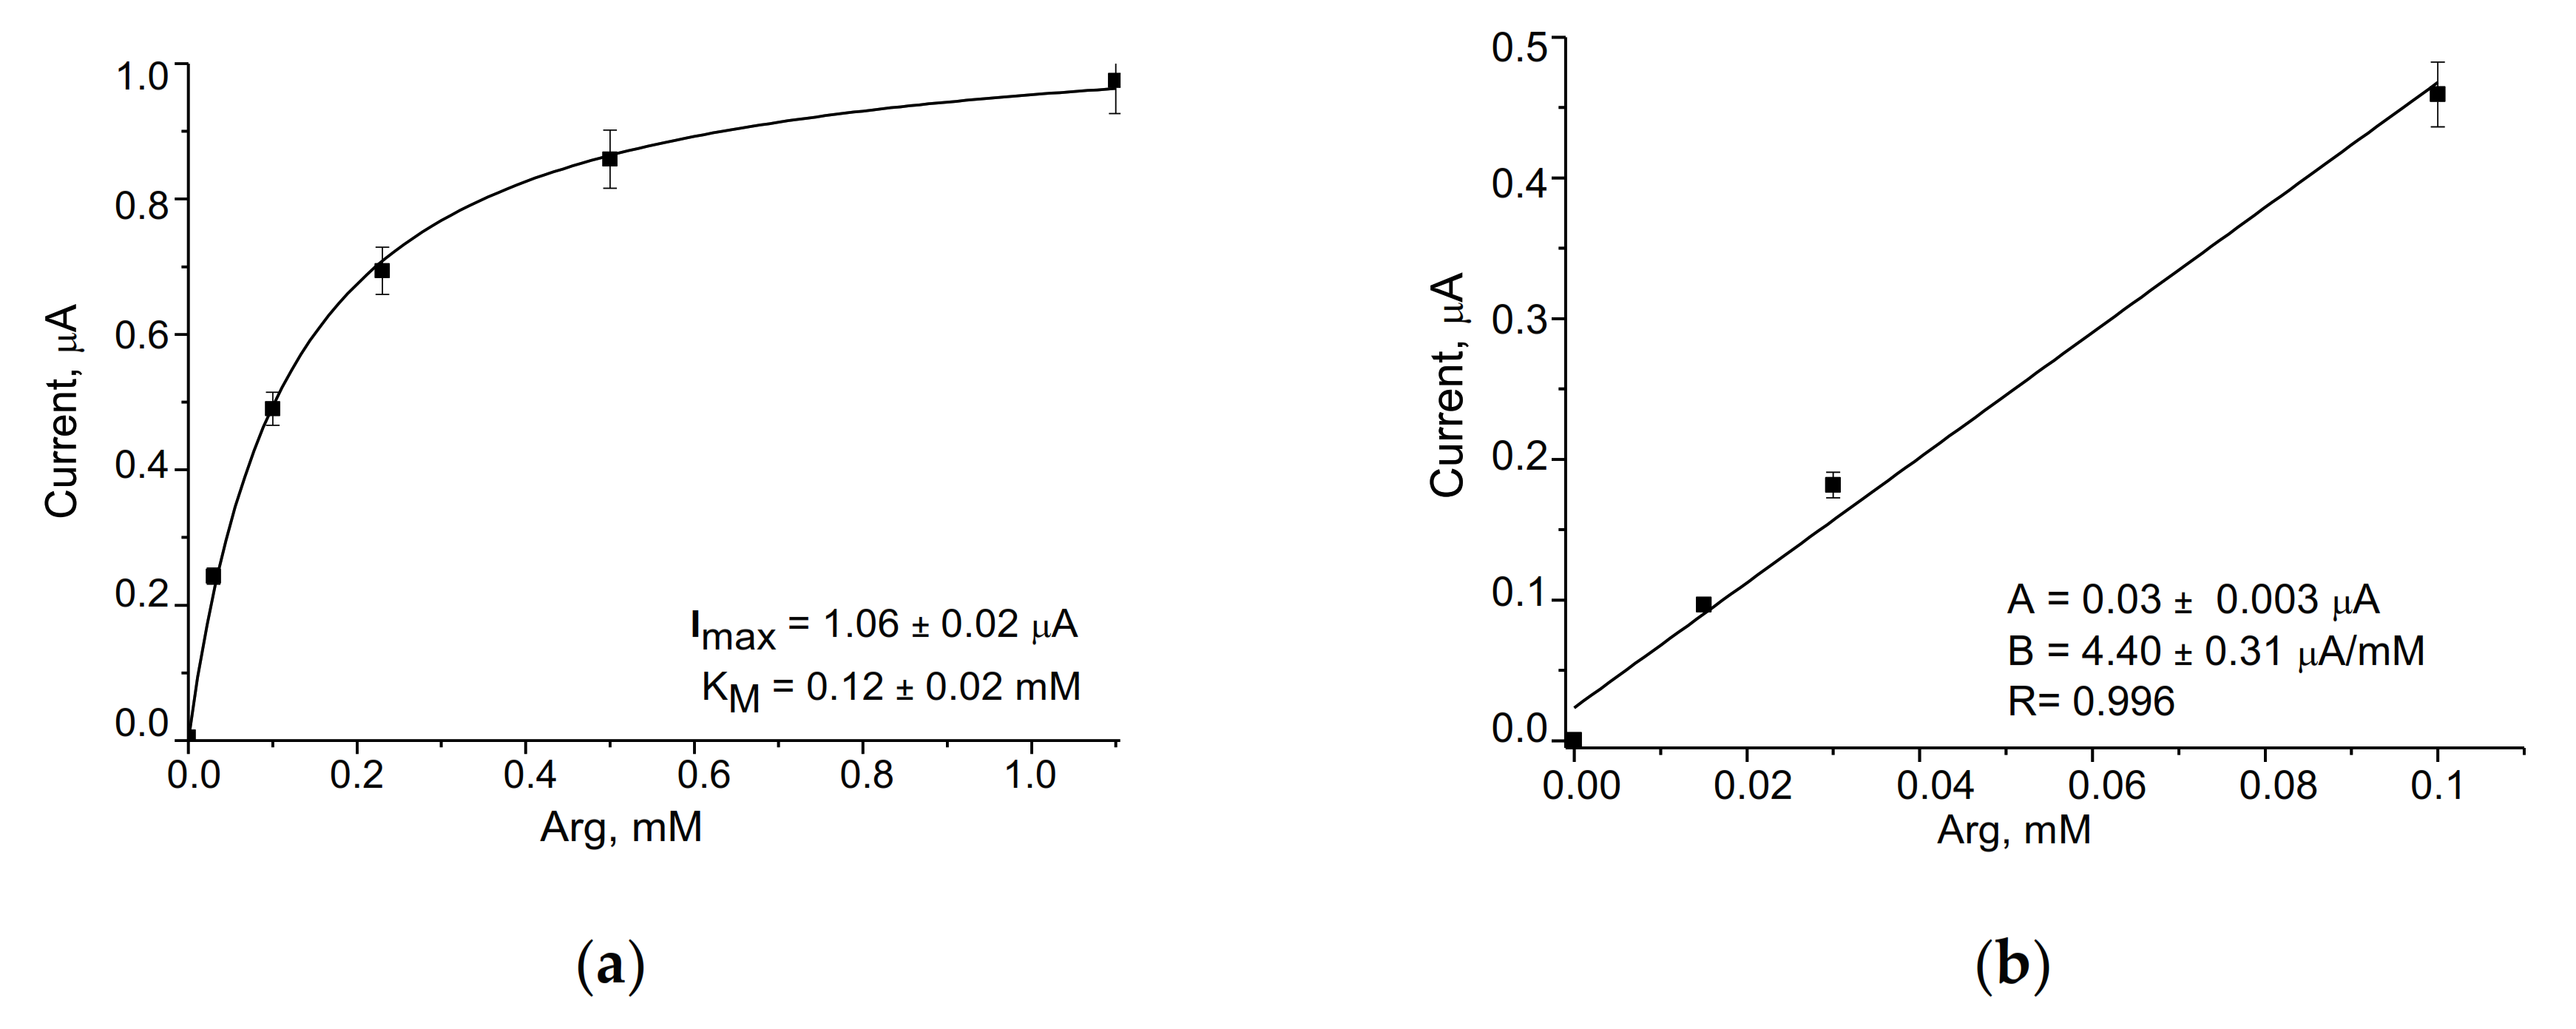
The obtained ABSs (namely, ArgO/nCeCu/GE, ArgO/nNiPtPd/GE, and ArgO/gCuHCF/GE) were used for the investigation of the analytical parameters. Figure 3, Figure 4 and Figure 5 demonstrate the amperometric properties of the developed ABSs. Current responses of the ABSs to the stepwise addition of a standard Arg solution were tested.
The prepared ABSs in this research, based on ArgO and NZs, demonstrated several advantages compared to the previously reported ones (Table 2). Our ABSs are highly selective, rapid, extremely sensitive, easy to use, reliable and portable. Additionally, the developed ABSs are cost-effective because they require only one enzyme (ArgO) and rather inexpensive functional nanomaterials as mimetics of the costly enzyme (PO).
The values of KMapp for Arg estimated with ArgO/nCeCu/GE and ArgO/nNiPtPd/GE are 0.32 ± 0.05 mM and 0.35 ± 0.03 mM, respectively. These values are practically identical with that for ADI in solution (0.35 mM) [28].
The application of NZs in a bioselective layer has a positive impact on the ABSs properties, due to their lower LODs for Arg determination and their high sensitivities.
The constructed ArgO-based biosensors demonstrate slower amperometric responses (up to 50–60 s) in comparison with the previously reported by us biosensors on Arg [21,26]. The arginase/urease/PANi/Pt- and ADI/PANi/Nafion/Pt-SPE-based ABSs demonstrated the response times 10 s [21] and 15 s [26], respectively. This phenomenon may be explained by different contents of enzymes in sensing films as well as by different origins and areas of working electrodes. In our present work, only (3–7) mU ArgO were contained in the biorecognition film on the surface of each ArgO/NZ-modified electrodes. Previously, ADI was immobilized in PANi/Nafion film on the surface of Pt-SPE at much higher amount (540 mU) [26].
The stabilities of the developed ArgO-based ABSs were explored by monitoring their responses to the injection of a 0.2 mM Arg standard solution over a period of seven days. The ArgO/nCeCu/GE and ArgO/nNiPtPd/GE preserved around 50% stability after five days of storage, and likewise the ArgO/gCuHCF/GE—after three days. Contrary, the reported ADI/PANi/Nafion/Pt-SPE-based biosensor was very stable. It kept more than 90% stability after 35 days of storage [26]. This phenomenon may be explained by several reasons: (1) Highly purified recombinant enzyme ADI with the high specific activity was used for construction of the ADI-based ABS, whereas in this work, we used only partially purified ArgO; (2) ADI in the biosensing layer was stabilized with BSA, but in the present work ArgO was not stabilized additionally; (3) Proteins ADI and BSA in the biosensing layer were covalently immobilized on PANi/Nafion by cross-linking using glutaraldehyde. In the present work, ArgO was immobilized on the surface of a NZ-modified electrode by physical adsorption and covered by Nafion.
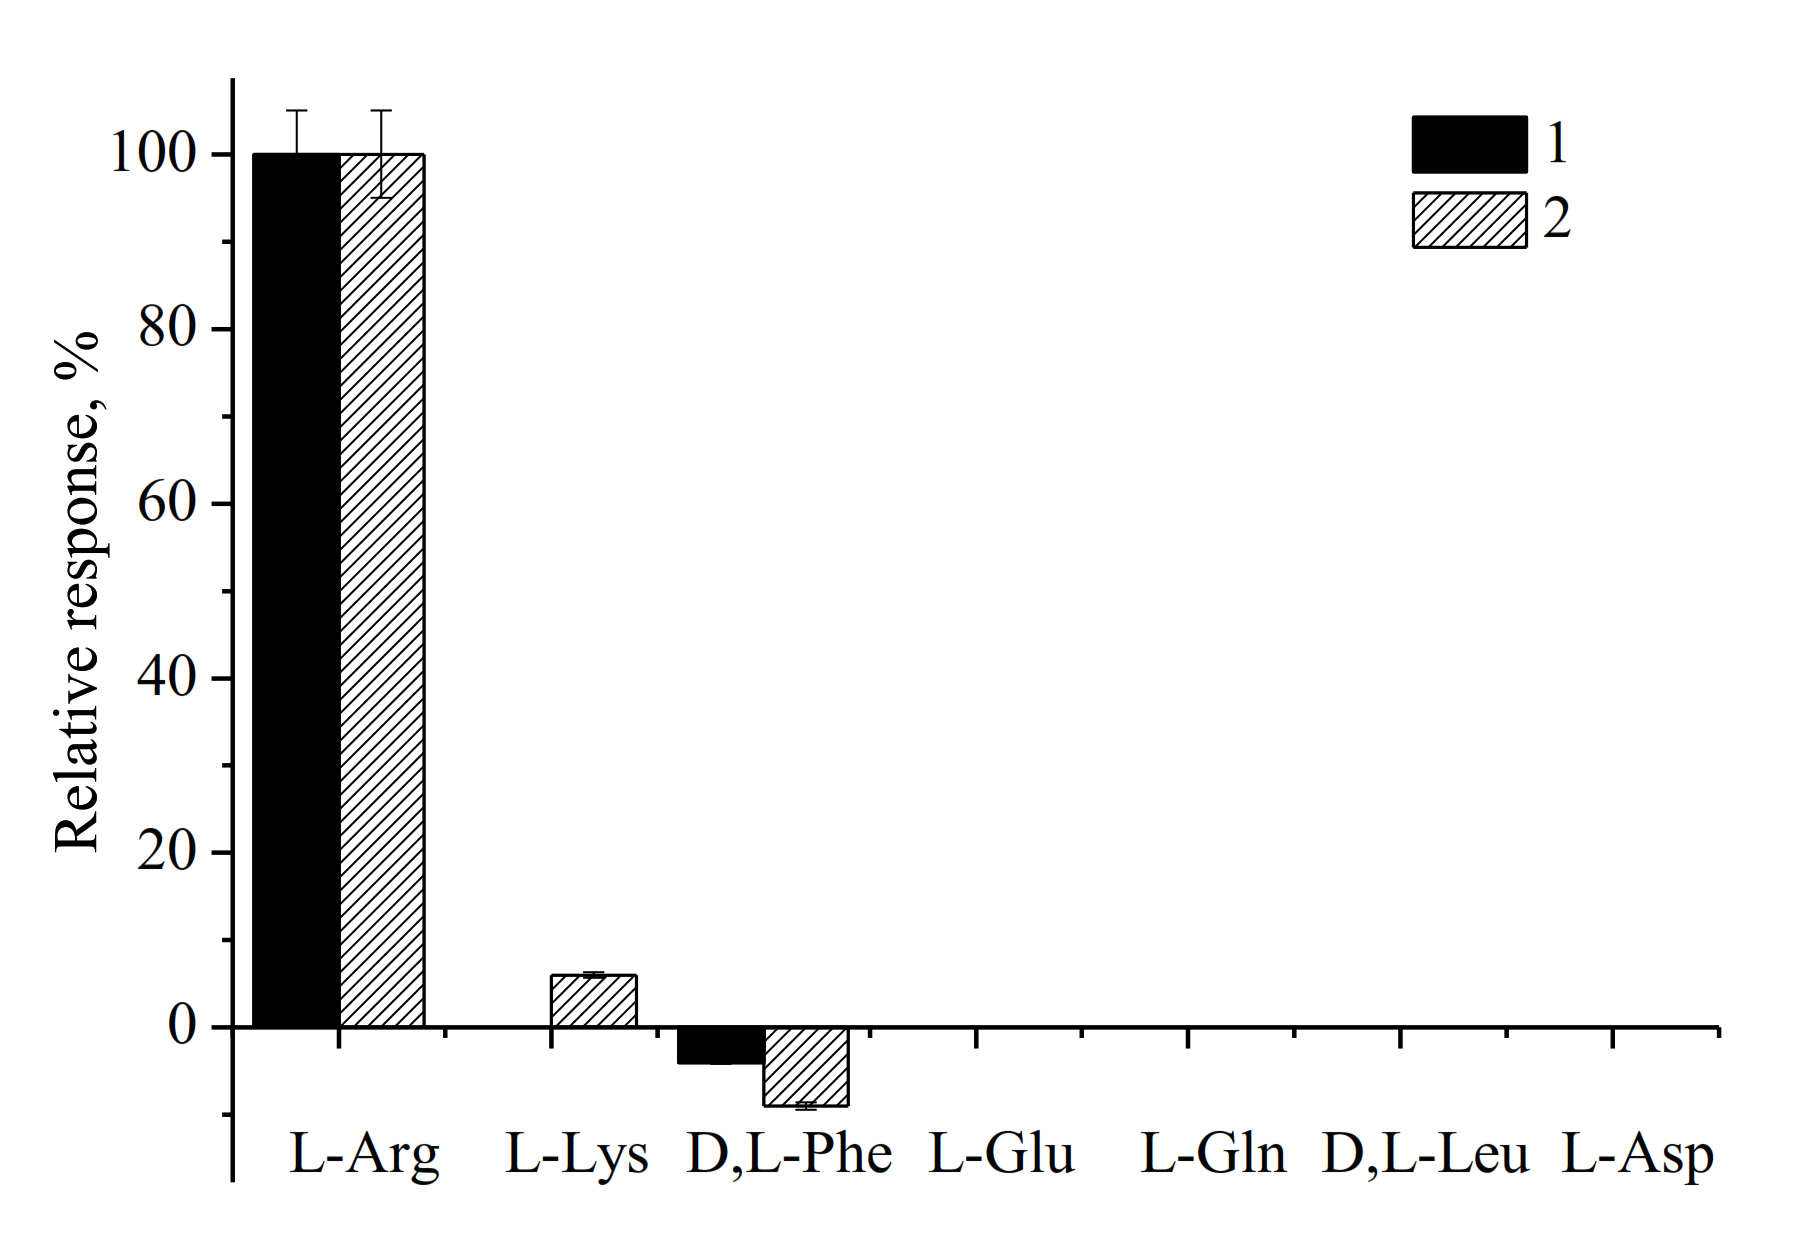
The selectivities of the proposed ArgO/NZ-based ABSs to the target analyte (Arg) are of great importance, especially for analysis of real samples of beverages. The selectivity of the constructed ArgO/nCeCu/GE was estimated in relative units (%) as a ratio of the detected signal to the value of the highest current response (Figure A4): no signals were observed for most of the tested amino acids (L-Glu, L-Gln, D, L-Leu, L-Asp). Only L-Lys and D,L-Phe induced a nonsignificant (less than 10%) analytical signal.

3.3. Assay of Arg in Real Samples

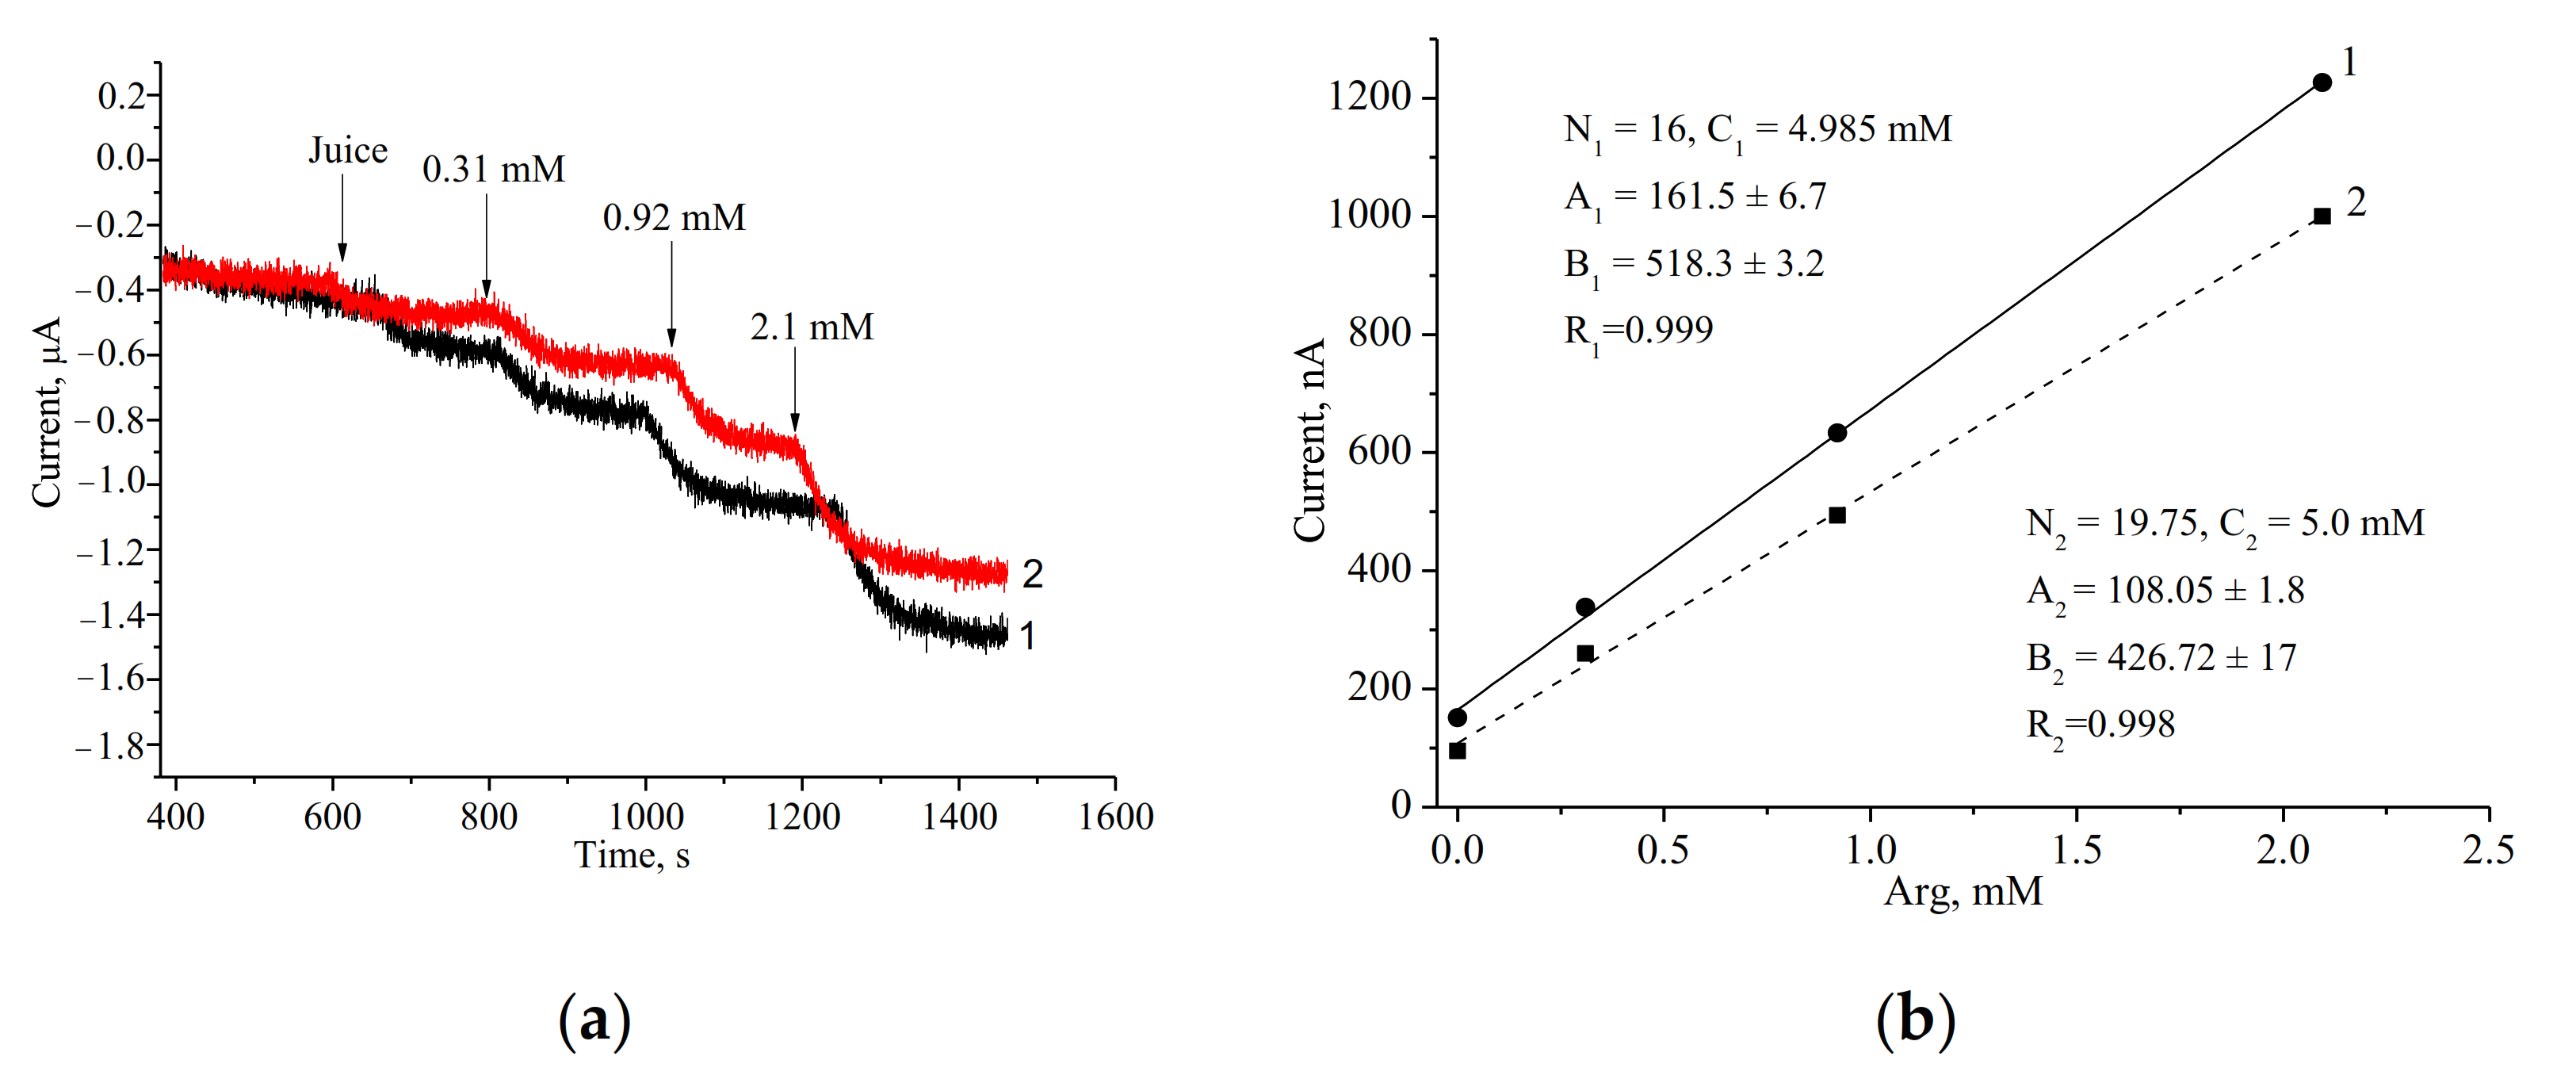
In order to demonstrate the applicability of the constructed ArgO-based ABSs for testing real products containing Arg, selected samples of fruit juices and wine, as well as the pharmaceutical preparation “Tivortin”, were analyzed. The estimation of Arg concentration in the sample of fresh-prepared apple juice is presented in Figure 6. The Arg analysis was performed using the graphical method known as “the standard addition test” (SAT) with different dilutions of the tested sample. The SAT is a quantitative analysis approach often used in analytical chemistry when a standard solution of the target analyte (in this case, Arg) is added directly to the aliquots of the analyzed sample. The SAT method is used in situations where sample components also contribute to the analytical signal [10]. Other samples of juices and wine were analyzed by the developed ABSs in the same manner; the estimated Arg contents in the tested samples are summarized in Table 3.
The Arg determination in the pharmaceutical product ‘‘Tivortin’’ using two ABSs are shown in Figure 7 and in Table 3.
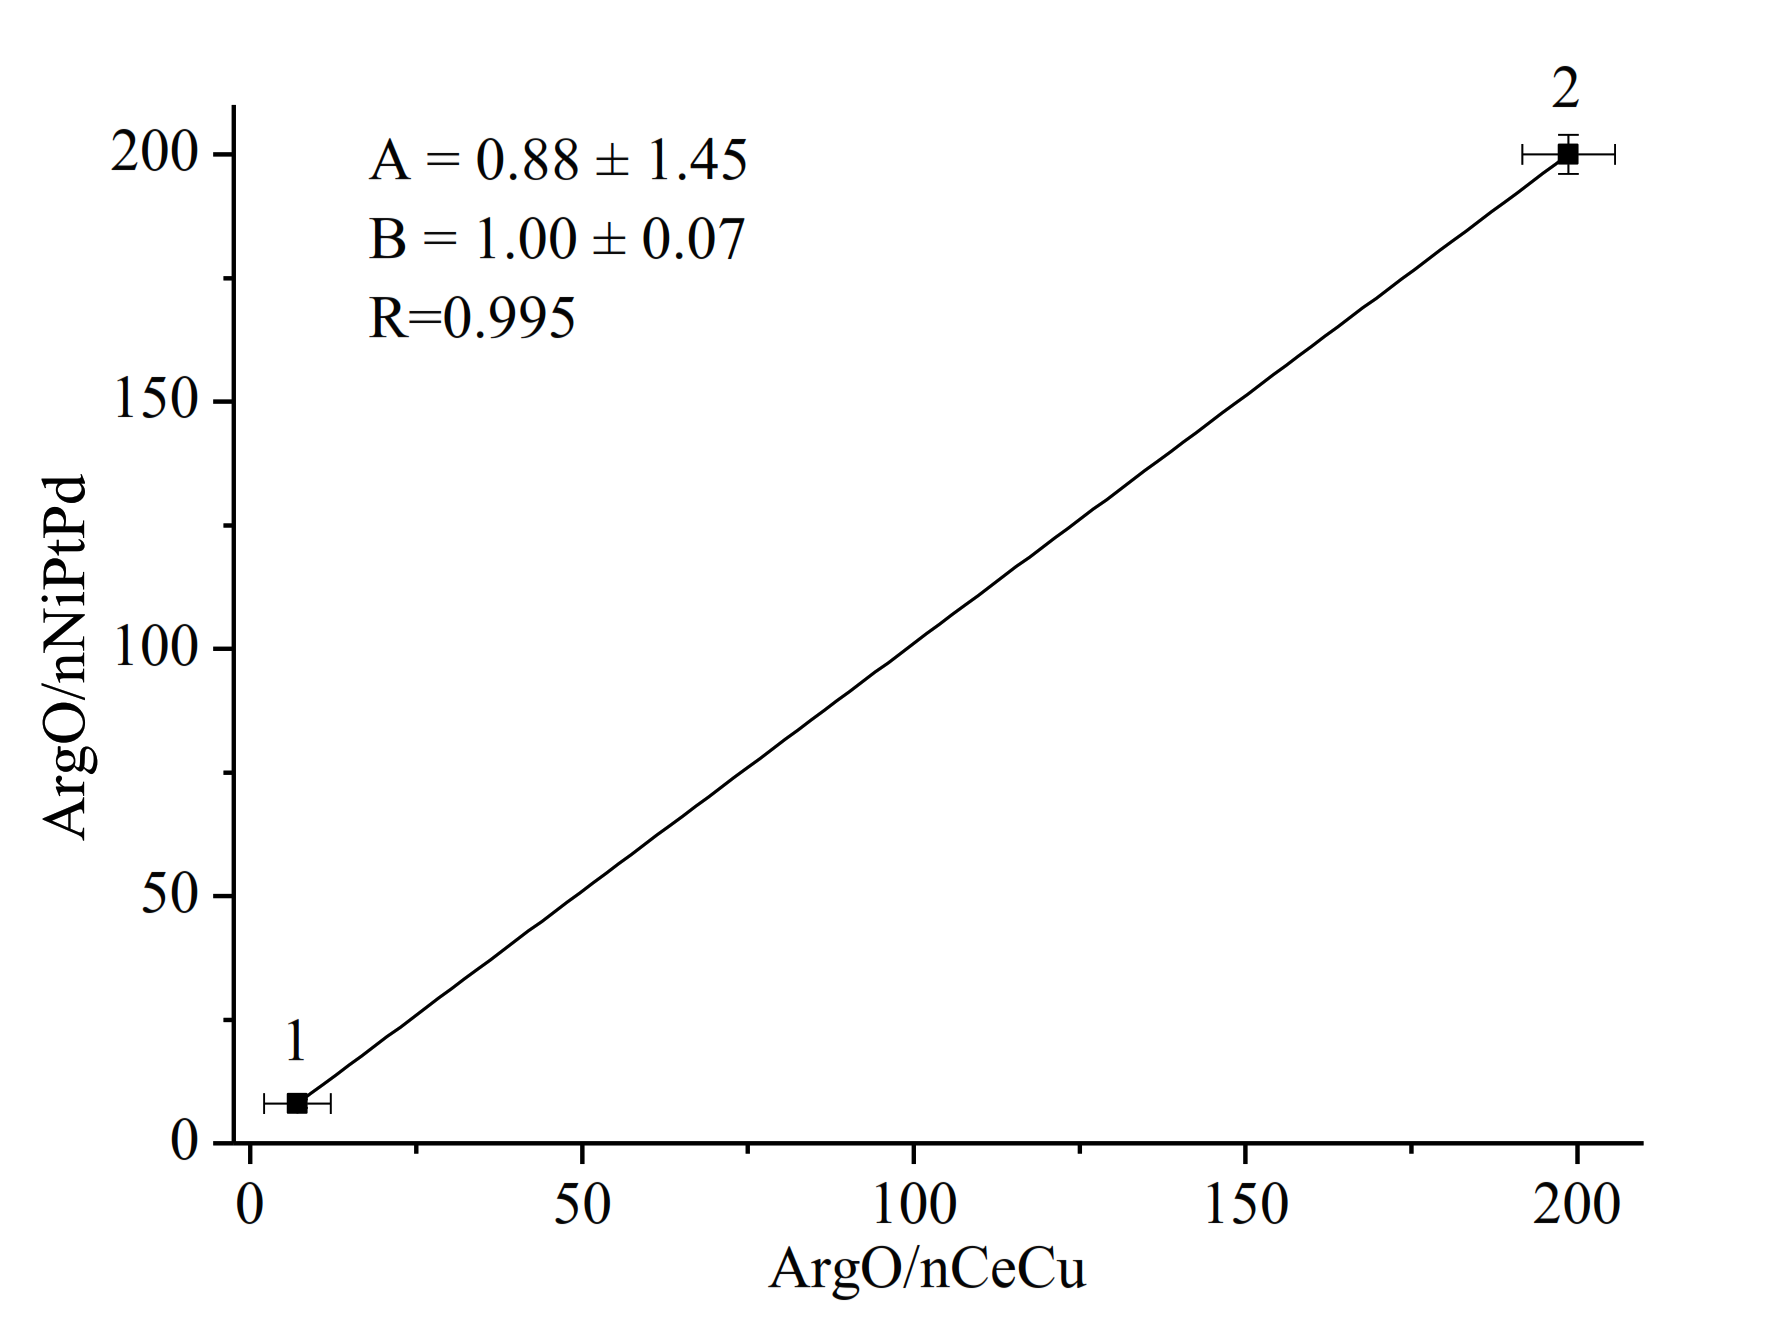
The reproducibility of the proposed analytical methods is satisfactory: the coefficients of variation (CV) are less than 5%. It is worthwhile mentioning that the detected Arg contents in the juices and wine were close to those published by other authors (0–11 mM) [48,49,50]. Figure A5 shows that the Arg content values in the pharmaceutical product “Tivortin” and the apple-pear juice, estimated by both ABSs (ArgO/nCeCu/GE and ArgO/nNiPtPd/GE), were strongly correlated with each other (R = 0.995). Additionally, only a slight difference (less than 1%) was observed for “Tivortin” between the experimentally determined content of Arg (199.1 mM) and its value declared by the producer (199.8 mM).
These results indicate that the developed mono-enzyme ABSs (namely, ArgO/nCeCu/GE and ArgO/nNiPtPd/GE) can be utilized for a fast and simple assay of Arg in pharmaceutic preparations.

4. Conclusions

Novel L-arginine-selective amperometric biosensors (ABSs) based on mushroom-derived L-arginine oxidase and metal-based nanozymes as ‘artificial peroxidases’ are described. Substitution of PO with PO-like mimetics in a biosensing layer improved the electrochemical properties of the electrodes and the detection of Arg in wider ranges of linear responses.
The nCeCu, nNiPtPd, and gCuHCF, as the most effective PO mimetics, can be used as H2O2-sensitive platforms for the development of ArgO-based ABSs. These ABSs exhibit very high sensitivities and broad linear ranges to Arg when tested on real samples of pharmaceuticals and juices.
Thus, the developed mono-enzyme nanozymes-based ABSs may be used in analytical practice for fast and simple assay of Arg in beverages, pharmaceutic preparations, and other goods. An extremely high sensitivity of the proposed ArgO/nCeCu-based ABS makes it promising in clinical diagnostics for Arg determination in blood and other biological liquids.

Author Contributions

Conceptualization, G.G.; Methodology, G.G., N.S. and O.D.; Investigation, N.S., O.D. and L.D.; Resources, M.G. and M.N.; Data curation, G.G. and M.G.; Writing—original draft preparation, N.S., O.D. and G.G.; Writing—review and editing, G.G., M.G. and M.N.; Supervision, G.G. and M.G.; Project administration, G.G.; Funding acquisition, M.G. and M.N. All authors have read and agreed to the published version of the manuscript.

Funding

This research was partially funded by NAS of Ukraine (The program “Smart sensor devices of a new generation based on modern materials and technologies”; grant “New dual casein kinase 2 inhibitors and histone deacetylase for targeted tumor chemotherapy” for research laboratories/groups of young scientists in priority areas of science and technology in 2021–2022), by National Research Foundation of Ukraine (project 2020.02/0100 “Development of new nanozymes as catalytic elements for enzymatic kits and chemo/biosensors”), by the Ministry of Education and Science of Ukraine (Ukrainian-Lithuanian R&D, project 0120U103398), and by the Research Authority of the Ariel University, Israel.

Institutional Review Board Statement

Not applicable.

Informed Consent Statement

Not applicable.

Data Availability Statement

The data are presented in this study, in Appendix A and are available on request from the corresponding authors.

Acknowledgments

We acknowledge the engineer Roman Ya. Serkiz for his help with SEM-XRM experiments (Institute of Cell Biology, Lviv, Ukraine).

Conflicts of Interest

The authors declare no conflict of interest.

Appendix A

Appendix A presents the overall morphology of the hybrid particles nCeCu, nNiPtPd, and gCuHCF (Figure A1, Figure A2 and Figure A3 respectively), data on the selectivity of the constructed ArgO/nCeCu/GE (Figure A4), data on Arg content in the pharmaceutical product “Tivortin” and the apple-pear juice (Figure A5), and the procedure of ArgO obtaining (Scheme A1).
Figure A1. Characteristics of the nCeCu: EM images at different magnifications (top) and their X-ray spectral characteristics (bottom).
Applsci 11 07024 g0a1
Figure A2. Characteristics of the nNiPtPd: SEM images at different magnifications (top) and their X-ray spectral characteristics (bottom).
Applsci 11 07024 g0a2
Figure A3. Characteristics of the gCuHCF: SEM images at different magnifications (top) and their X-ray spectral characteristics (bottom).
Applsci 11 07024 g0a3
Figure A4. Selectivity for ArgO/nCeCu/GE. Selectivity test was performed with 5 mM (1) and 10 mM (2) solutions of aminoacids under applied potential of –150 mV at 22 ∘C. The highest current response on Arg was chosen as 100%.
Applsci 11 07024 g0a4
Figure A5. Correlation between the results of Arg determination in the real samples by two bioelectrodes: ArgO/nCeCu/GE and ArgO/nNiPtPd/GE. The tested samples: commercial juice “Galicia” apple-pear (1) and Tivortin (2).
Applsci 11 07024 g0a5
Scheme A1. Isolation and purification of ArgO. PB—phosphate buffer, SA—specific activity, mU/mg of protein, PF—purification factor.
Applsci 11 07024 sch0a1

References

  1. Wu, G.B.; F, W.; Davis, T.A.; Kim, S.W.; Li, P.; Marc Rhoads, J.; Carey Satterfield, M.; Smith, S.B.; Spencer, T.E.; Yin, Y. Arginine metabolism and nutrition in growth, health and disease. Amino Acids 2009, 37, 153–168. [Google Scholar] [CrossRef] [PubMed] [Green Version]
  2. Huang, J.; Ladeiras, D.; Yu, Y.; Ming, X.F.; Yang, Z. Detrimental Effects of Chronic L-Arginine Rich Food on Aging Kidney. Front. Pharmacol. 2021, 11, 582155. [Google Scholar] [CrossRef] [PubMed]
  3. McNeal, C.J.; Meininger, C.J.; Reddy, D.; Wilborn, C.D.; Wu, G. Safety and effectiveness of arginine in adults. J. Nutr. 2016, 146, 2587S–2593S. [Google Scholar] [CrossRef] [PubMed]
  4. Bednarz-Misa, I.; Fleszar, M.G.; Zawadzki, M.; Kapturkiewicz, B.; Kubiak, A.; Neubauer, K.; Witkiewicz, W.; Krzystek-Korpacka, M. L-Arginine/NO pathway metabolites in colorectal cancer: Relevance as disease biomarkers and predictors of adverse clinical outcomes following surgery. J. Clin. Med. 2020, 9, 1782. [Google Scholar] [CrossRef]
  5. Mirmiran, P.; Bahadoran, Z.; Gaeini, Z.; Azizi, F. Habitual intake of dietary L-arginine in relation to risk of type 2 diabetes: A prospective study. BMC Endocr. Disord. 2021, 21, 113. [Google Scholar] [CrossRef]
  6. Grimes, J.M.; Khan, S.; Badeaux, M.; Rao, R.M.; Rowlinson, S.W.; Carvajal, R.D. Arginine depletion as a therapeutic approach for patients with COVID-19. Int. J. Infect. Dis. 2021, 102, 566–570. [Google Scholar] [CrossRef]
  7. Stasyuk, N.; Gayda, G.; Zakalskiy, A.; Zakalska, O.; Fayura, L.; Vovk, O.; Stasyk, O.; Sibirny, A.; Gonchar, M. Recombinant Forms of Arginase and Arginine Deiminase as Catalytic Components of Argitest Enzymatic Kit. Sci. Innov. 2017, 13, 56–63. [Google Scholar] [CrossRef]
  8. He, Y.; Zhou, L.; Deng, L.; Feng, Z.; Cao, Z.; Yin, Y. An electrochemical impedimetric sensing platform based on a peptide aptamer identified by high-throughput molecular docking for sensitive L-arginine detection. Bioelectrochemistry 2021, 137, 107634. [Google Scholar] [CrossRef]
  9. Singh, A.K.; Sharma, R.; Singh, M.; Verma, N. Electrochemical determination of L-arginine in leukemic blood samples based on a polyaniline-multiwalled carbon nanotube-magnetite nanocomposite film modified glassy carbon electrode. Instrum. Sci. Technol. 2020, 48, 400–416. [Google Scholar] [CrossRef]
  10. Stasyuk, N.; Gayda, G.; Fayura, L.; Boretskyy, Y.R.; Gonchar, M.V.; Sibirny, A.A. Novel arginine deiminase-based method to assay L-arginine in beverages. Food Chem. 2016, 201, 320–326. [Google Scholar] [CrossRef]
  11. Stasyuk, N.; Gayda, G.; Yepremyan, H.; Stepien, A.; Gonchar, M. Fluorometric enzymatic assay of L-arginine. Spectrochim. Acta A 2017, 70, 184–190. [Google Scholar] [CrossRef]
  12. Berninger, T.; Bliem, C.; Piccinini, E.; Azzaroni, O.; Knoll, W. Cascading reaction of arginase and urease on a graphene-based FET for ultrasensitive, real-time detection of arginine. Biosens. Bioelectron. 2018, 115, 104–110. [Google Scholar] [CrossRef]
  13. Verma, N.; Singh, A.K.; Singh, M. L-Arginine biosensors: A comprehensive review. Biochem. Biophys. Rep. 2017, 12, 228–239. [Google Scholar] [CrossRef]
  14. Saiapina, O.Y.; Dzyadevych, S.V.; Jaffrezic-Renault, N.; Soldatkin, O.P. Development and optimization of a novel conductometric bi-enzyme biosensor for L-Arginine determination. Talanta 2012, 92, 58–64. [Google Scholar] [CrossRef]
  15. Stasyuk, N.E.; Gaida, G.Z.; Gonchar, M.V. L-arginine assay with the use of arginase I. Appl. Biochem. Microbiol. 2013, 49, 529–534. [Google Scholar] [CrossRef]
  16. Kucherenko, I.S.; Soldatkin, O.O.; Dzyadevych, S.V.; Soldatkin, A.P. Electrochemical biosensors based on multienzyme systems: Main groups, advantages and limitations—A review. Anal. Chim. Acta 2020, 1111, 114–131. [Google Scholar] [CrossRef]
  17. Bollella, P.; Katz, E. Biosensors—Recent Advances and Future Challenges. Sensors 2020, 20, 6645. [Google Scholar] [CrossRef]
  18. Yamamoto, Y.; Senda, M. Amperometric ammonium ion sensor and its application to biosensors. Sens. Actuators B Chem. 1993, 13, 57–60. [Google Scholar] [CrossRef]
  19. Stasyk, O.V.; Boretsky, Y.R.; Gonchar, M.V.; Sibirny, A.A. Recombinant arginine-degrading enzymes in metabolic anticancer therapy and bioanalytics. Cell Biol. Int. 2015, 39, 246–252. [Google Scholar] [CrossRef]
  20. Stasyuk, N.; Smutok, O.; Gayda, G.; Gonchar, M.; Koval’chuk, Y. A new bi-enzyme potentiometric sensor for arginine analysis based on recombinant human arginase I and commercial urease. J. Mater. Sci. Eng. 2011, 1, 819–827. [Google Scholar] [CrossRef] [Green Version]
  21. Stasyuk, N.; Smutok, O.; Gayda, G.; Vus, B.; Koval’chuk, Y.; Gonchar, M. Bi-enzyme L-arginine-selective amperometric biosensor based on ammonium-sensing polyaniline-modified electrode. Biosens. Bioelectron. 2012, 37, 46–52. [Google Scholar] [CrossRef]
  22. Stasyuk, N.Y.; Gayda, G.Z.; Gonchar, M.V. L-arginine-selective microbial amperometric sensor based on recombinant yeast cells over-producing human liver arginase I. Sens. Actuators B Chem. 2014, 204, 515–521. [Google Scholar] [CrossRef]
  23. Soldatkina, O.V.; Soldatkin, O.O.; Velychko, T.P.; Prilipko, V.O.; Kuibida, M.A.; Dzyadevych, S.V. Conductometric biosensor for arginine determination in pharmaceutics. Bioelectrochemistry 2018, 124, 40–46. [Google Scholar] [CrossRef]
  24. Zakalskiy, A.E.; Zakalska, O.M.; Rzhepetskyy, Y.A.; Potocka, N.; Stasyk, O.V.; Horak, D.; Gonchar, M.V. Overexpression of (His)6-tagged human arginase I in Saccharomyces cerevisiae and enzyme purification using metal affinity chromatography. Protein Expr. Purif. 2012, 81, 63–68. [Google Scholar] [CrossRef]
  25. Karkovska, M.I.; Stasyuk, N.Y.; Gayda, G.Z.; Smutok, O.V.; Gonchar, M.V. Nanomaterials in construction of biosensors of biomedical purposes. In Multifunctional Nanomaterials for Biology and Medicine: Molecular Design, Synthesis, and Application; Stoika, R., Ed.; Naukova Dumka: Kyiv, Ukraine, 2017; pp. 165–177. ISBN 978-966-00-1564-7. (In Ukrainian) [Google Scholar]
  26. Zhybak, M.T.; Fayura, L.Y.; Boretsky, Y.R.; Gonchar, M.V.; Sibirny, A.A.; Dempsey, E.; Turner, A.; Korpan, Y.I. Amperometric L-Arginine biosensor based on a novel recombinant Arginine deiminase. Microchim. Acta 2017, 184, 2679–2686. [Google Scholar] [CrossRef] [Green Version]
  27. Zarei, M.; Rahbar, M.R.; Morowvat, M.H.; Nezafat, N.; Negahdaripour, M.; Berenjian, A.; Ghasemi, Y. Arginine Deiminase: Current Understanding and Applications. Recent Pat. Biotechnol. 2019, 13, 124–136. [Google Scholar] [CrossRef]
  28. Fayura, L.R.; Boretsky, Y.R.; Pynyaha, Y.V.; Wheatley, D.N.; Sibirny, A.A. Improved method for expression and isolation of the Mycoplasma hominis arginine deiminase from the recombinant strain of Escherichia coli. J. Biotechnol. 2013, 167, 420–426. [Google Scholar] [CrossRef]
  29. Matsui, D.; Terai, A.; Asano, Y. L-A;rginine oxidase from Pseudomonas sp. TPU 7192: A;rginine determination. Enzym. Microb. Technol. 2016, 82, 151–157. [Google Scholar] [CrossRef]
  30. Nakano, S.; Niwa, M.; Asano, Y. Following the Evolutionary Track of a Highly Specific L-A;rginine Oxidase by Reconstruction and Biochemical Analysis of Ancestral and Native Enzymes. Appl. Environ. Microbiol. 2019, 30, 567–570. [Google Scholar] [CrossRef]
  31. Sarkar, P.; Tothill, I.E.; Setford, S.J.; Turner, A.P. Screen-printed amperometric biosensors for the rapid measurement of L- and D-amino acids. Analyst 1999, 124, 865–870. [Google Scholar] [CrossRef]
  32. Kacaniklic, V.; Johansson, K.; Marko-Varga, G.; Gorton, L.; Jönsson–Pettersson, G.; Csöregi, E. Amperometric biosensors for detection of L- and D-amino acids based on co-immobilized peroxidase and L- and D-amino acid oxidases in carbon paste electrodes. Electroanalysis 1994, 6, 381–390. [Google Scholar] [CrossRef]
  33. Qin, M.; Li, F.; Huang, Y.; Ran, W.; Han, D.; Song, Y. Twenty Natural Amino Acids Identification by a Photochromic Sensor Chip. Anal. Chem. 2014, 87, 837–842. [Google Scholar] [CrossRef]
  34. Naresh, V.; Lee, N. A review on biosensors and recent development of nanostructured materials-enabled biosensors. Sensor 2021, 21, 1109. [Google Scholar] [CrossRef] [PubMed]
  35. Nayl, A.A.; Abd-Elhamid, A.I.; El-Moghazy, A.Y.; Hussin, M.; Abu-Saied, M.A.; El-Shanshory, A.A.; Solman, H.M.A. The nanomaterials and recent progress in biosensing systems: A review. Trends Environ. Anal. Chem. 2020, 26, e00087. [Google Scholar] [CrossRef]
  36. Wu, J.; Wang, X.; Wang, Q.; Lou, Z.; Li, S.; Zhu, Y.; Qin, L.; Wei, H. Nanomaterials with enzyme-like characteristics (nanozymes): Next-generation artificial enzymes (II). Chem. Soc. Rev. 2019, 48, 1004–1076. [Google Scholar] [CrossRef]
  37. Huang, Y.; Ren, J.; Qu, X. Nanozymes: Classification, Catalytic Mechanisms, Activity Regulation, and Applications. Chem. Rev. 2019, 119, 4357–4412. [Google Scholar] [CrossRef]
  38. Stasyuk, N.; Smutok, O.; Demkiv, O.; Prokopiv, T.; Gayda, G.; Nisnevitch, M.; Gonchar, M. Synthesis, Catalytic Properties and Application in Biosensorics of Nanozymes and Electronanocatalysts: A Review. Sensors 2020, 20, 4509. [Google Scholar] [CrossRef]
  39. Tricot, C.; Stalon, V.; Legrain, C. Isolation and characterization of Pseudomonas putida mutants affected in arginine, ornithine and citrulline catabolism: Function of the arginine oxidase and arginine succinyltransferase pathways. J. Gen. Microbiol. 1991, 137, 2911–2918. [Google Scholar] [CrossRef] [Green Version]
  40. Hossain, G.S.; Li, J.; Shin, H.D.; Du, G.; Liu, L.; Chen, J. L-Amino acid oxidases from microbial sources: Types, properties, functions, and applications. Appl. Microbiol. Biotechnol. 2014, 98, 1507–1515. [Google Scholar] [CrossRef]
  41. Castellano, F.; Molinier-Frenkel, V. An Overview of L-Amino Acid Oxidase Functions from Bacteria to Mammals: Focus on the Immunoregulatory Phenylalanine Oxidase IL4I1. Molecules 2017, 22, 2151. [Google Scholar] [CrossRef] [Green Version]
  42. Fox, J.W. A brief review of the scientific history of several lesser-known snake venom proteins: L-amino acid oxidases, hyaluronidases and phosphodiesterases. Toxicon 2013, 62, 75–82. [Google Scholar] [CrossRef]
  43. Pollegioni, L.; Motta, P.; Molla, G. L-amino acid oxidase as biocatalyst: A dream too far? Appl. Microbiol. Biotechnol. 2013, 9, 9323–9341. [Google Scholar] [CrossRef]
  44. Hiu, J.J.; Yap, M.K.K. Cytotoxicity of snake venom enzymatic toxins: Phospholipase A2 and L-amino acid oxidase. Biochem. Soc. Trans. 2020, 48, 719–731. [Google Scholar] [CrossRef] [Green Version]
  45. Gayda, G. Oxidases of L-amino acids: Obtaining, properties and prospects of utilization. Inter. Conf. 2021, 63, 228–237. [Google Scholar] [CrossRef]
  46. Demkiv, O.; Stasyuk, N.; Serkiz, R.; Gayda, G.; Nisnevitch, M.; Gonchar, M. Peroxidase-Like Metal-Based Nanozymes: Synthesis, Catalytic Properties, and Analytical Application. Appl. Sci. 2021, 11, 777. [Google Scholar] [CrossRef]
  47. Gayda, G.Z.; Demkiv, O.M.; Gurianov, Y.; Serkiz, R.Y.; Klepach, H.M.; Gonchar, M.V.; Nisnevitch, M. “Green” Prussian Blue Analogues as Peroxidase Mimetics for Amperometric Sensing and Biosensing. Biosensors 2021, 11, 193. [Google Scholar] [CrossRef]
  48. Austin, K.T.; Butzke, C.E. Spectrophotometric Assay for Arginine in Grape Juice and Must. Am. J. Enol. Vitic. 2000, 51, 227–232. [Google Scholar]
  49. Mira De Orduña, R.; Liu, S.Q.; Patchett, M.L.; Pilone, G.J. Ethyl carbamate precursor citrulline formation from Arginine degradation by malolactic wine lactic acid bacteria. FEMS Microbiol. Lett. 2000, 183, 31–35. [Google Scholar] [CrossRef]
  50. Petropoulos, S.; Metafa, M.; Kotseridis, Y.; Paraskevopoulos, I.; Kallithraka, S. Amino acid content of Agiorgitiko (Vitis vinifera L. cv.) grape cultivar grown in representative regions of Nemea. Eur. Food Res. Technol. 2018, 244, 2041–2050. [Google Scholar] [CrossRef]
Scheme 1. Reaction of Arg oxidation under catalysis by ArgO.
Applsci 11 07024 sch001
Figure 1. Amperometric characteristics of nCeCu/GE: (a) Cyclic voltammograms as current responses upon addition of H2O2 up to concentrations: (1) 0 mM (black), (2) 2.5 mM (red); (3) 5.0 mM (blue); (4) 10 mM (green); (b,c) chronamperometric response and dependence of amperometric signal on concentration of H2O2, respectively; (d) calibration graph for H2O2 determination. Conditions: Ag/AgCl (reference electrode) in 50 mM phosphate buffer, pH 7.0; scan rate 50 mV·s−1 (a); working potential −50 mV (bd). A and B are parameters of a linear regression: Y = A + BX, and R is a correlation coefficient.
Applsci 11 07024 g001
Figure 2. Amperometric characteristics of nNiPtPd/GE: (a) Cyclic voltammograms as current responses upon addition of H2O2 up to concentrations: (1) 0 mM (black), (2) 0.5 mM (red); (b) chronamperometric response and (c) dependence of amperometric signal on concentration of H2O2; (d) calibration graph for H2O2 determination. Conditions: Ag/AgCl (reference electrode) in 50 mM phosphate buffer, pH 7.0; scan rate 50 mV·s−1 (a); working potential −200 mV (bd).
Applsci 11 07024 g002aApplsci 11 07024 g002b
Figure 3. Amperometric characteristics of ArgO/nCeCu/GE: (a) CV profiles as current responses upon addition of Arg up to final concentrations: (1) 0 mM (drop-black), (2) 2.4 mM (red); (3) 6.5 mM (blue); (4) 13 mM (green); (b) dependence of amperometric signal on concentration of Arg; (c) calibration graph for Arg determination. Conditions: Ag/AgCl (reference electrode) in 50 mM phosphate buffer, pH 7.0; scan rate 50 mV·s−1 (a); working potential −150 mV (b,c).
Applsci 11 07024 g003
Figure 4. Amperometric characteristics of ArgO/nNiPtPd/GE: (a) CV profiles as current responses upon addition of Arg up to final concentrations: (1) 0 mM (black), (2) 0.6 mM (red); (3) 1.2 mM (blue), scan rate 50 mV·s−1; (b) dependence of amperometric signal on concentration of Arg; (c) calibration graph for Arg determination. Conditions: working potential −150 mV vs. Ag/AgCl/3 M KCl in 50 mM phosphate buffer, pH 7.0.
Applsci 11 07024 g004
Figure 5. Amperometric characteristics of ArgO/gCuHCF/GE: (a) dependence of amperometric signal on concentration of Arg; (b) calibration graph for Arg determination. Conditions: working potential −150 mV vs. Ag/AgCl/3 M KCl in 50 mM phosphate buffer, pH 7.0.
Applsci 11 07024 g005
Figure 6. Graphical SAT method for Arg assay in the real sample of freshly prepared apple juice using ArgO/nCeCu/GE: (a) chronoamperograms, (b) calibration graphs. A, B—parameters for the linear regression; N—dilution factor; R—correlation coefficient.
Applsci 11 07024 g006
Figure 7. Graphical SAT method for Arg assay in the real sample of “Tivortin” using AgO/nCeCu/GE (a) and ArgO/nNiPtPd/GE (b). A, B—parameters for the linear regression; N—dilution factor; R—correlation coefficient.
Applsci 11 07024 g007
Table 1. Analytical characteristics of the PO-like NZ/GE as a chemosensor for H2O2.
PO-like NZSensitivity, A·M−1·m−2Linear Range, Up to, mMLOD, µMImax, µAKMapp, mMReference
nCeCu2164 ± 701.50.5172.6 ± 1.19.0 ± 0.05Current work
nNiPtPd 13250 ± 150 1.05374 ± 202.6 ± 0.24Current work
gCuHCF16200.810138.0 ± 8.531.0 ± 4.4[47]
Table 2. Analytical characteristics of the developed ABSs for Arg determination.
BioelectrodeSensitivity, A·M−1·m−2Linear Range, µMResponse Time, s (95%)KMapp, mMReference
Arginase/
urease/PANi/Pt
110 ± 1.370–600101.27 ± 0.29[21]
1 p-cells/urease/PANi/Pt14 ± 1.2up to 600600.51 ± 0.05[22]
Arginase-nAu- p-cells/urease/PANi/Pt357 ± 2410–700300.45 ± 0.09[25]
ADI/PANi/Cu684 ± 323–200150.31 ± 0.05[26]
ArgO/nCeCu/GE1630 ± 925–100600.32 ± 0.05Current work
ArgO/nNiPtPd/GE578 ± 510–250500.35 ± 0.03Current work
ArgO/gCuHCF/GE602 ± 4210–100500.12 ± 0.02Current work
1 p-cells—permeabilized yeast cells.
Table 3. Results of Arg determination (C) in the real samples using different ArgO-NZ-based biosensors.
NZ As H2O2-Sensor nCeCu nNiPtPd
SampleC, mM1 CV, %C, mMCV, %
Pharmaceutical “Tivortine”198.7 ± 6.223.1199.5 ± 2.121.06
Commercial apple-pear juice7.1 ± 0.081.17.4 ± 0.56.8
Freshly prepared apple juice4.99 ± 0.0010.022 ND-
Commercial grape-apple juice8.71 ± 0.434.9ND-
Commercial multifruit juice6.14 ± 0.254.1ND-
Wine, red, dry3.26 ± 0.092.8ND-
1 CV, %—coefficient of variation, values are expressed as mean ± SD; 2 ND—not determined.
Publisher’s Note: MDPI stays neutral with regard to jurisdictional claims in published maps and institutional affiliations.