Article

Experimental Investigation on Integrated Subsurface Monitoring of Soil Slope Using Acoustic Emission and Mechanical Measurement

1
Institute of Public Safety Research, Department of Engineering Physics, Tsinghua University, Beijing 100084, China
2
Beijing Key Laboratory of City Integrated Emergency Response Science, Tsinghua University, Beijing 100084, China
3
Hefei Institute for Public Safety Research, Tsinghua University, Hefei 230601, China
4
Anhui Province Key Laboratory of Human Safety, Tsinghua University, Hefei 230601, China
*
Authors to whom correspondence should be addressed.
Appl. Sci. 2021, 11(16), 7173; https://doi.org/10.3390/app11167173
Submission received: 2 July 2021 / Revised: 22 July 2021 / Accepted: 2 August 2021 / Published: 4 August 2021

Abstract

:
Compared with slope surface measurement, subsurface monitoring has the potential to detect abnormal changes at an earlier stage. Due to the large-scale deformation of landslides and the complex geological environment, the existing subsurface devices generally have limited measuring range or high economic cost. Thus, it is urgent to develop an advanced method to improve the sustainable monitoring of large subsurface deformation. In this study, a novel flexible device is designed for slope subsurface monitoring, which combines an active waveguide of acoustic emission and the distinctive structure of a large-deformation bolt. An experimental system is built and a loading process of three-stage deformation is carried out to test the performance of the flexible device. The kinematic, mechanical and acoustic emission parameters are synchronously obtained in the whole landslide model test. The results indicate that different evolution stages of a landslide can be distinguished by sliding acceleration. The axial tension within the anchor cable changes consistently with sliding thrust. In addition, using acoustic emission to quantify slope deformation has achieved strong correlation. An extra experiment with constant velocity is conducted to explore the precision of deformation quantification by acoustic emission. A schematic diagram is presented for how this novel device would be used for landslide monitoring in the field, with the potential practicability of stabilizing the slope.

1. Introduction

As a common natural disaster, landslides often cause huge destructive consequences, leading to serious casualties and property losses [1,2,3,4,5,6,7]. Slope monitoring can obtain landslide evolution information and detect abnormal changes in time, which is helpful for disaster prevention and emergency warning. Current techniques for slope deformation monitoring mainly includes surface and subsurface methods [8]. Surface deformation monitoring methods primarily use global navigation satellite system (GNSS), photogrammetry, remote sensing and fibre optics [9]. These surface methods are sensitive to interference by atmosphere, topography, vegetation and human factors [10,11,12,13,14]. The data update interval is usually long for surface monitoring and it is possible that the topsoil movement as a result of rainfall erosion may cause misjudgment and false alarms [11]. More critically, the surface monitoring cannot perceive the geological activity inside the slope, nor can it monitor the development and failure of the sliding surface. In fact, landslide is caused by the progressive damage of the internal structure of a slope, and the sliding surface plays a significant part in landslide evolution. Therefore, the evolution information of a landslide is sent out from the inner area, and the initial information can only be perceived inside the slope mass. Only when there is enough change in the slope mass can the slope surface deform macroscopically. Then the macroscopic deformation can be captured by the surface monitoring equipment if it exceeds a certain degree. In order to realize the sensitive perception and early warning of landslide hazards, it is necessary to carry out subsurface deformation monitoring. The subsurface device is directly attached to the borehole in the slope mass to obtain the direct information more efficiently and early, which can provide powerful support for the stability evaluation and disaster mitigation.
Subsurface deformation monitoring devices of slope movement usually have high measurement accuracy and time resolution, although they can only collect the information of the slope mass around the borehole and thus the spatial coverage is limited [15,16]. As shown in Table 1, three high-precision subsurface deformation monitoring methods are the inclinometer, ShapeAccelArray (SAA) and acoustic emission (AE) technology [9,17,18,19]. However, due to the rigidity and brittleness of inclinometer casing, the casing can be bent excessively when the local shear displacement reaches about 50 mm, resulting in the failure of the device [15,20,21]. As for SAA, the measured displacement of shear plane is more than hundreds of millimetres [9,22,23]. However, the expensive cost limits the wide application of SAA. It is noteworthy that AE is a sensitive and efficient monitoring technology, which appears in the initiation period of a landslide, along with the whole process of slope deformation. AE technology has the characteristics of being reliable, of low price, with high accuracy and can be conducted in real time [24,25]. AE is sensitive to minor changes in displacement and velocity, which can detect extremely slow-moving landslide and has the potential to release early warning [26,27,28,29].
AE monitoring of landslide deformation has been carried out for decades. Most studies on AE monitoring are qualitative research, that is, qualitatively judging the state of a slope according to the level of AE [24]. AE was used to quantify the magnitude change of landslide displacement rate for the first time in 2007 [32]. Furthermore, the proportional relationship between AE rate and displacement rate was first discovered and mathematically described in 2014 [33]. In order to avoid rapid attenuation of the AE signal which is difficult to detect, the waveguide is usually used in slope monitoring [28]. Passive waveguide (grouted waveguide) is often used in rock slope monitoring [34,35]. Steel pipe and granular backfills are used to form an active waveguide applied in soil slope monitoring [25,28,33,36]. With the movement of surrounding soil, the active waveguide itself deforms and generates AE. The feature parameters of AE can be used to quantify the deformation behaviour of the soil slope [17,23,29,33,35,37]. As a common parameter of AE, ring down count (RDC) refers to the number of times that the AE signal amplitude exceeds the pre-designed voltage threshold within a period of time [33]. In order to filter out environmental noise, AE signals are collected only when they are in a specific frequency range of 20–30 kHz, which is the dominant frequency range generated from an active waveguide [28,29,33]. However, the current waveguides are mostly metal tubes, which may undergo shear or bending failure during a landslide; thus, metal tubes are difficult to apply under the circumstance of large deformation (i.e., >500 mm). A kind of large-deformation bolt was invented and tested extensively [38,39]. The structure of the AE waveguide can be improved with reference to this large-deformation bolt. There seem to be few studies on the design of AE waveguide aiming at large-deformation monitoring of slope. Furthermore, the advantages have been underexploited for a novel flexible monitoring device combined with active waveguide and large-deformation bolt. It is worthwhile to develop an AE monitoring method using a flexible structure to sustainably measure the subsurface deformation of a slope.
The objectives of this study are fourfold: (1) to design a novel flexible device that is suitable to be applied in slope subsurface monitoring under large deformation; (2) to realize the synchronous monitor of AE and mechanical parameters using one flexible device; (3) to explore the correlation between the measured force of a flexible device and the thrust to the sliding body; (4) to examine the performance of deformation quantification by AE and the influence of a flexible device on the slope. In this study, a novel flexible monitoring device is designed and manufactured, and a landslide experiment system is built to test the feasibility and application effect of the proposed device. Of note, the proposed monitoring device is mainly used for slow moving landslides, and monitoring tools for fast-moving landslides are different from those of the other typologies of phenomena.
In the following sections, an iron box is used to simulate the local structure of a soil slope, and a three-stage loading program is designed to simulate a landslide process. Then, the mechanical and AE parameters in the whole process of landslide experiment are obtained synchronously using the proposed flexible device. Furthermore, the change characteristic and relationship of multiple parameters are explored. Finally, an extra landslide experiment with constant velocity is conducted to investigate the precision of quantified deformation by AE.

2. Experimental System and Test Procedure

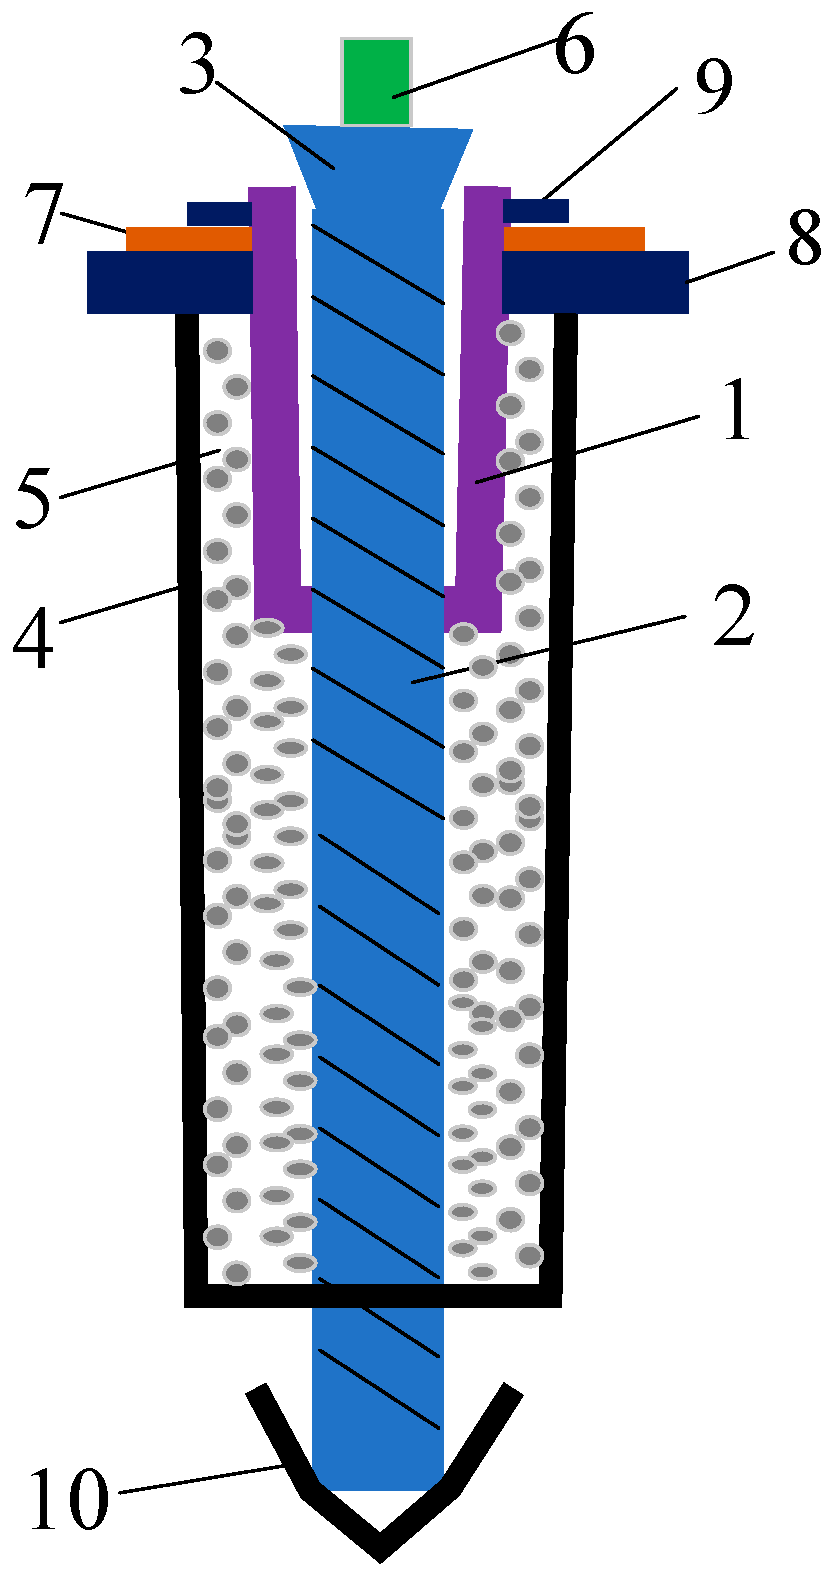
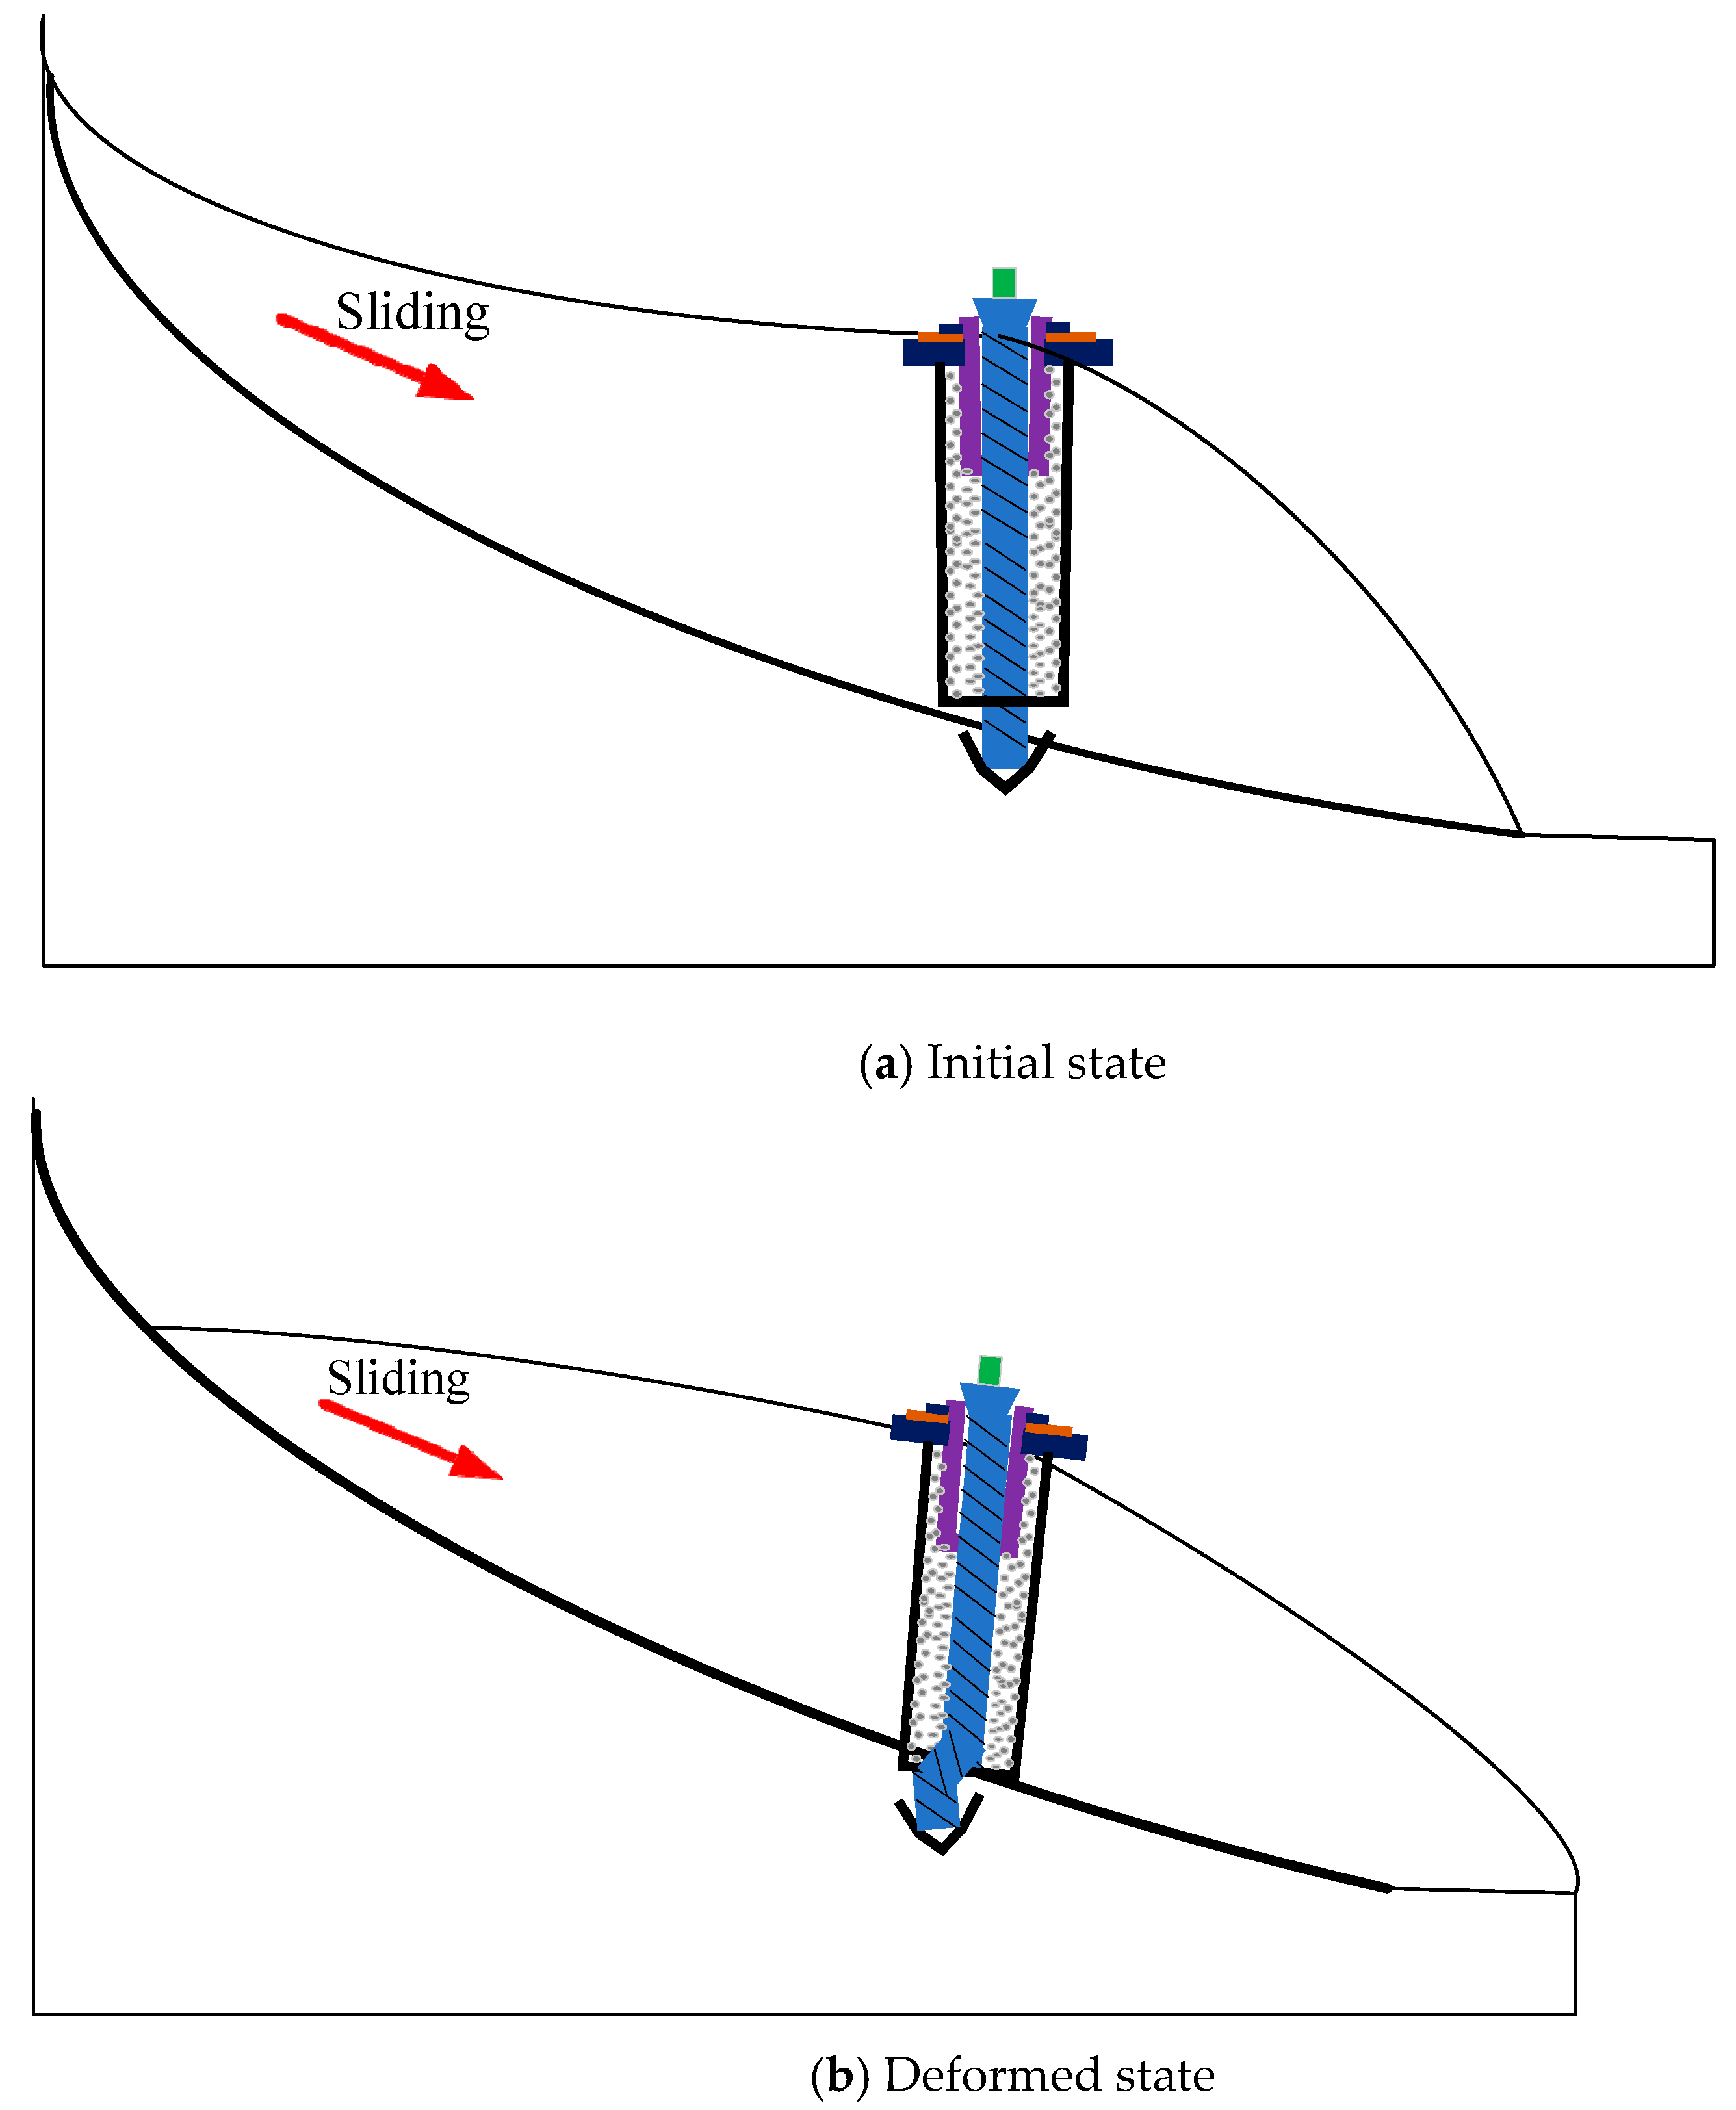
2.1. Design of Flexible Device for Slope Subsurface Monitoring

The AE essence of an active waveguide is the relative motion between sliding mass and slope bed on the backfill materials. It is necessary to fix the pile in the deep stable bed by boreholes, so as to block the backfill materials and thus the generated AE can continue. Flexible piles are bent when subjected to transverse load while the pile bottom remains static. An anchor cable is a kind of flexible pile. On the one hand, an anchor cable possesses a certain stiffness which can block the movement of the sliding body and stimulate AE of backfill materials. On the other hand, an anchor cable possesses some resilience which allow a greater degree of transverse shear and bending. However, if both ends of the anchor cable are fixed, failure is likely to occur under tension.
A new subsurface monitoring device was designed with reference to the structure of a large-deformation bolt [38,39], changing the material deformation into structural deformation. The main structure is shown in Figure 1 and is detailed as follows. An inner threaded sleeve was added outside the upper part of an anchor cable. The sleeve was embedded in the slope and was fixed on the slope surface. A conical metal head was installed on the top of the anchor cable. When the sliding body moved, the sleeve deviated upward from the anchored end. From another perspective, the anchor cable and its metal head moved flexibly along the axial direction in the sleeve; thus, the anchor cable was not easy to break as a result of tension. The anchor cable may be able to deform axially a large distance determined by the length of the sleeve and this structural characteristic may bring about an increased measurement range for slope deformation monitoring. The diameter of the metal head was slightly larger than the diameter of the thread on the inner wall of the sleeve, and the internal thread would be gradually worn down from top to bottom. The anchor cable fixed on the slope bed hindered the movement of the sliding body, played the role of reinforcing the slope mass and limiting its deformation. Consequently, the device had a potential ability to stabilize the slope. The sleeve was short in length and did not pass through the sliding surface to avoid shear failure. The movable pedestal circled outside the sleeve was located on the ground surface and provided upward support for the sleeve. The ring dynamometer was installed on the pedestal to measure the axial tension within the anchor cable and was fastened with a nut.
The AE portion of the proposed device was described as follows. A rubber tube was placed along the inner wall of the borehole and passed through the sliding surface. The rubber tube was located outside the anchor cable, and sufficient backfill materials were filled into the space between the rubber tube and the anchor cable. The rubber tube can not only isolate the backfill and external geotechnical conditions to reduce the impact of the surrounding environment to AE generation, but also can maintain its resilience when subjected to large deformation. An AE transducer was fixed on the metal head of the anchor cable through the coupling agent. As the slope moved, the deformation of rubber tube would be much larger than that of anchor cable. The difference of internal and external deformation would cause the extrusion, collision and friction of backfill materials, and hence AE was generated. The AE characteristics during this period depended on the interaction between backfill materials and anchor cable, and the dominant frequency was concentrated within 20–30 kHz based on frequency spectrum analysis. As a metal waveguide, the AE signal attenuation along the anchor cable was low, and the AE parameters could be useful to quantify the deformation of the sliding body relative to slope bed.
The designed device integrates the structure of a large-deformation bolt into an active waveguide. Compared to other AE monitoring instruments, a significant improvement of the device is the novel mechanical structure of waveguides instead of conventional metal tubes. Based on this particular structure, the proposed device with excellent resilience can endure large deformations during a landslide to sustainably monitor subsurface deformation. Moreover, AE and mechanical parameters can be collected synchronously using one flexible device and then multiple parameters can be correlated and verified with each other.

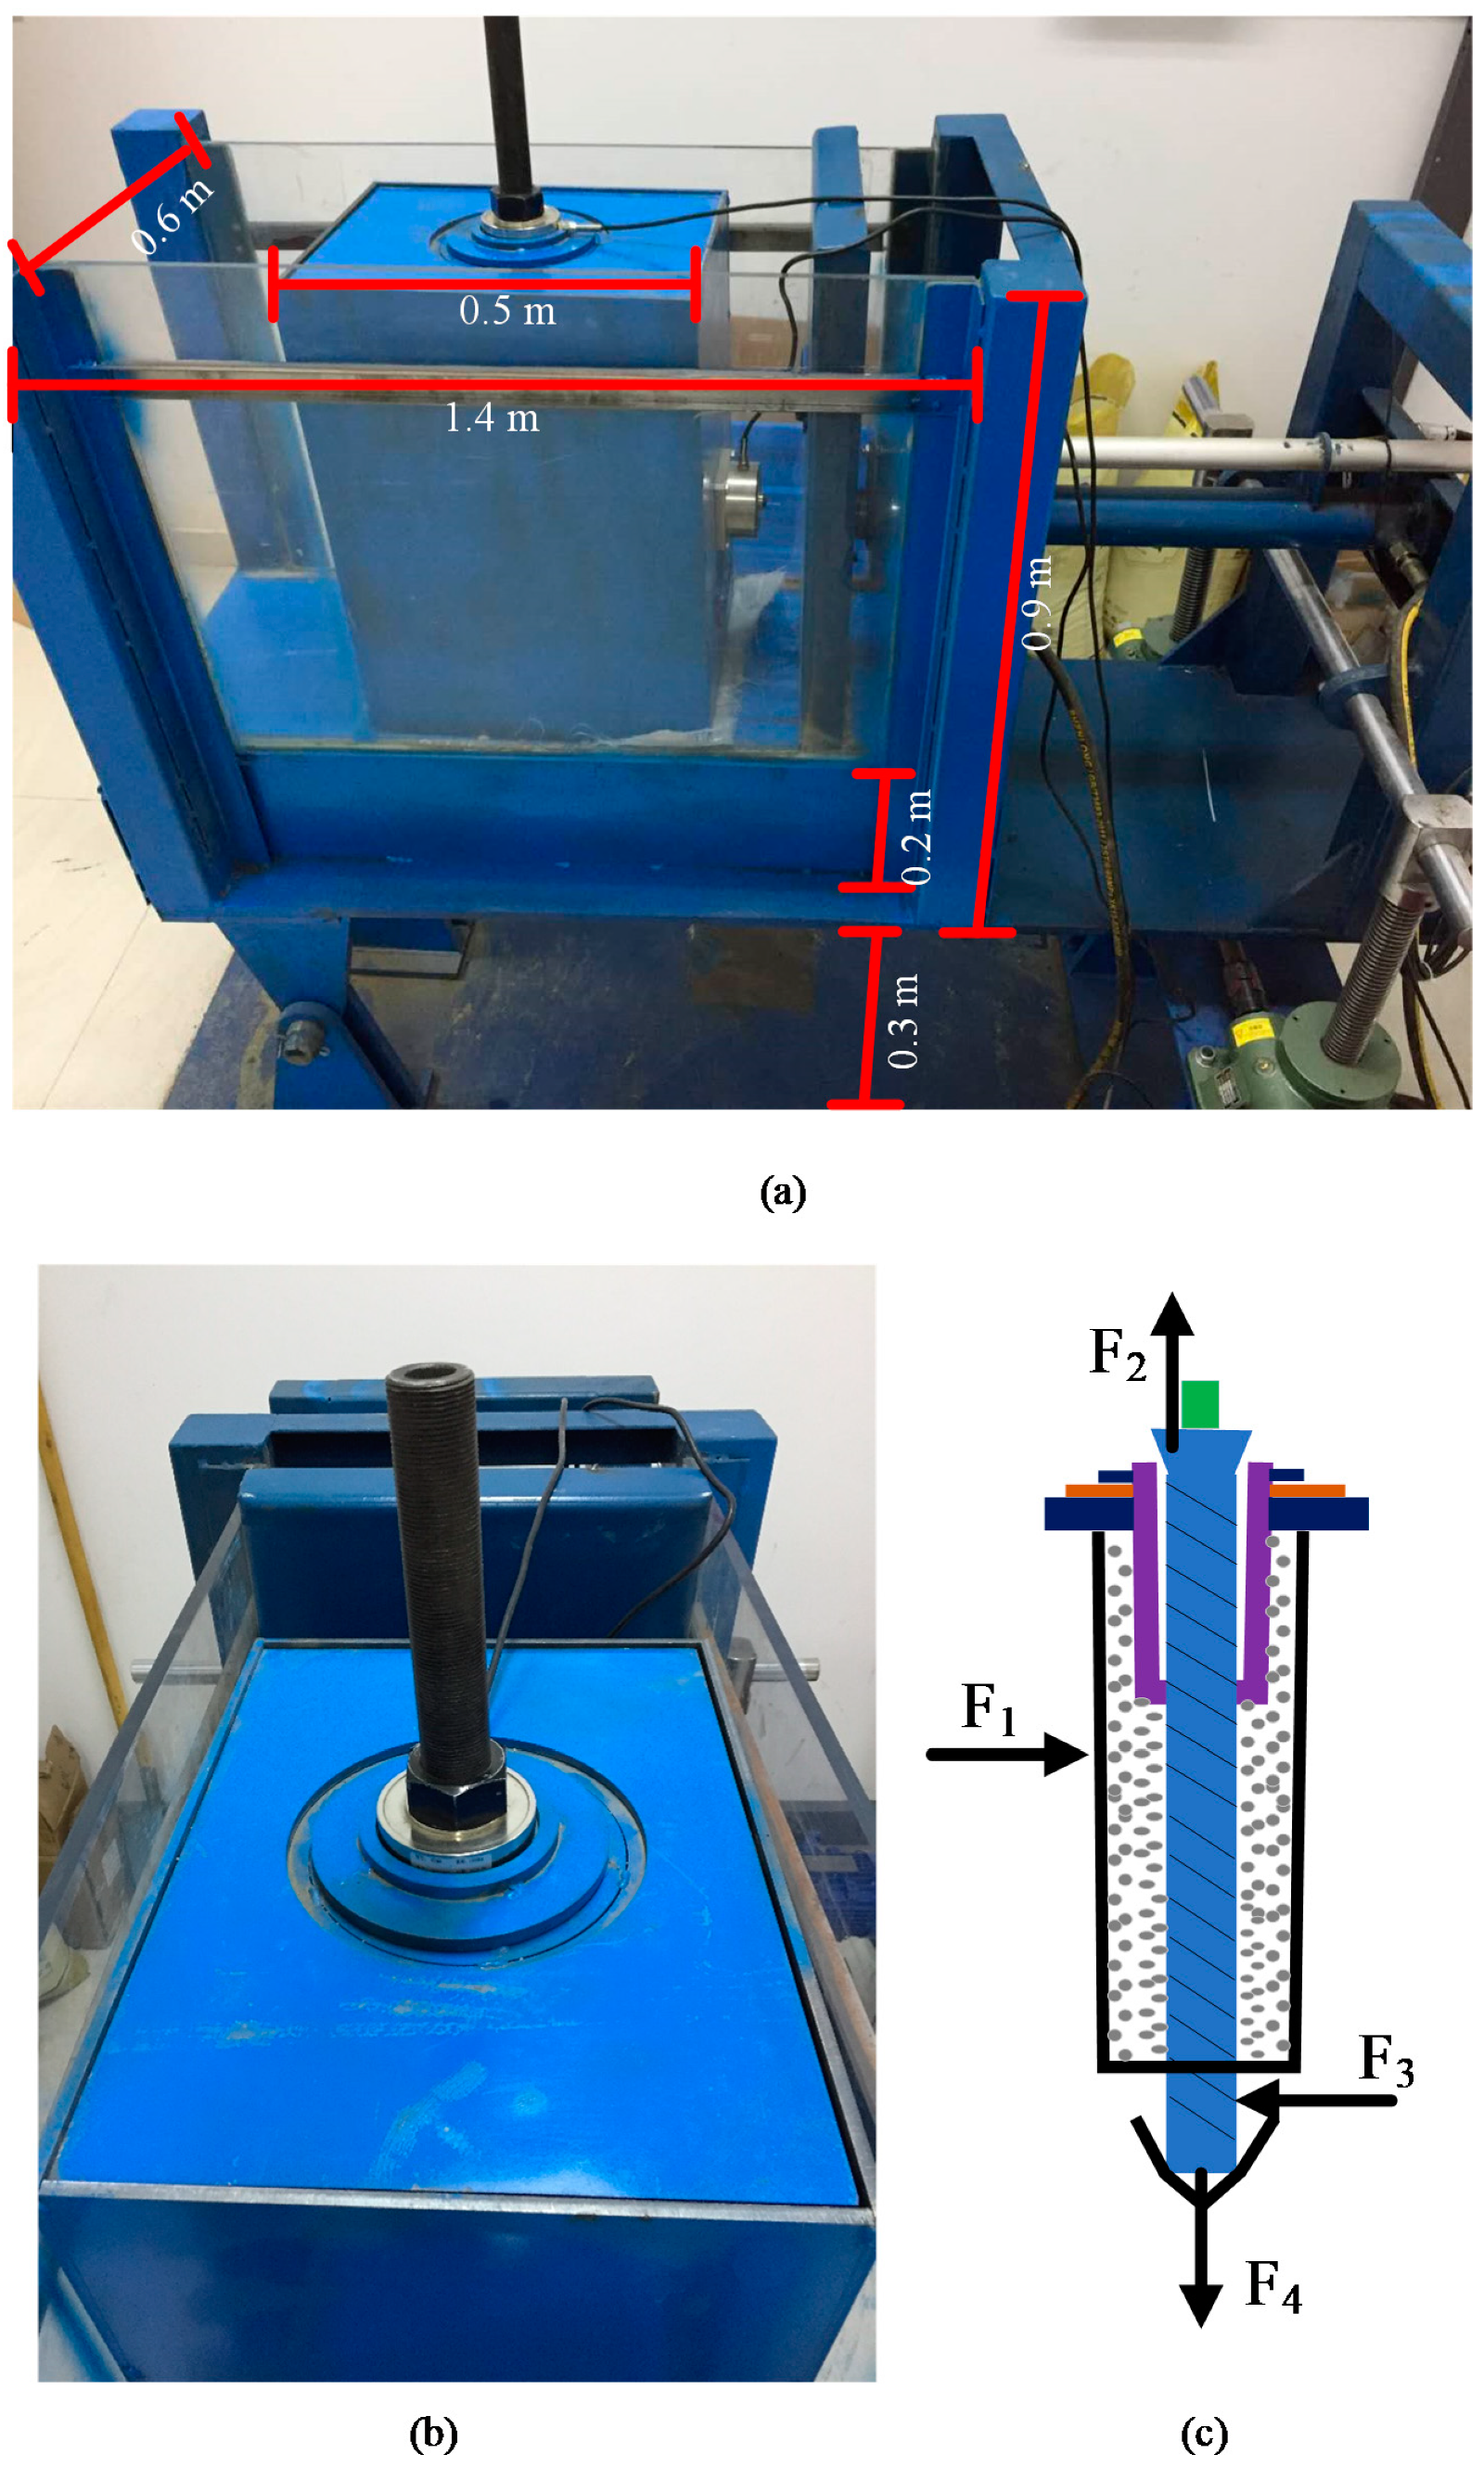
2.2. Experimental System and Method

The landslide experiment system consisted of three parts. The first was an experimental platform with a steel structure, the second was a mechanical loading system, and the third was a flexible monitoring device.
As shown in Figure 2a, the size of the container was 1.4 × 0.6 × 0.9 m, and the bottom of the horizontal container was 0.3 m away from the ground. The inclination angle of the experimental platform could be adjusted flexibly within 0–20°. The platform was equipped with a thick steel plate to simulate the sliding surface, and a test box (0.5 × 0.5 × 0.6 m) placed on the steel plate could move forward to simulate the local structure of the soil sliding body. The test box was made of 5 pieces of 6 mm-thick steel plate welded while the top plate could be disassembled. The centre of the test box was a hollow steel cylinder with the diameter of 11 cm, which simulated the borehole used for installing the flexible monitoring device.
The mechanical loading system was mainly composed of a jack and a programmable logic controller (PLC) system. The PLC program was written in advance, and the jack could be controlled to move according to the velocity formula to realize a displacement-controlled shear test [37]. PLC could be used to design corresponding velocity formulas to be loaded in several stages during a landslide model test. The deformation process of a landslide could be reproduced, and the accelerating stage regarding slope failure was focused on.
The flexible monitoring device was described in detail in the section “Design of flexible device for slope subsurface monitoring’, and was mainly composed of an anchor cable, sleeve and AE monitoring system. And the force analysis of the flexible device was shown in Figure 2c. The backfill materials consisted of granite gravel with average size of 6 mm and their properties are displayed in Table 2. The specific installation and operation procedure of the flexible device was as follows. First, the anchor cable was put through the hole in the middle of the iron box, and the bottom of the anchor cable was fixed under the thick steel plate (sliding surface) using the customized fixture. Second, the rubber tube was placed along the inner wall of the borehole and passed through the sliding surface. The part of the rubber tube below the sliding surface was fixed by iron bars. The space between rubber tube and anchor cable was filled with granular materials. Third, the upper part of the anchor cable was surrounded with the sleeve, and the conical metal head was installed on the top of the anchor cable. Fourth, the movable pedestal was circled outside the sleeve, and was put on the surface of the iron box. Then, the ring dynamometer was installed on the pedestal and was fastened with a nut. Finally, the AE transducer was fixed on the conical metal head. The signal wire, coupled with preamplifier, cable and acquisition instrument of an AE system were connected in order. AE data were exported to a dedicated computer and analysed by professional software.

3. Results and Analysis

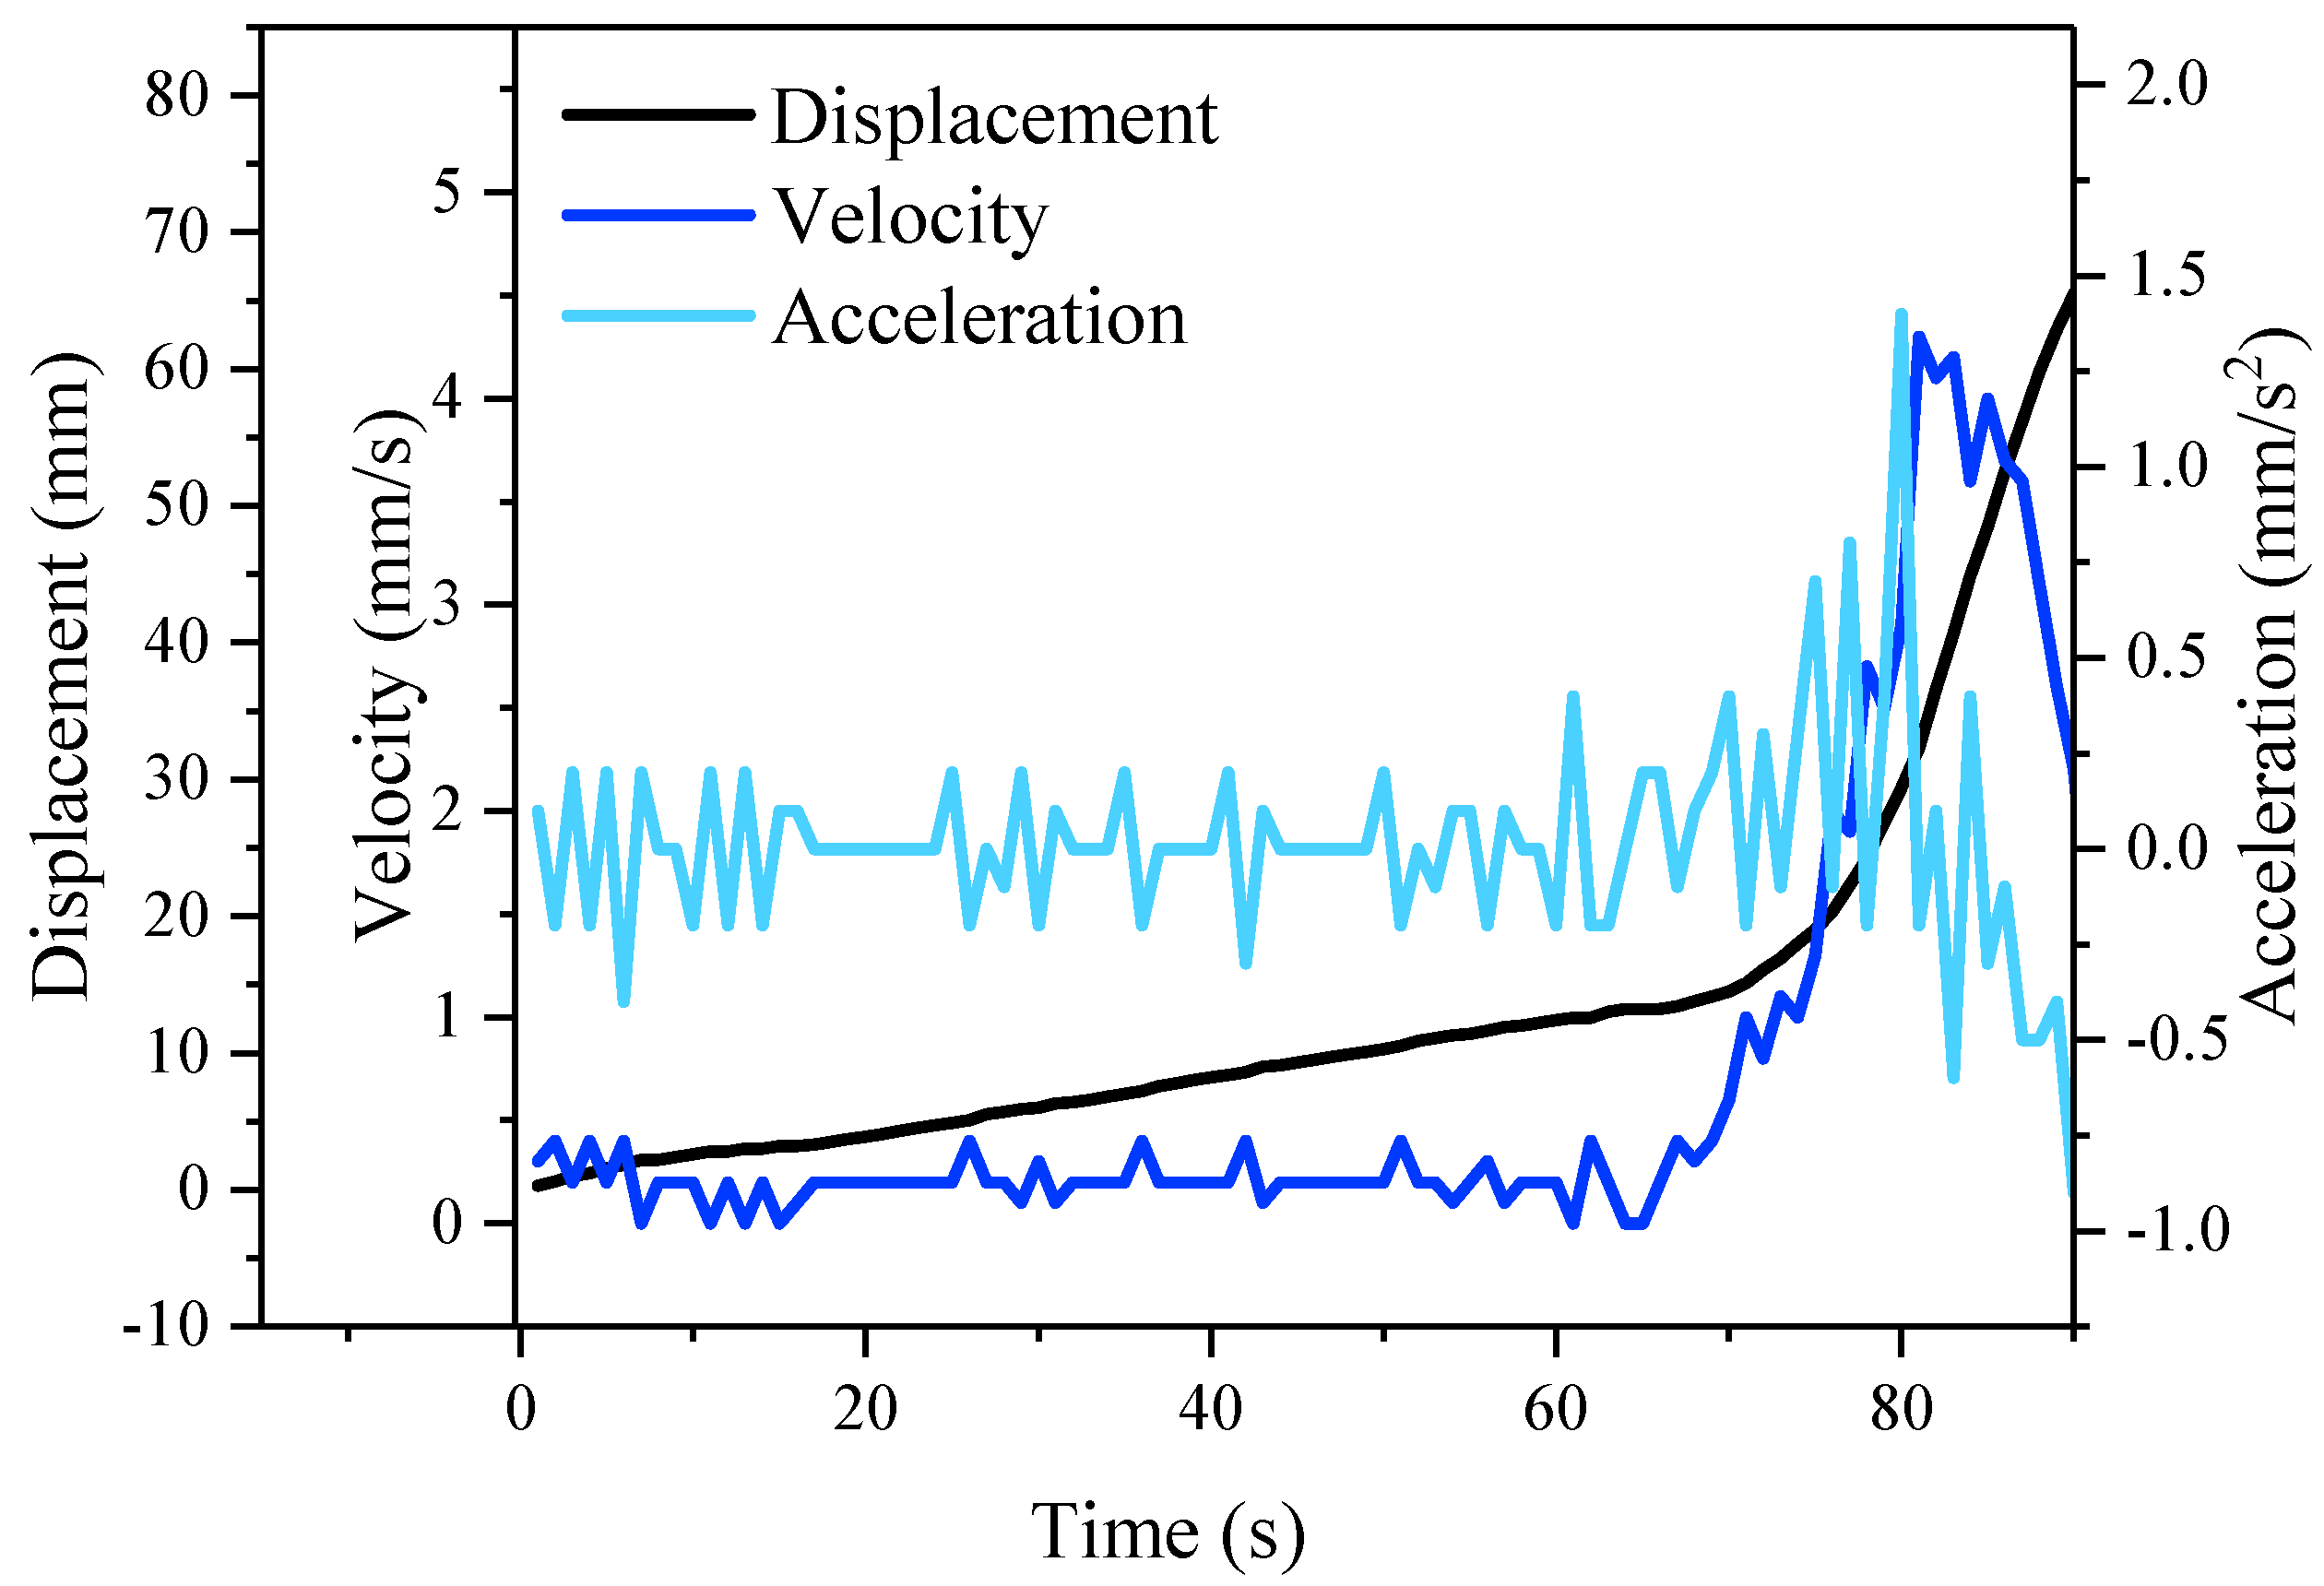
3.1. Kinematic Parameters

For each landslide experiment, the linear displacement transducer (LDT) was used to measure and record the movement of the sliding body in real time. Based on the displacement data and the corresponding time, the velocity and acceleration values were calculated. Displacement, velocity and acceleration are put together in Figure 3. From the beginning to 70 s, the slope movement is in the initial or uniformly-moving stage. The displacement increases slowly and the velocity is below 0.5 mm/s. The acceleration oscillates near 0 and its amplitude is below 0.5 mm/s2. After 70 s, the displacement curve turns obviously and then rises rapidly. The velocity suddenly increases from a lower level, and reaches the peak value across 4 mm/s at about 80 s. The acceleration fluctuates sharply after 70 s, and changes abruptly at 80 s, reaching the peak value of 1.5 mm/s2. The occurrence time and curve characteristics of acceleration mutation are very obvious, which may be able to identify the critical change of slope stability.

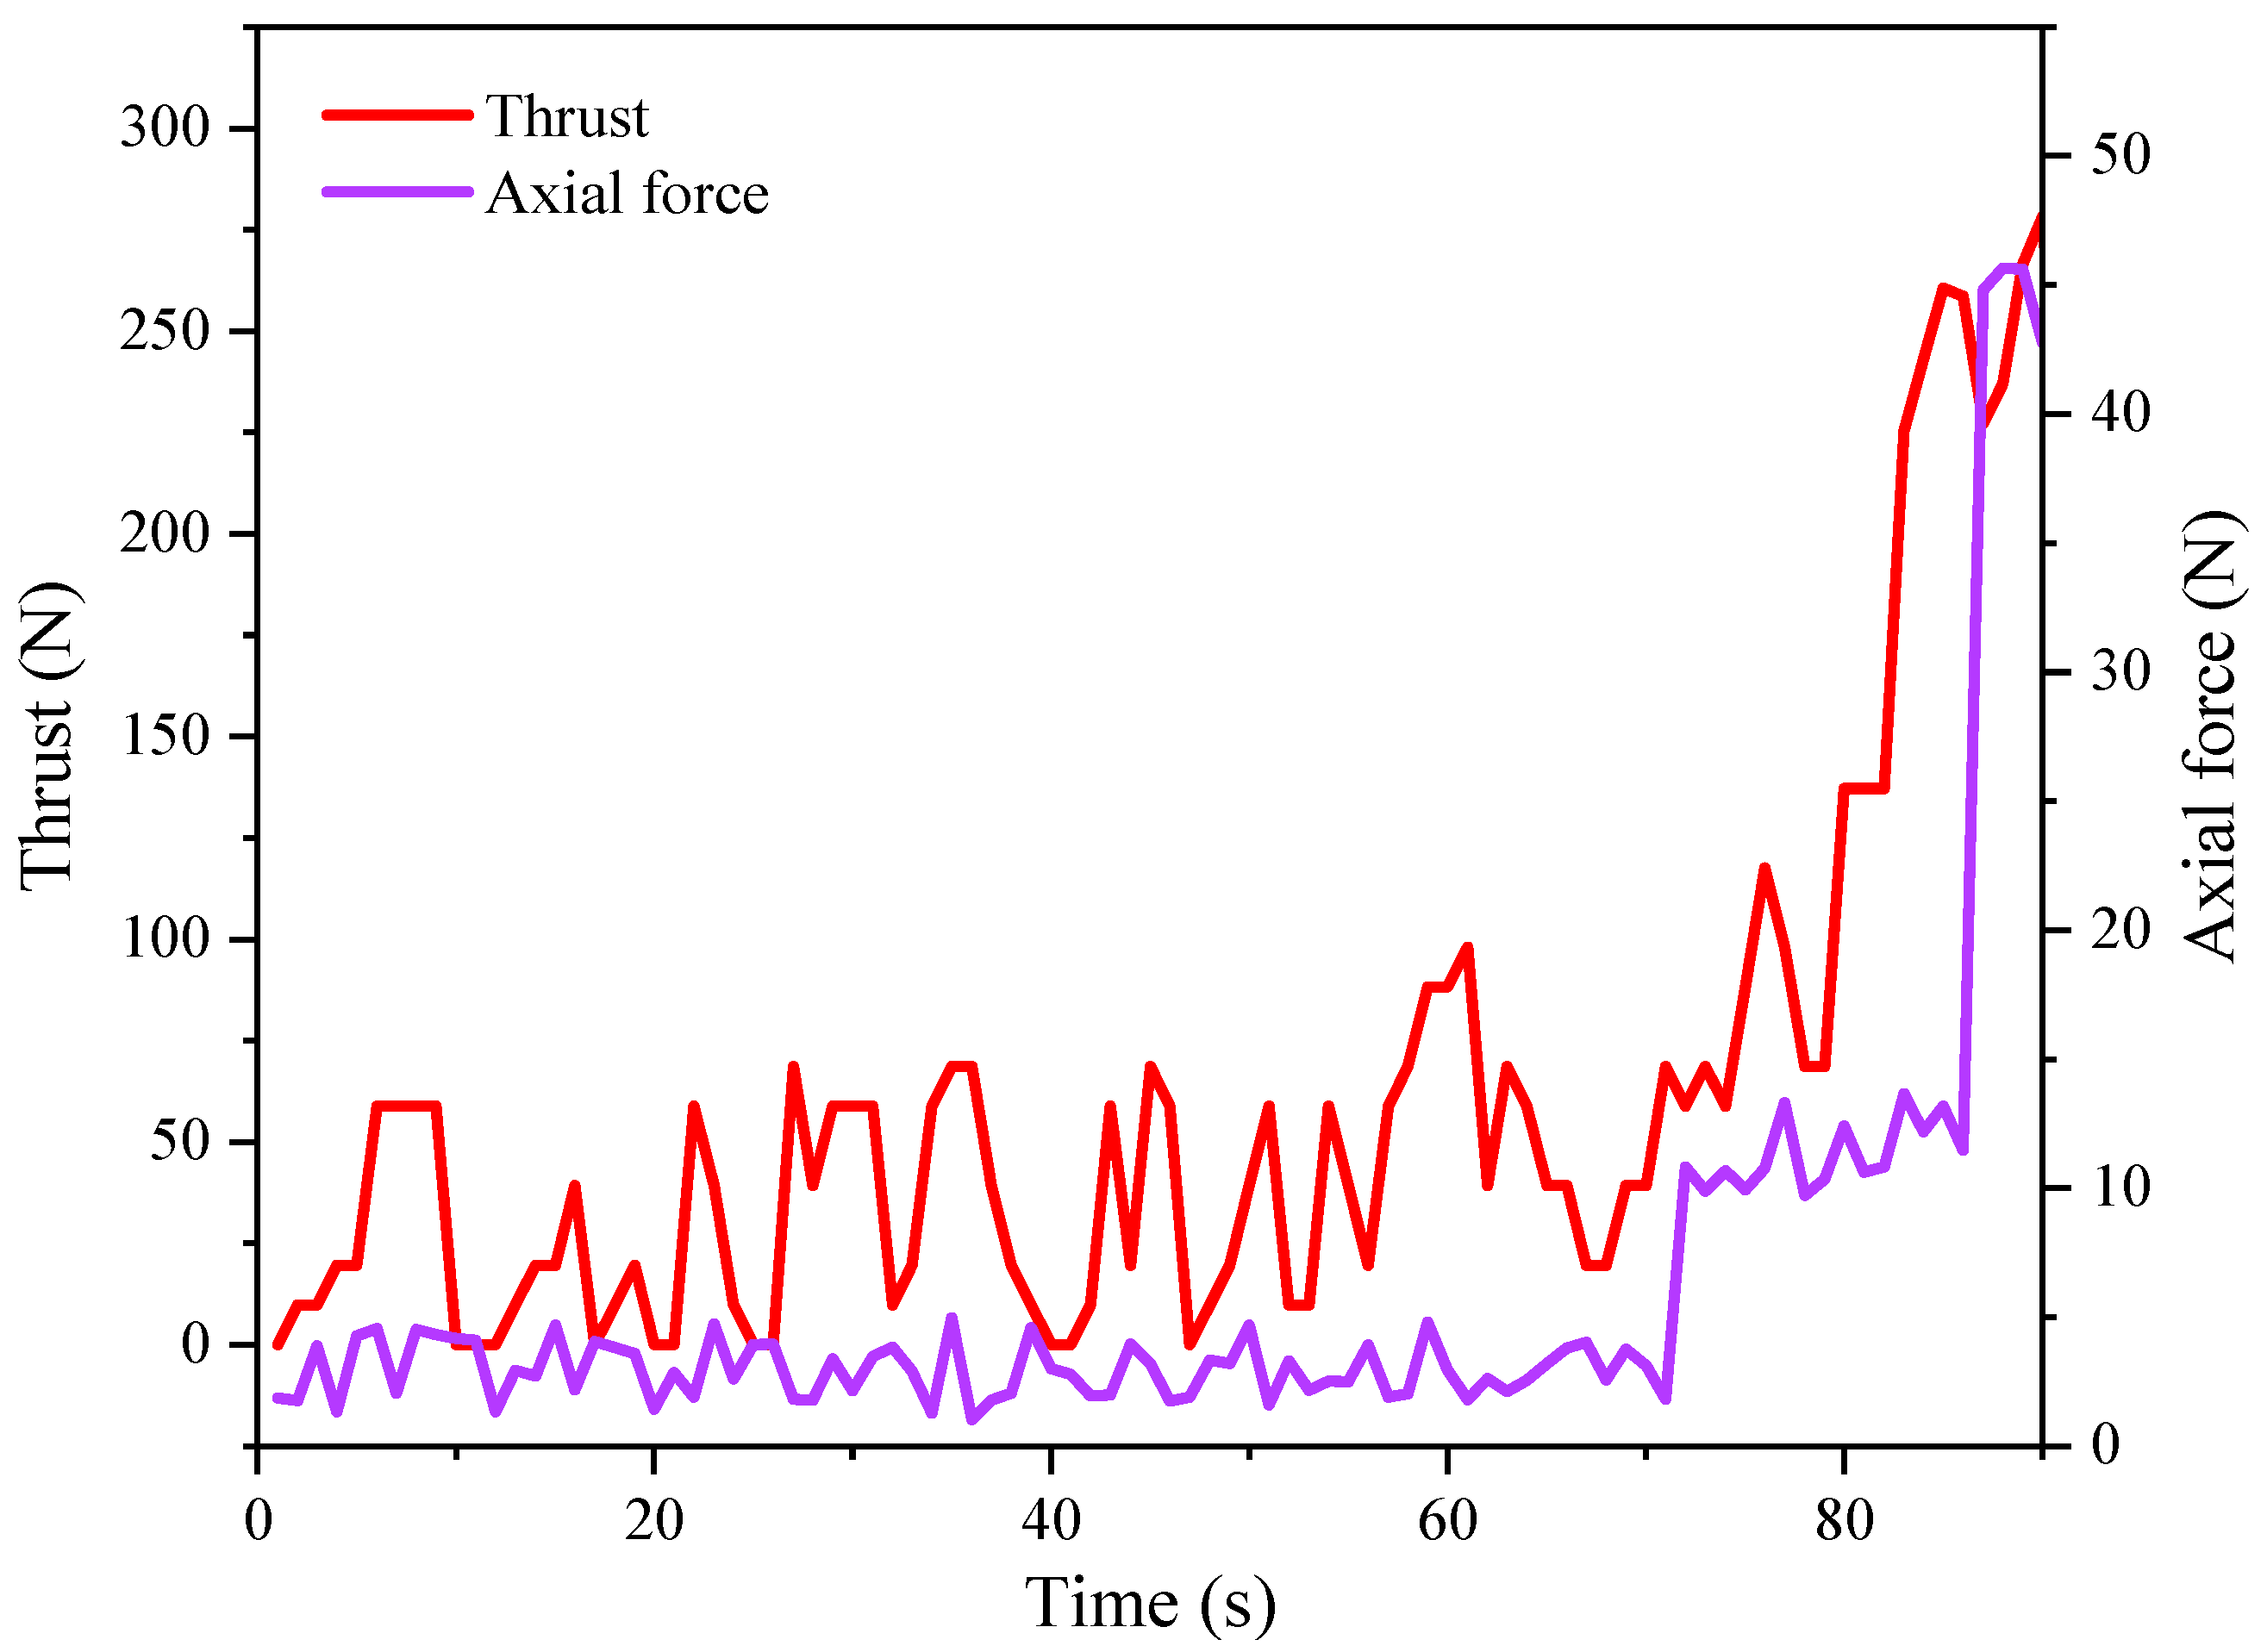
3.2. Mechanical Parameters

The thrust to the sliding body can be measured by the mechanical transducer between the push plate and the iron box, and the pressure on the ring dynamometer is measured to indirectly represent the axial tension within the anchor cable. Figure 4 shows the thrust and the tension curve. Before 70 s, the thrust to sliding body fluctuates between 0–100 N, which is relatively smooth. The axial tension within anchor cable is at a low level, which indicates that the force from the pedestal to the ring dynamometer is not significant in this period. After 70 s, the thrust to sliding body increased rapidly and reached the peak value at around 85 s. The axial tension curve shows a similar pattern to the thrust. A small rise of the axial tension occurs at 70 s, and a large jump occurs at around 85 s. On the whole, the change trend of the two mechanical parameters is relatively synchronous, which preliminarily suggests the rationality and effectiveness of the axial tension measurement using the proposed flexible device. The axial tension within the anchor cable can indirectly reflect the change trend of the thrust to the sliding body, which is of great significance for understanding the stress state of the slope.

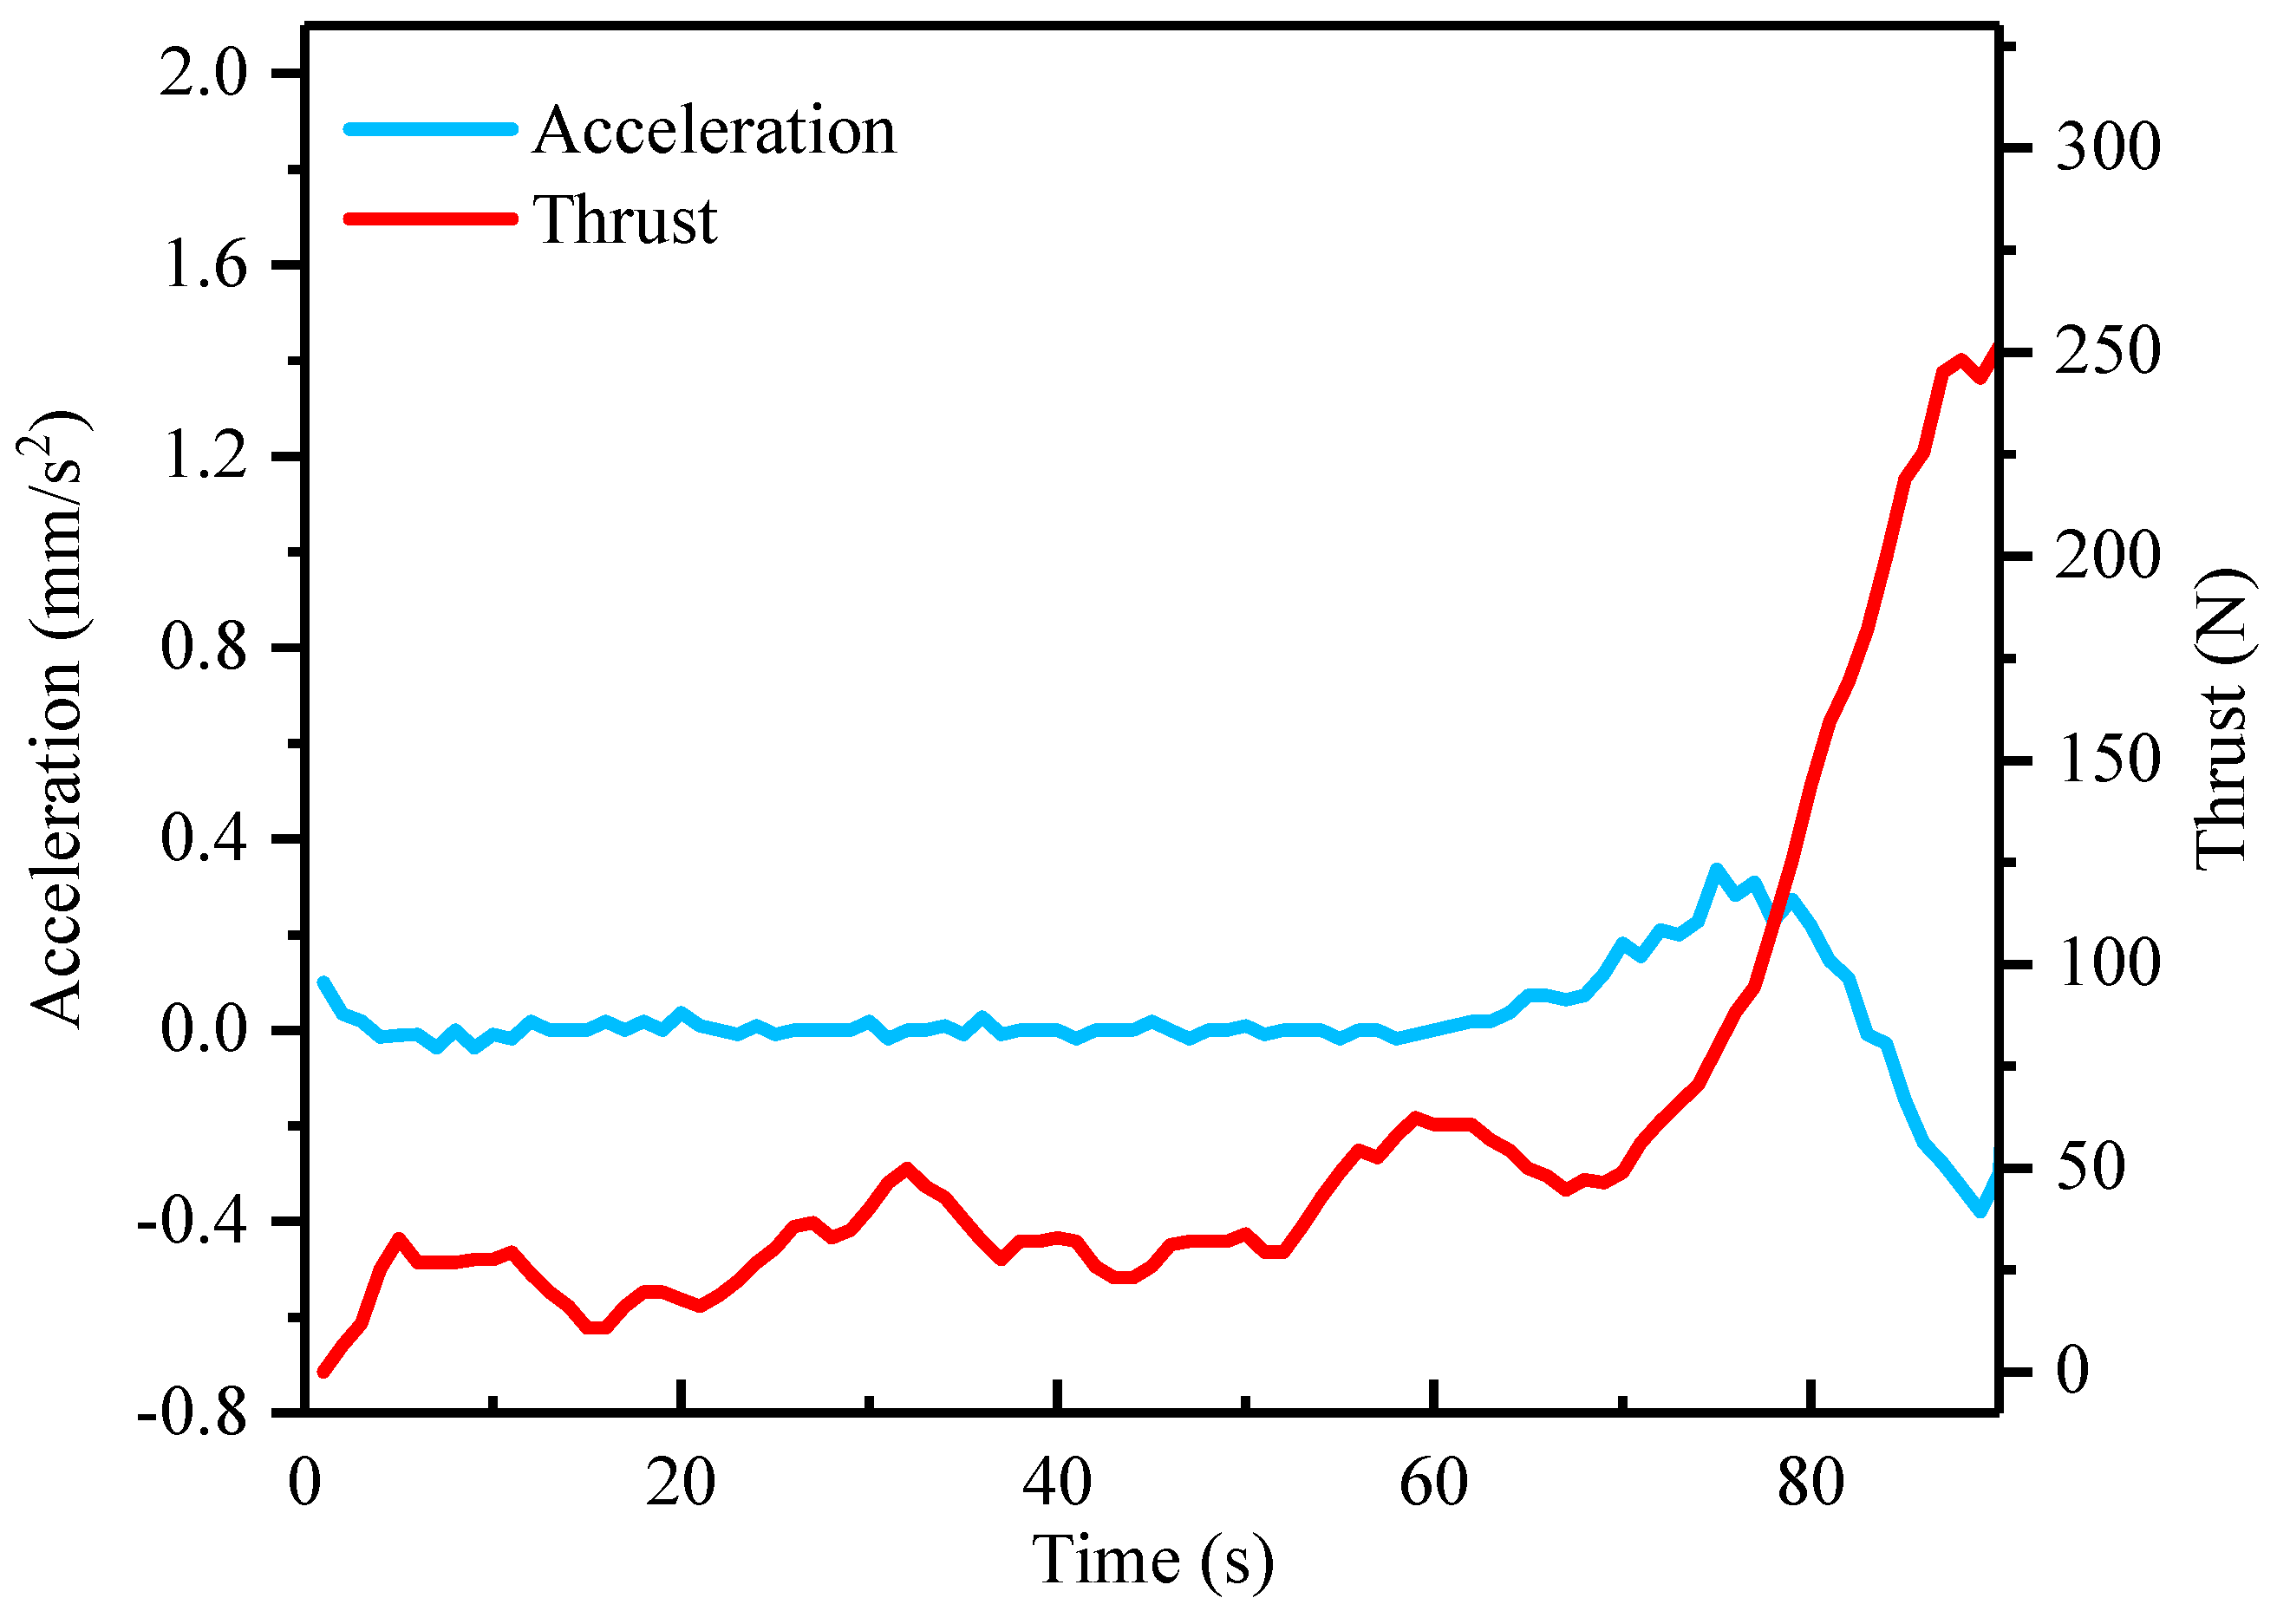
3.3. Thrust and Acceleration

Acceleration is the result of thrust effect; it is of importance to explore the relationship between thrust and acceleration data acquired by experiments and clarify their changes with time. For the acceleration and thrust data in Figure 3 and Figure 4 respectively, the adjacent-averaging method is used to smooth the data. Figure 5 shows the smoothed curves. The change trend of thrust and acceleration is consistent; both of them are at a low level and have small fluctuation before 70 s. At about 70 s, thrust and acceleration suddenly change together, and the acceleration rises sharply and reaches the peak value. After 80 s, the thrust continues to rise rapidly while the acceleration decreases, which may be because the movement of the sliding body is significantly hindered by the anchor cable. The anchor cable shows a stabilizing function of reinforcing the sliding body and limiting its deformation. Based on the similar change of thrust and acceleration data collected by two kinds of measuring equipment, the monitoring results of mechanical and kinematic measurement can be mutually verified.

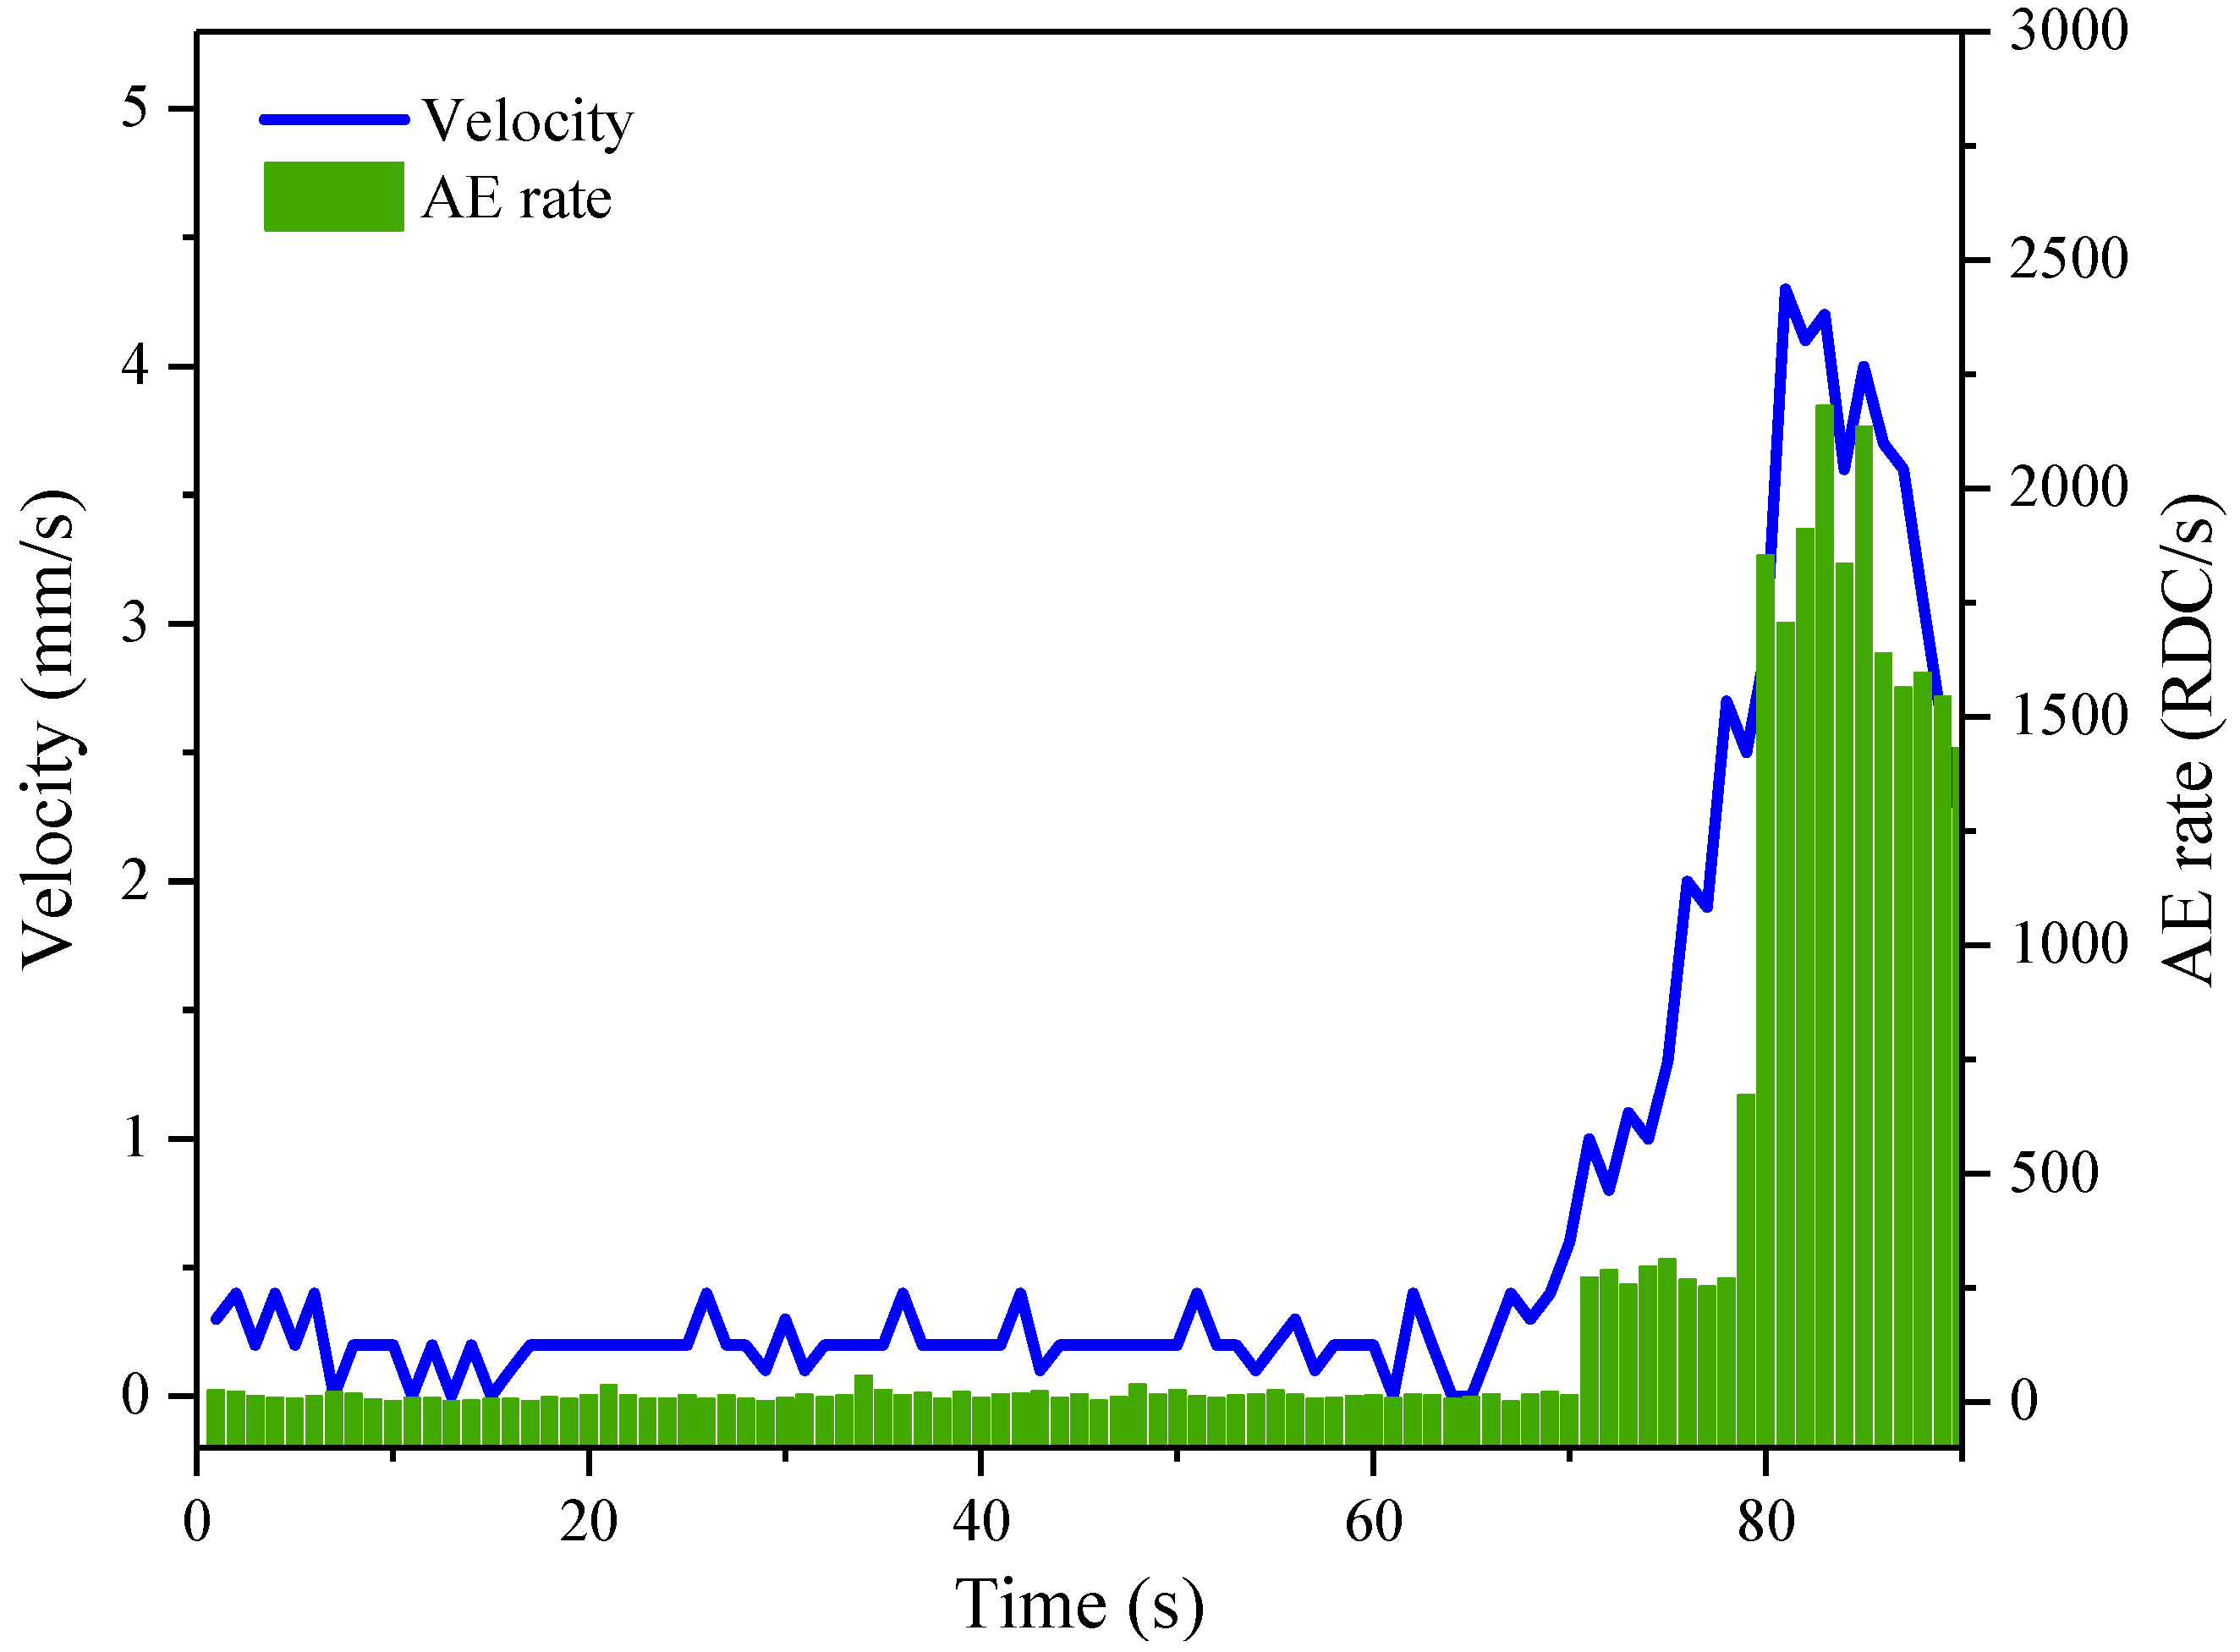
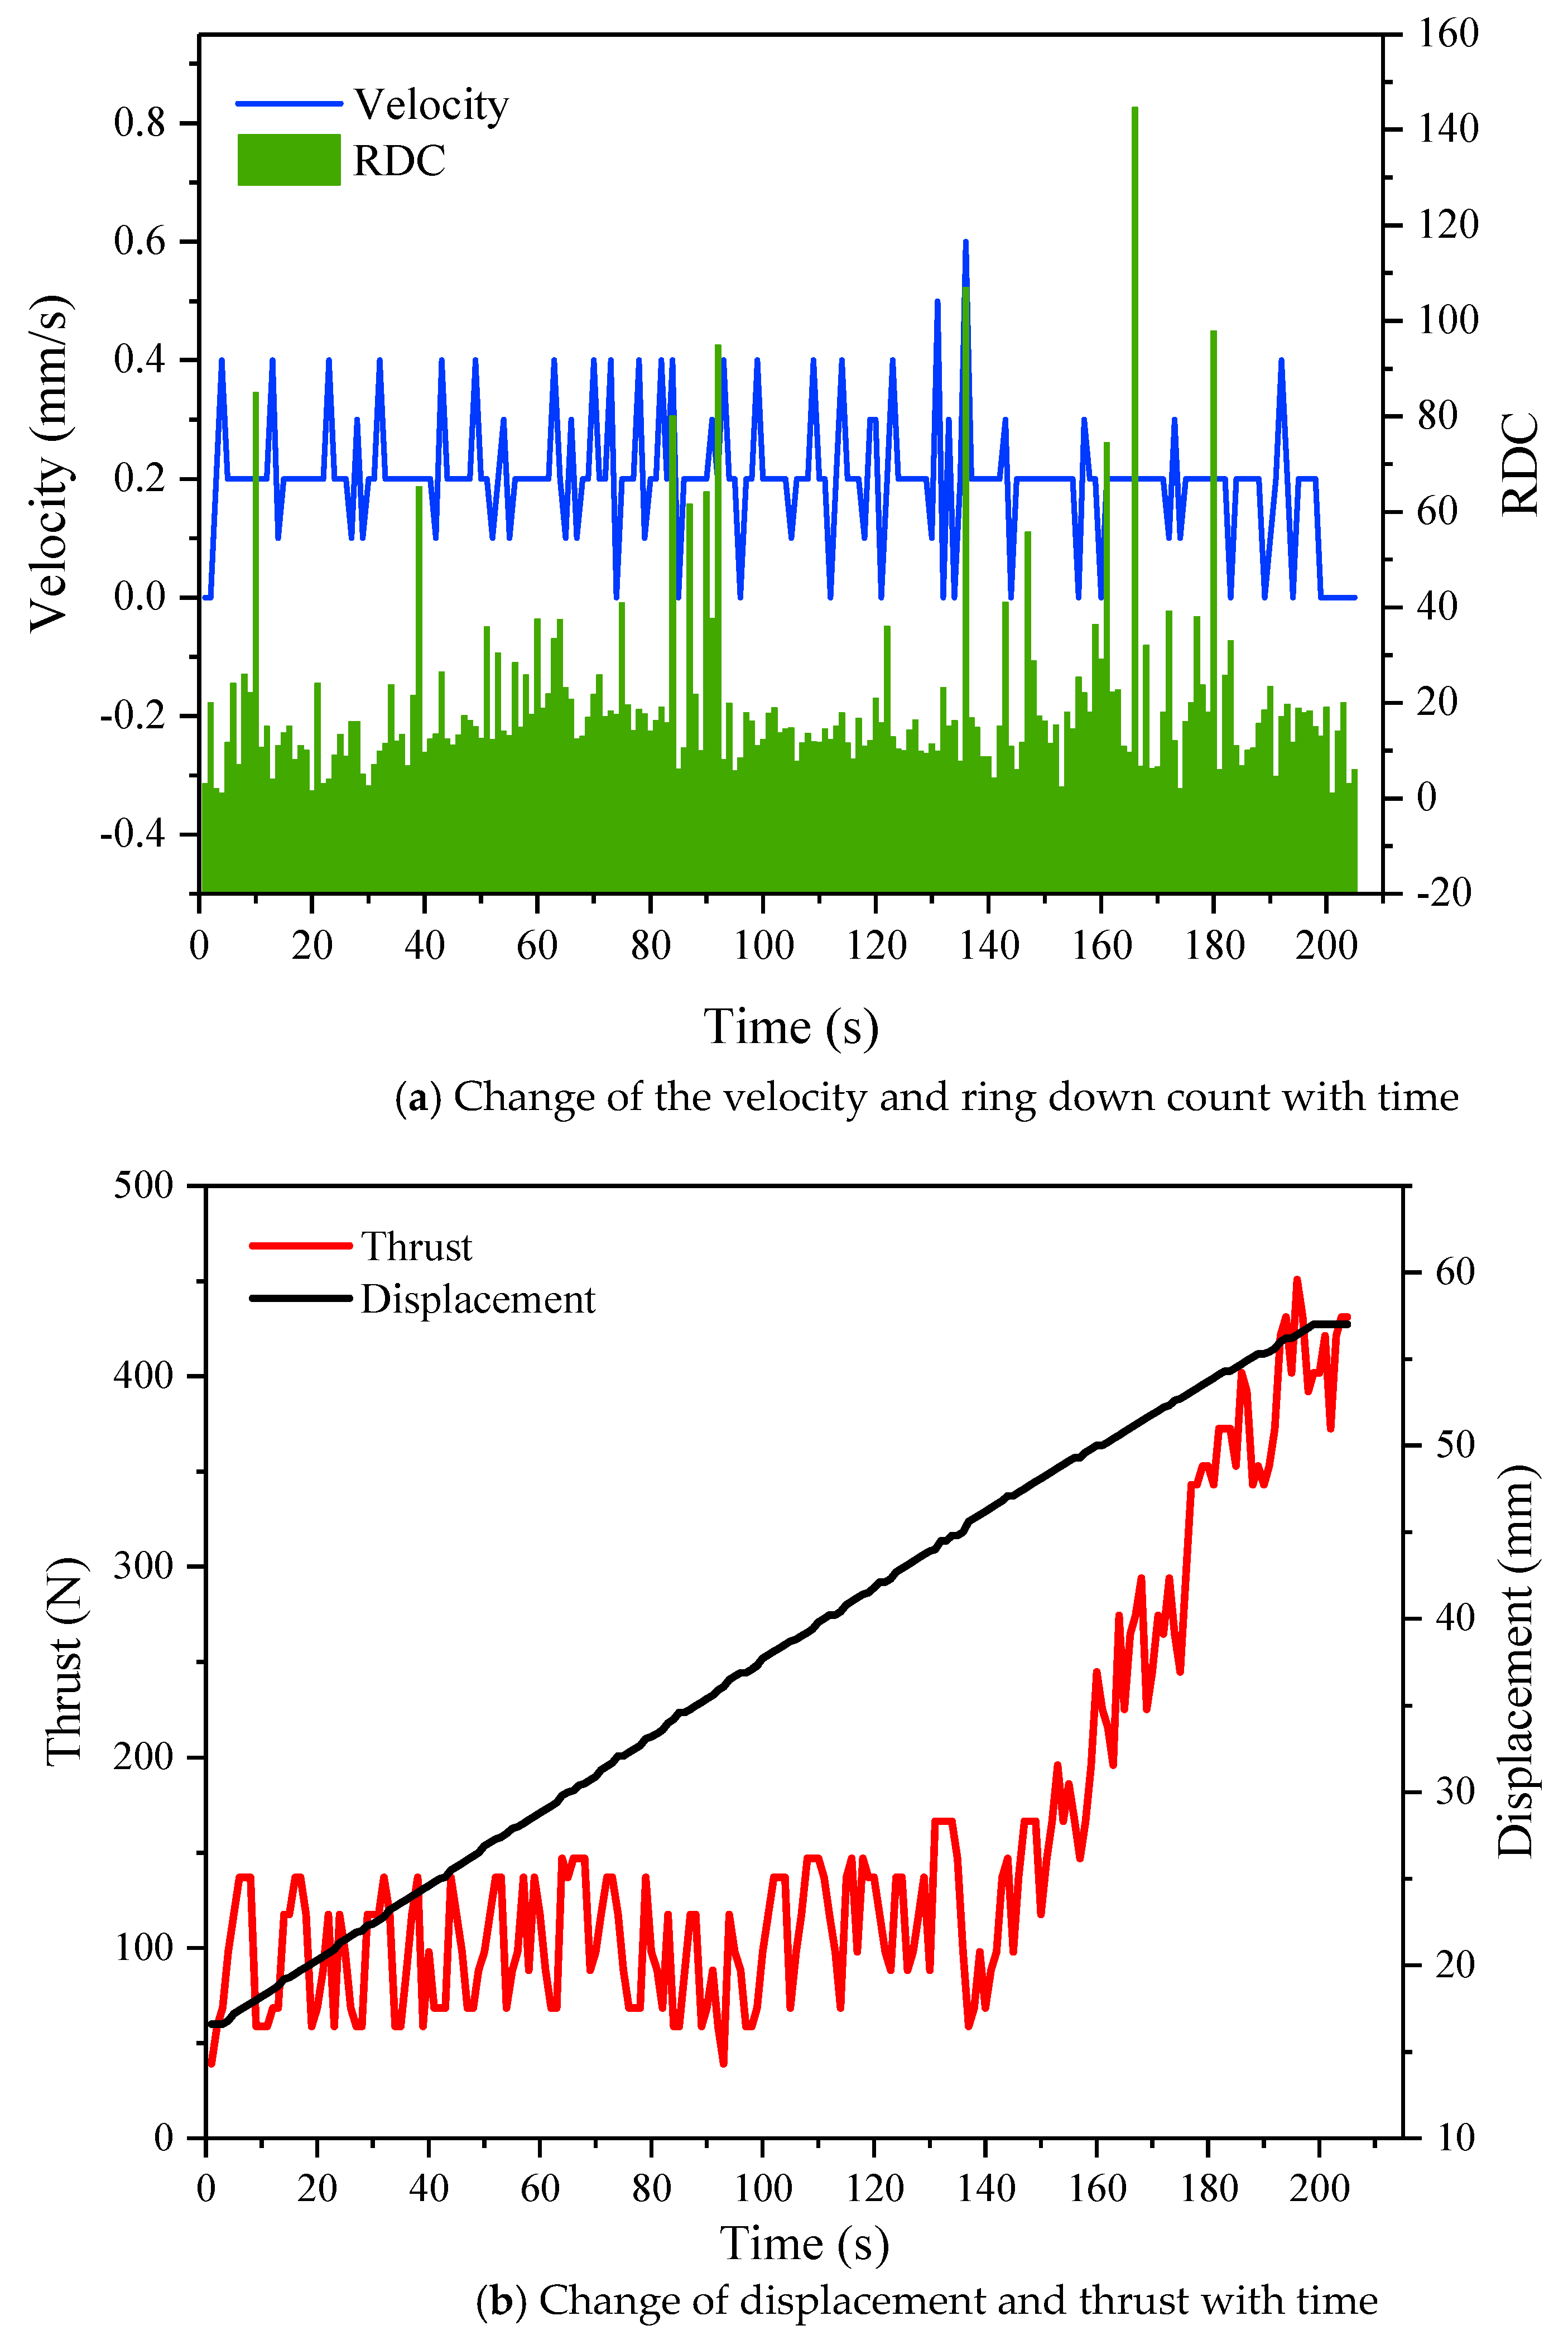
3.4. Sliding Velocity and Ring down Count

Figure 6 shows that the ring down count (RDC) responds to the strain of backfill materials during the experiment. The AE curve can be clearly divided into four stages: normal stage, normal-limit transition stage, limit stage and failure stage, which correspond to the initial constant deformation, constant-accelerating transition deformation, initial accelerating deformation and later accelerating deformation. Before 70 s, the sliding body is in initial constant deformation and the AE is in the normal stage; the velocity and RDC are both at a low level. The change scale of the velocity and RDC is small, and the two curves are relatively stable. At about 70 s, the sliding body changes from constant deformation to accelerating deformation, and AE changes from normal stage to limit stage. The velocity and RDC rise to a small extent synchronously. From 70 s to 80 s, the sliding body is in the initial accelerating deformation, and AE is in the limit state. This stage lasts for a short time, which is a sign of the landslide entering a dangerous state. At about 80 s, the sliding body enters into the later accelerating deformation, and AE goes through the failure stage. The velocity and RDC rise sharply and reach the peak value, and the slope is completely unstable.
The RDC directly responds to the change of sliding velocity; linear fitting is used to obtain a quantitative relationship. The fitting result is shown in Figure 7. RDC correlates strongly with sliding velocity under linear fitting, and R2 reaches 0.887. This means that the velocity of landslide can be derived from RDC, which is of great significance to the deformation monitoring of an on-site slope.

3.5. Sliding Displacement and Cumulative Ring down Count

Figure 8 shows cumulative RDC is in response to the change of sliding displacement. The trend of cumulative RDC and the displacement is very close, 70 s and 80 s are two turning points. Before 70 s, cumulative RDC and displacement increase slowly, and the two curves do not change significantly. From 70 s to 80 s, cumulative RDC and displacement have a short-term rise of small magnitude. After 80 s, cumulative RDC and displacement increase rapidly, and finally reach the peak value.
A second-degree polynomial fitting is adopted for cumulative RDC and the displacement, and the fitting result is shown in Figure 9. The correlation between the displacement and the cumulative RDC is strong, and R2 reaches 0.993.

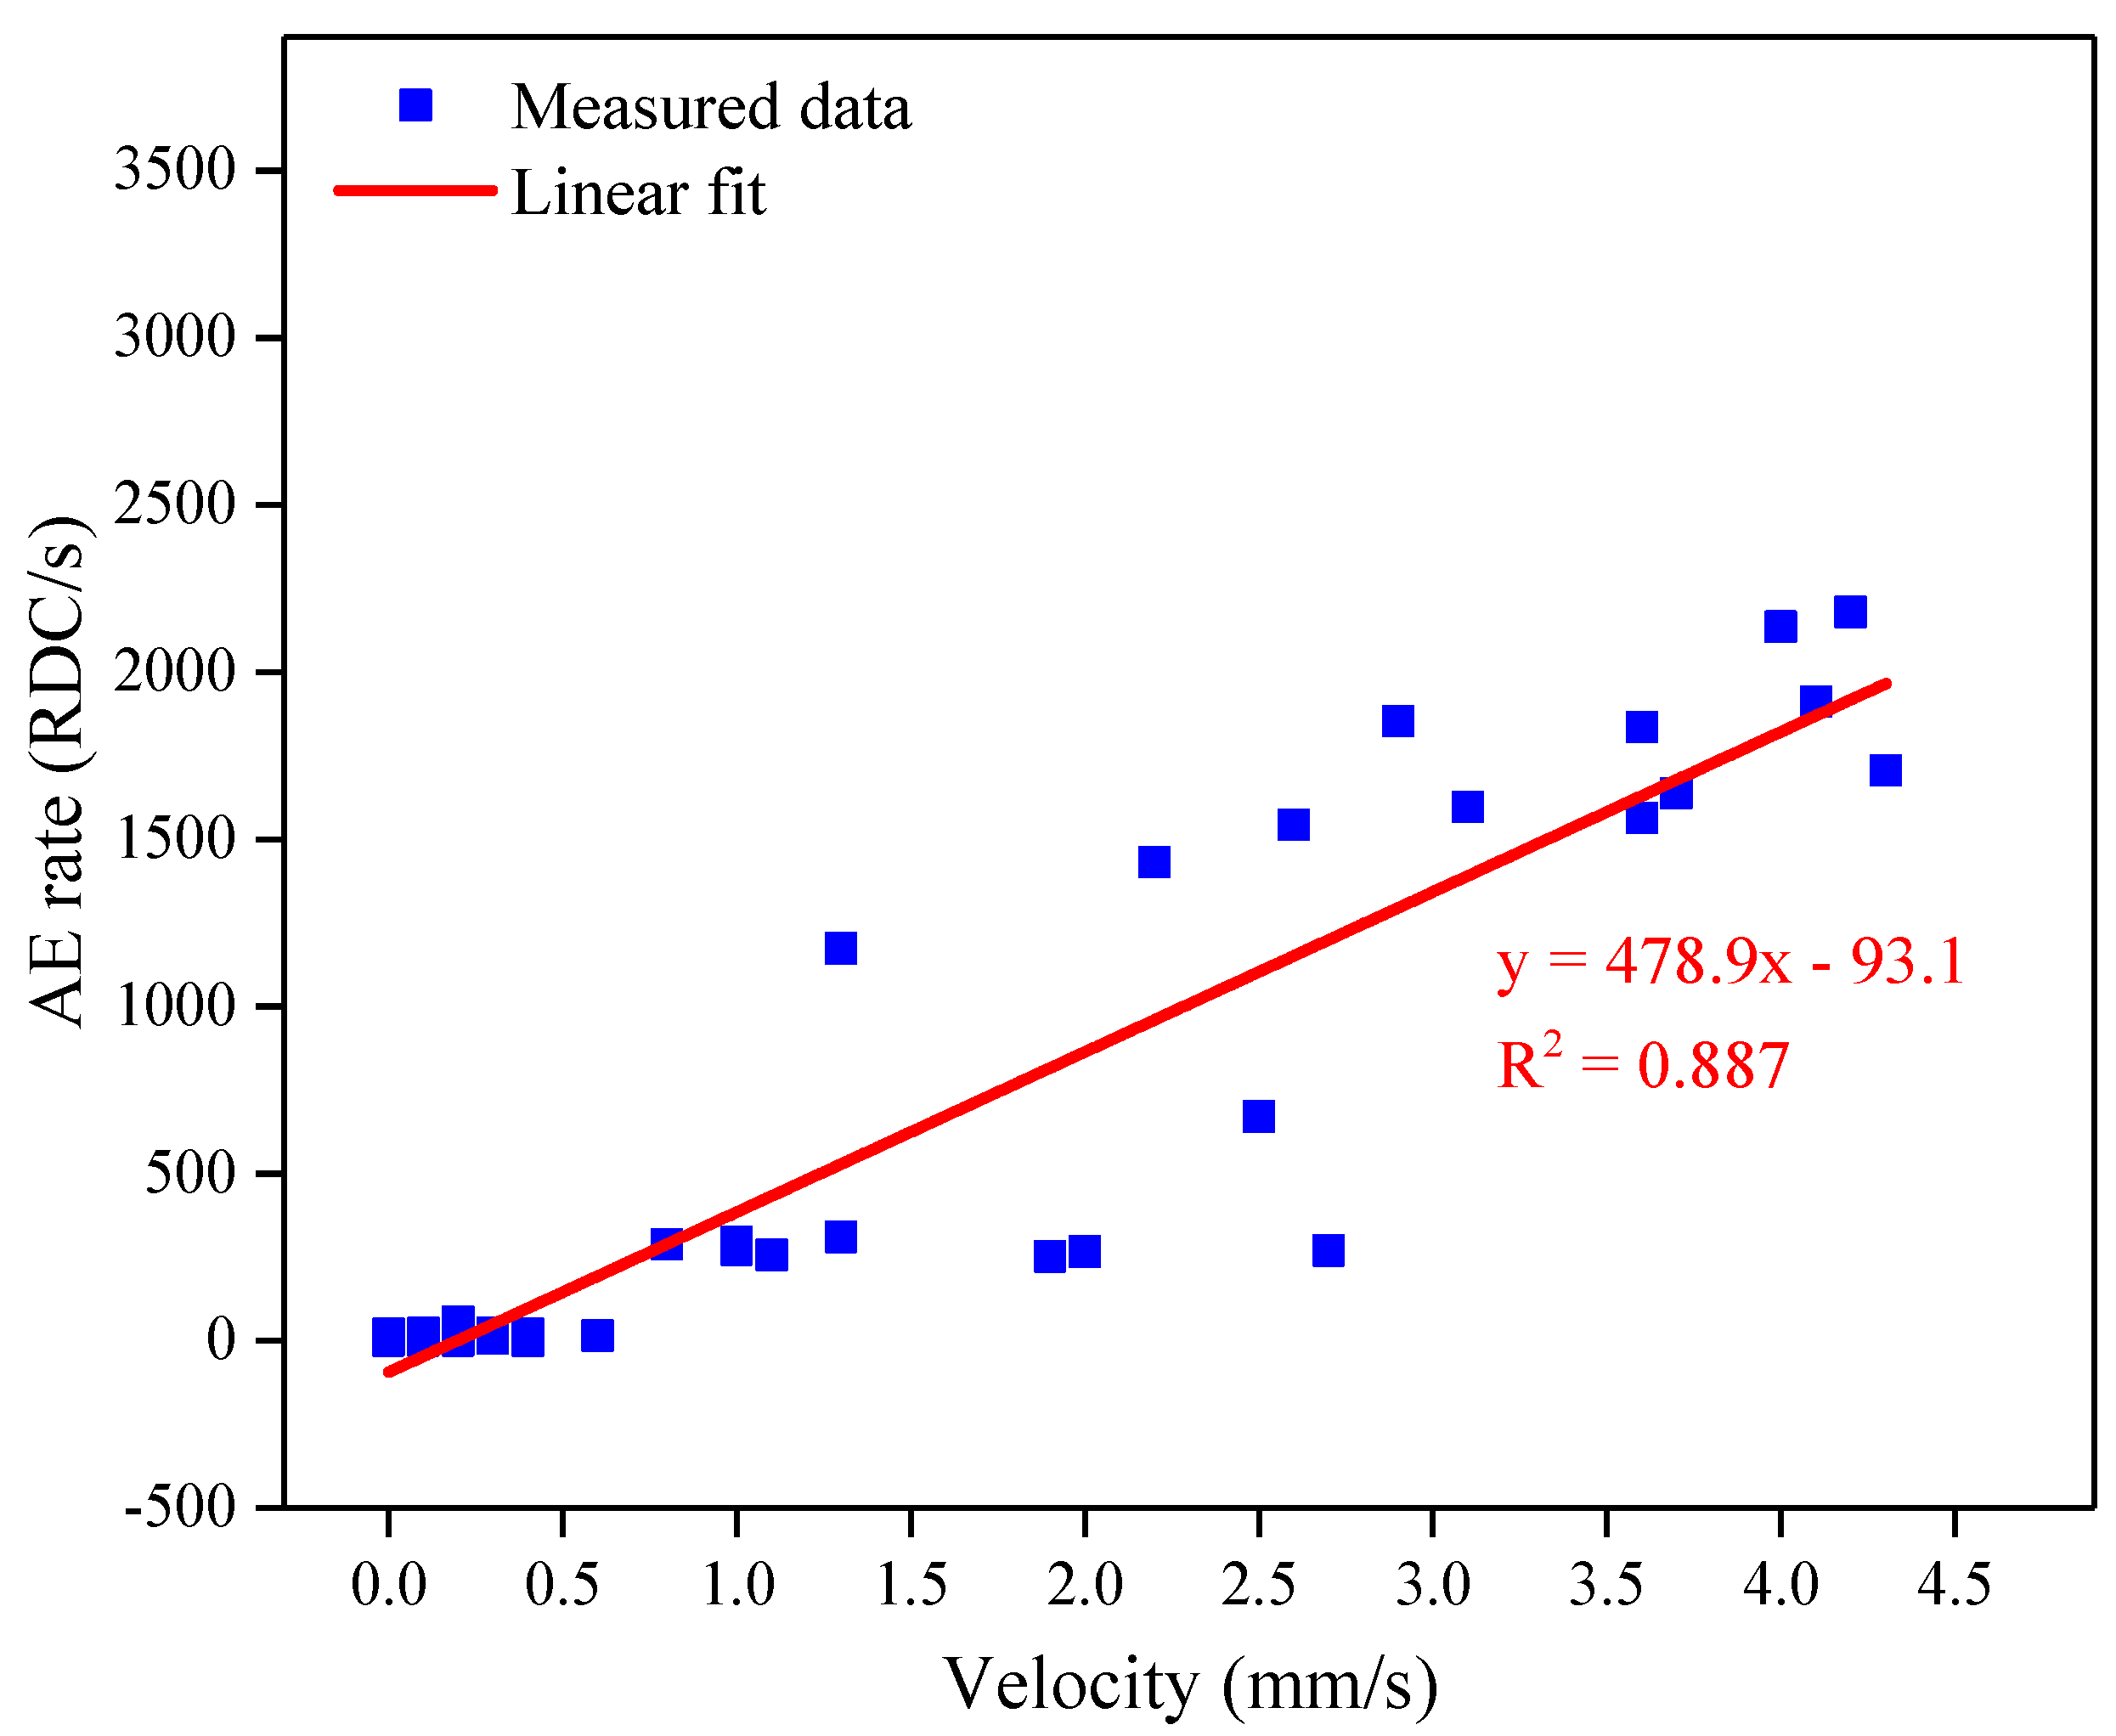
3.6. Performance of Deformation Quantification by Acoustic Emission

Section 3.4 “Sliding velocity and ring down count” and Section 3.5 “Sliding displacement and cumulative ring down count” confirm that AE measurement can be used to quantify slope deformation. In practical application, a standardized AE monitoring equipment can be used to acquire the sliding displacement. The derived displacement precision from AE measurement was explored by an additional experiment.
In the experiment, the iron box was set to move forward at a constant velocity of 0.2 mm/s and the results are shown in Figure 10a,b. The velocity curve shows a fluctuation state with 0.2 mm/s as its centre line, and the displacement curve shows a linear increase. Before 140 s, the thrust is constant at about 100 N, and RDC is also constant. After 140 s, the thrust suddenly rises since the movement of the iron box is significantly hindered by the anchor cable. The internal stress of backfill materials increases, and the RDC changes from constant state to slight increase. The displacement sensitivity is about 0.02 mm in terms of the experiment by multiplying the velocity (0.2 mm/s) and AE time resolution (0.1 s).

4. Discussion

Deformation is the most obvious and common monitoring parameter in the process of slope failure, which can reflect the disaster mechanism and evolution law of a landslide. The essence of slope instability lies in the broken balance between sliding force and anti-sliding force, and the stress generated in a slope is a parameter closer to the mechanics essence of the landslide [38]. The flexible anchor-like device designed in this study can simultaneously monitor the AE and axial tension. The measured AE parameters can directly quantify the slope deformation [28,29,32,33,37,40] and the axial tension within the anchor cable correlates well with the thrust to the sliding body. Data points in Figure 7 showed a wide variation, which is partially due to the choice of backfill material. Backfill materials could significantly influence the AE rate–landslide velocity relationship. Backfill of large, angular particles generated AE signal with the greatest magnitude and began producing detectable AE the earliest [29]. The position rearrangement of the granite gravel may lead to large pressure build up and sudden particle sliding events, which may cause unevenness in the transmission of the slope movement to the inner AE system. Otherwise, use of a fine-grained sand may produce a more even AE response without great magnitude and early detection. It is preferable to use large, angular particles considering signal attenuation and early warning needs in the field.
In terms of active AE waveguide and a large-deformation bolt, their feasibility for field installation and the reliability for landslide monitoring have been sufficiently investigated and extensively tested, respectively [8,23,24,25,27,28,38,39,41]. The proposed device integrates the structure of a large-deformation bolt into active waveguide. The novel device improved the mechanical structure of waveguides instead of conventional metal tubes. The flexible device with excellent resilience may endure large deformations during a landslide to sustainably monitor subsurface deformation. Furthermore, AE and mechanical parameters can be synchronously collected using one device and synthetically analysed. However, this device has not been applied in the field, and the reliability of the device needs to be validated further. Here is a conceptual anticipation to explain how it will be used in reality. When the flexible monitoring device is applied to the field, Figure 11 shows it is possible change during landslide process. Geological exploration and other means are needed before monitoring to determine the approximate position of a sliding surface in advance, so as to determine monitoring points at representative positions. The initial installation state of the device is shown in Figure 11a. With the deformation and movement of the sliding body, the anchor cable is subjected to the maximum earth pressure and bending moment at the sliding surface, resulting in the largest shear and bending deformation. When the anchor cable is tensioned, the metal head is pulled into the sleeve and moves along the axial direction, and the whole device has a tensile deformation. Due to the special structure of the proposed device, it is not easy to be sheared, stretched or bent even under a large deformation. The proposed device potentially has a larger measurement range and a longer service life, and thus it has strong adaptability and reliability to subsurface deformation monitoring.
The advantages of the proposed composite device lie in the simultaneous collection of AE and mechanical parameters, which can be compared and verified with each other. Then, comprehensive analysis can be carried out to obtain more objective state of the slope and to study the characteristic changes of the feature parameters in the whole landslide process. AE monitoring is very sensitive to the small change of displacement [27,28,29,33], which can detect the weak internal activity of the slope. AE parameters have obvious change characteristics, and have the potential to identify the critical sliding state in advance. Thus, AE technology may realize the early warning of a landslide, and play a significant role in disaster prevention and mitigation [25,28,29,34]. As for the mechanical measurement part, the ring dynamometer measures the axial tension within an anchor cable. According to the mechanical analysis [38], the determined relationship between the axial tension within an anchor cable and the sliding force of slope can be denoted by mathematical formula, and then the sliding force of the landslide can be roughly calculated. According to the increment of sliding force, the warning level can be divided to realize the monitoring and warning based on mechanical parameters.
Due to the limitation of the experimental equipment, the actual deformation of the landslide test does not reach a large deformation (i.e., >500 mm). The model test of the monitoring device has some differences compared to in-site landslide conditions and hence the significance of the experimental results should be further investigated in terms of the practical applicability. In addition, the accuracy and sensitivity of axial tension measurement are not high enough. The maximum velocity in the experiment is more than 4 mm/s which is beyond the velocity scale of catastrophic failure [42], and the effectiveness for an early warning system need to be further demonstrated. Moreover, a different deformation pattern of the rubber tube may occur regarding different depth of the tube buried below the sliding surface, which may lead to different AE behaviour and could affect the interpretation of the AE data for potential slope instability. AE was generated by shear deformation and the need to be recorded continuously in the case of long-term monitoring in order to enable proper information on the displacement magnitude. This operation may place some stress on the data recording and transmission system. However, this problem can be addressed through wake-up technology for an AE recording module triggering by slight subsurface deformation. All in all, there are still some problems to be explored in future research for the general application of the proposed flexible monitoring device.

5. Conclusions

A method of integrated monitoring using AE and mechanical technology is proposed to improve existing subsurface measurement of a soil slope. The flexible monitoring device shows good resilience in face of tensile and bending resistance. The main conclusions are as follows:
(1) The proposed flexible monitoring device can not only monitor AE during a landslide process, but also measures the axial tension within the anchor cable. These two parameters are related to slope deformation and local stress, which can be collected using one flexible device.
(2) The three-stage landslide experiment suggests that the axial tension within the anchor cable and the thrust to the slope change almost synchronously. The correlation is strong between slope deformation and generated AE.
(3) The precision of AE technology used for deformation quantification can be realized at sub-millimetre level. The proposed monitoring device also plays an important role in stabilizing the slope because of the anchor cable.

Author Contributions

All of the authors contributed to the development of this study, led by L.D. who designed the concept and carried out the analysis of the results. The manuscript was partly written by Y.C. and K.L. M.Y. processed the data. H.Y., J.C., M.F. and T.C. edited and approved the manuscript. All authors have read and agreed to the published version of the manuscript.

Funding

This research was funded by the National Key Research and Development Program of China (No. 2018YFC0810205, No. 2018YFC0809900, No. 2018YFC0806900 and No. 2018YFC0807000), the Key Research and Development Program of Anhui Province (Grant No. 202104b11020021), and the Anhui Provincial Natural Science Foundation for Distinguished Young Scholars (Grant No. 1908085J22).

Data Availability Statement

Data sharing not applicable.

Acknowledgments

The authors would like to express their gratitude to the support of the National Key Research and Development Program of China (No. 2018YFC0810205, No. 2018YFC0809900, No. 2018YFC0806900 and No. 2018YFC0807000), the Key Research and Development Program of Anhui Province (Grant No. 202104b11020021), and the Anhui Provincial Natural Science Foundation for Distinguished Young Scholars (Grant No. 1908085J22). We thank the reviewers and editors for their excellent work and valuable suggestions.

Conflicts of Interest

The authors declare no conflict of interest.

References

  1. Palmer, J. Creeping Catastrophes. Nature 2017, 548, 384–386. [Google Scholar] [CrossRef] [PubMed]
  2. AghaKouchak, A.; Huning, L.S.; Mazdiyasni, O.; Mallakpour, I.; Chiang, F.; Sadegh, M.; Vahedifard, F.; Moftakhari, H. How do natural hazards cascade to cause disasters? Nature 2018, 561, 458–460. [Google Scholar] [CrossRef] [Green Version]
  3. Chuang, Y.-C.; Shiu, Y.-S. Relationship between landslides and mountain development—Integrating geospatial statistics and a new long-term database. Sci. Total Environ. 2018, 622–623, 1265–1276. [Google Scholar] [CrossRef]
  4. Froude, M.J.; Petley, D.N. Global fatal landslide occurrence from 2004 to 2016. Nat. Hazards Earth Syst. Sci. 2018, 18, 2161–2181. [Google Scholar] [CrossRef] [Green Version]
  5. Reichenbach, P.; Rossi, M.; Malamud, B.D.; Mihir, M.; Guzzetti, F. A review of statistically-based landslide susceptibility models. Earth-Sci. Rev. 2018, 180, 60–91. [Google Scholar] [CrossRef]
  6. Hu, X.-D.; Hu, K.-H.; Zhang, X.-P.; Wei, L.; Tang, J.-B. Quantitative assessment of the impact of earthquake-induced geohazards on natural landscapes in Jiuzhaigou Valley. J. Mt. Sci. 2019, 16, 441–452. [Google Scholar] [CrossRef]
  7. Zhang, X.; Song, J.; Peng, J.; Wu, J. Landslides-oriented urban disaster resilience assessment—A case study in ShenZhen, China. Sci. Total Environ. 2019, 661, 95–106. [Google Scholar] [CrossRef] [PubMed]
  8. Smith, A.; Dixon, N. Quantification of landslide velocity from active waveguide–generated acoustic emission. Can. Geotech. J. 2015, 52, 413–425. [Google Scholar] [CrossRef] [Green Version]
  9. Smethurst, J.A.; Smith, A.; Uhlemann, S.; Wooff, C.; Chambers, J.; Hughes, P.; Lenart, S.; Saroglou, H.; Springman, S.M.; Löfroth, H.; et al. Current and future role of instrumentation and monitoring in the performance of transport infrastructure slopes. Q. J. Eng. Geol. Hydrogeol. 2017, 50, 271–286. [Google Scholar] [CrossRef] [Green Version]
  10. Wasowski, J.; Bovenga, F. Investigating landslides and unstable slopes with satellite Multi Temporal Interferometry: Current issues and future perspectives. Eng. Geol. 2014, 174, 103–138. [Google Scholar] [CrossRef]
  11. Frattini, P.; Crosta, G.B.; Rossini, M.; Allievi, J. Activity and kinematic behaviour of deep-seated landslides from PS-InSAR displacement rate measurements. Landslides 2018, 15, 1053–1070. [Google Scholar] [CrossRef]
  12. Wasowski, J.; Pisano, L. Long-term InSAR, borehole inclinometer, and rainfall records provide insight into the mechanism and activity patterns of an extremely slow urbanized landslide. Landslides 2019, 17, 445–457. [Google Scholar] [CrossRef]
  13. Li, Y.; Huang, J.; Jiang, S.-H.; Huang, F.; Chang, Z. A web-based GPS system for displacement monitoring and failure mechanism analysis of reservoir landslide. Sci. Rep. 2017, 7, 17171. [Google Scholar] [CrossRef] [Green Version]
  14. Syahmi, M.Z.; Aziz, W.W.; Zulkarnaini, M.A.; Anuar, A.; Othman, Z. The movement detection on the landslide surface by using Terrestrial Laser Scanning. In Proceedings of the 2011 IEEE Control and System Graduate Research Colloquium, Shah Alam, Malaysia, 27–28 June 2011; pp. 175–180. [Google Scholar]
  15. Smith, A. Quantification of Slope Deformation Behaviour Using Acoustic Emission Monitoring; Loughborough University: Loughborough, UK, 2015. [Google Scholar]
  16. Zheng, Y.; Zhu, Z.-W.; Li, W.-J.; Gu, D.-M.; Xiao, W. Experimental research on a novel optic fiber sensor based on OTDR for landslide monitoring. Measurement 2019, 148, 106926. [Google Scholar] [CrossRef]
  17. Uhlemann, S.; Smith, A.; Chambers, J.; Dixon, N.; Dijkstra, T.; Haslam, E.; Meldrum, P.; Merritt, A.; Gunn, D.; Mackay, J. Assessment of ground-based monitoring techniques applied to landslide investigations. Geomorphology 2016, 253, 438–451. [Google Scholar] [CrossRef] [Green Version]
  18. Pei, H.; Jing, J.; Zhang, S. Experimental study on a new FBG-based and Terfenol-D inclinometer for slope displacement monitoring. Measurement 2020, 151, 107172. [Google Scholar] [CrossRef]
  19. Zhou, Y.; Dongjian, Z.; Zhuoyan, C.; Yongtao, L. Research on a novel inclinometer based on distributed optical fiber strain and conjugate beam method. Measurement 2020, 153, 107404. [Google Scholar] [CrossRef]
  20. Stark, T.D.; Choi, H. Slope inclinometers for landslides. Landslides 2008, 5, 339–350. [Google Scholar] [CrossRef]
  21. Green, G.; Mikkelsen, P. Measurement of ground movement with inclinometers. In Proceedings of the Fourth International Geotechnical Seminar on Field Instrumentation and In-Situ Measurement, Singapore, 25–27 November 1986; pp. 235–246. [Google Scholar]
  22. Dasenbrock, D. Performance observations of MEMS ShapeAccelArray (SAA) deformation sensors. Geotech. Instrum. News 2014, 32, 23–26. [Google Scholar]
  23. Dixon, N.; Smith, A.; Spriggs, M.; Ridley, A.; Meldrum, P.; Haslam, E. Stability monitoring of a rail slope using acoustic emission. Proc. Inst. Civ. Eng. Geotech. Eng. 2015, 168, 373–384. [Google Scholar] [CrossRef] [Green Version]
  24. Koerner, R.M.; McCabe, W.M.; Lord, A.E. Acoustic Emission Behavior and Monitoring of Soils; ASTM Special Technical Publications: West Conshohocken, PA, USA, 1981; Volume 49. [Google Scholar]
  25. Dixon, N.; Smith, A.; Flint, J.A.; Khanna, R.; Clark, B.; Andjelkovic, M. An acoustic emission landslide early warning system for communities in low-income and middle-income countries. Landslides 2018, 15, 1631–1644. [Google Scholar] [CrossRef] [Green Version]
  26. Matsuura, S.; Asano, S.; Okamoto, T. Relationship between rain and/or meltwater, pore-water pressure and displacement of a reactivated landslide. Eng. Geol. 2008, 101, 49–59. [Google Scholar] [CrossRef]
  27. Berg, N.; Smith, A.; Russell, S.; Dixon, N.; Proudfoot, D.; Take, W.A. Correlation of acoustic emissions with patterns of movement in an extremely slow-moving landslide at Peace River, Alberta, Canada. Can. Geotech. J. 2018, 55, 1475–1488. [Google Scholar] [CrossRef] [Green Version]
  28. Smith, A.; Dixon, N.; Meldrum, P.; Haslam, E.; Chambers, J. Acoustic emission monitoring of a soil slope: Comparisons with continuous deformation measurements. Géotech. Lett. 2014, 4, 255–261. [Google Scholar] [CrossRef] [Green Version]
  29. Smith, A.; Dixon, N.; Fowmes, G.J. Early detection of first-time slope failures using acoustic emission measurements: Large-scale physical modelling. Géotechnique 2017, 67, 138–152. [Google Scholar] [CrossRef] [Green Version]
  30. Abdoun, T.; Bennett, V.; Desrosiers, T.; Simm, J.; Barendse, M. Asset Management and Safety Assessment of Levees and Earthen Dams Through Comprehensive Real-Time Field Monitoring. Geotech. Geol. Eng. 2013, 31, 833–843. [Google Scholar] [CrossRef]
  31. Smith, A.; Moore, I.D.; Dixon, N. Acoustic Emission Sensing of Pipe–Soil Interaction: Full-Scale Pipelines Subjected to Differential Ground Movements. J. Geotech. Geoenviron. Eng. 2019, 145, 04019113. [Google Scholar] [CrossRef] [Green Version]
  32. Dixon, N.; Spriggs, M. Quantification of slope displacement rates using acoustic emission monitoring. Can. Geotech. J. 2007, 44, 966–976. [Google Scholar] [CrossRef] [Green Version]
  33. Dixon, N.; Spriggs, M.P.; Smith, A.; Meldrum, P.; Haslam, E. Quantification of reactivated landslide behaviour using acoustic emission monitoring. Landslides 2014, 12, 549–560. [Google Scholar] [CrossRef] [Green Version]
  34. Codeglia, D.; Dixon, N.; Fowmes, G.J.; Marcato, G. Analysis of acoustic emission patterns for monitoring of rock slope deformation mechanisms. Eng. Geol. 2017, 219, 21–31. [Google Scholar] [CrossRef] [Green Version]
  35. Codeglia, D.; Dixon, N.; Fowmes, G.J.; Marcato, G. Strategies for rock slope failure early warning using acoustic emission monitoring. In IOP Conference Series: Earth and Environmental Science; IOP Publishing: Bristol, UK, 2015; Volume 26, p. 012028. [Google Scholar] [CrossRef]
  36. Smith, A.; Dixon, N.; Fowmes, G. Monitoring buried pipe deformation using acoustic emission: Quantification of attenuation. Int. J. Geotech. Eng. 2017, 11, 418–430. [Google Scholar] [CrossRef] [Green Version]
  37. Deng, L.; Yuan, H.; Chen, J.; Sun, Z.; Fu, M.; Zhou, Y.; Yan, S.; Zhang, Z.; Chen, T. Experimental investigation on progressive deformation of soil slope using acoustic emission monitoring. Eng. Geol. 2019, 261, 105295. [Google Scholar] [CrossRef]
  38. He, M.; Gong, W.; Wang, J.; Qi, P.; Tao, Z.; Du, S.; Peng, Y. Development of a novel energy-absorbing bolt with extraordinarily large elongation and constant resistance. Int. J. Rock Mech. Min. Sci. 2014, 67, 29–42. [Google Scholar] [CrossRef]
  39. He, M.; Xia, H.; Jia, X.; Gong, W.; Zhao, F.; Liang, K. Studies on classification, criteria and control of rockbursts. J. Rock Mech. Geotech. Eng. 2012, 4, 97–114. [Google Scholar] [CrossRef] [Green Version]
  40. Smith, A.; Dixon, N. Acoustic emission behaviour of dense sands. Géotechnique 2019, 69, 1107–1122. [Google Scholar] [CrossRef]
  41. Smith, A.; Dixon, N.; Moore, R.; Meldrum, P. Photographic feature: Acoustic emission monitoring of coastal slopes in NE England, UK. Q. J. Eng. Geol. Hydrogeol. 2017, 50, 239–244. [Google Scholar] [CrossRef] [Green Version]
  42. Cruden, D.M.; Varnes, D.J. Landslide Types and Processes. In Landslides: Investigation and Mitigation, Special Report 247-Transportation Research Board; Turner, A.K., Schuster, R.L., Eds.; National Research Council; National Academy Press: Washington, DC, USA, 1996; pp. 36–75. [Google Scholar]
Figure 1. Flexible device for slope subsurface monitoring. 1: sleeve with inner wall threaded, 2: anchor cable, 3: conical metal head, 4: rubber tube, 5: backfill materials, 6: acoustic emission transducer, 7: ring dynamometer, 8: pedestal, 9: nut, 10: anchoring end.
Applsci 11 07173 g001
Figure 2. (a,b) are lateral view and top view photographs of landslide experiment system. (c) is the force analysis diagram of flexible device; F1 represents the thrust applied to the rubber tube, F2 denotes the upward axial tension to the sleeve, F3 represents the lateral resistance of the anchor cable from the anchorage, F4 denotes the downward binding force from the anchorage to the anchor cable.
Applsci 11 07173 g002
Figure 3. Displacement, velocity and acceleration of sliding body plotted against time.
Applsci 11 07173 g003
Figure 4. Thrust to sliding body and axial tension within anchor cable plotted against time. Thrust was the force applied to the moving part of the shear box measured with a mechanical transducer. The experiment process was controlled by displacement and thrust showed constant in the first part of the experiment and increased at a certain stage.
Applsci 11 07173 g004
Figure 5. Thrust and acceleration plotted against time with smoothed data.
Applsci 11 07173 g005
Figure 6. Sliding velocity and ring down count plotted against time.
Applsci 11 07173 g006
Figure 7. Linear fitting of sliding velocity and ring down count.
Applsci 11 07173 g007
Figure 8. Sliding displacement and cumulative ring down count (RDC) plotted against time.
Applsci 11 07173 g008
Figure 9. Polynomial fitting of sliding displacement and cumulative RDC.
Applsci 11 07173 g009
Figure 10. Precision analysis of deformation quantification by acoustic emission under the condition of constant velocity of the sliding body.
Applsci 11 07173 g010
Figure 11. Schematic diagram for the change of flexible device during landslide process.
Applsci 11 07173 g011
Table 1. Comparison of three subsurface devices for slope monitoring.
RangePrecisionCost
ShapeAccelArray (SAA)hundreds of millimetres [23]±1.5 mm per 30 m [30]very high
Inclinometer<50 mm [23]±0.01 mm per 500 mmhigh
Acoustic emission (AE)>400 mm [23]0.0001 mm/h to more than 400 mm/h [31]low
Table 2. Properties of backfill material.
DescriptionParticle SizePacking
Size Range (mm)Coefficient of UniformityParticle Density (mg·m−3)Dry Density (mg·m−3)Void Ratio
Granite gravel4.1–7.41.812.671.630.72
Publisher’s Note: MDPI stays neutral with regard to jurisdictional claims in published maps and institutional affiliations.

