Abstract
We experimentally and theoretically investigated the optimal condition of polarization spectroscopy for frequency stabilization on various pump beam intensities and vapor cell temperatures for the D closed transition line of Rb atoms. We compared the experimental results, such as the amplitude, width, and slope, of the polarization spectroscopy signal with the theoretical results obtained from the numerical calculation of temporal density matrix equations. Based on the results, we found the optimal parameters, such as the pump beam intensity and vapor cell temperature, for polarization spectroscopy. The theoretically expected optimal parameters were, qualitatively, in good agreement with the experimental results.
PACS:
32.30.-r; 42.62.Fi; 32.70.Jz
1. Introduction
Many atomic, molecular, and optical physicists use laser spectroscopy to stabilize the laser frequency in their studies concerning laser cooling and the trapping of neutral-atoms and ions, metrology, atomic clock, quantum simulation with ultracold atoms, etc. The most commonly used laser spectroscopic systems are saturated absorption spectroscopy (SAS) [1,2,3,4], polarization spectroscopy (PS) [5,6,7], dichroic atomic vapor laser lock (DAVLL) [8,9], sub-Doppler DAVLL [10,11,12,13], modulation transfer spectroscopy (MTS) [14,15,16], and frequency modulation spectroscopy (FMS) [17,18,19]; of these, PS can directly obtain a dispersive-like signal through the differential signal of a photodetector. It is the most inexpensive spectroscopic system that can be used for laser frequency stabilization because it requires fewer electronics. Sun et al. experimentally reported optimal parameters such as the vapor cell temperature and pump beam power of PS for rubidium D lines [20]. However, the experimental results were not compared against theoretical results and were not analyzed as well [6].
In this work, we theoretically investigated the optimal temperature and pump beam power to improve the lock performance of PS for the D, closed transition line of Rb atoms. This work is especially invaluable for quantum atomic gravimeters that use the closed transition line of Rb atoms for frequency stabilization [21,22,23,24]. The lock performance was theoretically estimated by the lower limit of the laser frequency uncertainty , given by the following:
where and S are the locking slope and peak-to-peak amplitude of the PS signal, respectively; is the laser frequency of locking; N is the residual noise; and is the frequency locking range, which is the distance between the peak and valley of the locking slope [25]. We investigated the change in the PS signal under various vapor cell temperatures and pump beam powers that satisfy the lower limit of the laser frequency uncertainty, and where and S are insensitive to fluctuations in the temperature and pump beam power. We compared the experimental results, such as the amplitude, width, and slope of the PS signal, with the theoretical results obtained from numerical calculations of the temporal density matrix equations. The theoretically expected results were, qualitatively, in good agreement with the experimental results.
2. Experimental Setup
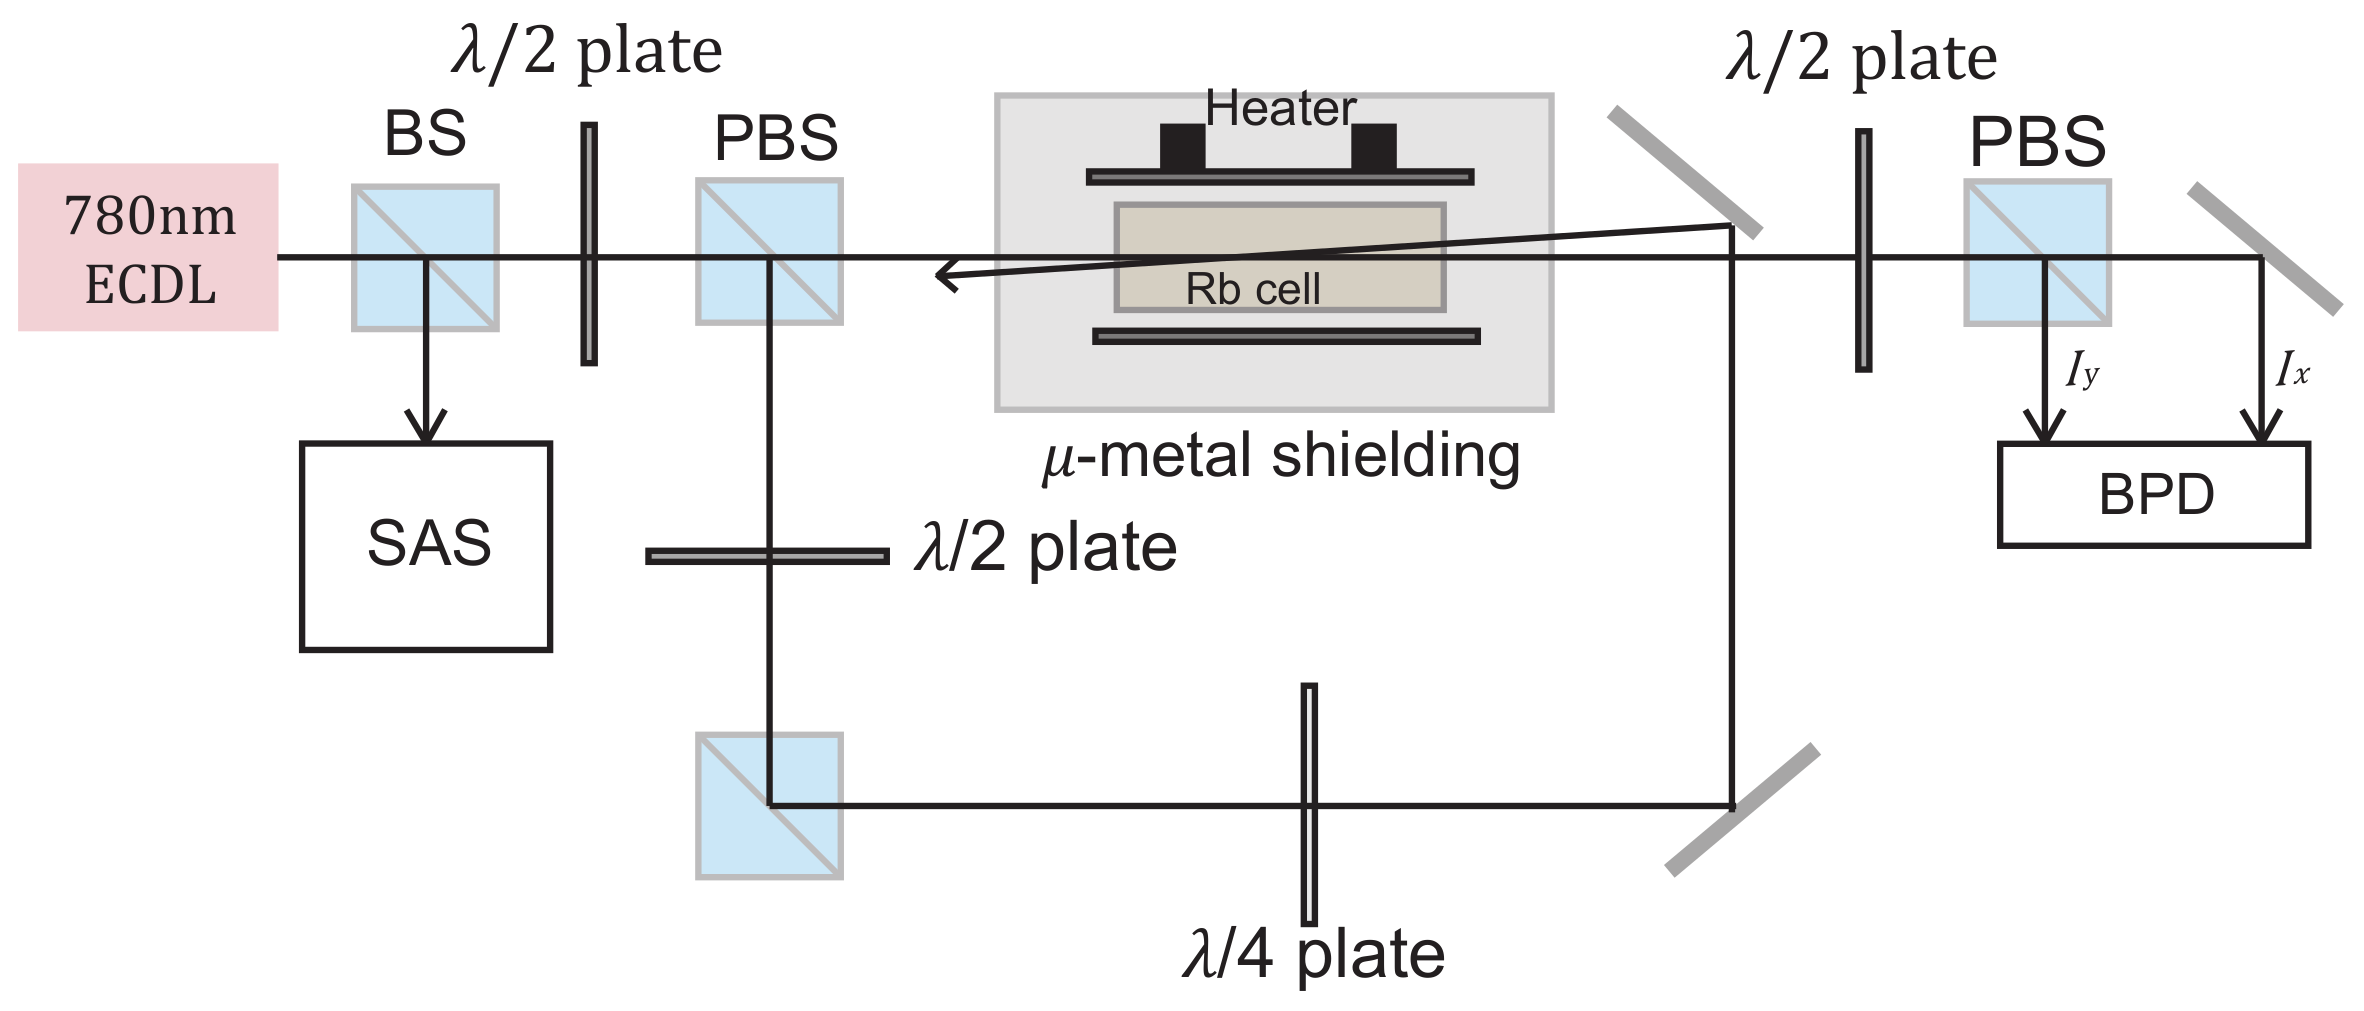
Figure 1 shows the typical PS experimental setup. An external cavity diode laser (ECDL, Toptica, DL100) was used to generate a coherent light with a wavelength of 780 nm. The laser beam was divided into two beams through a beam splitter (BS) installed in front of the ECDL. A SAS setup was installed to check the transition line of Rb atoms on one side, and a PS setup was configured on the other side. Through a half-wave plate and a polarizing beam splitter (PBS), the intensities of the probe and pump beams were adjusted to pass through the vapor cell in opposite directions, and a quarter-wave plate was used to make the circularly polarized pump beam. The temperature of the vapor cell was controlled using a temperature controller (Thorlabs, GCH25-75), and the Earth’s magnetic field was shielded by surrounding the cell with three-layers of -metal sheets.
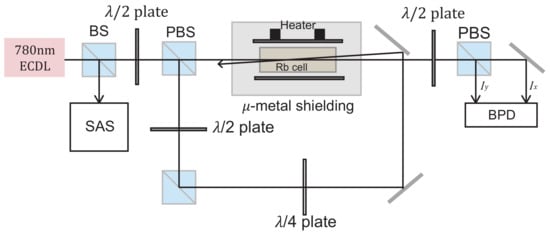
Figure 1.
Experimental setup for polarization spectroscopy. External cavity diode laser (ECDL), saturated absorption spectroscopy (SAS), polarizing beam splitter (PBS), beam splitter (BS), and balanced photo detector (BPD).
The probe beam passing through the vapor cell was divided into two beams using PBS. This makes the differential signal (, Equation (2)) of the two beams exactly zero without the incident of the pump beam into the vapor cell. Additionally, a dispersion signal was obtained through a balanced photodetector (Thorlabs, PDB210C) when the polarized pump beam was incident. The radius of the laser beams was 0.8 mm, and the peak intensity of the probe beam () was 1.6 mW/cm.
3. Theory
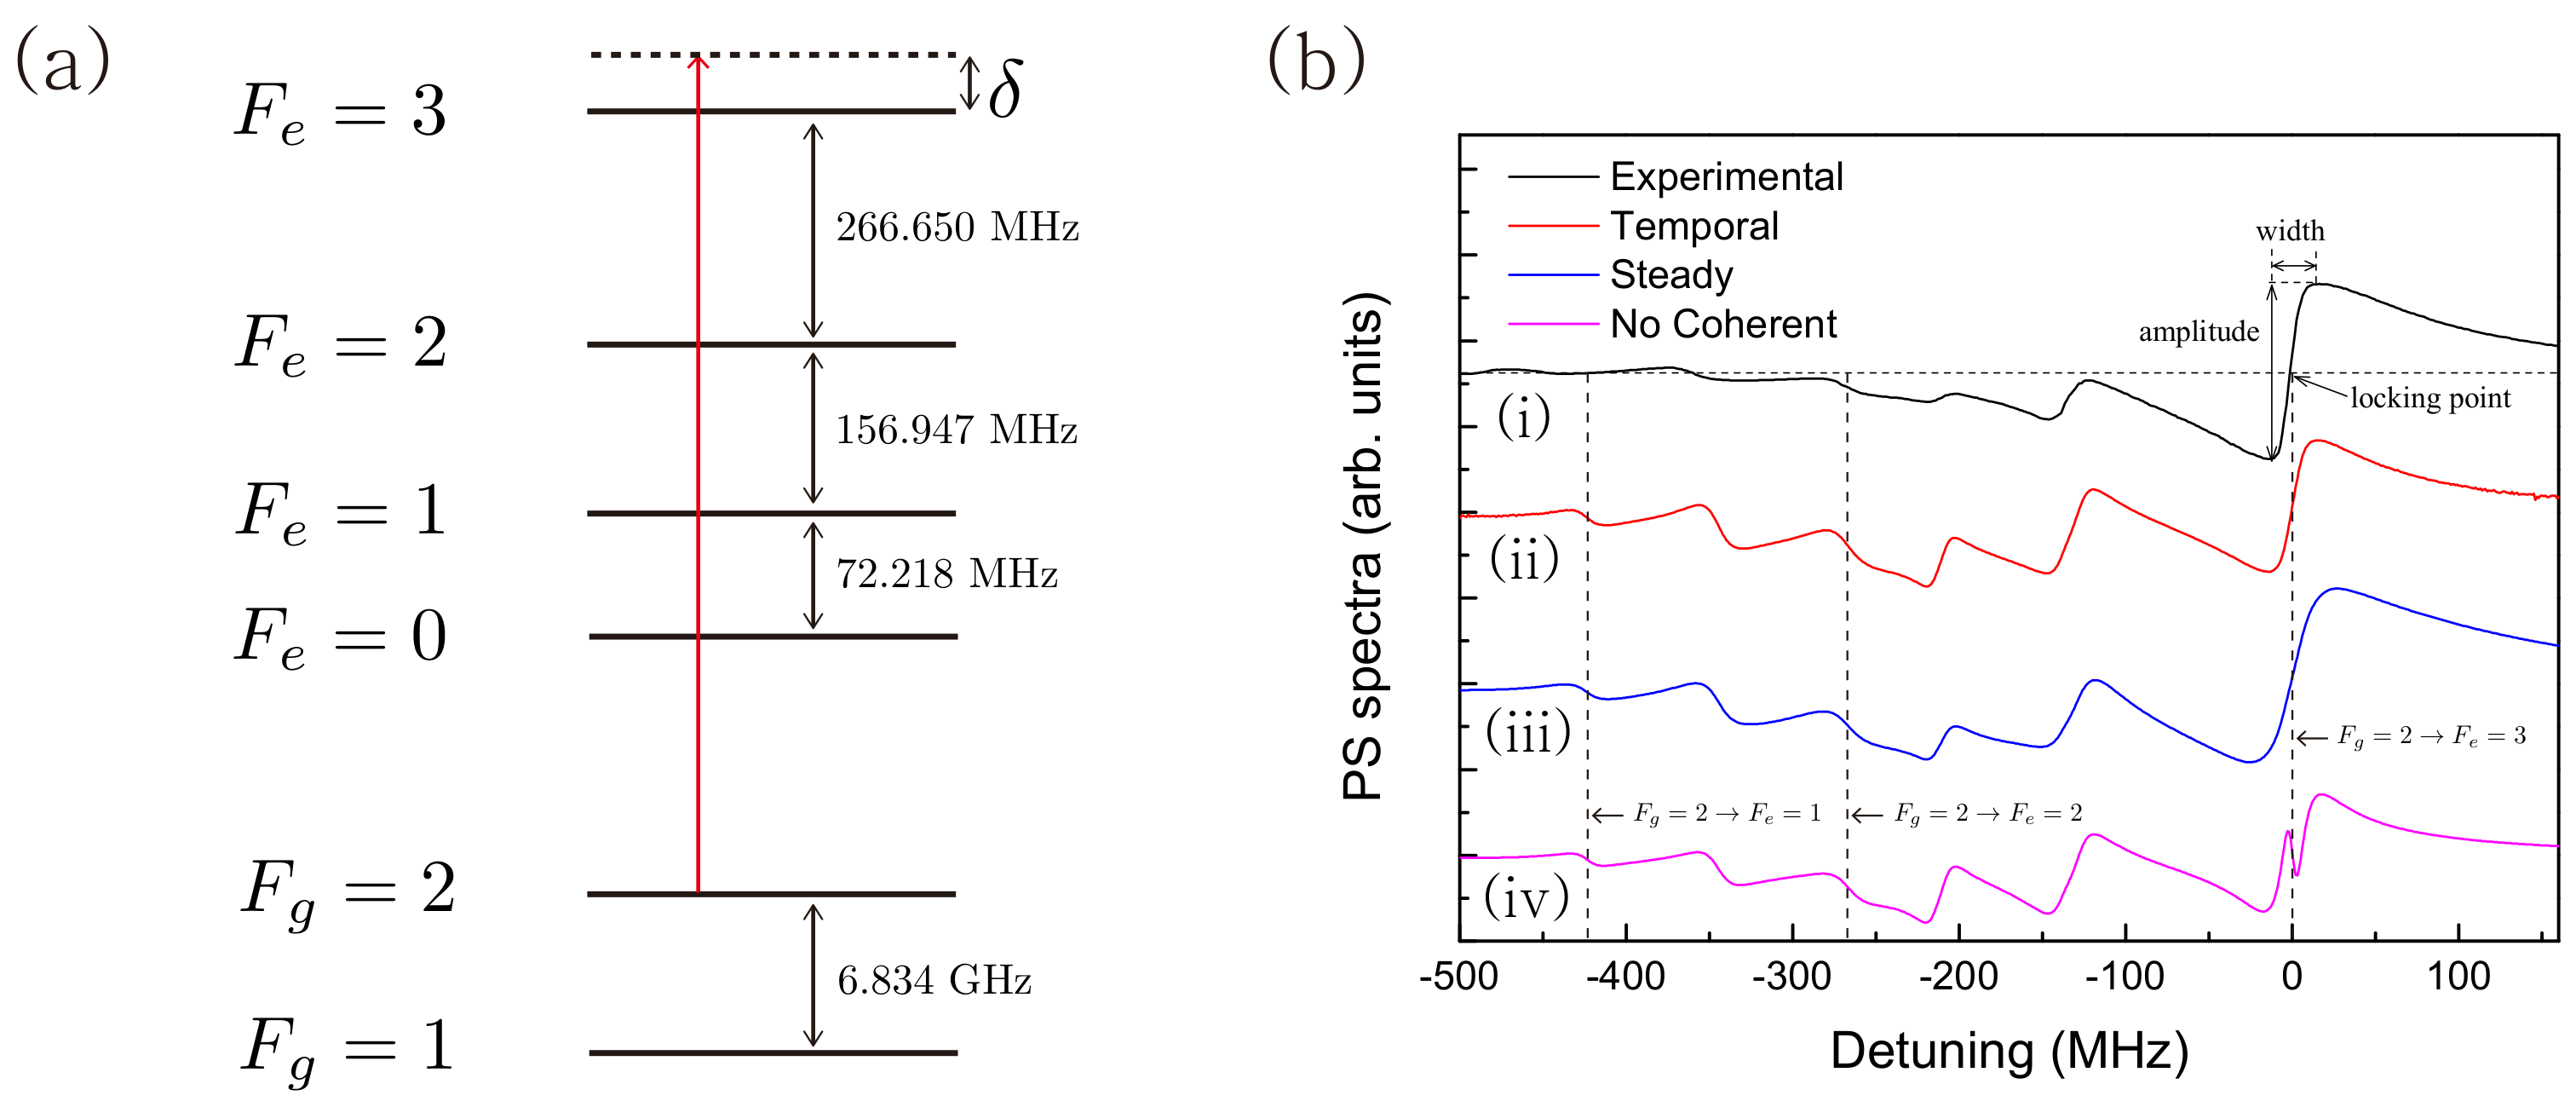
To predict the experimental results, we calculated the PS spectra for the transitions in the D line of Rb atoms, including the coherences connected via interactions with not more than three photons. Thus, only the density matrix elements between the excited and ground states with and were considered, and all the higher terms were neglected where is the difference in the magnetic quantum numbers of the excited and ground states. In the case of Zeeman coherences, only the matrix elements with were considered. Figure 2a represents an energy level diagram for the transitions in the D line of Rb atoms. The theoretical calculations for the PS with a numerical [6,26,27] and an analytical method [28] were previously reported, but the calculation methods were based on the assumption that the coherence terms were neglected and that only the hole-burning terms were considered. As will be seen later, the calculations without considering the coherence terms failed to predict the experimental results because a relatively strong pump beam was used in the experiment. An accurate analytical calculation for the PS for the transition was reported [29], and accurate numerical calculations of the sub-Doppler DAVLL [12,13] and polarization rotation were also recently reported [30].
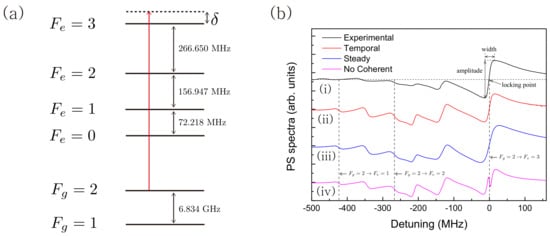
Figure 2.
(a) Typical energy diagram for the transitions in a D line of Rb atoms. The detuning represents the laser frequency relative to the transition line. (b) (i) PS spectra measured experimentally (black line), and PS spectra calculated by (ii) the temporal calculation (red line), (iii) the steady-state calculation (blue line), and (iv) the calculation without the coherence terms (magenta line). The amplitude, width, and slope of the experimental PS spectra were compared with the results calculated, using the temporal calculation method (ii). The slope was estimated at the locking point, resonance frequency.
As shown in Figure 1, the detected signal corresponds to the difference between the two orthogonal circular components of the transmitted probe beam, which is given by the following [31]:
where is the intensity of the probe beam, k is the wave vector, l is the length of the cell, and is the rotation angle of the polarization vector of the probe beam. In Equation (2), and are the averaged real and imaginary parts, respectively, of the susceptibilities for the components of the probe beam, and are given by the following:
where is the atomic number density in the cell, is the wavelength of the laser, is the decay rate of the excited state, , and is the Rabi frequency of the probe beam interacting with atoms. In Equation (4), is the relative transition strength between the states and . In Equation (4), is the density matrix element , where is the component of the optical coherence responsible for the probe absorption [30]. The density matrix elements of the operator were calculated by solving the density matrix equations. The methods for solving the density matrix equations are twofold: one is the direct calculation of the temporal differential equations [13], and the other is the steady-state calculation by including a transit-time relaxation constant [12,30]. First, we used a steady-state calculation method because it provides a highly efficient and fast method. However, we found that this method failed to predict the experimental spectra at high pump beam intensities. This is because the PS signal is the difference between the real parts of the components of the susceptibility; this difference is enlarged when the pump beam intensity is relatively high. Therefore, we chose to solve the temporal equations.
In this temporal calculation method, the matrix elements, that is, the susceptibilities, are averaged over both the transit times of atoms crossing the laser beam and the longitudinal velocity distributions of the atoms. Then, the averaged susceptibilities are given by the following:
where is the average transit time of atoms crossing a laser beam of diameter d, is the most probable speed of the atoms in the vapor cell, and is the Maxwell–Boltzmann velocity distribution function [32]. The susceptibility in Equation (5), , is obtained from the density matrix elements, using Equation (4) as a function of velocity, time, and various detunings. To find the various density matrix elements, we solved the density matrix equations numerically [12].
The typical experimental and calculated results are shown in Figure 2b. The cell temperature is 25 C and laser beam radii are 0.8 mm, and the intensity of the probe (pump) beam is 1.6 mW/cm (20 mW/cm). In Figure 2b, the experimental result, calculated results with the temporal calculation and steady-state calculation, and calculated results with the coherence terms intentionally neglected are presented from top to bottom, respectively. It can be readily seen that the temporal calculation method provides a better matched spectrum with the experimental results. Therefore, we compared the peak-to-peak amplitudes, linewidths, and slopes between the experimental PS spectra and the calculated PS spectra, using temporal calculation method (ii), as shown in Figure 2b, which corresponds to the transitions in the D line of Rb atoms. The slope is estimated at the locking point, resonance frequency.
4. Results and Discussions
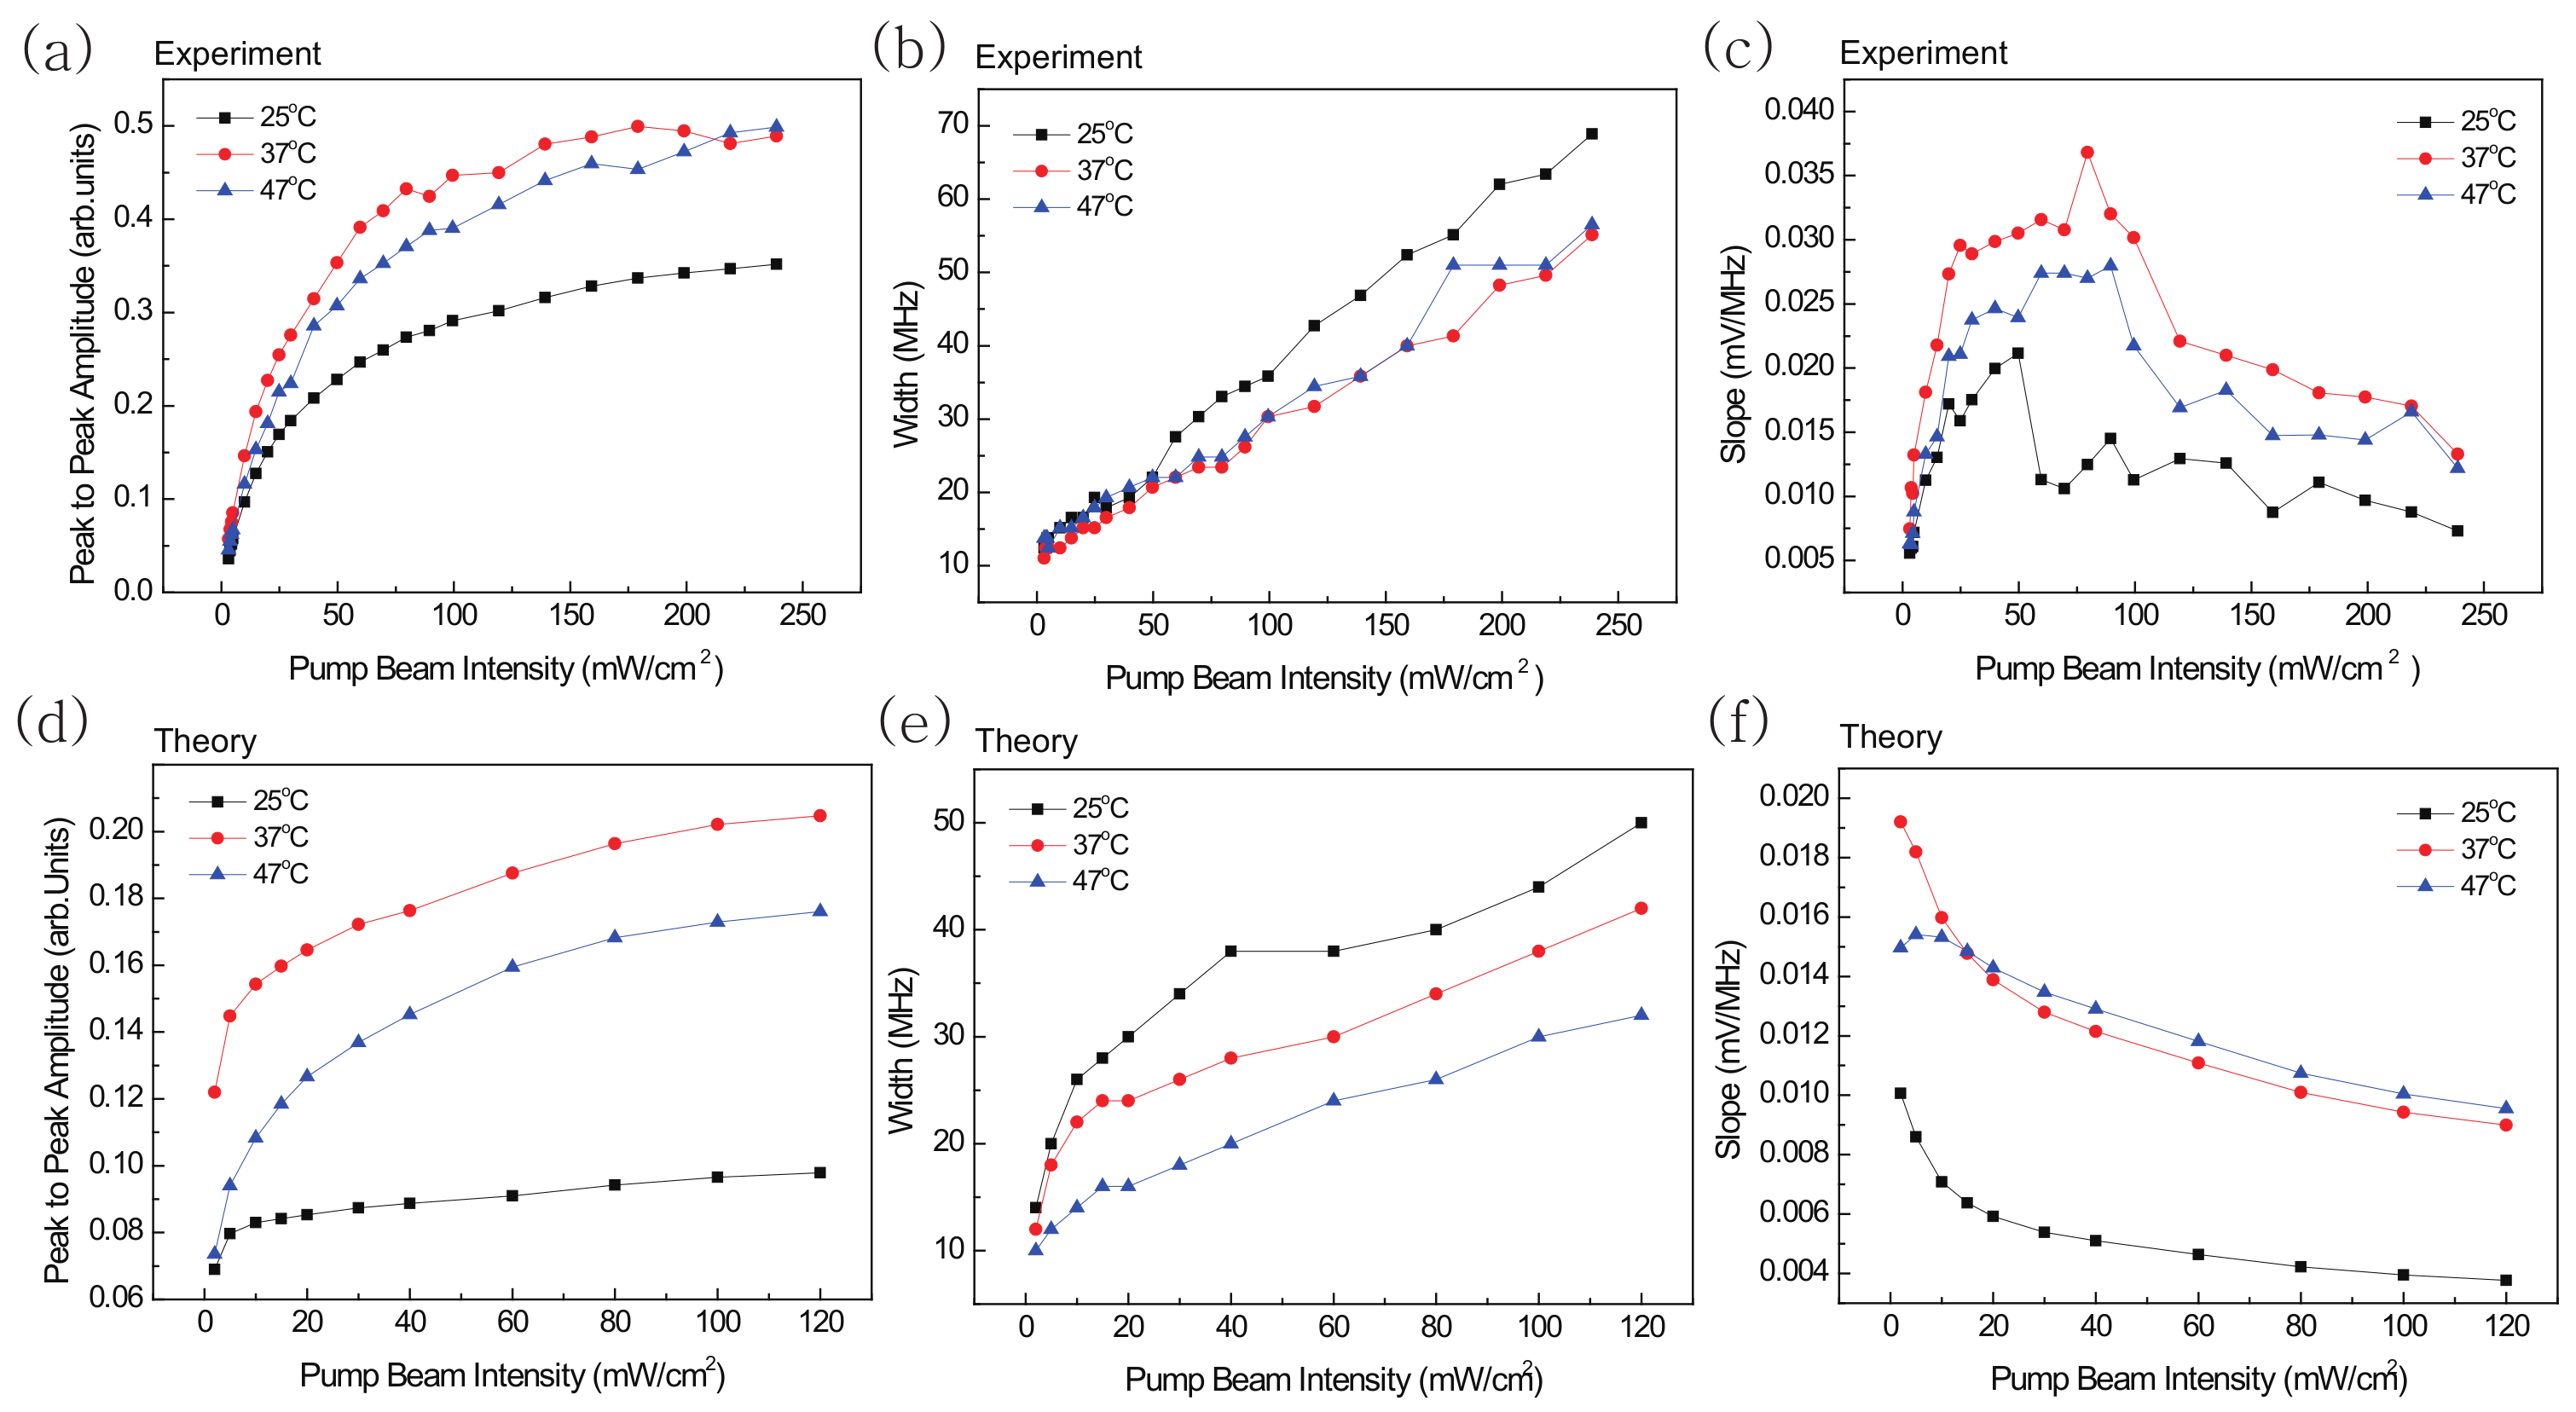
Figure 3 shows the experimental (a, b, c) and theoretical (d, e, f) results on the amplitude (a, d), linewidth (b, e), and slope (c, f) of the PS signal of the Rb transition line, according to the pump beam intensity. The experimentally observed change in the dispersion signal for the transition line shows that the amplitude increases and then saturates as the intensity of the pump beam increases. The linewidth increases linearly with the pump beam intensity, and the slope shows a tendency to increase followed by a decrease. The experimental results are qualitatively in good agreement with the tendency shown in the theoretical results (d, e, f). In addition, the experimental and theoretical results agree with the variation of the dispersion signal, according to the pump beam intensity for three different temperatures (25 C, 37 C, 47 C). Despite the fact that the pump and probe beams used in the experiment had Gaussian intensity distributions, the intensities were assumed to be constant in the calculation. This could result in quantitative discrepancy between the experimental and theoretical results. Therefore, in the case of the experiment, the peak intensity was used as the pump beam intensity. Differences occurred in the x-axis scale of the experimental and theoretical results.
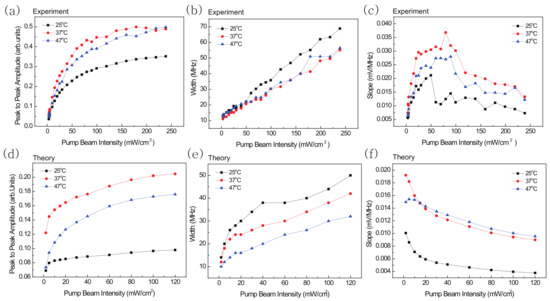
Figure 3.
Dependence of the PS signal of Rb transition line on the change of pump beam intensity (1 mW/ to 250 mW/) under three different vapor cell temperatures. The probe beam intensity was 1.6 . Further, (a–c) show the experimental (theoretical) results of the amplitude, width, and slope of the PS signal, respectively, whereas (d–f) show the corresponding theoretical results.
Note that Figure 3a,d shows the amplitude of the PS signal, according to the temperature change. As the temperature increases, the amplitude of the dispersion signal for the transition line shows a tendency to increase and then decrease to a certain temperature (25 C∼47 C). This temperature dependence can be more clearly confirmed in Figure 4.
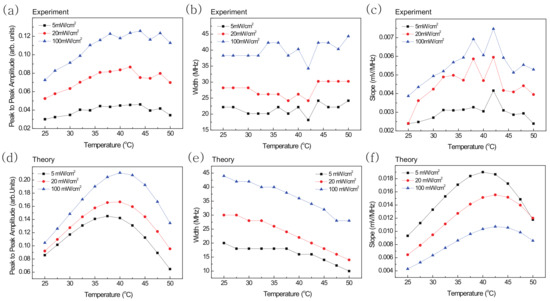
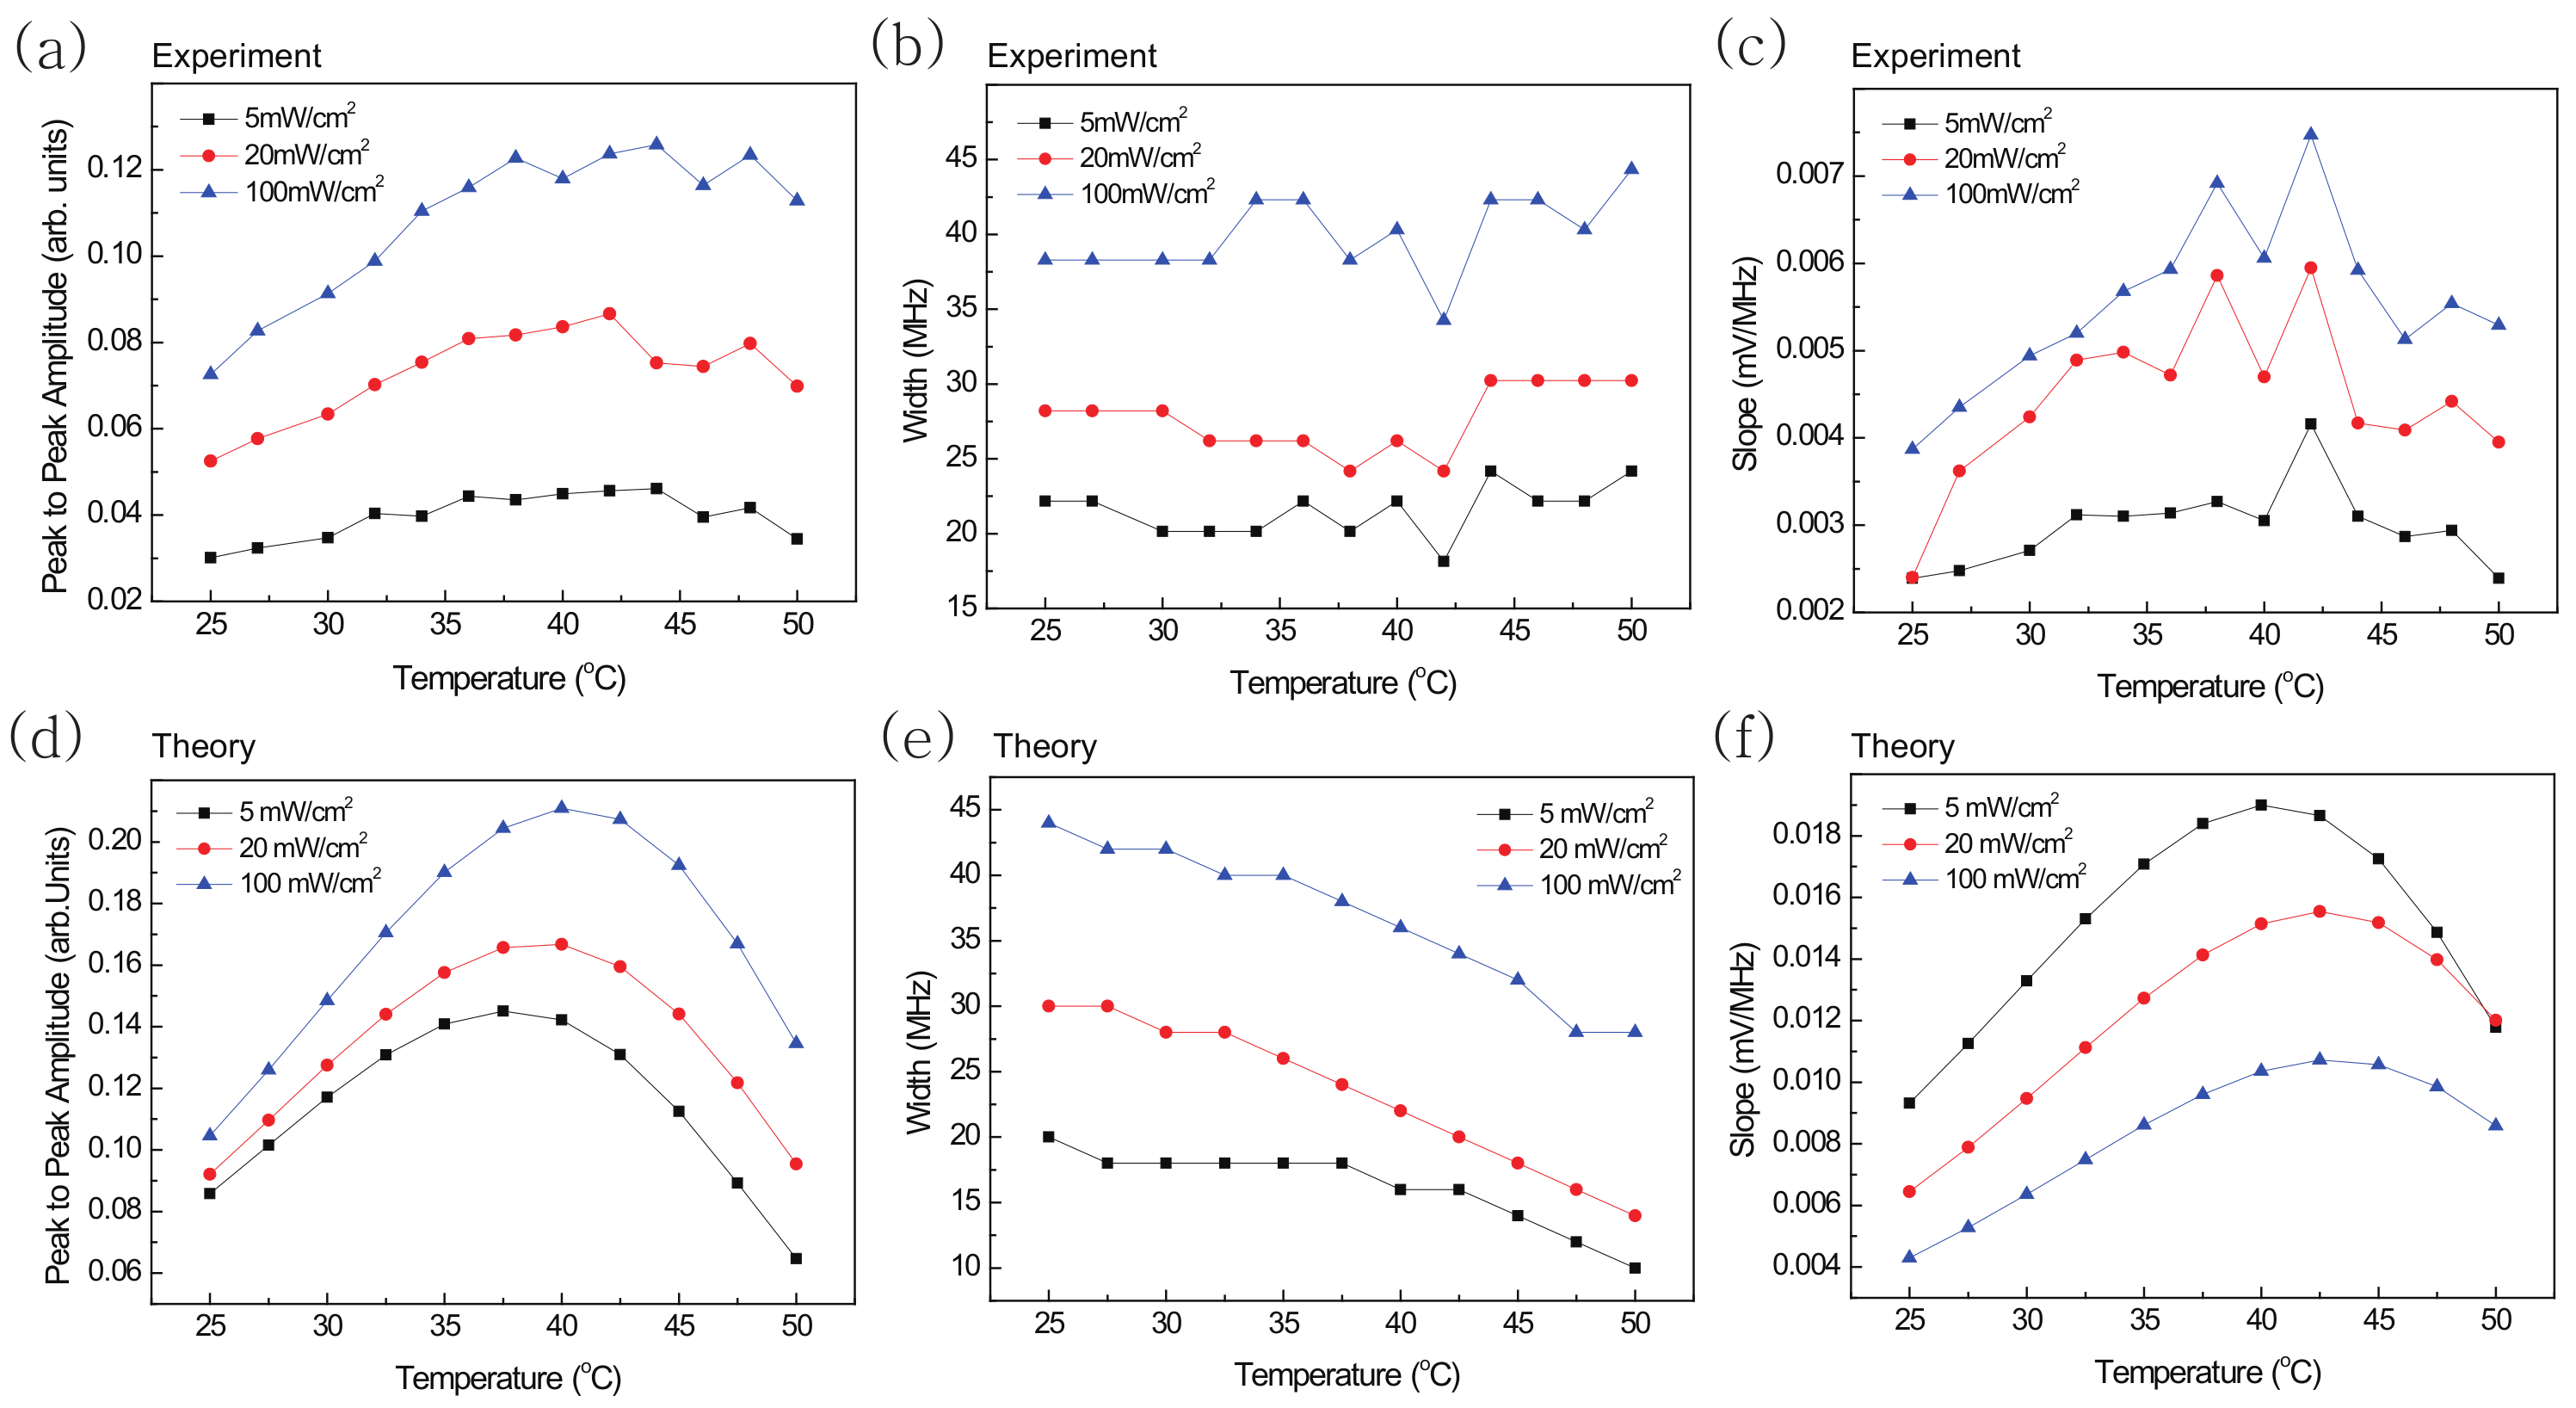
Figure 4.
Dependence of the PS signal of Rb transition line on the change of vapor cell temperature (25 C to 50 C) under three different pump beam intensities (5 mW/, 20 mW/, and 100 mW/). The probe beam intensity was 1.6 . Further, (a–c), and (d–f) are the experimental and theoretical results, respectively, of the amplitude, width, and slope of the PS signal.
Figure 4 shows the experimental (a, b, c) and theoretical (d, e, f) results of the amplitude (a, d), linewidth (b, e), and slope (c, f) of the PS signal of the Rb transition line, according to the vapor cell temperature. The experimentally observed change in the dispersion signal for the transition line shows that the amplitude and slope increase and then decrease as the intensity of the pump beam increases, but the linewidth remains almost constant despite the pump beam intensity changes. The change in the experimentally observed amplitude in Figure 4a agrees well with the tendency shown in the theoretical results in Figure 4d, but there is a difference in the rate of change in the amplitude with temperature. In addition, in the theoretical case, while the change in linewidth decreases with increasing temperature, the experimental results showed an almost constant behavior. Therefore, when looking at the change of the slope according to the change of temperature, the slope in the experiment increases as the intensity of the pump beam (5 mW/, 20 mW/, and 100 mW/) increases, whereas the slope increases as the intensity of the pump beam decreases, in theory.
It should be noted that there is a region in which the change in slope is insensitive to changes in temperature and intensity. In Figure 3f and Figure 4f, when we look at the change in the slope according to the variation in the intensity and temperature, we can see that there is a region where the condition or is satisfied, where and T denote the pump beam intensity and temperature, respectively. The temperature (intensity) satisfying () moves to a higher temperature (intensity) as the pump beam intensity (temperature) increases. That is, it is theoretically possible to confirm that a region insensitive to temperature (intensity) change exists, depending on the temperature and intensity of the pump beam, and thus, the experimental results are qualitatively consistent with the theoretical results.
It is reasonable to assume that the residual noise is almost fixed with specific experimental setups if the probe beam intensity is fixed, and the pump beam does not return to the photodiode. Therefore, because the laser frequency uncertainty proportional to under these conditions can be determined from the amplitude and slope in Figure 3 and Figure 4, it is possible to predict how the lock performance depends on temperature and the pump beam intensity as shown in Figure 5. Figure 5a,c shows the experimental and theoretical results of the lower limit of the frequency uncertainty on the pump beam intensity, respectively. Furthermore, Figure 5b,d shows the experimental and theoretical results of the lower limit of the frequency uncertainty on the temperature, respectively. The frequency uncertainty has an arbitrary unit. The gray shaded parts in Figure 5 show the regions where the minimum values of the lower limit of the frequency uncertainty exist.
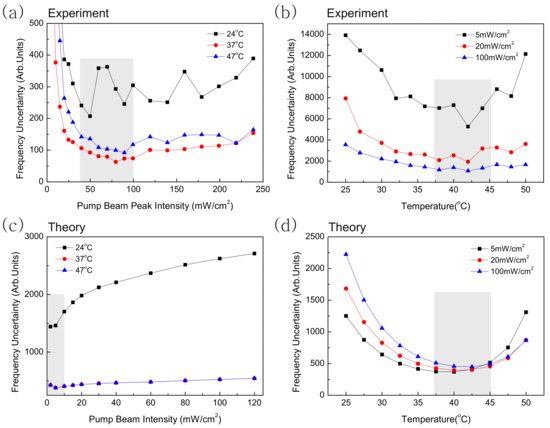
Figure 5.
Lower limit of the frequency uncertainty of polarization spectroscopy signal of Rb transition line on the change of vapor cell temperature and pump beam intensities. Further, (a,b) show the experimental results of the lower limit of frequency uncertainty, and (c,d) show the theoretical results. The frequency uncertainty has an arbitrary unit. The gray shaded region represents the minimum values of the lower limit of the frequency uncertainty.
Remarkably, regardless of the large difference in the intensity of the pump beam (Figure 5b,d), the minimum value of the lower limit of the frequency uncertainty according to the temperature is located between 37 C and 45 C. Conversely, it is shown that the experimental and theoretical minimum value of the lower limit of the frequency uncertainty, according to the pump beam intensity, is in the range of different intensity (Figure 5a,c). The inconsistency between the theoretical and experimental results might be due to two reasons: first, the pump and probe beams with a too-small beam radius do not overlap completely inside the vapor cell; second, the beam cross-section has a Gaussian shape in the experiment, whereas the flat-top cross section of the laser beam is assumed in the theoretical case. Hence, it is considered that the cause mentioned above brings about quantitative differences in the experimental and theoretical results (Figure 5a,c).
5. Conclusions
In this study, the optimal conditions for laser frequency stabilization with polarization spectroscopy were analyzed by comparing the theoretical and experimental results for the minimum value of the frequency uncertainty with the amplitude, width, and slope of the PS signal. In particular, to accurately predict the PS spectra, the calculation based on the numerical solution of the temporal density matrix equations was found to be more precise rather than the method of steady-state calculation. Although quantitative differences occur between the experimental and theoretical results, it can be confirmed that they qualitatively agree with each other. This work provides valuable results for comparing and analyzing the theoretical and experimental results to determine the optimal conditions for stabilizing the laser frequency of the PS signal at various temperatures and pump beam intensities.
Author Contributions
Conceptualization, H.-R.N. and G.M.; methodology, J.J. and G.M.; formal analysis, J.J., S.L., S.H. and J.B.; investigation, H.-R.N. and G.M.; writing—original draft preparation, H.-R.N. and G.M.; writing—review and editing, H.-R.N. and G.M.; supervision, G.M.; funding acquisition, H.-R.N. and G.M. All authors have read and agreed to the published version of the manuscript.
Funding
This work was supported by a National Research Foundation of Korea (NRF) grant funded by the Korean government (MSIT) (No. 2021R1A2C100324411 and No. 2020R1A2C1005499).
Institutional Review Board Statement
Not applicable.
Informed Consent Statement
Not applicable.
Data Availability Statement
The data presented in this study are available on request from the corresponding author. The data are not publicly available due to department requirements.
Conflicts of Interest
The authors declare no conflict of interest. The funders had no role in the design of the study; in the collection, analyses, or interpretation of data; in the writing of the manuscript, or in the decision to publish the results.
References
- Demtröder, W. Laser Spectroscopy; Springer: Berlin, Germany, 1998. [Google Scholar]
- Moon, G.; Noh, H.R. Analytic solutions for the saturated absorption spectra. J. Opt. Soc. Am. B 2008, 25, 701–711. [Google Scholar] [CrossRef]
- Moon, G.; Noh, H.R. A comparison of the dependence of saturated absorption signals on pump beam diameter and intensity. J. Opt. Soc. Am. B 2008, 25, 2101–2106. [Google Scholar] [CrossRef]
- Moon, G.; Noh, H.R. Observation of nonstationary effects in saturation spectroscopy. Opt. Commun. 2008, 281, 294–298. [Google Scholar] [CrossRef]
- Wieman, C.; Hänsch, T.W. Doppler-Free Laser Polarization Spectroscopy. Phys. Rev. Lett. 1976, 36, 1170. [Google Scholar] [CrossRef]
- Do, H.D.; Moon, G.; Noh, H.R. Polarization spectroscopy of rubidium atoms: Theory and experiment. Phys. Rev. A 2008, 77, 032513. [Google Scholar] [CrossRef]
- Jeong, T.; Won, J.Y.; Noh, H.R. Line shapes in polarization spectroscopy for the rubidium D1 line in an external magnetic field. Opt. Commun. 2013, 292, 106–110. [Google Scholar] [CrossRef]
- Corwin, K.L.; Lu, Z.; Hand, C.F.; Epstein, R.J.; Wieman, C.E. Frequency-stabilized diode laser with the Zeeman shift in an atomic vapor. Appl. Opt. 1998, 37, 3295–3298. [Google Scholar] [CrossRef]
- Millett-Sikking, A.; Hughes, I.G.; Tierney, P.; Cornish, S.L. DAVLL lineshapes in atomic rubidium. J. Phys. B At. Mol. Opt. Phys. 2007, 40, 187. [Google Scholar] [CrossRef]
- Shim, U.; Kim, J.A.; Jhe, W. Saturated absorption spectroscopy in the presence of a longitudinal magnetic field. J. Korean Phys. Soc. 1999, 35, 222–225. [Google Scholar]
- Wasik, G.; Gawlik, W.; Zachorowski, J.; Zawadzki, W. Laser frequency stabilization by Doppler-free magnetic dichroism. Appl. Phys. B 2002, 75, 613–619. [Google Scholar] [CrossRef]
- Choi, G.W.; Noh, H.R. Line shapes in sub-Doppler DAVLL in the 87Rb-D2 line. Opt. Commun. 2016, 367, 312–315. [Google Scholar] [CrossRef]
- Choi, G.W.; Noh, H.R. Sub-Doppler DAVLL spectra of the D1 line of rubidium: A theoretical and experimental study. J. Phys. B At. Mol. Opt. Phys. 2015, 48, 115008. [Google Scholar] [CrossRef]
- McCarron, D.J.; King, S.A.; Cornish, S.L. Modulation transfer spectroscopy in atomic rubidium. Meas. Sci. Technol. 2008, 19, 105601. [Google Scholar] [CrossRef]
- Noh, H.R.; Park, S.E. Modulation transfer spectroscopy for two-level atoms at high laser intensity. Opt. Commun. 2015, 336, 173–176. [Google Scholar] [CrossRef]
- Park, S.E.; Noh, H.R. Modulation transfer spectroscopy mediated by spontaneous emission. Opt. Express 2013, 21, 14066–14073. [Google Scholar] [CrossRef] [PubMed]
- Nakanishi, S.; Ariki, H.; Itoh, H.; Kondo, K. Frequency-modulation spectroscopy of rubidium atoms with an AlGaAs diode laser. Opt. Lett. 1987, 12, 864–866. [Google Scholar] [CrossRef]
- Supplee, J.M.; Whittaker, E.A.; Lenth, W. Theoretical description of frequency modulation and wavelength modulation spectroscopy. Appl. Opt. 1994, 33, 6294–6302. [Google Scholar] [CrossRef] [PubMed]
- Bjorklund, G.C.; Levenson, M.D.; Lenth, W.; Ortiz, C. Frequency modulation (FM) spectroscopy. Appl. Phys. B 1983, 32, 145–152. [Google Scholar] [CrossRef]
- Sun, J.-F.; Yin, S.-Q.; Xu, Z.; Hong, T.; Wang, Y.-Z. Optimization of polarization spectroscopy for rubidium D lines. Chin. Phys. B. 2013, 22, 024207. [Google Scholar] [CrossRef]
- Lee, S.L.; Lee, S.B.; Park, S.E.; Hong, H.G.; Heo, M.S.; Seo, S.W.; Jeong, J.Y.; Kwon, T.Y.; Moon, G. Compact modulation transfer spectroscopy module for highly stable laser frequency. Opt. Lasers Eng. 2021, 146, 106698. [Google Scholar] [CrossRef]
- Hu, Z.K.; Sun, B.L.; Duan, X.C.; Zhou, M.K.; Chen, L.L.; Zhan, S.; Zhang, Q.Z.; Luo, J. Demonstration of an ultrahigh-sensitivity atom-interferometry absolute gravimeter. Phys. Rev. A 2013, 88, 043610. [Google Scholar] [CrossRef]
- Bidel, Y.; Zahzam, N.; Blanchard, C.; Bonnin, A.; Cadoret, M.; Bresson, A.; Rouxel, D.; Lequentrec-Lalancette, M.F. Absolute marine gravimetry with matter-wave interferometry. Nat. Commun. 2018, 9, 627. [Google Scholar] [CrossRef]
- Ménoret, V.; Vermeulen, P.; Moigne, N.L.; Bonvalot, S.; Bouyer, P.; Landragin, A.; Desruelle, B. Gravity measurements below 10−9 g with a transportable absolute quantum gravimeter. Sci. Rep. 2018, 8, 12300. [Google Scholar] [CrossRef]
- Luo, Y.; Yan, S.; Jia, A.; Wei, C.; Li, Z.; Wang, E.; Yang, J. Revisiting the laser frequency locking method using acousto-optic frequency modulation transfer spectroscopy. Chin. Opt. Lett. 2016, 14, 121401. [Google Scholar]
- Harris, M.L.; Adams, C.S.; Cornish, S.L.; McLeod, I.C.; Tarleton, E.; Hughes, I.G. Polarization spectroscopy in rubidium and cesium. Phys. Rev. A 2006, 73, 062509. [Google Scholar] [CrossRef] [Green Version]
- Jeong, T.; Noh, H.R. Polarization Spectroscopy for the 85Rb D1 Line in a Strong Pump Field. J. Korean Phys. Soc. 2013, 63, 896–899. [Google Scholar] [CrossRef]
- Do, H.D.; Heo, M.S.; Moon, G.; Noh, H.R.; Jhe, W. Analytic calculation of the lineshapes in polarization spectroscopy of rubidium. Opt. Commun. 2008, 281, 4042–4047. [Google Scholar] [CrossRef]
- Noh, H.R. Line shape in polarization spectroscopy for the Jg = 0 → Je = 1 transition: An analytical study. J. Opt. Soc. Am. B 2016, 33, 1523–1528. [Google Scholar] [CrossRef]
- Moon, G.; Yang, S.C.; Kim, J.T.; Noh, H.R. Polarization rotation spectral profiles for the D2 line of 87Rb atoms: Theory and experiment. J. Phys. B At. Mol. Opt. Phys. 2019, 52, 225004. [Google Scholar] [CrossRef]
- Seo, M.J.; Won, J.Y.; Noh, H.R. Variation in the Polarization State of Arbitrarily Polarized Light via a Circular Anisotropic Atomic Medium. J. Korean Phys. Soc. 2011, 59, 253–256. [Google Scholar] [CrossRef]
- Sagle, J.; Namiotka, R.K.; Huennekens, J. Measurement and modelling of intensity dependent absorption and transit relaxation on the cesium D1 line. J. Phys. B At. Mol. Opt. Phys. 1996, 29, 2629. [Google Scholar] [CrossRef]

Publisher’s Note: MDPI stays neutral with regard to jurisdictional claims in published maps and institutional affiliations. |
© 2021 by the authors. Licensee MDPI, Basel, Switzerland. This article is an open access article distributed under the terms and conditions of the Creative Commons Attribution (CC BY) license (https://creativecommons.org/licenses/by/4.0/).