Article

Modulated Noncollinear Optical Parametric Amplifier Output Induced by Stimulated Raman Scattering

1
Advanced Ultrafast Laser Research Center, The University of Electro-Communications, 1-5-1, Chofugaoka, Chofu, Tokyo 182-8585, Japan
2
Japan Science and Technology Agency, Core Research for Evolutional Science and Technology (CREST), K’s Gobancho, 7, Gobancho, Chiyoda-ku, Tokyo 102-0076, Japan
3
Department of Electrophysics, National Chiao Tung University, 1001 Ta Hsueh Road, Hsin-Chu 3005, Taiwan
4
The University of Tokyo, Hongo, 7-3-1, Bunkyo-ku, Tokyo 113-0033, Japan
5
Institute of Physics, Chinese Academy of Sciences, Huairou Science City, Beijing 100190, China
6
Institute of Optics and Fine Mechanics, Chinese Academy of Sciences, 390 Qinghe Road, Jiading District, Shanghai 201800, China
*
Author to whom correspondence should be addressed.
Appl. Sci. 2021, 11(16), 7578; https://doi.org/10.3390/app11167578 (registering DOI)
Submission received: 24 June 2021 / Revised: 28 July 2021 / Accepted: 29 July 2021 / Published: 18 August 2021
(This article belongs to the Section Applied Physics General)

Abstract

:
We studied spectra of the amplified signal from a noncollinear optical parametric amplifier (NOPA) based on a Ti:sapphire laser and BBO crystal gain medium. The signal shows characteristic structures with periodic intensity variations in the signal during the parametric amplification processes in a BBO crystal. This phenomenon is attributed to the stimulated Raman process excited by the pump pulse affected by the phase-matching condition of four-wave mixing. The effect of this stimulated Raman process on optical parametric amplification and on final pulse compression of the signal was analyzed. The results demonstrate that caution must be taken when constructing a NOPA. Specifically, great care must be taken not to use mirrors with non-uniform spectral reflectivity for obtaining a stable pulse in terms of both temporal and spectral shapes.

1. Introduction

Beta barium borate (β-barium borate, β-BaB2O4, or BBO) is one of the most frequently used crystals for frequency mixing and other second-order nonlinear optical applications because it has a wide transmission range that extends from approximately 200 nm to beyond 3 μm. It is widely used for second-harmonic generation (SHG) [1,2] and optical parametric amplification (OPA) [3,4,5,6,7,8,9,10,11,12,13,14,15,16,17]. It has been used to extend the wavelengths of laser pulses with only a few optical cycles to the ultraviolet (UV) range [1], as well as to expand the spectral bandwidth of laser sources and to obtain even shorter pulses in the visible range through the parametric process using a noncollinear configuration. Noncollinear optical parametric amplification (NOPA) with a BBO crystal as the nonlinear gain medium is the most frequently used method to generate extremely short pulses in the visible and near-infrared (NIR) regions [3,4,5,6,7,8,9,10,11,12,13,14,15,16,17]. A noncollinear geometry has been used to realize group velocity matching between the signal and the idler through achromatic phase matching with the help of the spectral angular dispersion of the idler. In this way, an extremely broad gain bandwidth of 7000 cm−1 has been attained. However, pulse-front tilting, which is inevitable in a noncollinear configuration, was found to limit the shortening of the pulse width. To correct this pulse-front tilting, a pulse-front matching geometry has been introduced, resulting in the generation of 4.7-fs visible pulses using a compressor composed of a prism pair and customized chirped mirrors with a bandwidth broader than 200 THz [12]. Continuous tuning has been demonstrated in the range from 550 to 700 nm for pulse widths shorter than 10 fs [7,8,9,10,11]. Angular dispersion compensation of the idler also results in sub-10-fs pulses in the NIR region [13,14] and even further covering NIR and full visible regions [13,14]. Furthermore, an angularly dispersed pump configuration with a prism was applied to a NOPA to produce pulses as short as 4 fs [14].
Other methods for generating ultrashort broadband light that uses collinear Raman scattering in molecular gases have been introduced in the past few decades [18,19]. Spectral intensity modulation bands spanning several octaves have been obtained [18,19]. A similar Raman phenomenon has been observed using two crossed femtosecond laser beams in various solid-state materials, including YFeO3 [20], SrTiO3 [21], KTaO3 [22], LiNbO3 [23], KNbO3 [24], TiO2 [25], BBO [26], silica [27,28], and sapphire plate [29,30,31] (all at room temperature). As many as 20 anti-Stokes (AS) and two Stokes (S) beams have been generated in PbWO4 [32]. This kind of Raman scattering (RS) can be selectively excited using a pair of time-delayed linearly chirped pulses [33]. BBO also has Raman-active modes, and it has been used to generate broadband spectra using coherent anti-Stokes Raman scattering (CARS) with a relatively high conversion efficiency [26].
In the present study, we present observed spiky features in the output spectra from a NOPA system. These features could be explained in terms of stimulated Raman scattering, initiated by small triggering intensity variations of the seed induced by the nonuniform reflectivity of mirrors used for pulse compression. The measurements were performed in the time domain, complementing previously reported results in the frequency domain [18,20,21,22,23,24,25,26,27,28].

2. Experimental Setup

The laser source was a regenerative amplifier that produces 2.5-mJ, 40-fs, 1-kHz pulses at 800 nm (Micra and Legend-USP, Coherent). In the present experiment, a 500-μJ pulse was split into 80% and 20% components using an 80% transmission beam splitter. This fraction was further split into two beams. As shown in Figure 1, a small fraction of the fundamental was tightly focused onto a 2-mm-thick sapphire plate to generate a white-light continuum through a single stable filament. The other portion of the beam was frequency doubled in a 0.17-mm-thick BBO (type I at θ = 29.2°) and was then separated from the fundamental and utilized as the pump in the noncollinear optical parametric process. The external noncollinear angle between the pump beam and the seed beam was 6.4° on the BBO crystal, corresponding to an internal angle of 3.7° and providing broadband phase matching.
The pulse duration of the white-light seed after the sapphire plate was evaluated as ~200 fs using the dispersion relation of the BBO crystal (available from a crystal providing company). The duration of the second-harmonic pump pulse after the BBO was evaluated as ~50 fs by the risetime of bleaching of strongly absorbing phthalocyanine dye doped in a polymer film (Yamada Chemical). There are two ways to match the pulse width between the seed and the pump: compressing the seed using chirped mirror pairs or stretching the pump pulse in fused silica. We used the second method.
Two-dimensional spectra of the amplified signal against the pump–seed delay time were obtained using a multichannel lock-in amplifier (MCLA) with 128 channels to cover the whole spectral range of the signal pulses after amplification for various delay times between the pump and probe pulses.

3. Theoretical Background of Interactions between Coherent Molecular Vibrations and Electric Fields of Ultrashort Pulses via a Stimulated Raman Process

Utilizing a moving coordinate frame (x′, t′) that is related to a stationary frame (x, t) by x′ = x and t′ = tx/v, the stimulated Raman process is described in terms of the following coupled differential equations for a two-vibrational-level system with a very distant electronic excited state [34,35]:
x E s = κ 1 S E P Q .  
x E P = κ 1 S E S Q + κ 1 A E A S Q * .  
x E A S = κ 1 A E P Q .  
( t + 1 T 2 ) Q * = κ 2 S E S E P * + κ 2 A E P E A S * .  
( t + 1 T 2 ) n = a S 8 ( E P E S * Q * + E P * E S Q ) + a A 8 ( E A S E P * Q * + E A S * E P Q ) .  
Here, T2 is the vibrational phase (transverse) relaxation time and T1 is the population (longitudinal) relaxation time, ħ is the reduced Planck constant, κ1S, κ2S, κ1A, and κ2A are the corresponding coupling constants to the relevant coupling processes in the equations, Q is the vibrational amplitude of the corresponding normal mode and E is the electric field amplitude, and n is the population difference between the lowest and second lowest vibrational levels with quantum numbers of 0 and 1, respectively. The subscripts S, P, and AS denote the Stokes, pump, and anti-Stokes fields, respectively. Equations (1) and (3) differ from Equation (2) in terms of the number of coupling terms on the right side. However, both Equations (1) and (3) can have a secondary term in the same way as Equation (2).
In the time range t << T1,T2, Equations (4) and (5) become:
Q * = t ( κ 2 S E S E P * + κ 2 A E P E A S * ) d t .  
n = 1 8   ( a A ( E A S E P * Q * + E A S * E P Q ) + a s ( E P E S * Q * + E P * E S Q ) ) d t .  
In the time scale of the experiment, T1 is sufficiently long [34,35] that the population dynamics can be disregarded. Thus, n is constant in the present discussion.
The interaction of the fields with the spectral components of the idler and Stokes frequencies (ωi and ωs, respectively) for the pump pulse and coherent vibrations can be described by Equations (1)–(3). In the same way, the interaction of the fields with the spectral components of the idler and anti-Stokes frequencies (ωi and ωas, respectively) for the pump pulse and coherent vibrations are described by Equations (4) and (5). The vibrational population decay is neglected. Because there is no coherent molecular vibration prior to laser irradiation in the thermal incoherent state, the initial condition for Q (t) is Q (0) = 0.
After the pump pulse has been transmitted through the sample, the molecular vibration is sustained in the material during the vibrational coherence time. Subsequently, the ultrashort probe pulse arrives with the same spectrum as the pump pulse. The delay time between these two pulses is varied using an optical stage. Even though the pump pulse and probe pulse have the same spectrum, their spectroscopic functions are different. In case the spectrum of the pump is not fully covering the sample absorption spectrum, the spectral components which do not covering the absorption do not contribute the electronic excitation of the material being studied. While in the case of the probe, the even spectral component not covering the absorption can probe the sample with the interaction by stimulated emission and/or excited absorption induced by the excited state(s) generated by the pump pulse in the spectral range of no absorption by the ground state of the sample. In the case of resonant condition of pump pulse spectrum with the sample electronic spectrum then not only excited electronic state generation but also vibronic excitation can take place in the sample. In such a case complicated processes take place as discussed in the following.
Interactions among the coherent molecular vibrational amplitude Q and the pulsed fields EA, EP, and ES are determined by Equations (1)–(3). Depending on the vibrational phase of the coherent molecular vibrations, the field intensities of ES, EP, and EAS are increased or reduced by amplification or deamplification, respectively. As mentioned above, Equations (1) and (3) can have a secondary term in the same way as Equation (2). The two terms can compete or constructively contribute to increase or reduce the intensity. Furthermore, the coherent molecular vibration amplitude couples to all pairs of the relevant fields in the available bandwidth. It is thus expected to have a very complex temporal behavior. However, the frequencies of the signal components introduced by the molecular vibrations are given by those of the vibrational modes, as observed. The complexity appears as the probe wavelength dependence of the amplification (deamplification), as discussed in this paper.
For the experiment discussed in the present paper, the intensity of the incident seed pulse is fixed within an inevitable fluctuation. This differs from the case when a single pump pulse that is not accompanied with a probe pulse incident on the nonlinear crystal. In this case, the initial condition is given by Q(0) = 0 and the creation of the signal originates from vacuum fluctuations. The vibrational amplitude increases or decreases bilinearly with increasing probe and pump fields, as expected from Equation (2). Since the amplitude of the molecular vibration can reach the anharmonic range, the frequencies observed for a high-intensity probe pulse can be lower than those observed at low probe intensities.

4. Results and Discussion

For efficient optical parametric amplification, it is necessary to match the spectral extension and temporal durations of the pump and seed pulses. The seed pulse duration is often adjusted to be shorter than that of the pump pulse, resulting in increased stability of the amplified signal intensity. In the present study, the seed pulse was compressed by a pair of chirped mirrors and the pump pulse was stretched using UV-grade fused silica for the enhancement of efficiency by avoiding the amplification saturation and by perfect temporal overlap between the pump and seed pulses.

4.1. Stimulated Raman Processes in Optical Parametric Amplification

Figure 2 shows a two-dimensional plot of the amplified signal spectra against pump–seed delay time measured with a multichannel lock-in amplifier (MCLA) for different conditions that depend on the configurations of the precompression optical system of the seed pulse and the stretching optics of the pump pulse. Due to the limited spectral range of the MCLA, we obtained delay-time-dependent amplified spectra in spectral ranges shorter and longer than 600 nm of the output amplified spectra to ensure that the resolution was sufficiently high; consequently, the spectra in Figure 2 have signal intensity jumps around 600 nm. A pump–seed delay time dependent spectrum of the amplified signal was also measured using a spectrometer (Ocean Optics, USB4000). An example is shown in Figure 3a. Three examples of amplified spectra obtained using different pump–seed delay times are shown in Figure 3b.

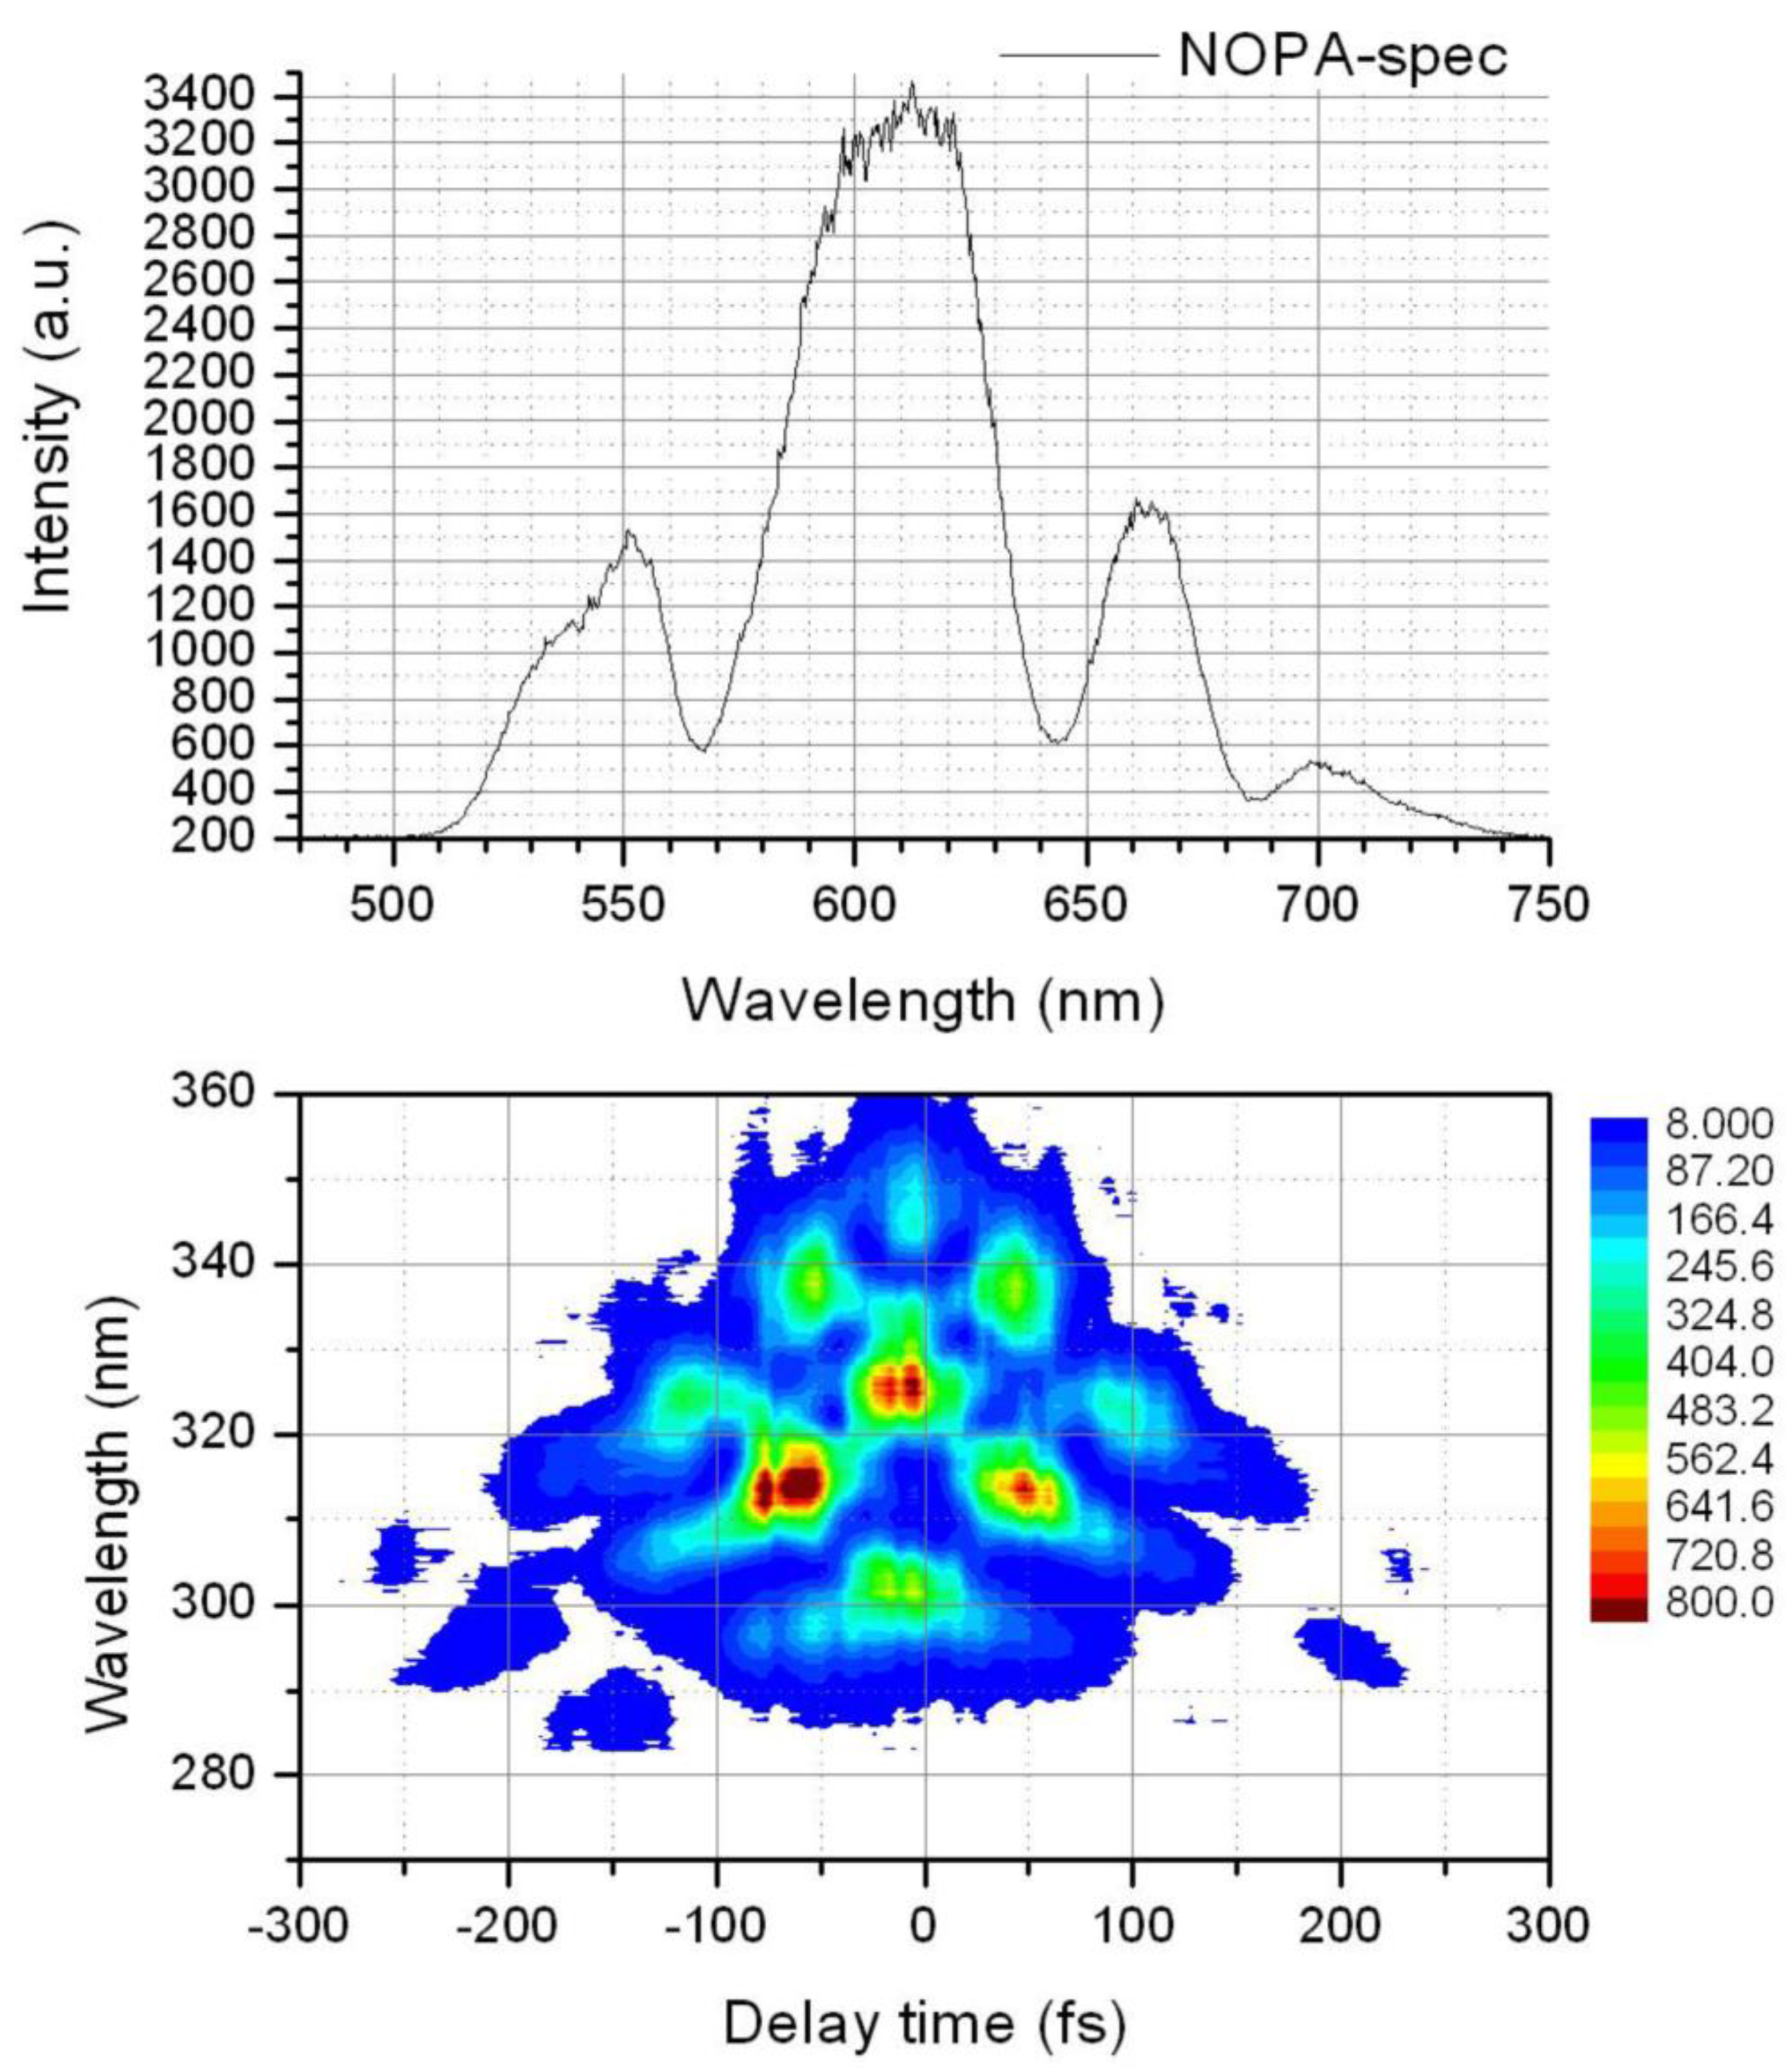
4.1.1. Characteristic Features of Amplified Signal Spectra

Two spectral features of the spectra in Figure 2 and Figure 3 are of special interest. First, at certain pump–seed delay times, the amplified signal spectra are not smooth with a single peak. Instead, they have modulated structure with several peaks as shown in Figure 3b. Second, at specific signal wavelengths, the intensity is modulated in the pump–probe delay time as shown in Figure 2b–e and in Figure 3 more clearly.

4.1.1.1. Structure in the Amplified Signals

Rapidly varying peaks and valleys appear in the signal spectra (see Figure 2) for certain configurations of precompression and stretching when the conditions of the chirped-mirror system in Figure 1 are varied. The wavenumber differences between adjacent peaks and adjacent valleys together with the peak to adjacent valley values are plotted in Figure 4. They exhibit a nearly random distribution, making it difficult to relate these peaks and/or valleys to the difference frequencies of the Raman shift signals in the BBO crystal [36] listed in Table 1.
There are two possible explanations for such an apparently random distribution. One is that the peak-and-valley structure is introduced by the stimulated Raman scattering with many Raman shift signals for the BBO crystal listed in Table 1 so that all the Raman signals become congested and interference between the Raman signal produces the complex structure of the spectrum. The second possible explanation is the combined contribution of the Raman shift and four-wave mixing, which requires a phase-matching condition to produce Raman signal frequencies, produces substantial offsets from the pure Raman shift frequency.

4.1.1.2. Intensity Modulation Structure in the Amplified Signals

The amplified signal intensities at wavelengths of 552, 612, 660, and 720 nm are plotted as a function of the pump–seed delay time in Figure 5. These curves have the following two characteristic features. First, there is a longer time range for the pump pulse because its stretching extends the amplification range of the seed. Second, the modulation structure of the curve is more evident during the stretched pump pulse, possibly due to elongation of the amplification range resulting in a stronger signal intensity change due to Raman scattering in the BBO. This phenomenon can be explained in terms of molecular vibrations of the stimulated Raman scattering excited by the pump pulse. The BBO crystal can be excited by the pump light and two subsequent processes can occur when the seed pulse arrives: optical parametric amplification satisfying the phase-matching condition or Raman scattering for which the intensity of the amplified signal varies with the phase of the molecular vibrations. For certain phases, some spectral ranges are amplified by the stimulated Raman scattering and others are deamplified in accordance with the phase relations between the coherent molecular vibrational amplitude and the laser field. The two spectral components can serve as pump and Stokes fields whose behaviors are in anti-phase; in other words, the pump is amplified, and the Stokes field is deamplified or vice versa depending on the molecular vibrational phase described by Equation (1). The same phenomenon can occur between the spectral components that satisfy the relation between the pump and anti-Stokes pulses described by Equation (3). In each case, the amplified and deamplified spectral ranges are exchanged after a half period. In the central part of the seed spectrum, there is a spectral range where frequency components can function as both pump and Stokes pulses. There is another spectral range where the frequency component can function as both pump and anti-Stokes pulses. The former range extends from the highest frequency (νmax) edge to the frequency equal to the difference of νmax and the frequency (νr) of the relevant mode. The latter range is from the lowest frequency (νmin) edge to the frequency equal to the sum of νmin and the frequency (νr) of the relevant mode. Therefore, all frequency components in the spectral range of the seed between νmax − νr and νmin + νr function as pump, Stokes, and anti-Stokes pulses. Competition and interference among these processes are expected to make the observed phenomena extremely complicated.
A Fourier transform analysis was performed on the traces in Figure 5 to obtain the wavenumber of the periodic features. The results are plotted in Figure 6, which shows some peaks at a lower frequency. These peak positions were recorded and are shown in Figure 7 together with the Raman shifts of BBO indicated by the dashed lines. The vibrational signals in the present study are characterized by their vibrational frequencies. This figure shows that the peaks in the experimental results are correlated with the Raman shift signal of the BBO crystal, indicating that the structures in the NOPA output are partially due to Raman scattering. However, the correlation is not perfect as can be seen in Figure 7.

4.1.2. Further Discussion

Comparison of the results and discussion in Section 4.1.1.1 and Section 4.1.1.2 above reveals that the difference in wavenumbers is random and thus the structures in the spectra cannot originate from Raman scattering. However, the pattern in Figure 7 gives improved consistency between the experimental results and the Raman shift signals of BBO in the literature. The reason for this difference is explained as follows.
The periodic structure only appears when the multichannel lock-in amplifier is used. During data collection, the pump light is modulated by a chopper of which the frequency is sent to the lock-in amplifier as the reference signal. Therefore, the periodic structure must be introduced by the pump pulse. Furthermore, the structure and signal intensity modulation must be enhanced by the BBO crystal.
The results in part B support the conclusion of the structure formation is due to a Raman scattering process by the pump light. There are many Raman signals for BBO listed in Table 1. Thus, the spectral shape and intensity change are due to mixed contributions of stimulated Raman shifts. The contribution of different Raman shift signals can be more clearly obtained by taking the Fourier transform of the traces in Figure 5 than by plotting frequency differences between adjacent spikes. This process is the same as that used in the analysis of real-time traces of time-resolved spectroscopy [37,38]. In a pump–probe experiment, the vibration signal from molecules is excited by the pump light. A possible origin of the complicated structures is the competition and interference among the processes. The pump and seed spectra both have complex structures and further complication takes place in their spectra due to the Raman amplification and deamplification, as discussed above. This Raman amplification and deamplification corresponds to Raman gain and loss processes, respectively. These phenomena appear as alternating absorbance changes ΔA with vibrational frequency in the pump–probe experiment. Therefore, the frequency shift of the spectral component in the pump range to the Stokes range is independent of the spectral shape in the original Stokes region. This can be explained using Equation (1), in which the amplification or deamplification coefficient of the Stokes field ES, which depends on the phase of the molecular vibration, is a function of the pump field EP. This differs from the situation in conventional pump–probe experiments in which the pump field spectral shape does not affect the signal when the system is homogeneous. In the same way, the amplification or deamplification coefficient of the anti-Stokes field EAS at some instant of the molecular vibration phase is given as a function of the pump field EP.
Another possible origin of the complication is the overlap between the laser spectrum and the absorption spectrum of the sample. However, there is no absorption of the 400-nm pump light in parametric amplification, which implies that the excitation of the BBO is only due to non-electronic resonant stimulated Raman processes.

4.2. Effect of Stimulated Raman Processes on Parametric Amplification

Next, we consider the effect of pulse compression of the amplified signal in the parametric amplification by utilizing pulse characterization based on the frequency-resolved optical gating (FROG) technique. This characterization was performed for different types of experimental configurations. Figure 8 shows an example of FROG results together with the amplified signal spectrum. In this experiment, the signal spectrum was adjusted to have relatively intense peaks under the action of the stimulated Raman process. The signal pulse was measured after passing through air from the BBO crystal in the OPA to the BBO crystal for the FROG measurement without compression by a prism pair and/or chirped mirrors. This measurement provides timing information about the signal pulse since the air imparts only a linear chirp to the pulse. The two-dimensional pattern of the sum-frequency distribution shown in Figure 8b indicates that the chirp in the signal pulse is nonlinear. For example, components around 320 nm, corresponding to a fundamental signal wavelength of 640 nm, appear at delay times around ±100 and 0 fs. Since the parametric amplification processes do not change the chirp of the seed pulse and the continuum seed generated by focusing the 800 nm light onto the sapphire plate gives rise to a linear chirp, the nonlinear chirp in the amplified signal is concluded to be due to the stimulated Raman process. In fact, the pattern in Figure 8b shows a periodic distribution of the same sum-frequency components at different delay times, which deteriorates the pulse characteristics much more than the nonlinear chirp for further compression of the amplified signal pulse. In the present technique of chirping compensation, rearrangement of periodically distributed spectral components hinders pulse compression. Because stimulated Raman amplification and deamplification are third-order nonlinear optical processes, the pump intensity needs to be lower than the threshold intensity to avoid obtaining spectra with prominent peaks and valleys. It is thus critical for the seed pulse not to have such a structure to prevent the structure from being amplified. Since the processes of stimulated Raman process including Raman gain and Raman loss processes, continuum generation, spatial self-focusing processes and others are third-order or higher, they are sensitive the intensity of the NOPA pulse and the spectral shape. Some spectral components are more effectively contributing to some of the processes and pairs of some partial spectral bands are more efficient in some other processes. These phenomena may result in the instability of measurement. The instability of the spectrum may even change the temporal shape of the NOPA output which may deteriorate the results obtained by the experiments. In the application of ultrashort pulse frequently nonlinear processes, such as SHG and SFG, are utilized since linear measurement using conventional detectors which do not have femtosecond time resolution is not possible. Therefore, the spectral pattern in the amplified signal may give serious errors in the spectral information of the experimental results. To avoid such problems, if any, it is recommended to investigate the dynamic range of the signal in the experiment. For example, before starting a type of pump/probe experiment, which includes optical pump/optical probe to study time-resolved induced absorption/ photoconductivity and others, it is recommended to study the linearity of signal intensity with respect to pump intensity. This is for the linearity of the phenomenon to be studied. Of course, the linearity of the detector with respect to the signal light intensity must be verified beforehand.

4.3. Mechanism of Stimulated Raman Processes in the Parametric Amplification

We have clarified the mechanism of the formation of the modulated structure in NOPA spectrum. This phenomenon is due to the interaction between the Raman field and parametric medium, BBO. BBO can be regarded as a molecular crystal composed of BaB2O4 molecular ensemble and the representative vibrational modes are as mentioned before in Table 1 [36]. The abundant molecular vibration modes are coupled to the virtual electronic transition via vibronic coupling introducing the modulated features in the OPA spectrum as mentioned before with Figure 2. There are several important reports related to the subject discussed here in this paper. The shortened titles of them are “Mode-specific excited state dynamics based on Raman loss spectroscopy” [39] and “Snapshot of structure during phonon creation with ultrafast Raman spectroscopy” [40], and “Ultrashort laser-driven stable-buckling of blisters in chirped mirror” [41] are some examples of them. There are other important papers to be mentioned such as [42,43,44,45,46].

5. Conclusions

In this paper, characteristic structures were observed in the amplified signal spectra from a NOPA, along with periodic intensity variations in the signal during parametric amplification in a BBO crystal. These phenomena are attributed to the stimulated Raman process excited by the pump pulse affected by the phase-matching condition of four-wave mixing. The effect of this stimulated Raman process on optical parametric amplification and on final pulse compression of the signal was analyzed. The results demonstrate that caution must be paid when constructing a NOPA. Specifically, great care must be taken not to use mirrors with non-uniform reflectivity.

Author Contributions

Conceptualization, T.K.; methodology, Z.W. and J.L.; investigation Z.W.; resources, T.K.; writing—original draft preparation, T.K.; writing—review and editing, T.K.; visualization, T.K.; supervision, T.K.; project administration, T.K.; funding acquisition, T.K. All authors have read and agreed to the published version of the manuscript.

Funding

This work was partly supported by the 21st Century COE program on “Coherent Optical Science” and by a grant from the Ministry of Education (MOE) in Taiwan under the ATU Program at Na-tional Chiao Tung University. Part of this work was performed under the Joint Research Project of Laser Engineering at Osaka University.

Acknowledgments

This work was partly supported by the 21st Century COE program on “Coherent Optical Science” and by a grant from the Ministry of Education (MOE) in Taiwan under the ATU Program at National Chiao Tung University. Part of this work was performed under the Joint Research Project of Laser Engineering at Osaka University.

Conflicts of Interest

The authors declare no conflict of interest.

References

  1. Baum, P.; Lochbrunner, S.; Riedle, E. Tunable sub-10-fs ultraviolet pulses generated by achromatic frequency doubling. Opt. Lett. 2004, 29, 1686–1688. [Google Scholar] [CrossRef]
  2. Baltuska, A.; Pshenichnikov, M.S.; Wiersma, D.A. Characterization of sub-6-fs optical pulses with spectral phase interferometry for direct electric-field reconstruction. IEEE J. Quantum. Electron. 1999, 35, 459. [Google Scholar] [CrossRef] [Green Version]
  3. Gale, G.M.; Cavallari, M.; Driscoll, T.J.; Hache, F. Sub-20-fs tunable pulses in the visible from an 82-MHz optical parametric oscillator. Opt. Lett. 1995, 20, 1562. [Google Scholar] [CrossRef] [PubMed]
  4. Gale, G.M.; Hache, F.; Cavallari, M. Broad-bandwidth parametric amplification in the visible: Femtosecond experiments and simulations. IEEE J. Sel. Top. Quantum. Electron. 1998, 4, 224. [Google Scholar] [CrossRef]
  5. Wilhelm, T.; Piel, J.; Riedle, E. Sub-20-fs pulses tunable across the visible from a blue-pumped single-pass noncollinear parametric converter. Opt. Lett. 1997, 22, 1494. [Google Scholar] [CrossRef] [PubMed]
  6. Riedle, E.; Beutter, M.; Lochbrunner, S.; Piel, J.; Schenkl, S.; Spoerlein, S.; Zinth, W. Generation of 10 to 50 fs pulses tunable through all of the visible and the NIR. Appl. Phys. B 2000, 71, 457. [Google Scholar] [CrossRef]
  7. Cerullo, G.; Nisoli, M.; Stagira, S.; Silvestri, S.D. Sub-8-fs pulses from an ultrabroadband optical parametric amplifier in the visible. Opt. Lett. 1998, 23, 1283. [Google Scholar] [CrossRef]
  8. Cerullo, G.; Nisoli, M.; Stagira, S.; Silvestri, S.D.; Tempea, G.; Krausz, F.; Ferencz, F. Mirror-dispersion-controlled sub-10-fs optical parametric amplifier in the visible. Opt. Lett. 1999, 24, 1529. [Google Scholar] [CrossRef]
  9. Cerullo, G.; Nisoli, M.; Stagira, S.; Silvestri, S.D.; Tempea, G.; Krausz, F.; Ferencz, F. Mirror-dispersion-controlled OPA: A compact tool for sub-10-fs spectroscopy in the visible. Appl. Phys. B 2000, S70, S253. [Google Scholar] [CrossRef]
  10. Shirakawa, A.; Kobayashi, T. Noncollinearly phase-matched femtosecond optical parametric amplification with a 2000 cm−1 Bandwidth. Appl. Phys. Lett. 1998, 72, 147. [Google Scholar] [CrossRef]
  11. Shirakawa, A.; Sakane, I.; Kobayashi, T. Pulse-front-matched optical parametric amplification for sub-10-fs pulse generation tunable in the visible and near infrared. Opt. Lett. 1998, 23, 1292. [Google Scholar] [CrossRef] [PubMed]
  12. Shirakawa, A.; Sakane, I.; Takasaka, M.; Kobayashi, T. Sub-5-fs visible pulse generation by pulse-front-matched noncollinear optical parametric amplification. Appl. Phys. Lett. 1999, 74, 2268. [Google Scholar] [CrossRef]
  13. Kobayashi, T.; Shirakawa, A. Tunable visible and near-infrared pulse generator in a 5 fs regime. Appl. Phys. B. 2000, 70, S239. [Google Scholar] [CrossRef]
  14. Okamura, K.; Kobayashi, T. Sub-5-fs transform-limited visible pulse source and its application to real-time Spectroscopy. IEEE J. Select. Top. Quantum. Electron. 2001, 7, 525. [Google Scholar]
  15. Zavelani-Rossi, M.; Cerullo, G.; Silvestri, S.; De Gallmann, L.; Matuschek, N.; Steinmeyer, G.; Keller, U.; Angelow, G.; Scheuer, V.; Tschudi, T. Pulse compression over a 170-THz bandwidth in the visible by use of only chirped mirrors. Opt. Lett. 2001, 26, 1155. [Google Scholar] [CrossRef] [PubMed]
  16. Baltuška, A.; Fuji, T.; Kobayashi, T. Self-referencing of the carrier-envelope slip in a 6-fs visible parametric amplifier. Opt. Lett. 2002, 27, 306. [Google Scholar] [CrossRef]
  17. Brida, D.; Cirmi, G.; Manzoni, C.; Bonora, S.; Villoresi, P.; Silvestri, S.D.; Cerullo, G. Two-optical-cycle pulses in the mid-infrared from an optical parametric amplifier. Opt. Lett. 2008, 33, 741. [Google Scholar] [CrossRef] [PubMed]
  18. Sokolov, A.V.; Harris, S.E. Ultrashort pulse generation by molecular modulation. J. Opt. B Quantum Semiclass. Opt. 2002, 5, R1. [Google Scholar] [CrossRef]
  19. Sokolov, A.V.; Shverdin, M.Y.; Walker, D.R.; Yavuz, D.D.; Burzo, A.M.; Yin, G.Y.; Harris, S.E. Generation and control of femtosecond pulses by molecular modulation. J. Mod. Opt. 2005, 52, 285. [Google Scholar] [CrossRef]
  20. Takahashi, J.; Matsubara, E.; Arima, T.; Hanamura, E. Coherent multistep anti-Stokes and stimulated Raman scattering associated with third harmonics in YFeO3 crystals. Phys. Rev. B 2003, 68, 155102. [Google Scholar] [CrossRef]
  21. Takahashi, J.; Keisuke, M.; Toshirou, Y. Raman lasing and cascaded coherent anti-Stokes Raman scattering of a two-phonon Raman band. Opt. Lett. 2006, 31, 1501. [Google Scholar]
  22. Matsubara, E.; Inoue, K.; Hanamura, E. Violation of Raman selection rules induced by two femtosecond laser pulses in KTaO3. Phys. Rev. B 2005, 72, 134101. [Google Scholar] [CrossRef]
  23. Matsubara, E.; Sekikawa, T.; Yamashita, M. Generation of ultrashort optical pulses using multiple coherent anti-Stokes Raman scattering in a crystal at room temperature. Appl. Phys. Lett. 2008, 92, 071104. [Google Scholar] [CrossRef] [Green Version]
  24. Matsuki, H.; Inoue, K.; Hanamura, E. Multiple coherent anti-Stokes Raman scattering due to phonon grating in KNbO3 induced by crossed beams of two-color femtosecond pulses. Phys. Rev. B 2007, 75, 024102. [Google Scholar] [CrossRef]
  25. Inoue, K.; Kato, J.; Hanamura, E.; Matsuki, H.; Matsubara, E. Broadband coherent radiation based on peculiar multiple Raman scattering by laser-induced phonon gratings in TiO2. Phys. Rev. B 2007, 76, 041101(R). [Google Scholar] [CrossRef]
  26. Liu, J.; Zhang, J.; Kobayashi, T. Broadband coherent anti-Stokes Raman scattering light generation in BBO crystal by using two crossing femtosecond laser pulses. Opt Lett. 2008, 33, 1494. [Google Scholar] [CrossRef]
  27. Liu, J.; Kobayashi, T. Cascaded four-wave mixing and multicolored arrays generation in a sapphire plate by using two crossing beams of femtosecond laser. Opt. Exp. 2008, 16, 22119. [Google Scholar] [CrossRef]
  28. Liu, J.; Kobayashi, T.; Wang, Z. Generation of broadband two-dimensional multicolored arrays in a sapphire plate. Opt. Exp. 2009, 17, 9226. [Google Scholar] [CrossRef] [Green Version]
  29. Liu, J.; Kobayashi, T. Wavelength-tunable, multicolored femtosecond-laser pulse generation in fused-silica glass. Opt. Lett. 2009, 34, 1066. [Google Scholar] [CrossRef]
  30. Liu, J.; Kobayashi, T. Generation of sub- 20-fs multicolor laser pulses using cascaded four-wave mixing with chirped incident pulses. Opt. Lett. 2009, 34, 2402. [Google Scholar] [CrossRef] [PubMed]
  31. Liu, J.; Kobayashi, T. Generation of uJ-level multicolored femtosecond laser pulses using cascaded four-wave mixing. Opt. Exp. 2009, 17, 4984. [Google Scholar] [CrossRef] [PubMed] [Green Version]
  32. Zhi, M.; Sokolov, A.V. Broadband coherent light generation in a Raman-active crystal driven by two-color femtosecond laser pulses. Opt. Lett. 2007, 32, 2251. [Google Scholar] [CrossRef]
  33. Zhi, M.; Sokolov, A.V. Broadband generation in a Raman crystal driven by a pair of time-delayed linearly chirped pulses. New J. Phys. 2008, 10, 025032. [Google Scholar] [CrossRef] [Green Version]
  34. Laubereau, A.; Kaiser, W. Vibrational dynamics of liquids and solids investigated by picosecond light pulses. Revs. Modern Phys. 1978, 55, 60. [Google Scholar] [CrossRef]
  35. Penzkofer, A.; Laubereau, A.; Kaiser, W. High Intensity Raman Interactions. Prog. Quant. Electr. 1979, 6, 55. [Google Scholar] [CrossRef]
  36. You, J.L.; Jiang, G.C.; Hou, H.Y.; Wu, Y.Q.; Chen, H.; Xu, K.D. Temperature-Dependent Raman Spectra and Microstructure of Barium Metaborate Crystals and Its Melts. Chin. Phys. Lett. 2002, 19, 205. [Google Scholar]
  37. Sugita, A.; Saito, T.; Kano, H.; Yamashita, M.; Kobayashi, T. Wave Packet Dynamics in a Quasi-One-Dimensional Metal-Halogen Complex Studied by Ultrafast Time-Resolved Spectroscopy. Phys. Rev. Lett. 2001, 86, 2158. [Google Scholar] [CrossRef]
  38. Kobayashi, T.; Saito, T.; Ohtani, H. Real-time spectroscopy of transition states in bacteriorhodopsin during retinal isomerization. Nature 2001, 414, 531. [Google Scholar] [CrossRef]
  39. Roy, K.; Kayal, S.; Sriese, A.; Beeby, A.; Umpathy, S. Mode specific excited state dynamics study of bis(phenylethynyl)benzene from ultrafast Raman loss spectroscopy. J. Chem. Phys. 2017, 146, 064303. [Google Scholar] [CrossRef] [Green Version]
  40. Fang, C.; Tang, L.; Oscar, B.S.; Chen, C. Unveiling coupled electronic and vibrational motions of chromophores in condensed phases. J. Phys. Chem. Lett. 2018, 9, 3253. [Google Scholar] [CrossRef]
  41. Chen, S.L.; Zhao, Y.A.; Shao, A.D.; Wang, Y.Z.; Fang, Z.; Liu, X.F.; Hu, G.H.; Leng, Y.X.; Xu, Y. Ultrashort laser-driven stable-buckling of blisters in chirped mirror. Appl. Phys. Lett. 2013, 102, 081605. [Google Scholar] [CrossRef]
  42. Batigani, G.; Ferrante, C.; Scopigno, T. Accessing Excited State Molecular Vibrations by Femtosecond Stimulated Raman Spectroscopy. J. Phys. Chem. Lett. 2020, 11, 7805. [Google Scholar] [CrossRef]
  43. Gruson, V.; Ernotte, G.; Lassonde, P.; Laramee, A.; Bionta, M.R.; Chaker, M.; Mauro, L.D.; Corkum, P.B.; Ibrahim Schmidt, B.E.; Legare, F. two-cycle IR laser pulses via frequency domain optical parametric amplification. Opt. Express 2017, 25, 27706. [Google Scholar] [CrossRef] [Green Version]
  44. Krauth, J.; Steinmann, A.; Hegenbarth, R.; Conforti, M.; Giessen, H. Broadly tunable femtosecond near- and mid-IR source by direct pumping of an OPA with a 41.7 MHz Yb:KGW oscillator. Opt. Express 2013, 21, 11516. [Google Scholar] [CrossRef] [Green Version]
  45. Kloz, M.; Grondeee, R.V.; Kennis, T.M. Correction for the time dependent inner filter effect caused by transient absorption in femtosecond stimulated Raman experiment. Chem. Phys. Lett. 2012, 544, 94. [Google Scholar] [CrossRef]
  46. Kim, J.W.; Yoon, T.H.; Cho, M. Time-Resolved Impulsive Stimulated Raman Spectroscopy with Synchronized Triple Mode-Locked Lasers. J. Phys. Chem. Lett. 2020, 11, 2864. [Google Scholar] [CrossRef]
Figure 1. Experimental setup: BS, beam splitter (R = 20% at 800 nm); BBO1, 170-μm BBO crystal (cut at an angle of 29.2°); BBO2, 1-mm BBO crystal (cut at an angle of 31.5°); UVFS, ultraviolet-grade fused silica; S, 2-mm-thick sapphire plate; M1 and M2, harmonic separators (HR at 400 nm and AR at 800 nm); M3, silver-coated mirror; CM, chirped mirror pair (Layertec GmbH, model 103189).
Applsci 11 07578 g001
Figure 2. Two-dimensional plots of the pump-seed delay time dependence of the amplified signal spectra measured using a multichannel lock-in amplifier. (ah) show the results for different experimental configurations, namely number of bounces at the chirped mirror in the white-light seed-compression system and across the length of the glass in the pump-pulse stretcher. Using (N, L) to denote the bouncing number (N) and glass length (L) in centimeters, (ah) correspond to (0,0), (1,0), (2,0), (3,0), (4,0), (4,3), (4,4), and (4,5), respectively.
Applsci 11 07578 g002
Figure 3. (a) Two-dimensional plot of the pump–seed delay time (from −300 fs to +200 fs) dependence of the amplified signal spectral shape measured by a commercial spectrometer (Ocean Optics model USB4000). (b) The cross-sectional intensities of amplified signal at delays of −15 fs, −60 fs, and −80 fs for blue solid, red dashed, and blue dashed lines, respectively.
Applsci 11 07578 g003
Figure 4. The distribution of the difference between the spectral peak and valleys in the amplified signal spectrum shown in Figure 2. The experimental condition of the pre-compensation and stretching of the pump pulse are the same as in Figure 1. The marks represent the difference of the peak–peak, valley–valley, and peak–valley in Figure 2 and the differences in wave number are given by the ordinate. The positions of the marks in the abscissa are arbitrarily set for the plotting to be easily observed with moderate density of the dots without any specific meaning.
Applsci 11 07578 g004
Figure 5. Amplified signal intensity as a function of pump-signal delay at four wavelengths. In (14), the curves from top to bottom are respectively taken from Figure 2a–h.
Applsci 11 07578 g005
Figure 6. Panels (ad) plot the Fourier transforms of the curves in Figure 5(1)–(4). The sequence of curves from top to bottom in each panel follows those shown in Figure 5.
Applsci 11 07578 g006
Figure 7. Distribution of peaks in the Fourier power spectra of Figure 6. The Raman shift signals are plotted as dashed lines. The numbers in the legend refer to the caption of Figure 2. The marks indicate the vibrational modes found in Figure 6 and the ordinate indicates the frequency in wavenumbers.
Applsci 11 07578 g007
Figure 8. (a) Amplified signal spectrum. (b) Two-dimensional results of a FROG measurement.
Applsci 11 07578 g008
Table 1. Raman frequency shift (RS) in BBO crystal from Ref. (Chin. Phys. Lett. 19 (2002) 205).
No.RS (cm−1)No.RS (cm−1)No.RS (cm−1)
158648011790
21247599121526
31808622131547
42479639141559
53851066515
Publisher’s Note: MDPI stays neutral with regard to jurisdictional claims in published maps and institutional affiliations.

