Article

Post-Cyclic Mechanical Behaviors of Undisturbed Soft Clay with Different Degrees of Reconsolidation

1
State Key Laboratory of Geomechanics and Geotechnical Engineering, Institute of Rock and Soil Mechanics, Chinese Academy of Sciences, Wuhan 430071, China
2
School of Engineering Science, University of Chinese Academy of Sciences, Beijing 100049, China
3
Hubei Key Laboratory of Geo-Environmental Engineering, Institute of Rock and Soil Mechanics, Chinese Academy of Sciences, Wuhan 430071, China
4
China-Pakistan Joint Research Center on Earth Sciences, Islamabad 45320, Pakistan
5
The Soft Soil Research Center in Ningbo University of Technology, State Key Laboratory of Geomechanics and Geotechnical Engineering, Ningbo 315211, China
6
National-Local Joint Engineering Research Center of Underwater Tunneling Technology, Wuhan 430063, China
7
Jinhua Jinhua-Yiwu-Dongyang Rail Transit Co., Ltd., Jinhua 321000, China
8
China Railway Major Bridge Reconnaissance & Design 22 Institute Co., Ltd., Wuhan 430050, China
9
School of Civil Engineering, Guangzhou University, Guangzhou 510006, China
*
Author to whom correspondence should be addressed.
Appl. Sci. 2021, 11(16), 7612; https://doi.org/10.3390/app11167612
Submission received: 18 July 2021 / Revised: 15 August 2021 / Accepted: 17 August 2021 / Published: 19 August 2021

Abstract

:
Soft soil is often subjected to cyclic loading such as that imposed during storms, under traffic, or in an earthquake. Furthermore, the cyclic-loading-induced excess pore water pressure can be partially dissipated after cyclic loading. Thus, different reconsolidation processes should be considered. A series of static and dynamic triaxial tests were conducted on undisturbed soft soil to determine the post-cyclic mechanical behavior thereof, such as the variation of undrained shear strength, the development of excess pore water pressure, and the evolution of effective stress path. The effects of consolidated confining pressure, cyclic stress ratio, and degree of reconsolidation were analyzed. Results show that the trend of all stress–strain curves is similar under different conditions. The effect of the degree of reconsolidation is such that, with increasing the degree of reconsolidation, the shear strength is enhanced. Meanwhile, compared with undrained shear strength without cyclic loading, the shear strength after cyclic loading with full reconsolidation is increased. These factors also have a significant effect on the undrained shear strength: the greater both the confining pressure and cyclic stress ratio are, the higher the undrained shear strength. A positive excess pore water pressure is always observed during post-cyclic shearing process, irrespective of different factors. The S-shaped effective stress paths under different test conditions are observed and cross the critical state line. The microstructures of undisturbed soil and post-cyclic specimens with different degrees of reconsolidation were quantitatively investigated. Besides that, the degree of influence of different factors on the post-cyclic undrained strength was analyzed. Based on the test results, the undrained shear strength with cyclic load-history was well predicted by existing models.

1. Introduction

Soft soil is widely distributed in China, such as Wenzhou, Ningbo, Xiamen, and Zhujiang. It is usually characterized by high water content, great compressibility, remarkable sensitivity, low permeability, and low strength. Soft clay beneath infrastructure bears various cyclic loads caused by storm-induced wave action [1], earthquakes [2], and traffic [3]. These effects are all long-term actions [4]. Due to this cyclic loading, engineering accidents occur frequently in such areas. For example, most of failures of earth dams occurred up to 24 h after an earthquake [5]. The runway at Wenzhou airport has undergone a surprising amount of settlement under the effect of traffic loading (reaching 555 mm) [6]. In the second phase of the Yangtze Estuary Deepwater Channel Regulation Project, part of the semi-circular caissons has subsided by 1 to 5 m and slipped by about 20 m under the action of strong wind and waves [7]. Since cyclic loading may lead to a reduction of soil strength [4,8], the post-cyclic shear characteristics of soft soil have become one of the main problems for engineering design.
In recent years, the mechanical response of soft soil after cyclic loading has been widely studied [9,10,11,12]. Generally speaking, the average effective stress decreases companion with the increase of excess pore water pressure under cyclic loading, which leads to a decrease in the post-cyclic strength of the soil [13,14,15,16,17,18,19]. The induced excess pore water pressure directly affects the degradation of post-cyclic strength. Existing results have confirmed that the induced excess pore water pressure under cyclic loading is mainly affected by soil properties and loading methods [20,21]. At present, the post-cyclic shear characteristics for different soil types [5,17,19,22,23,24,25] and loading conditions [4,15,16,26,27,28,29,30] has been extensively studied. Soroush and Soltani-Jigheh [5] found that the content of granular material had little effect on the post-cyclic shear strength. Noorzad et al. [23] studied the effects of silt content on post-cyclic shear characteristics of sand and found that the strength decreased with 15% silt and the strength increased with 30% silt (by mass). Hyde and Ward [24] found that normally consolidated and slightly overconsolidated samples had a greater reduction in strength after cyclic loading than heavily overconsolidated samples. Wang et al. [25] also found that the normalized post-cyclic undrained shear strength of MRV silt reconsolidated increased with overconsolidation ratio (OCR). Yasuhara et al. [17] observed that the post-cyclic degradation of stiffness for low-plasticity silt was more obvious than that of strength, and this trend increased with increasing OCR.
The cyclic loading history also affects the post-cyclic shear characteristics. Wang et al. [26] studied the influences of a series of loading conditions on the post-cyclic shear strength of the soil without reconsolidation. The results showed that with the increase of initial undrained shear stress ratio, cyclic stress ratio (CSR), and number of cycles, the post-cyclic shear strength decreased. Li et al. [4] investigated the post-cyclic shear behavior of natural marine clay and found that the post-cyclic undrained peak strength of normally consolidated Wenzhou clay without reconsolidation was reduced compared with the strength without cyclic loading, and its degradation increases with increasing cyclic stresses and number of cycles. The post-cyclic shear strength of Mexico City clay was examined by Diazrodriguez [27], in which the degradation of the post-cyclic strength largely depended on the cyclic stress ratio of the clay. Pillai et al. [28] studied the effect of microfabric on cyclic behavior on Kaolin Clay and observed that the post-cyclic strength and stiffness increased under higher CSRs of flocculated samples, however the increase in strength was not seen in dispersed samples. Wang et al. [29] conducted a series of triaxial tests to investigate the effect of clay content on the post-cyclic shear behavior of low-plasticity silt and found that the undrained shear strength after cyclic loading increased with full reconsolidation. Many studies [15,16,30] also observed the same conclusion.
It was also found that the specimens subjected to undrained cyclic loading exhibited an apparent overconsolidation compared with the monotonic tests [5]. The degree of apparent overconsolidation ratio (OCRapp) increased with continued cyclic loading [24,31]. Pillai et al. [28] also observed that the degree of apparent overconsolidation increased with higher CSRs. The relationship between OCRapp and post-cyclic shear strength has been studied [32,33,34]. Soroush and Soltani-Jigheh [5] observed that the OCRapp was the key factor of the effect on the post-cyclic shear behavior. Wang et al. [34] found that the normalized shear strength ratio increased with increasing OCRapp after liquefaction.
Yasuhara et al. [35] studied the reconsolidation characteristics of Drammen clay after cyclic loading and the results showed that the variation of recompression index was related to the induced excess pore water pressure and axial strain during cyclic loading: for normally-consolidated Drammen clays, the recompression index decreases with increasing accumulative excess pore water pressure and shear strain. Wijewickreme et al. [36] studied the post-cyclic reconsolidation characteristics of low-plasticity Fraser River silt. It was found that the volumetric strain during post-cyclic reconsolidation increased with the maximum excess pore water pressure and the maximum shear strain after cyclic loading: a method for estimating the post-cyclic reconsolidation strain of low plastic silt was presented. Yasuhara et al. [15,16] discussed the deformation and strength characteristics of fully-consolidated Ariake clay after cyclic loading and proposed a model for predicting post-cyclic shear strength based on the theory of equivalent overconsolidation.
Due to the periodicity of traffic loading and storm wave loading, post-cyclic soft soil is usually in an intermediate state between unconsolidated and completely consolidated. At present, there is little research [34,37] on the post-cyclic shear characteristics of soil with different degrees of reconsolidation, making it necessary to study the effect of different degrees of reconsolidation of soft soils.
There are few studies on the mechanical behavior of the soft clay located in the Pearl River Estuary; research into the post-cyclic mechanical behavior and microstructure of soft clay with different degrees of reconsolidation is even rarer. In the present work, a series of static and dynamic triaxial tests were conducted to study the post-cyclic mechanical behavior of soft clay located in the Pearl River Estuary. First, the effects of consolidated confining pressure, cyclic stress ratio, and degree of reconsolidation on post-cyclic undrained shear strength have been discussed. The development of excess pore water pressure and effective stress paths during post-cyclic shear process under various conditions was also investigated. Next, the microstructures of undisturbed soil specimens and with different degrees of consolidation were assessed. Then, the influences of different factors on the normalized post cyclic shear strength ratio (Sc,cu/Scu) are analyzed. Finally, the model developed by Yasuhara et al. [15] to predict the post-cyclic shear strength after full reconsolidation was employed to depict the evolution of post-cyclic shear strength of the soft clay located in the Pearl River Estuary. The aforementioned results can provide an experimental basis for the engineering design of soft soil in the Pearl River Estuary.

2. Test Samples and Experimental Program

2.1. Test Samples and Soil Properties

To preserve the original physico-mechanical properties of the soil as far as possible, undisturbed soft soil from the Pearl River Estuary was sampled from a depth of 7 m. The samples were collected using a thin-walled soil collector. The samples were stored with a constant temperature and humidity before testing. The soil is dark-grey and its particle size distribution is shown in Figure 1. Following the Ministry of Water Resources of the Peoples’ Republic of China (2019), the physico-mechanical indices of the tested soft clays are summarized in Table 1: this particular soft soil has high moisture content and a high void ratio. Each specimen is cylindrical, with a diameter of 38 mm and a height of 76 mm.

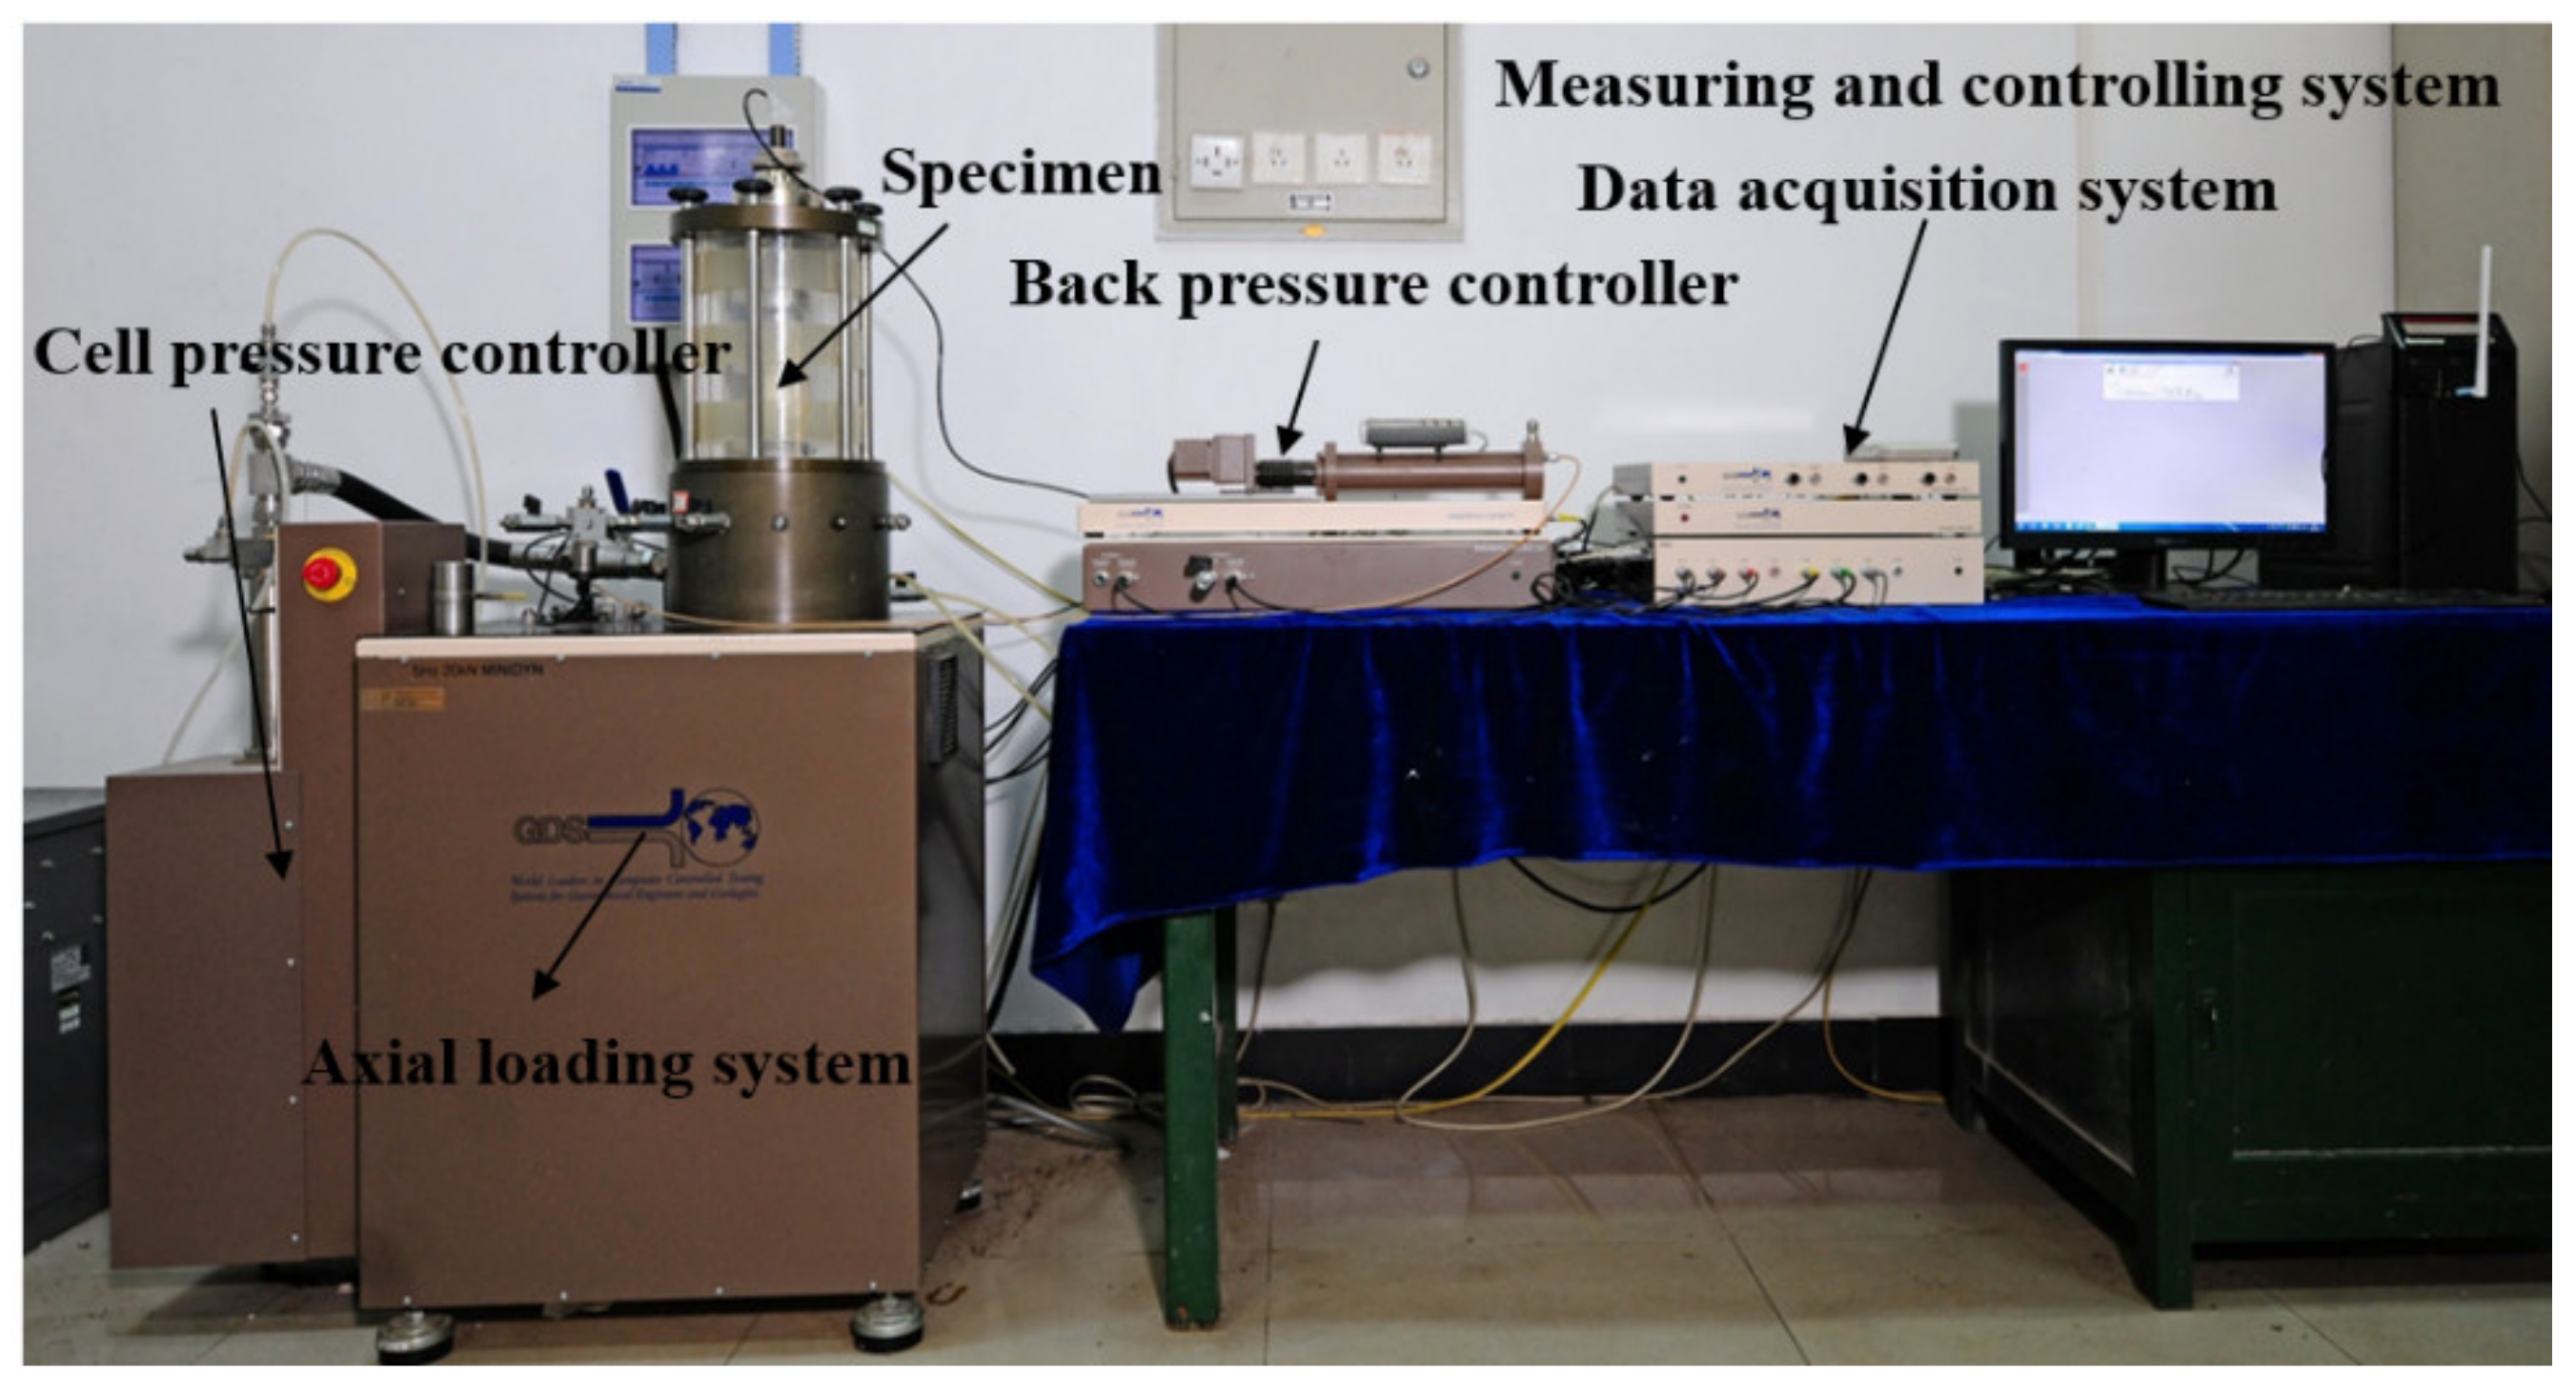
2.2. Experimental Equipment

The test instrument adopted in this study is the dynamic triaxial test system (DYNTTS, GDS, UK). Its main components include an axial loading system, cell-pressure controller, back-pressure controller, data-acquisition system, and measuring and controlling system (Figure 2). The whole test system is controlled by GDSLAB software, which allows automatic data acquisition and processing and plotting of experimental data. By changing the base and the triaxial tensile sample cap, static and dynamic tests of the samples with diameters of 38, 50, 70, and 100 mm can be conducted. In dynamic tests, not only can regular waveforms such as a sine wave, half-sine wave, and triangular wave be applied, but user-defined waveforms can be applied. The maximum allowable frequency in such experiments is 5 Hz, the maximum load capacity is 10 kN, and the maximum radial pressure is 2 MPa.
After the post-cyclic undrained triaxial shear tests, the microscopic tests were conducted by a Quanta250 scanning electron microscope analysis system. A focused electron beam was used to scan and image the specimen surface point-by-point. The imaging signal may contain secondary, back-scattered, or absorbed electrons. The current emitted by the electron gun excites the specimen surface, producing secondary electrons. The instrument can allow microscopic characterization of the surface morphology of the specimens.

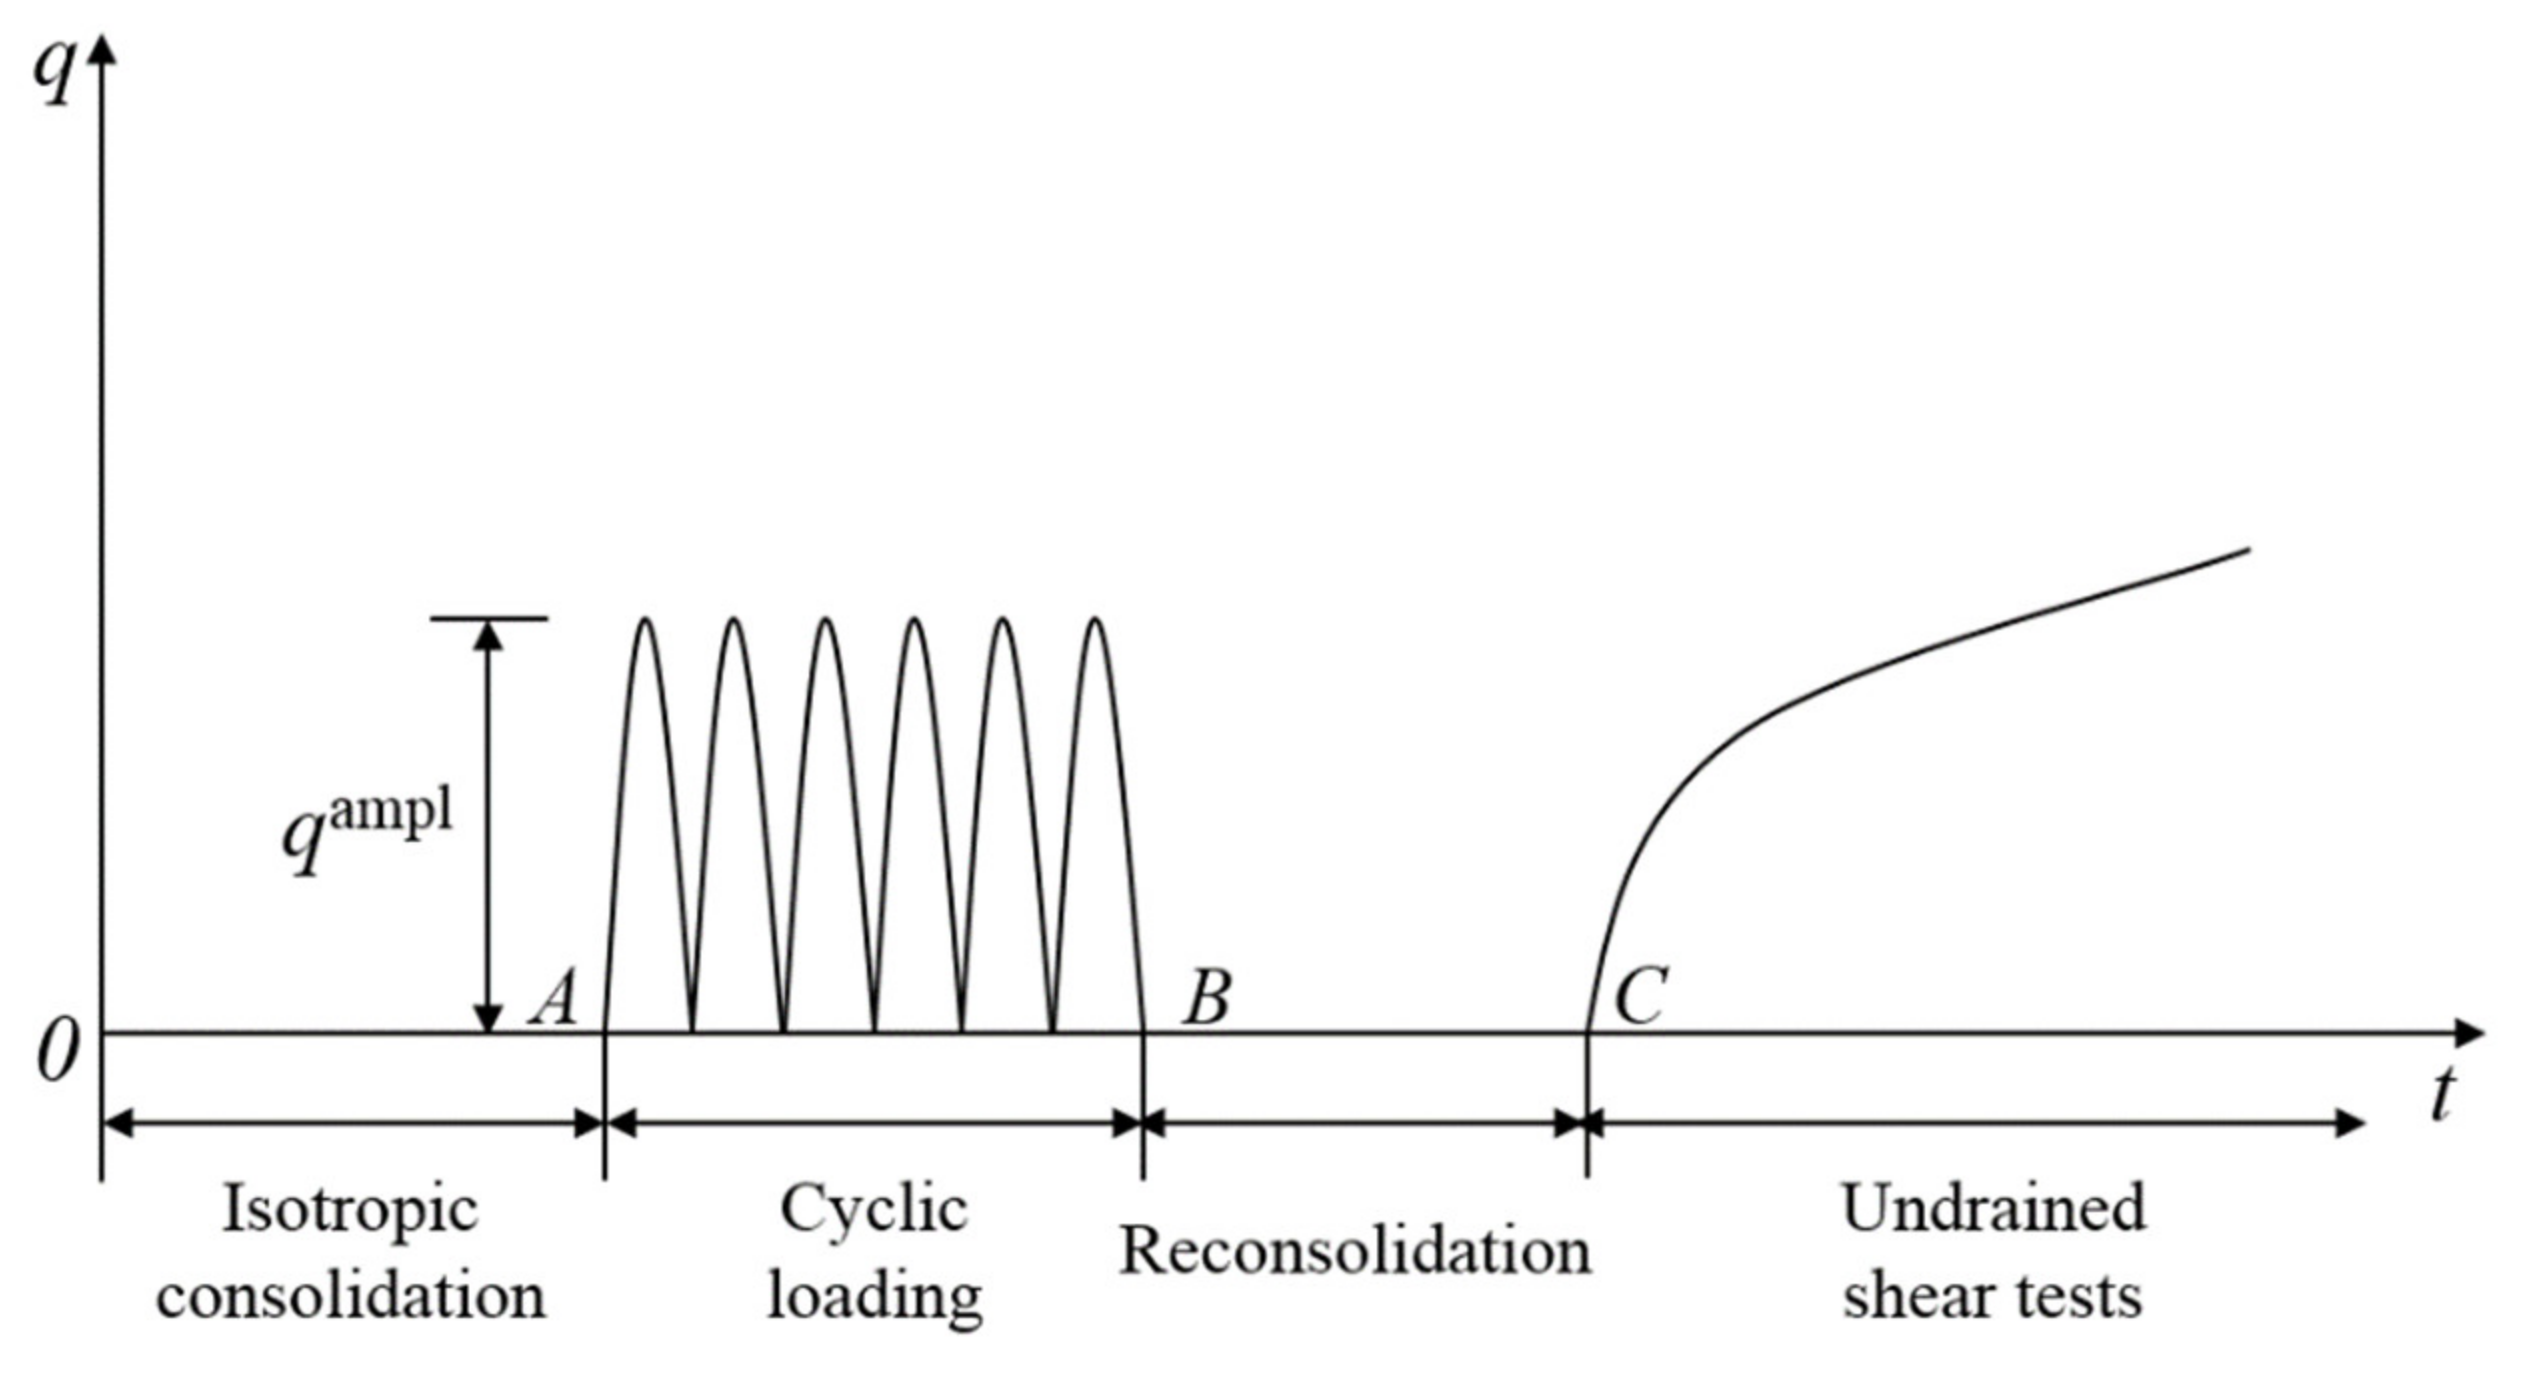
2.3. Experimental Scheme and Procedures

The whole test process is shown in Figure 3. First, the tested specimens are saturated by vacuum and back-pressure saturation. The vacuum was held for 4 h, then air-free distilled water was injected until the specimens were submerged; then, all specimens were soaked for more than 24 h. On this basis, the specimen was placed in the pressure chamber and saturated by way of back-pressure saturation. When Skempton’s B value reached 0.95 (or more), saturation was deemed to be completed.
Next, the sample was subjected to isotropic consolidation under a certain consolidation confining pressure. Since the coefficient of permeability of such a soft soil is small and the dissipation of excess pore water pressure is slow, it is considered that the consolidation of soil is completed when the drainage volume is less than 100 mm3/h. To analyze the effect of the confining pressure on the shear characteristics after cyclic loading, the confining pressure was set to 20 kPa, 40 kPa, and 60 kPa, in turn.
Cyclic triaxial tests were conducted on the consolidated soil under undrained conditions. The amplitude of cyclic deviatoric stress is described by cyclic stress ratio (CSR) proposed by Sakai et al. [20].
CSR = q ampl / 2 p 0 = q ampl / 2 σ 3
where p′0 represents the effective mean stress after consolidation and qampl is the amplitude of the cyclic deviator stress. Herein, when the effects of confining pressure and the degree of reconsolidation on the shear characteristics of soil after cyclic loading are considered, the CSR of 0.25 is employed, implying that the amplitude of the cyclic deviator stress applied to the specimen is half of the effective radial pressure. To facilitate the investigation into the effect of CSR, the effective confining pressure is set to 60 kPa, i.e., the CSR values are 0.083, 0.167, 0.250, and 0.333, respectively. All specimens were subjected to cyclic loading with half-sine wave. Moreover, the number of cycles n is 1000. To obtain more accurate pore water pressure, the loading frequency is 0.1 Hz.
Following that, the specimens subjected to cyclic loading were reconsolidated. Among that, specimens with different reconsolidation degrees can be obtained. The degree of reconsolidation (Ur) of the sample is defined by the degree of dissipation of excess pore water pressure induced during cyclic loading. As shown in Equation (2), after cyclic loading, back-pressure pu is applied to the specimen, and the accumulated excess pore water pressure dissipates to pu and then remains unchanged. Among that, the sample with Ur = 0 corresponds to the sample without reconsolidation, while Ur = 100% corresponds to the sample with complete reconsolidation.
U r = 1 p u ( Δ u ) c y
where (∆u)cy represents the excess pore water pressure induced during cyclic loading; pu is back pressure applied to the specimen during the reconsolidation process.
After reconsolidation, the specimens were subjected to strain-controlled undrained shearing. To study the effect of cyclic loading history on the shear characteristics of soft soil, the undrained shear strength (as measured by static triaxial testing) of specimens without cyclic loading history was compared. The shear failure was deemed to occur at 20% of the axial strain, and the whole shear process was set to last for 200 min (shearing rate was 0.1%/min) according to the Ministry of Water Resources of the Peoples’ Republic of China (2019). The undrained shear strength of specimens with and without cyclic loading history is defined as half of the peak deviatoric stress when the axial strain reaches 20%, as denoted by Sc,cu, and Scu, respectively. The test schemes are summarized in Table 2. The specimens with and without cyclic loading history are labeled “CY” and “ST”, respectively.

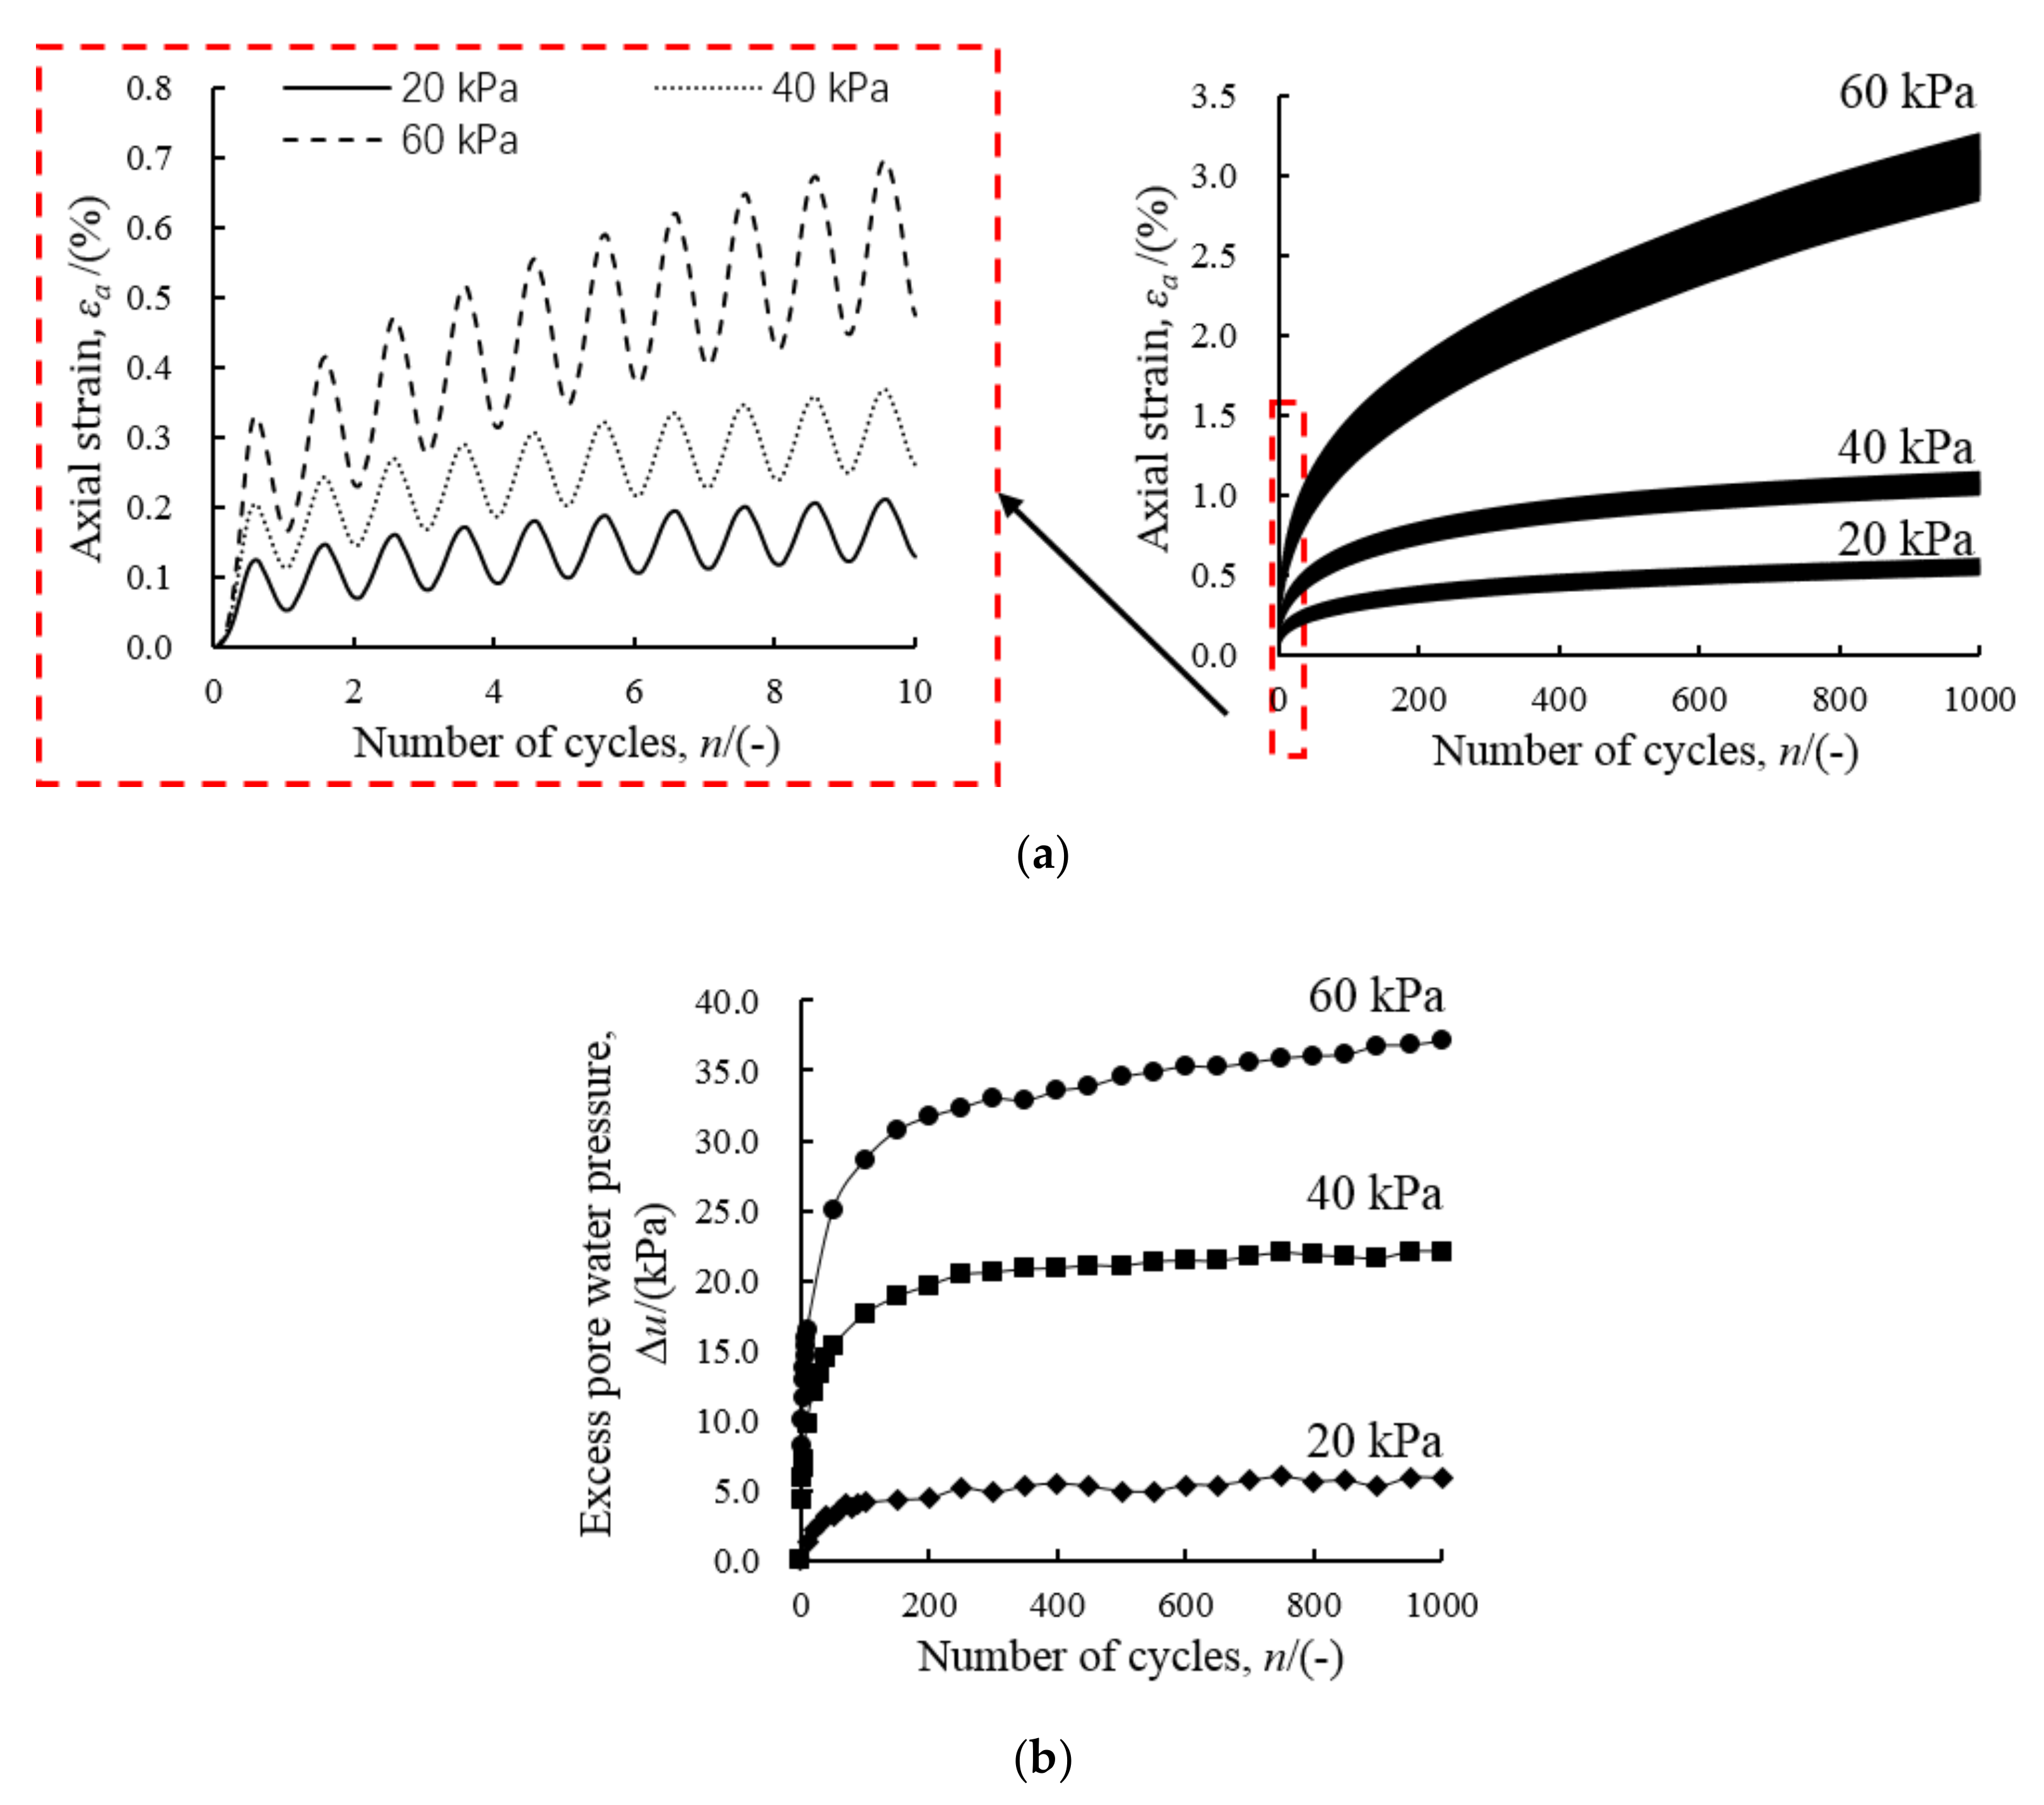
3. Dynamic Characteristics of Soft Clay

In this section, the effects of cyclic loading on the accumulated axial strain and excess pore water pressure with different consolidated confining pressures are analyzed. Figure 4 shows the general results of the cyclic triaxial test under constant confining pressure. It can be seen from Figure 4a that the loading waveform is stable during the application of cyclic loading. The axial strain εa,t can be divided into two parts, shown in Figure 4b,c: one is the recoverable deformation during unloading, that is, the resilient strain εa,r; the other is the strain which cannot be recovered and accumulates with increasing of the number of cycles, that is, accumulated strain εa,p. The variation of excess pore water pressure with n is shown in Figure 4d. Herein, excess pore water pressure accumulates with an increase in the number of cycles.
Figure 5 shows the development of accumulated axial strain and excess pore water pressure of the specimens with different consolidated confining pressures of 20 kPa, 40 kPa, and 60 kPa, respectively. Figure 5a illustrates the development of axial strain εa,t with increasing n: εa,t increases rapidly at the beginning of the test and tends to stabilize at a certain number of cycles. At a certain number of cycles, the accumulated axial strain increases with the increase of consolidated confining pressure. This is because the greater consolidated confining pressure corresponds to the higher cyclic deviator stress (with the same CSR). As a result, a larger accumulated axial strain can be observed for the specimen with higher confining pressure. Figure 5b describes the relationship between excess pore pressure ∆u and n at different confining pressures. As shown, ∆u increases rapidly in the initial stage, then the accumulation of excess pore water pressure slows down and the excess pore water pressure tends to be stable. Similarly, the greater the confining pressure, the greater the accumulated excess pore water pressure. For example, when the consolidated confining pressures are 20, 40, and 60 kPa, respectively, the corresponding excess pore water pressures are 6, 22, and 37 kPa.

4. Post-Cyclic Mechanical Characteristics of Soft Soil

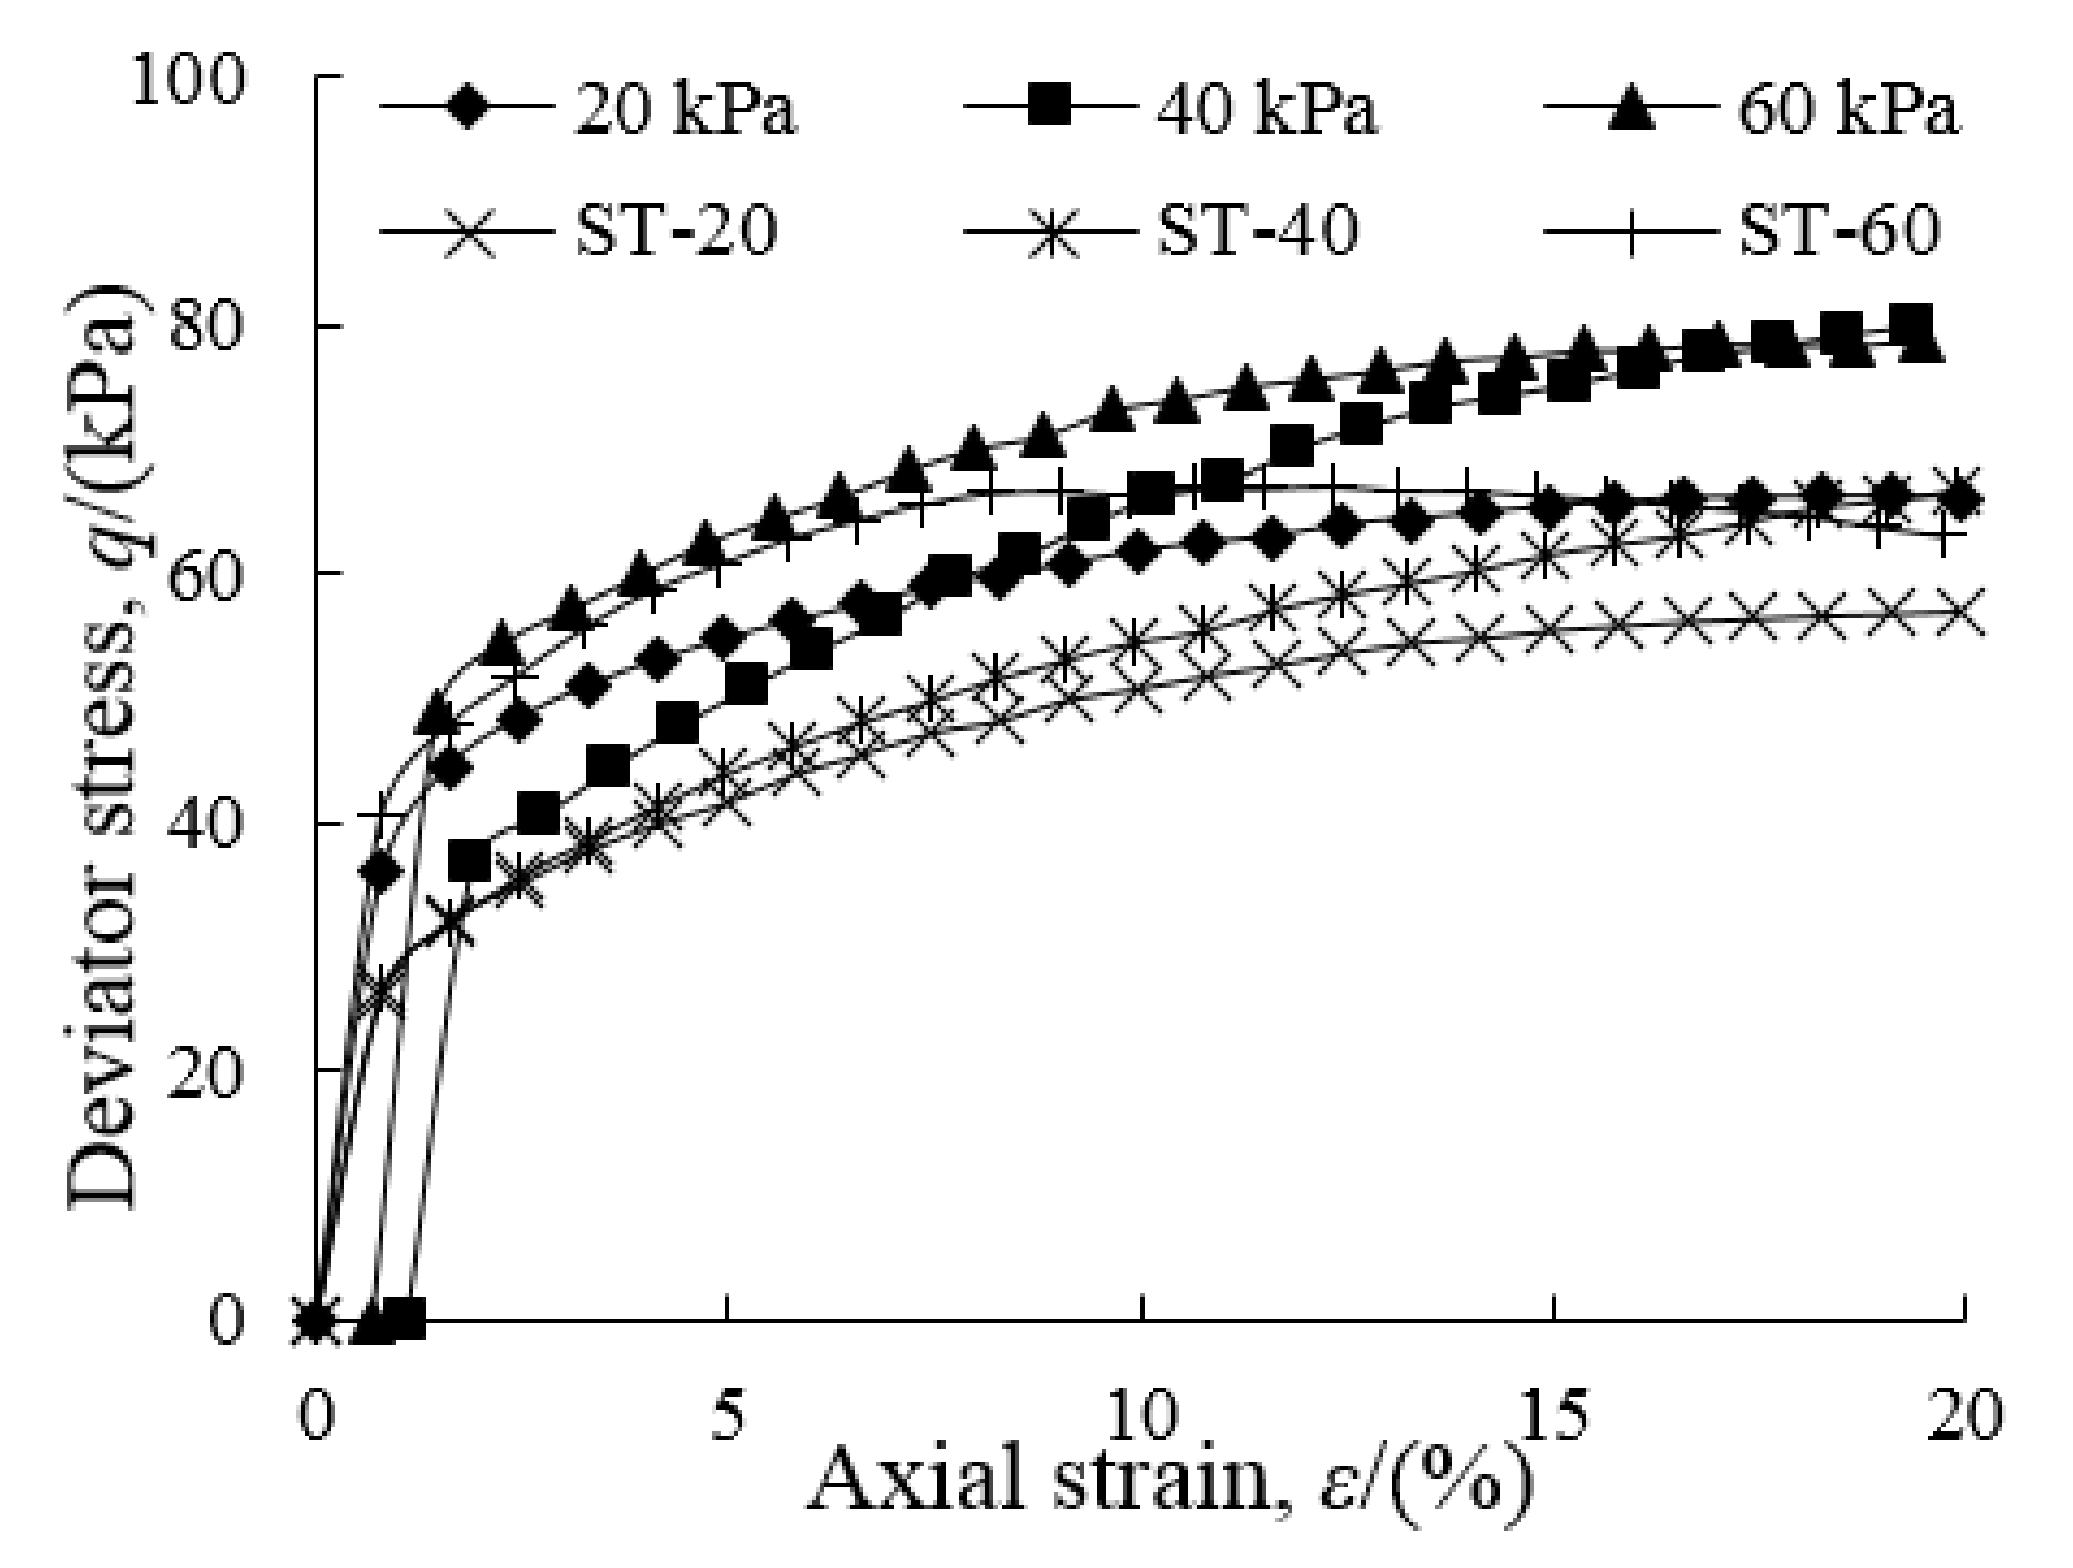
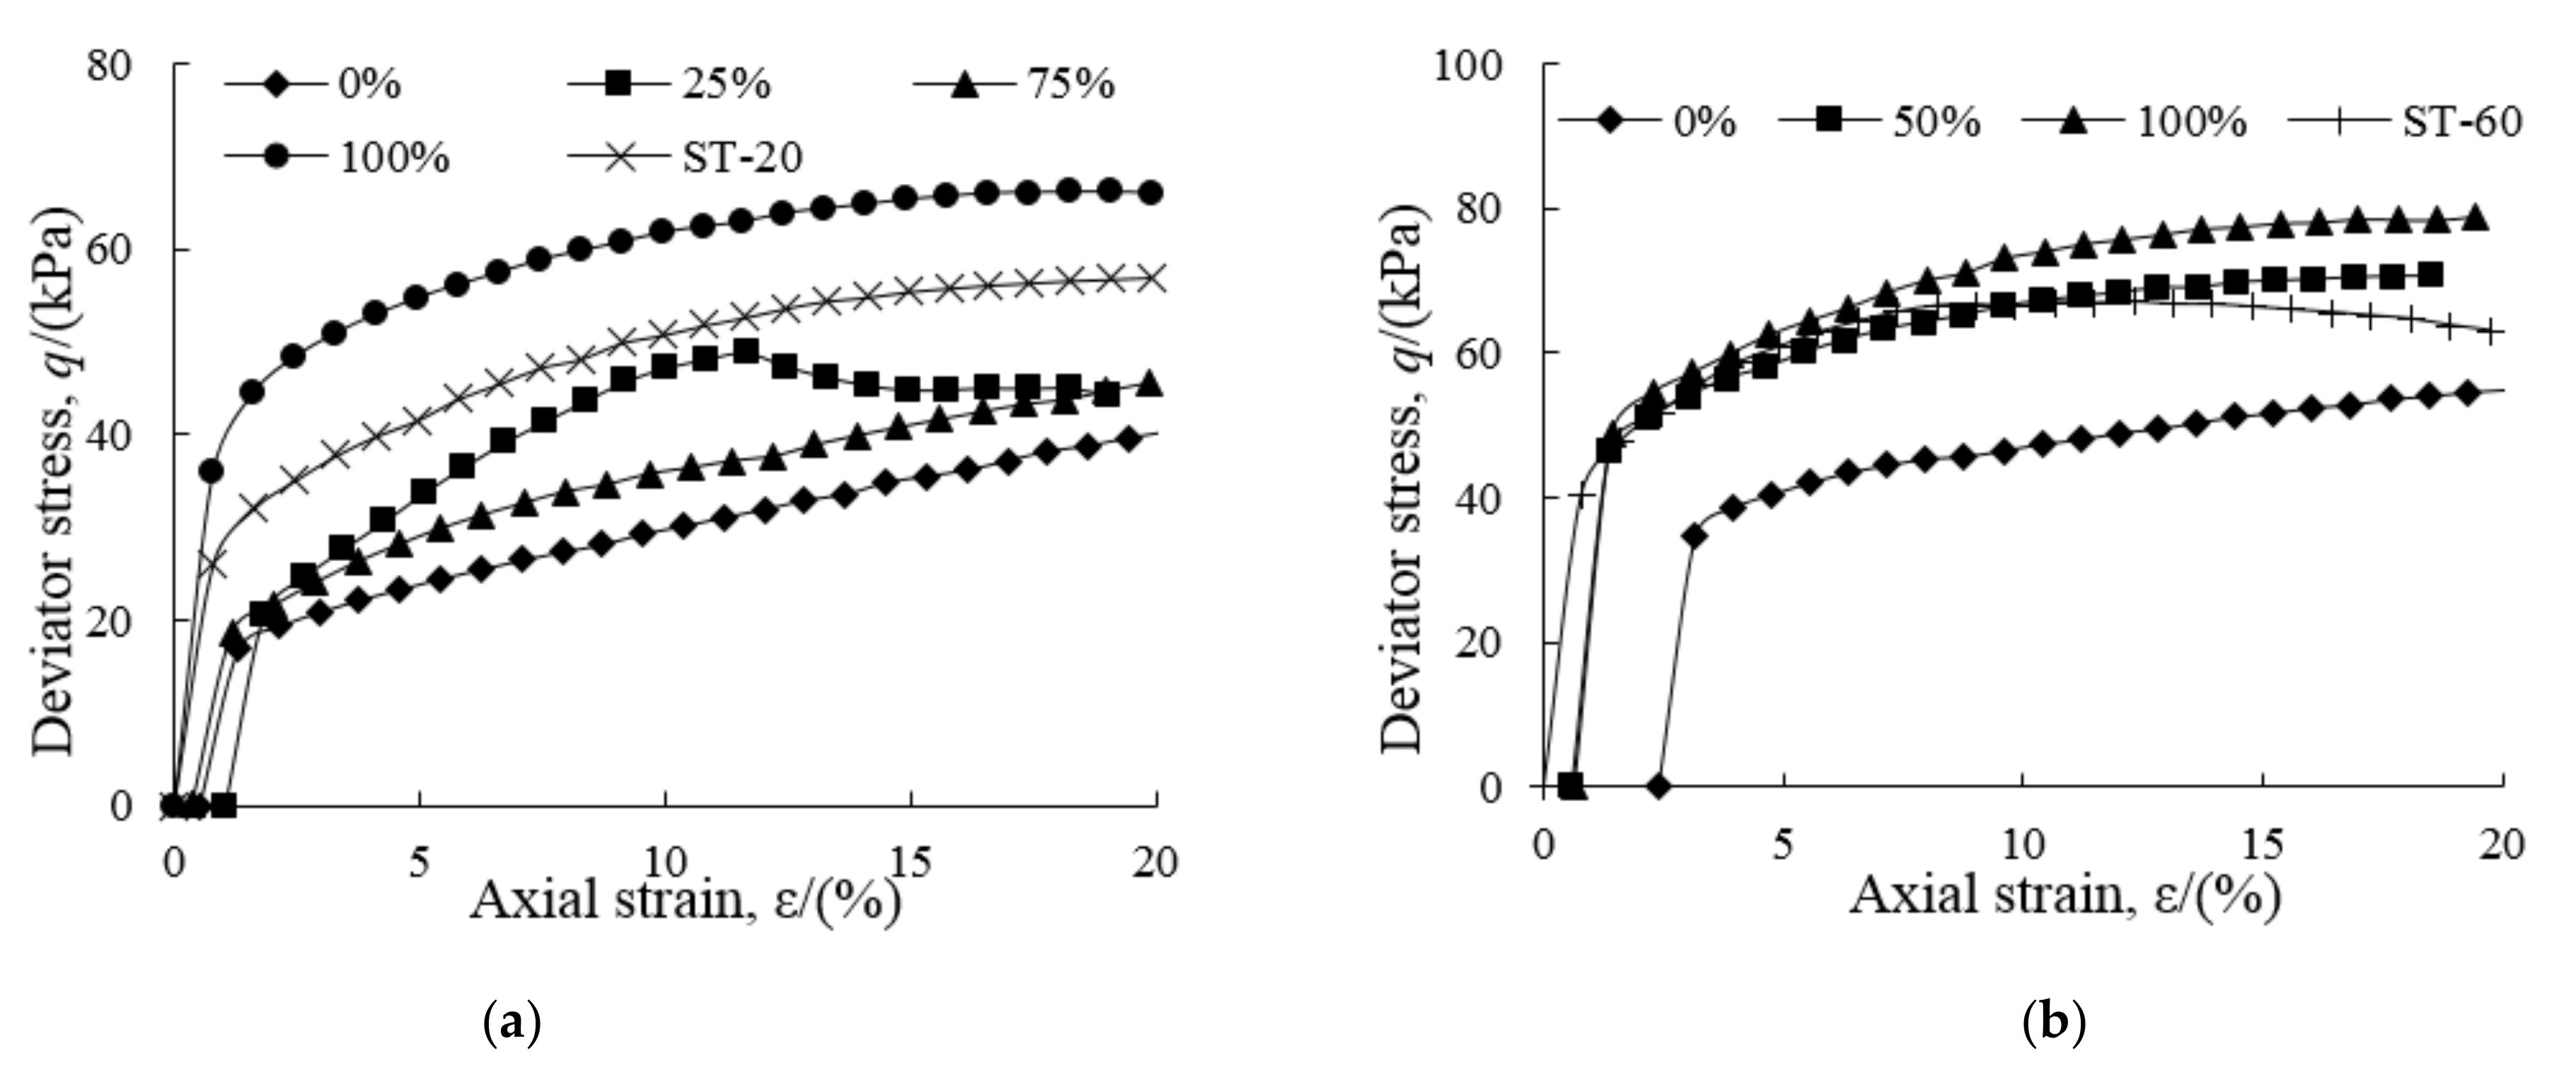
4.1. Stress–Strain Relationship

In this section, the stress–strain relationship with different degrees of reconsolidation and cyclic loading history is discussed. Figure 6, Figure 7 and Figure 8 show the post-cyclic undrained shear stress-strain (q-ε) relationship curves of specimens with different degrees of reconsolidation: the trend of stress–strain curves are similar. When the strain is low, the stress increases rapidly within a small range of strains, then, with increasing strain, the stress increases slowly and the non-linearity of the q-ε curves becomes more apparent. When the axial strain reaches 20%, the deviatoric stress tends to be stable. Since the strain generated after the cyclic loading is measured in terms of the total strain, the starting strain of the q-ε curves is different.
Figure 6 illustrates the post-cyclic stress–strain curves of the fully reconsolidated specimens (Ur = 100%) with different confining pressures and the curves of specimens without cyclic loading history are also plotted for comparison. It can be seen that, the greater the confining pressure, the greater the static shear strength Scu and post-cyclic shear strength Sc,cu. Moreover, the post-cyclic shear strength Sc,cu is larger than the static shear strength Scu at a given confining pressure. For example, when the consolidated confining pressure is 40 kPa, the corresponding post-cyclic shear strength and the static shear strength are 40.9 kPa, and 33.5 kPa, respectively.
The effect of the cyclic stress ratio (CSR) on the stress–strain relationship was investigated. Figure 7 shows the post-cyclic q-ε curves of fully reconsolidated specimens with n = 1000 and p′0 = 60 kPa. The results of the undrained triaxial shear test without cyclic loading history at a confining pressure of 60 kPa are also shown for comparison. As shown in Figure 7, in general, under the same test conditions, the initial strain increases with the CSR. This is mainly attributed to the promotional effect of cyclic deviator stress on the development of axial strain. When the amplitudes of the cyclic deviator stress are 10 kPa, 20 kPa, 30 kPa, and 40 kPa, the corresponding initial strain are 0.24%, 0.43%, 0.66%, and 4.27%, respectively. When the CSR is small, the difference between post-cyclic shear strength Sc,cu, and static shear strength Scu can be ignored; however, with the increase of the CSR, the post-cyclic shear strength of the specimen becomes significantly greater than the static shear strength. For example, when the amplitudes of cyclic deviator stress increase from 10 kPa to 40 kPa, the difference between post-cyclic shear strength and the static shear strength increases from −0.9 kPa to 9.3 kPa.
Figure 8 shows the post-cyclic q-ε curves of the specimens with different degrees of reconsolidation Ur. Among that, the CSR = 0.25, p′0 = 20 kPa, and 60 kPa, respectively. The peak stress of q-ε curves varies with Ur. In general, the greater Ur, the greater the post-cyclic shear strength Sc,cu. For example, when the Ur increase from 0% to 100% with p′0 = 60 kPa, respectively, the corresponding post-cyclic shear strength increases from 27.8 kPa to 39.5 kPa. When Ur > 75%, the undrained shear strength Sc,cu is larger than Scu while when Ur ≤ 75%, the undrained shear strength Sc,cu is smaller than Scu with p′0 = 20 kPa. This means that there is a critical degree of reconsolidation between 75% and 100%, at which, the post-cyclic shear strength equals the static shear strength. Wang et al. [37] also obtained similar conclusions on reconstituted marine silty clay.

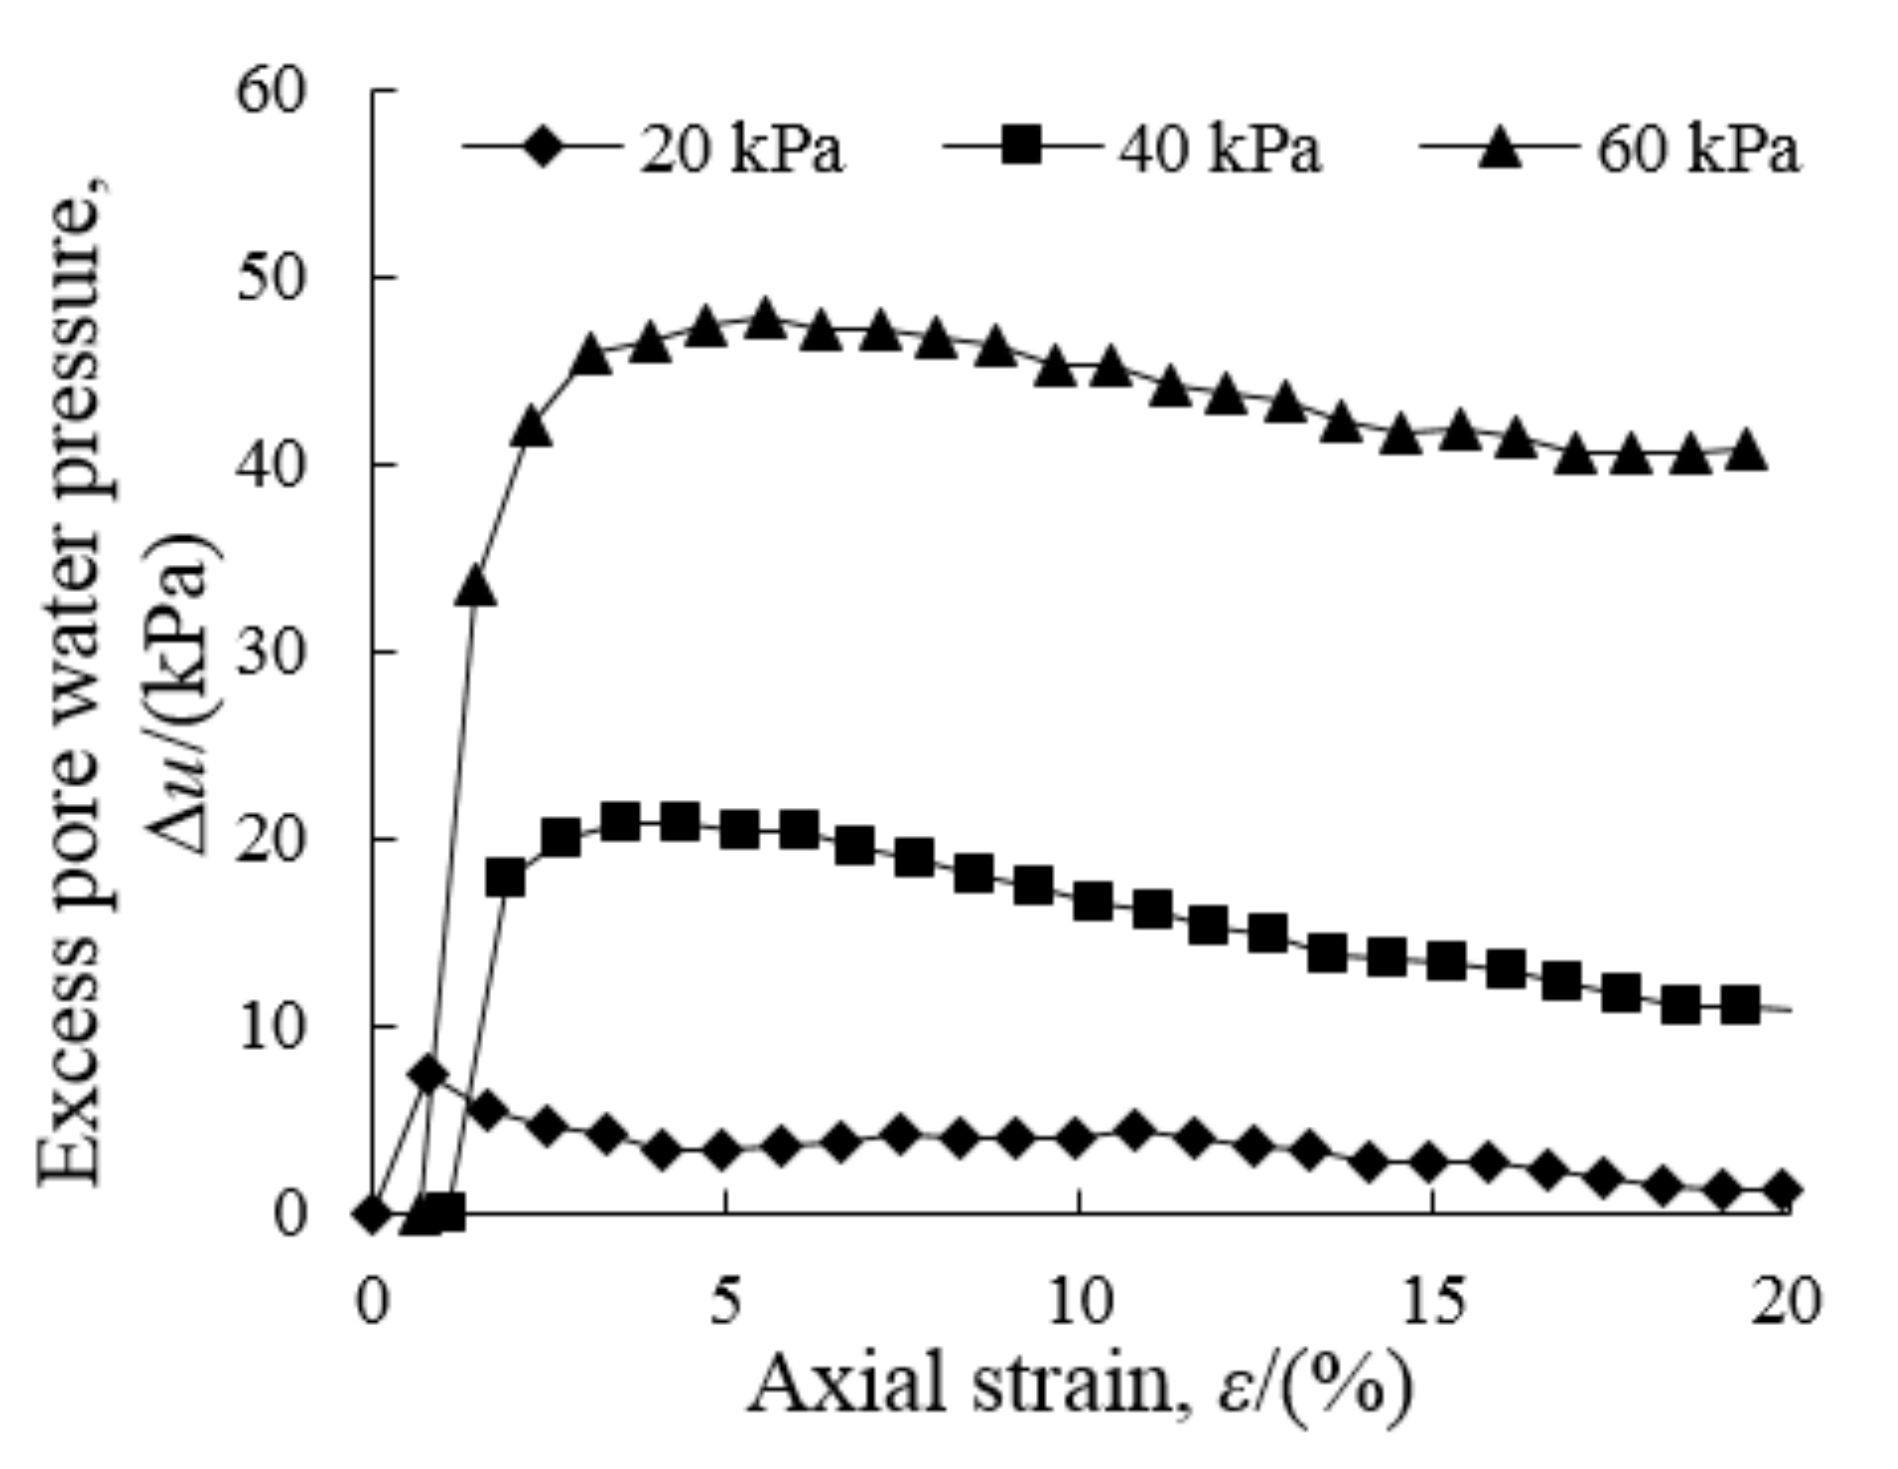
4.2. Excess Pore Water Pressure–Axial Strain Relationship

The excess pore water pressure under various conditions is investigated in this part. Figure 9, Figure 10 and Figure 11 represent the relationship between excess pore water pressure (∆u) and axial strain (ε) after cyclic loading. With the development of strain, the excess pore water pressure first increases rapidly, then decreases a little. Throughout, the undrained shear stage, the excess pore water pressure remained positive. The initial excess pore water pressure in the ∆u-ε curve is different because the excess pore water pressure generated after cyclic loading is included in the total excess pore water pressure.
The post-cyclic undrained shear ∆u-ε curves of different confining pressures are shown in Figure 9 for test conditions identical to those pertaining to Figure 5. The initial excess pore water pressure is zero because the specimens are fully reconsolidated after cyclic loading. It can be seen that, when the strain reaches a certain value, the excess pore water pressure decreases a little with increasing axial strain. Under different confining pressures, the excess pore water pressure attenuation section of the ∆u-ε curve is nearly parallel. The attenuation values of excess pore water pressure are 6.8 kPa, 10.8 kPa, and 8.2 kPa, respectively when the confining pressures are 20 kPa, 40 kPa, and 60 kPa. At the end of the test, the greater the confining pressure, the greater the excess pore water pressure.
Figure 10 shows the undrained shear ∆u-ε curve of fully reconsolidated specimens after cyclic loading with different CSRs and p’0 = 60 kPa. When the strain is very small, the excess pore water pressure accumulates rapidly with increasing strain yet when the strain reaches a certain value, the excess pore pressure decreases slowly with increasing strain. This is because normally-consolidated soft clay may exhibit the properties of an over-consolidated soil after cyclic loading. It can be seen that the greater the amplitude of cyclic loading, the more obvious this phenomenon is in this soft clay. When the strain reaches 20%, the larger the CSR, the smaller the excess pore water pressure.
The undrained shear ∆u-ε curves with different degrees of reconsolidation Ur are shown in Figure 11. The specimen has different initial accumulated excess pore water pressures depending upon the value of Ur. The initial excess pore water pressure during the undrained shearing process decreases with the increase of Ur. When p′0 = 60 kPa and the degree of reconsolidation are 0%, 50%, and 100%, the starting values of excess pore water pressure are 37.09 kPa, 24.60 kPa, and 0 kPa, respectively. The ∆u-ε curve of the specimen with Ur = 0 has reached a steady-state in the pre-middle shear period. When the axial strain reaches a certain value, there is a peak value present in the u-ε curve: thereafter, the excess pore water pressure gradually decreases with increasing axial strain until the end of the test.

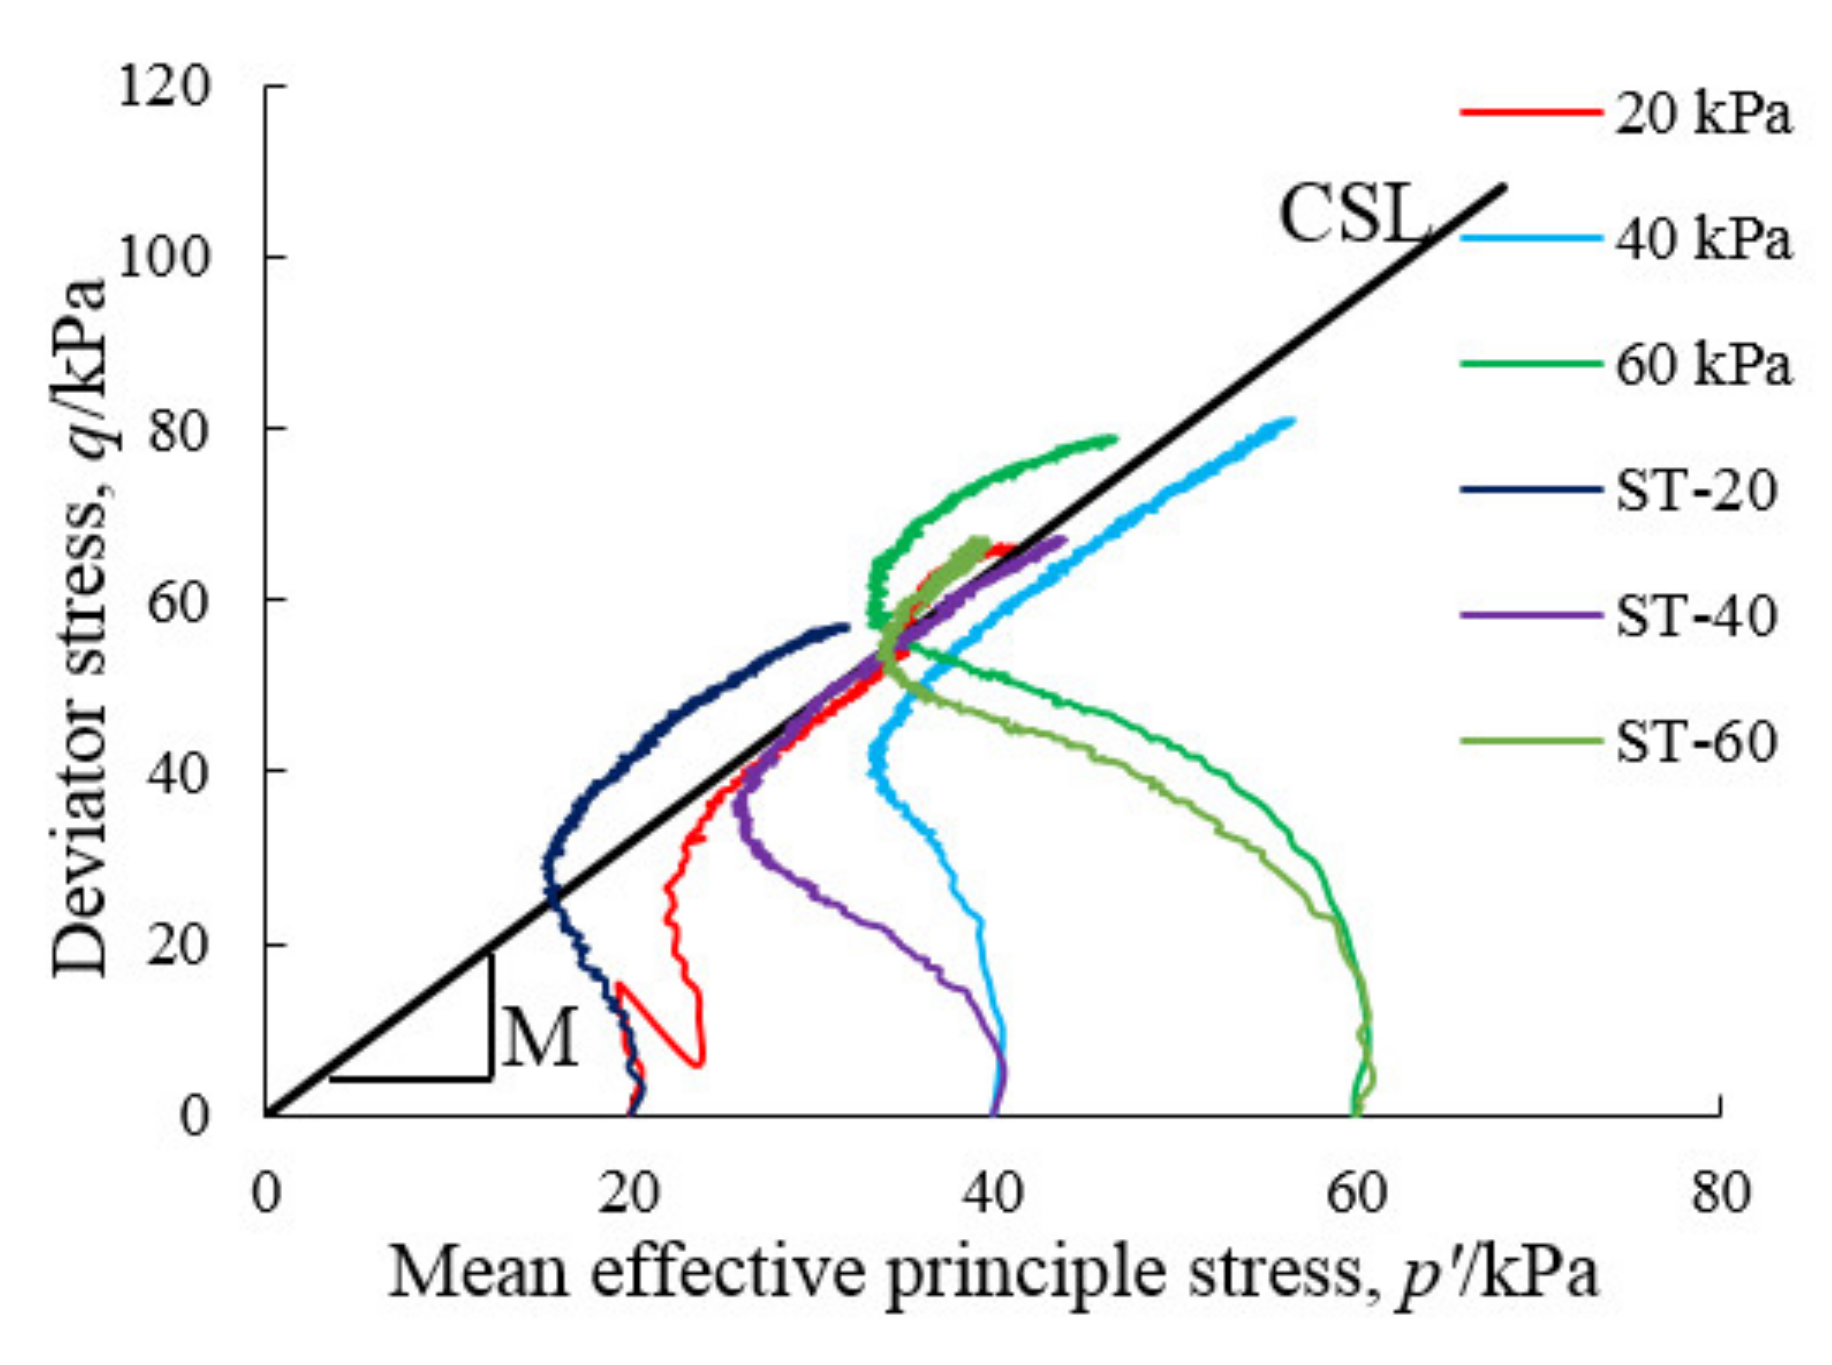
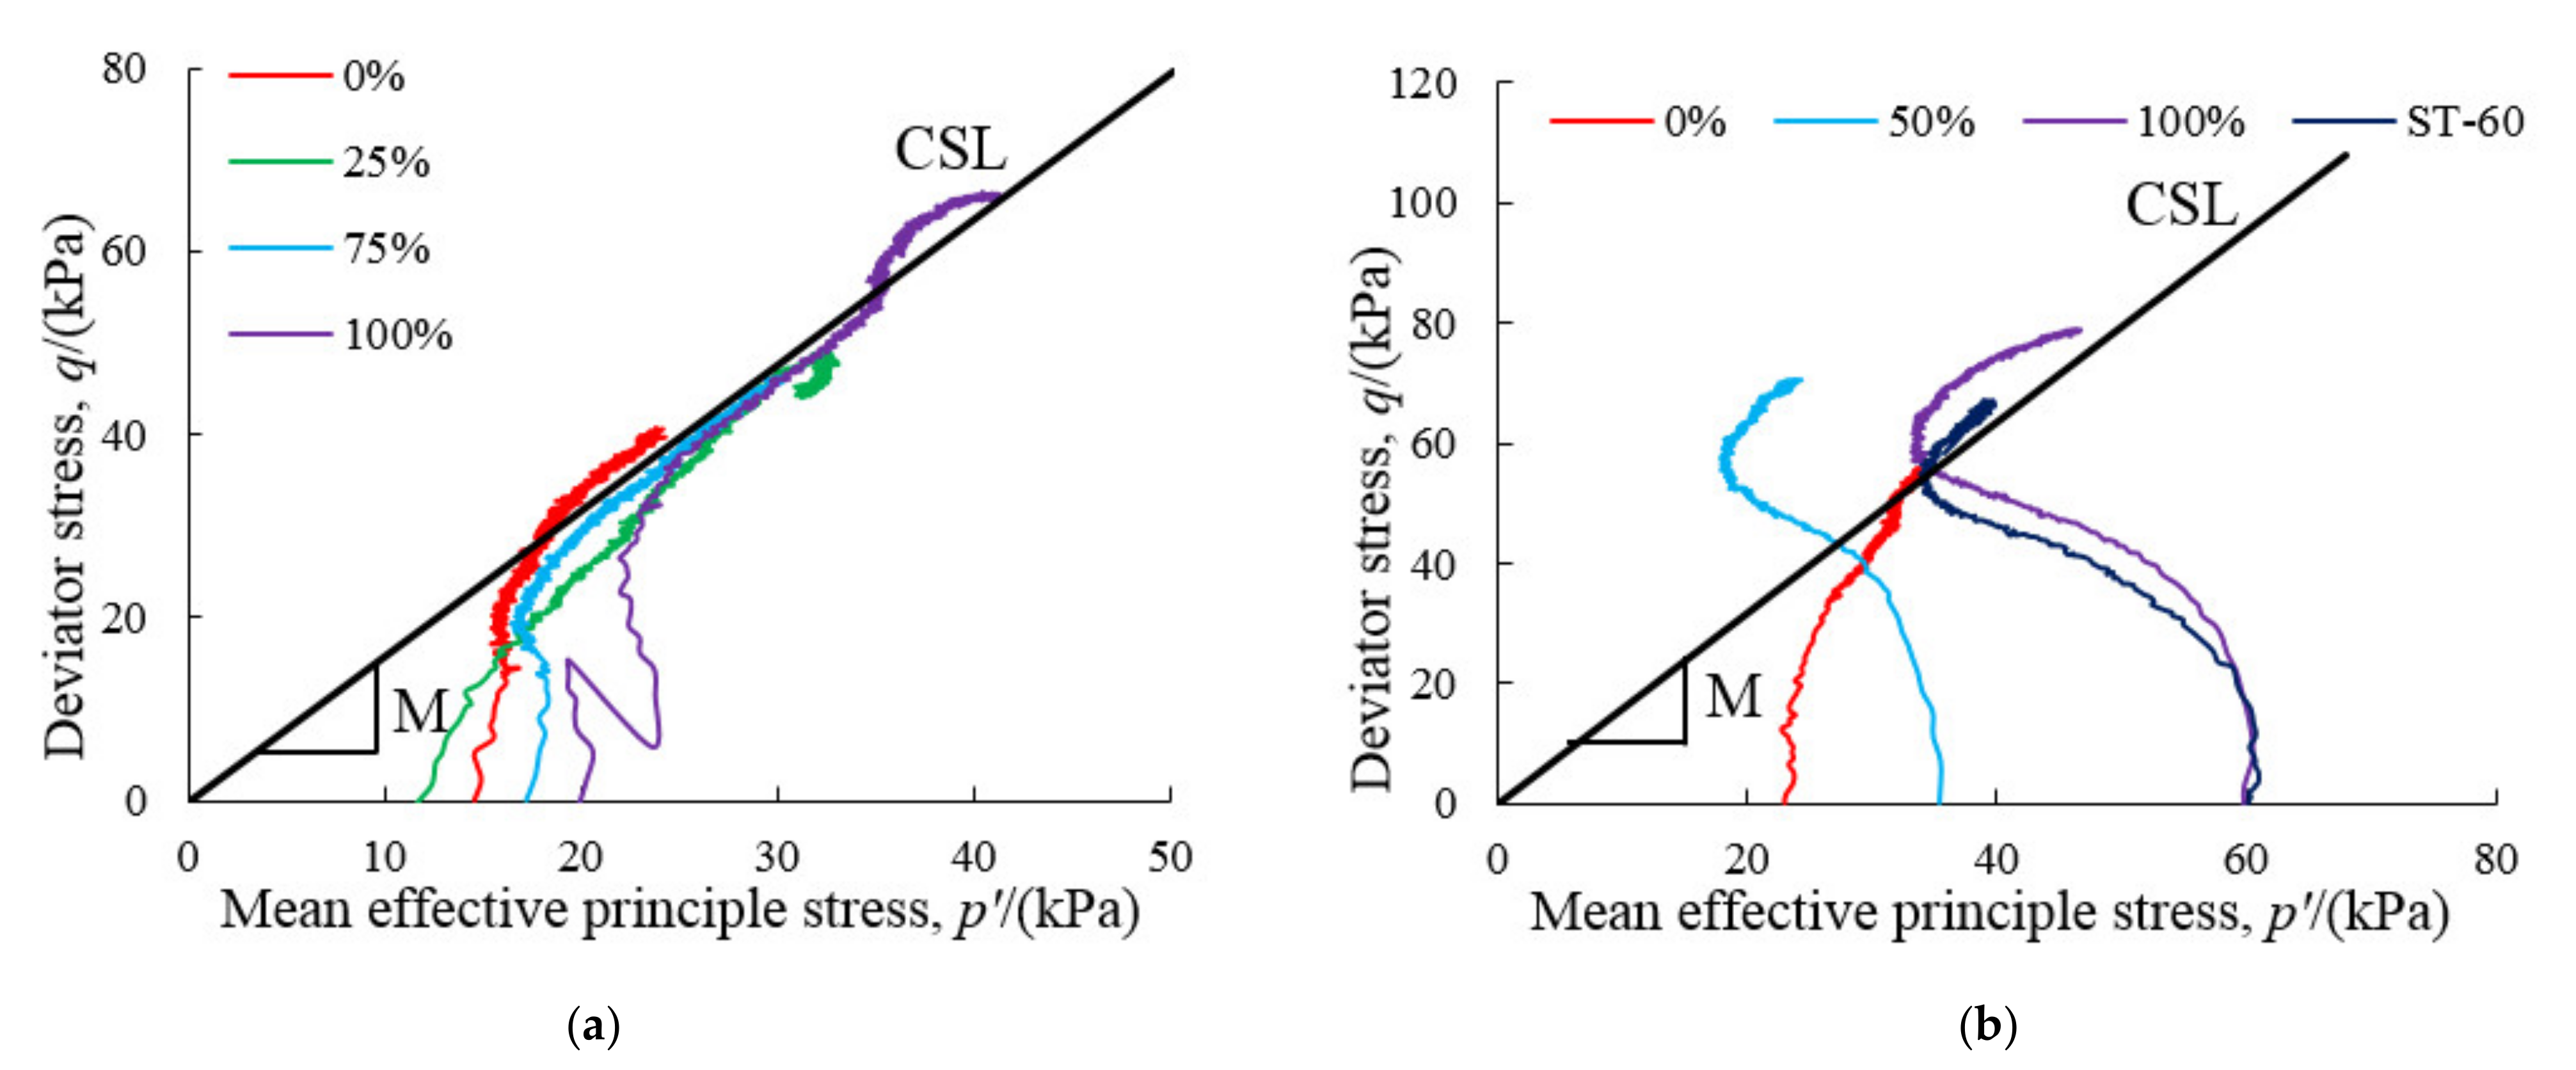
4.3. Effective Stress Paths

The shape and development trend of effective stress path during the post-cyclic shear process is analyzed. Figure 12, Figure 13 and Figure 14 show the undrained shear effective stress paths (ESPs) curves under different experimental conditions. The critical state line (CSL) in p′-q space can be determined by the best linear fit with the effective stress path endpoints of test ST-20, ST-40, and ST-60. The critical stress ratio M given by the CSL is 1.58. The S-shaped trend in the ESPs under different test conditions is similar. At the beginning of the test, due to the poor permeability of this soft soil, the induced excess pore water pressure is small. The stress applied to the specimen is almost entirely borne by the soil skeleton, and the deviator stress applied to the specimen increases rapidly within a small strain range. With continuous shearing, the excess pore water pressure begins to grow rapidly, and the increase of deviator stress decelerates, leading to the ESPs of the specimen being deflected to the left. When the axial strain reaches a certain value, the rate of increase in excess pore water pressure decreases, and the ESP deflects again. Moreover, the ESPs no longer develop after reaching the undrained shear strength, whereupon they cross the CSL.
Figure 12 shows the static and post-cyclic shear ESPs with different confining pressures, for Ur = 100% and CSR = 0.25; the ESPs of the post-cyclic specimens do not completely coincide with those without cyclic loading history ESPs for the specimens after cyclic loading have a greater degree of deflection to the left compared with the ESPs of specimens not subjected to cyclic loading.
The ESPs of static and post-cyclic undrained shearing with different CSRs are shown in Figure 13. Due to the full reconsolidation of the post-cyclic specimen, the starting points of the ESPs overlap and are equal to the confining pressure of 60 kPa. The deviator stress at the inflection point of each ESP increases with the increase of CSR. The failure points of specimen lie on the CSL.
Figure 14 shows the ESPs of static and post-cyclic undrained shearing with different degrees of reconsolidation. Since the degree of reconsolidation is determined by the dissipation of accumulated excess pore water pressure, the p’ value at the beginning of shearing increases with the increase of Ur. Compared with Figure 12 and Figure 13, the shape of ESPs with different degrees of reconsolidation is not S-shaped; similarly, the failure points cross or lie on, the CSL.

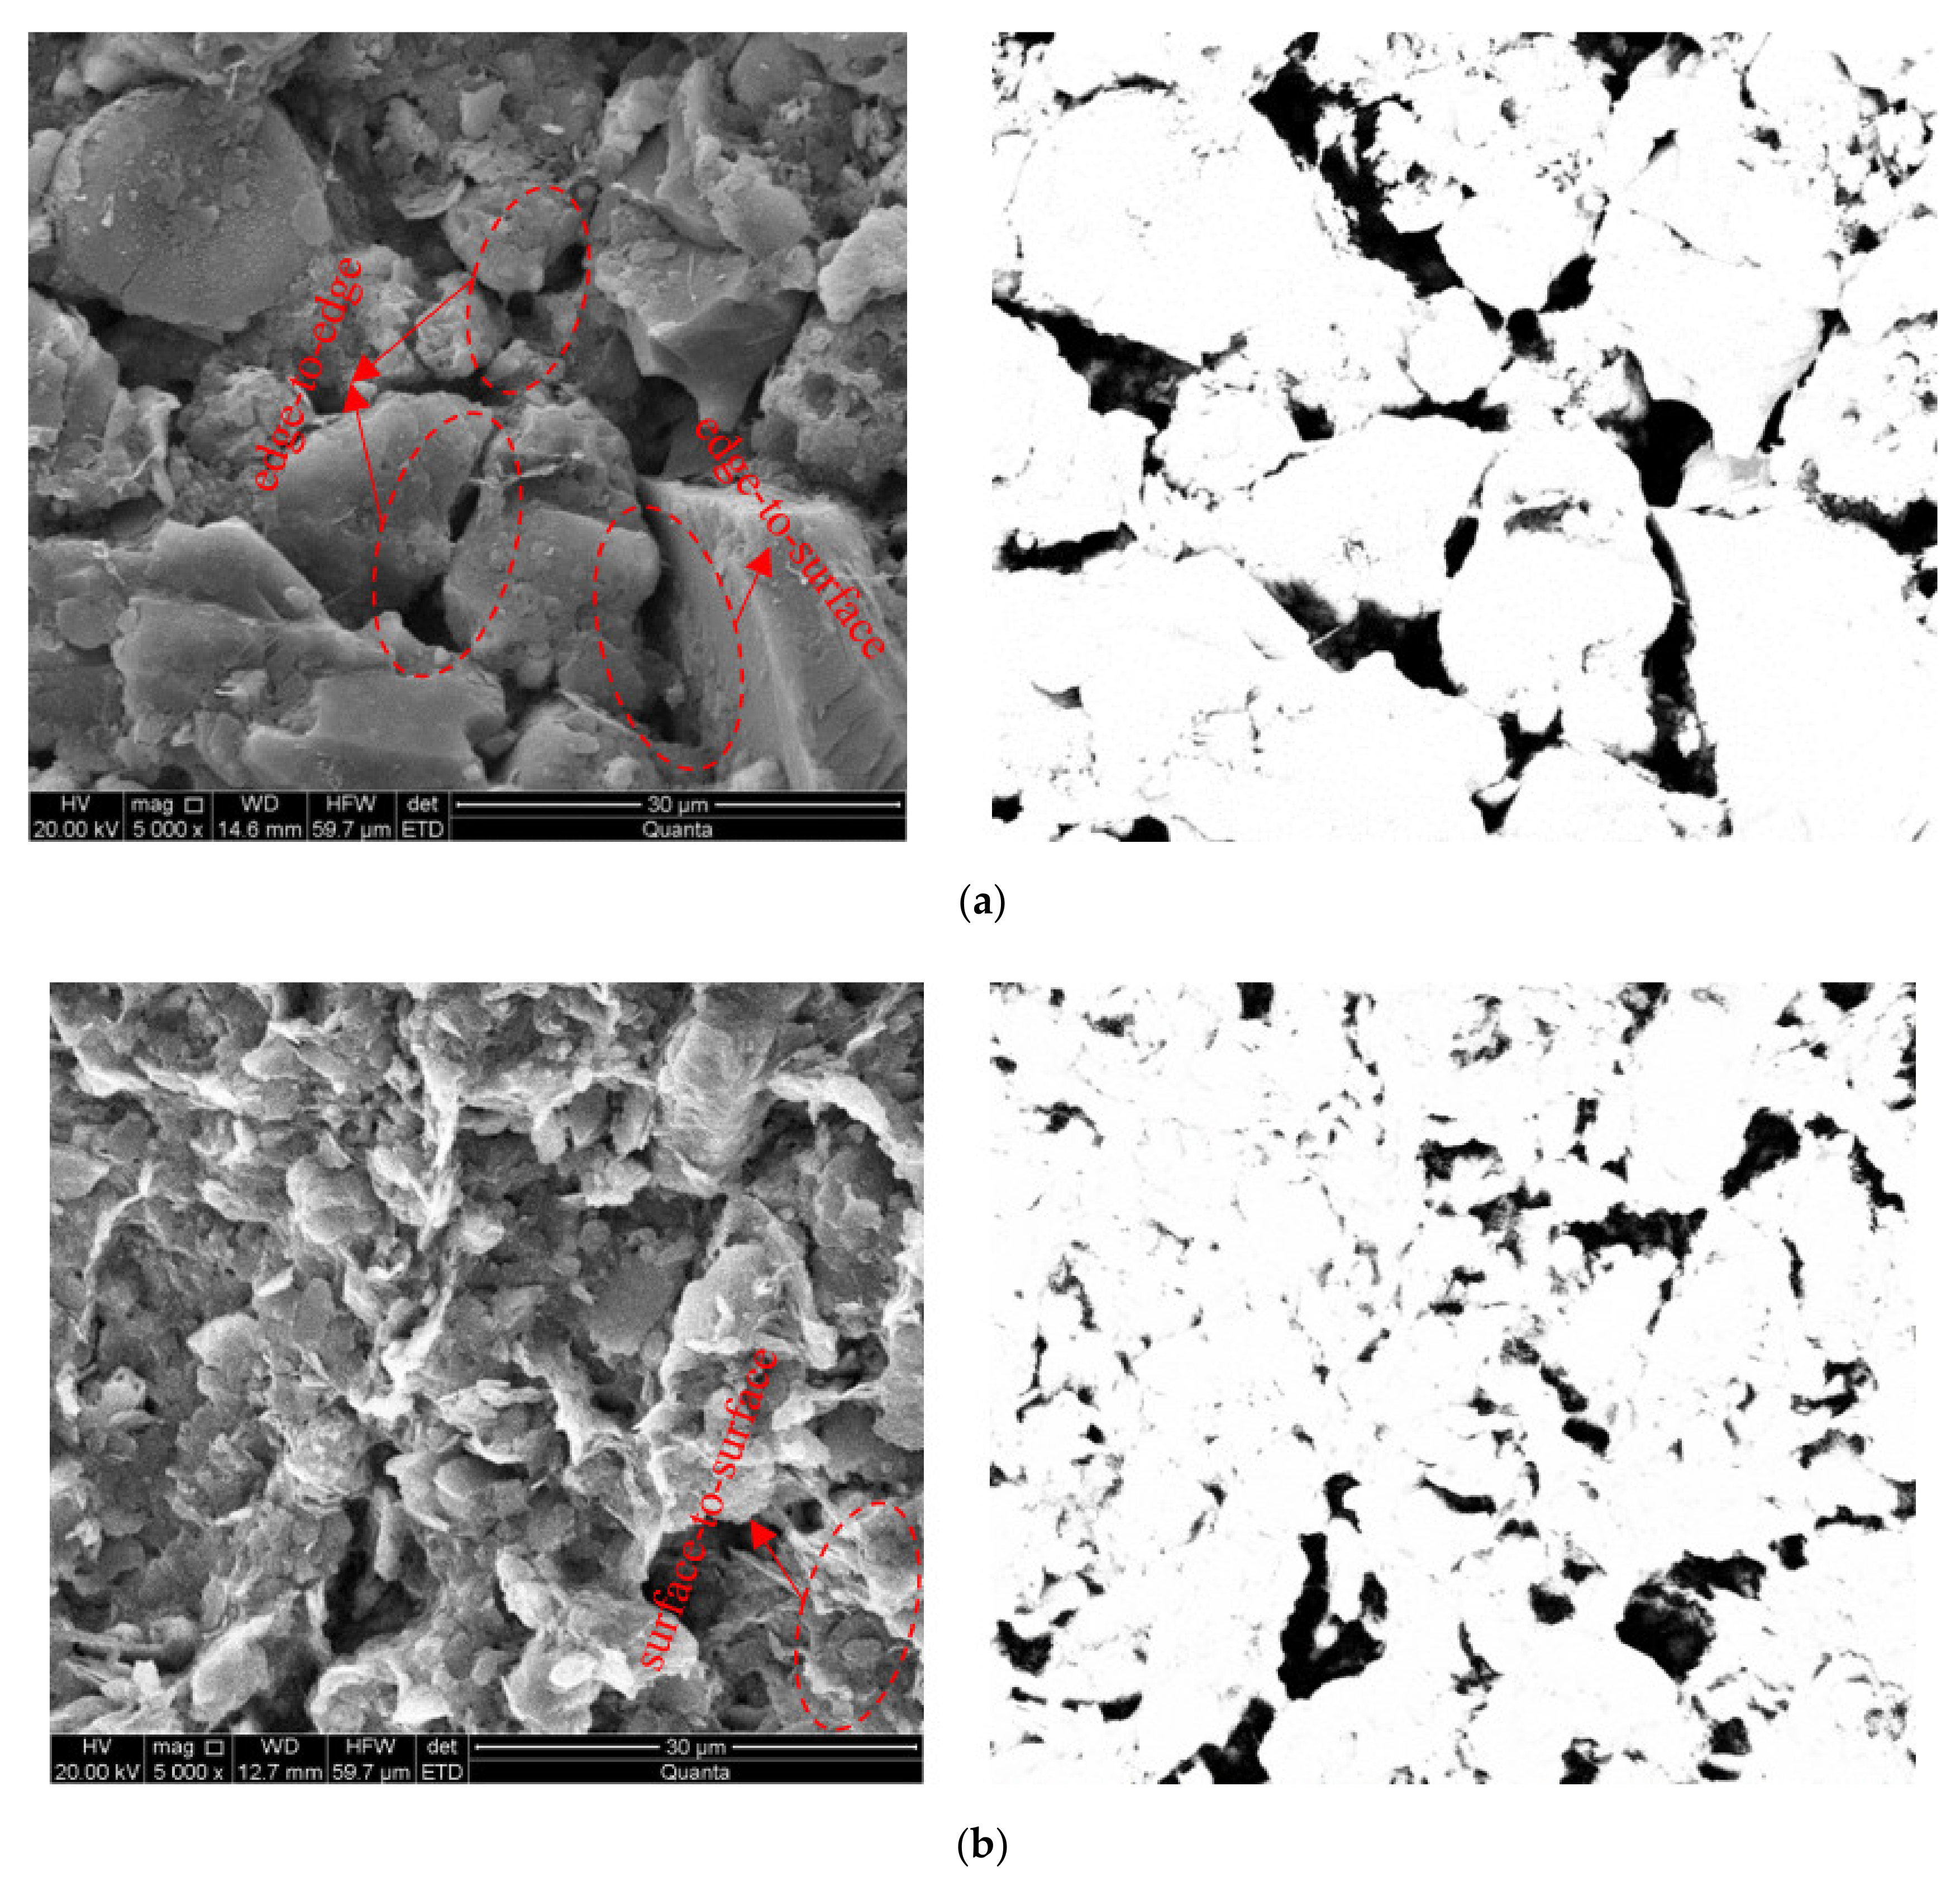
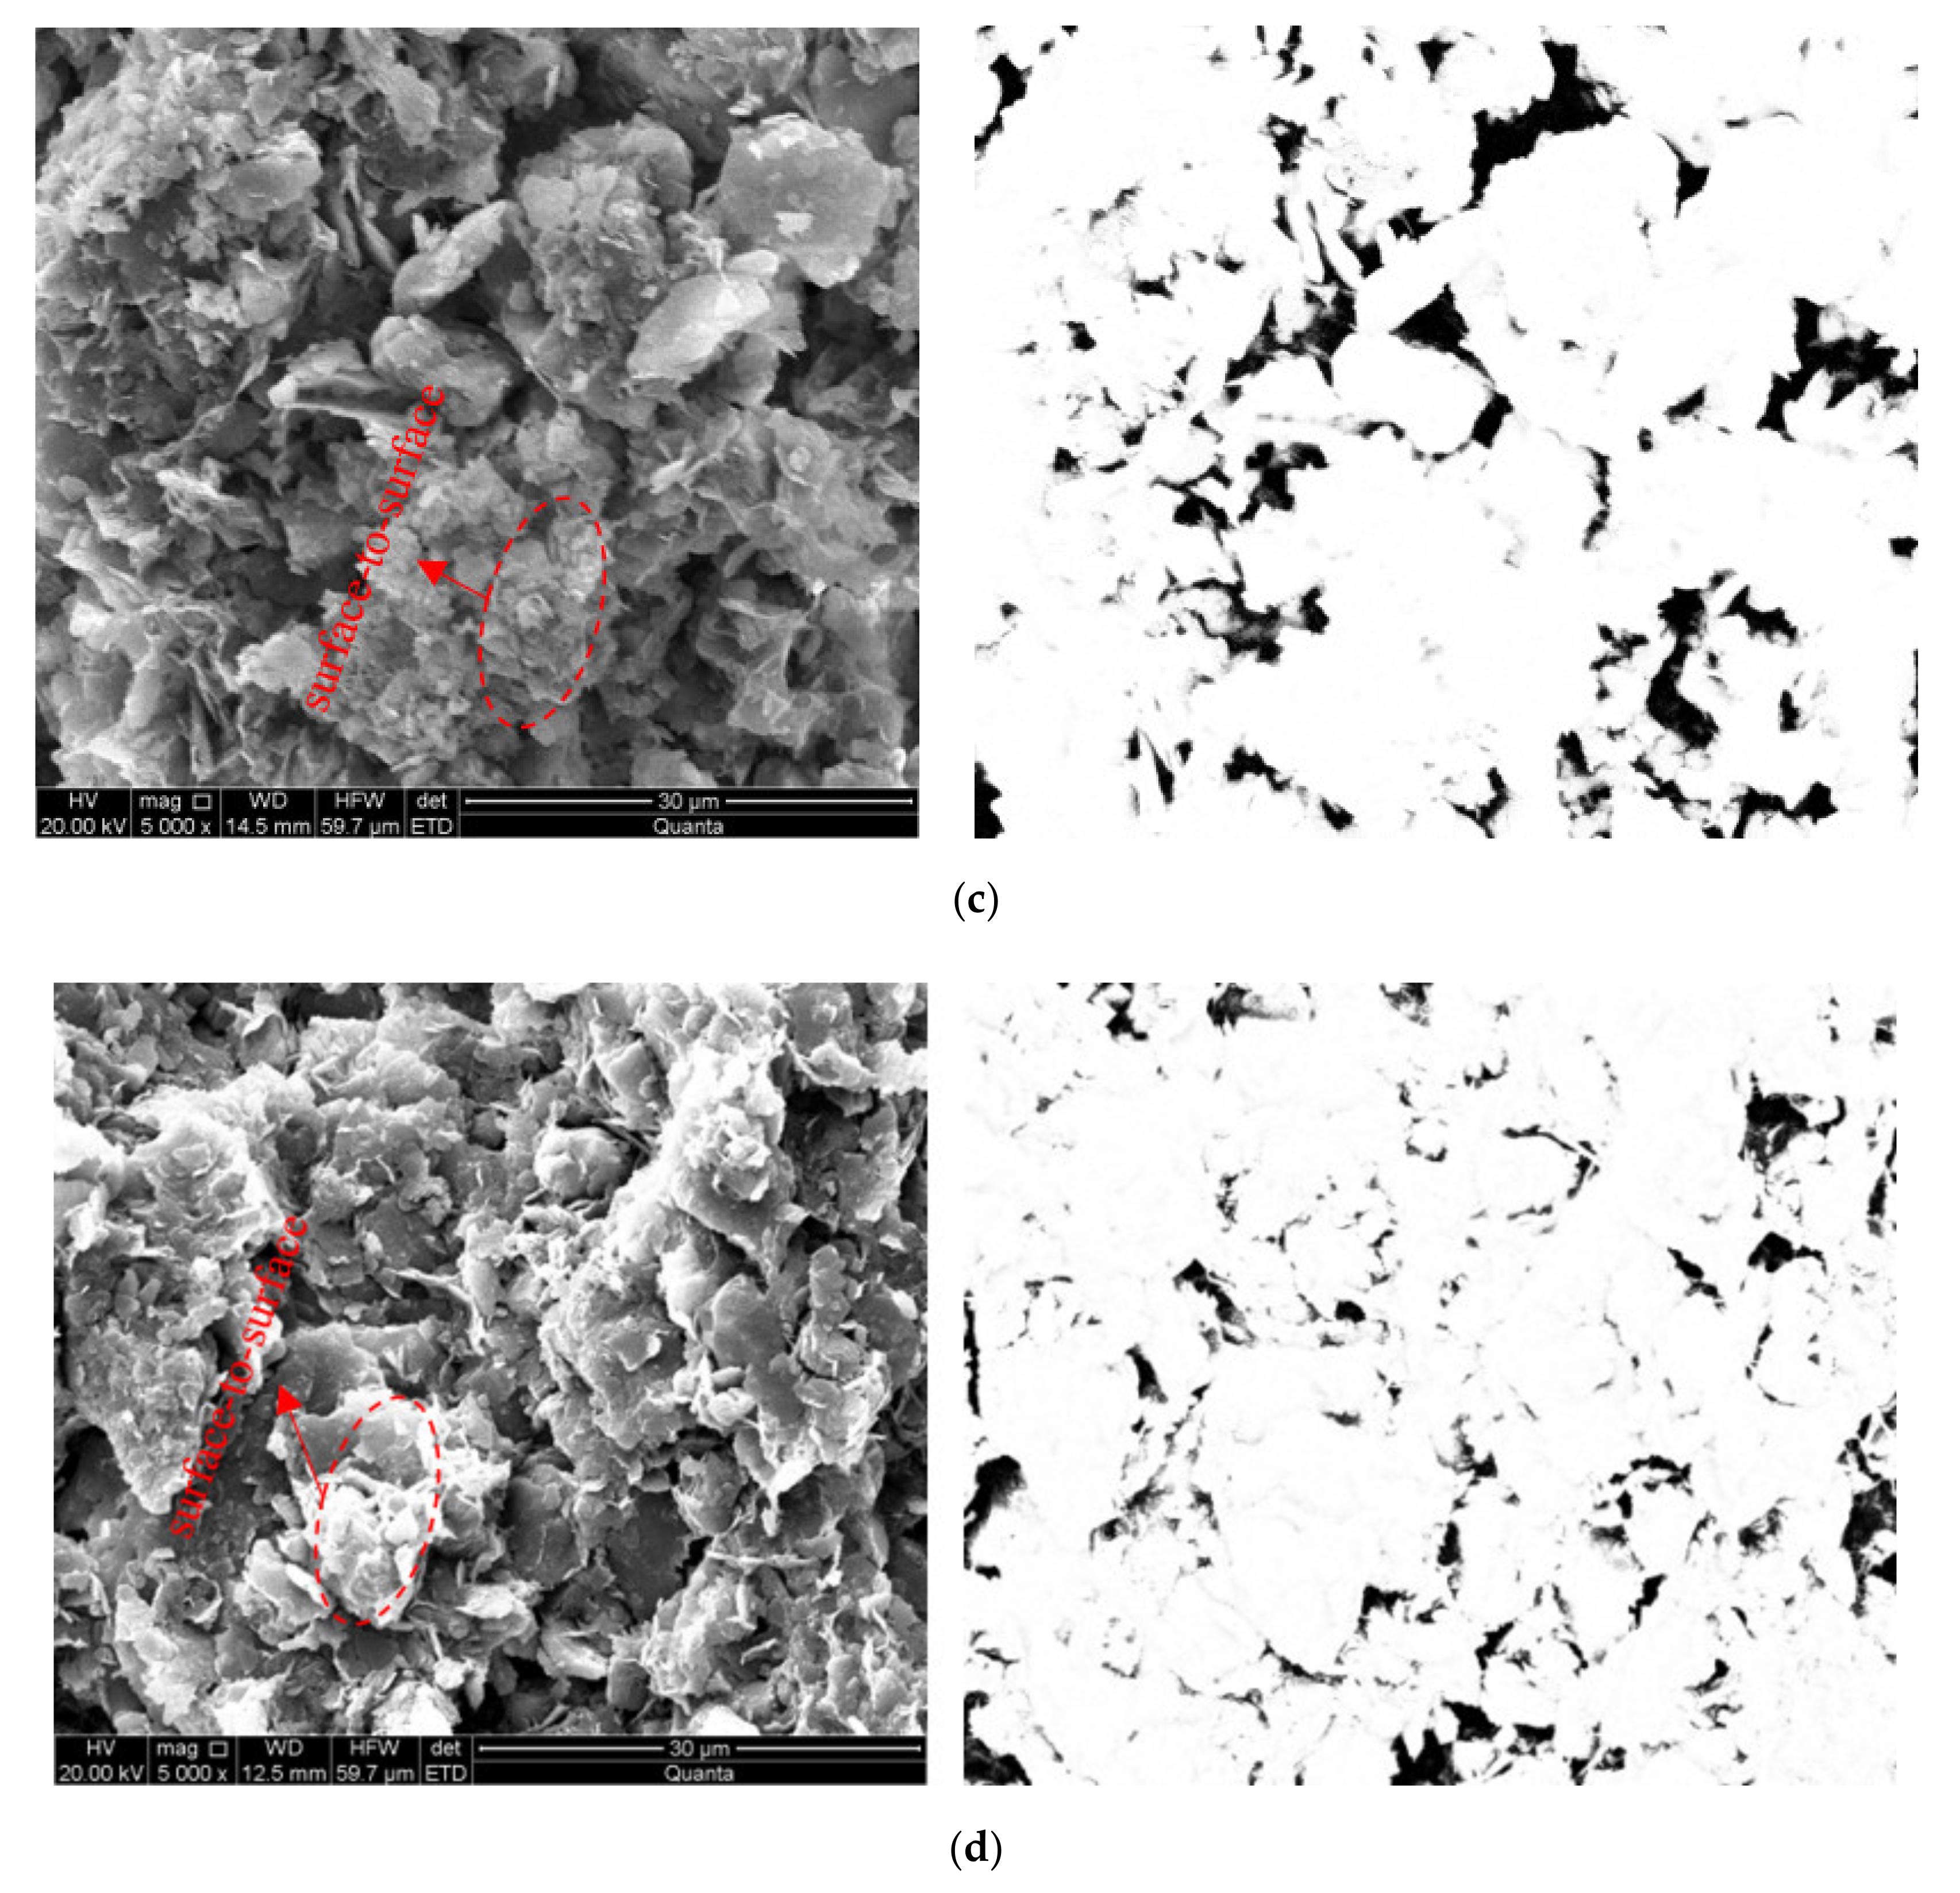
4.4. Analysis of Microstructure
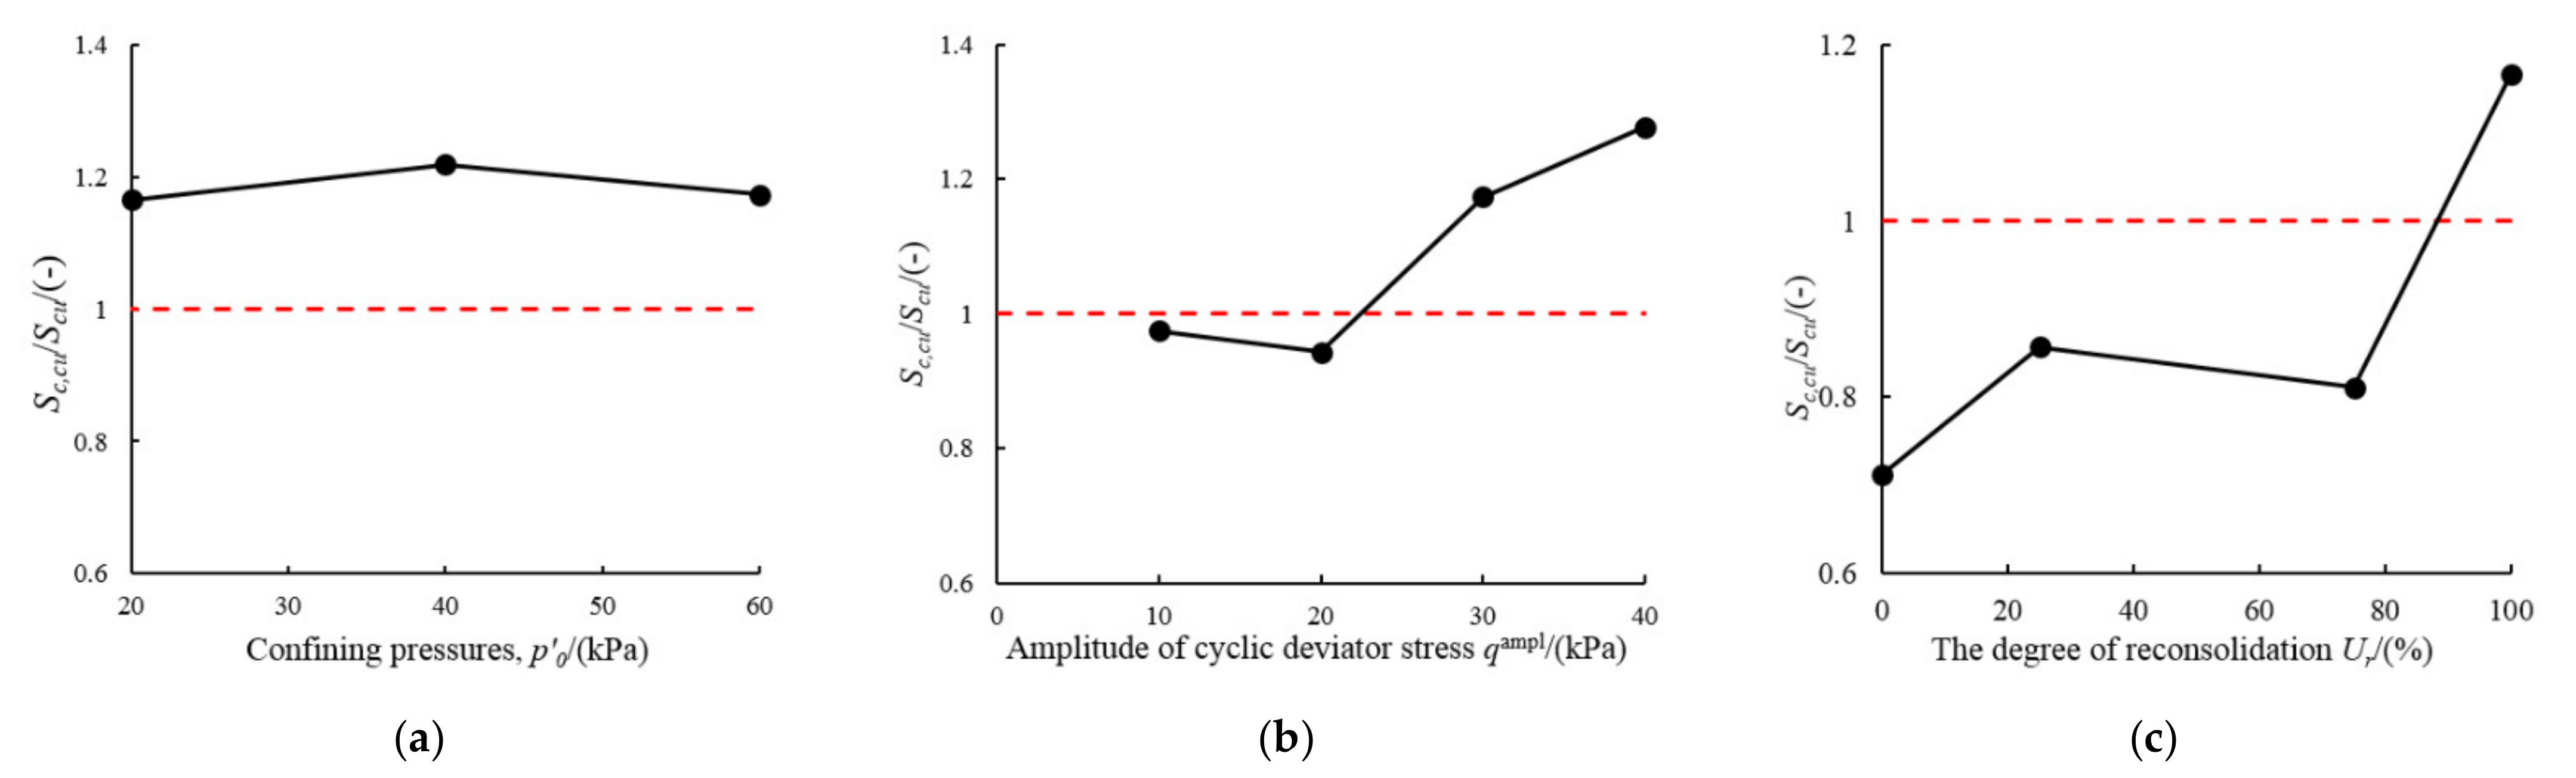
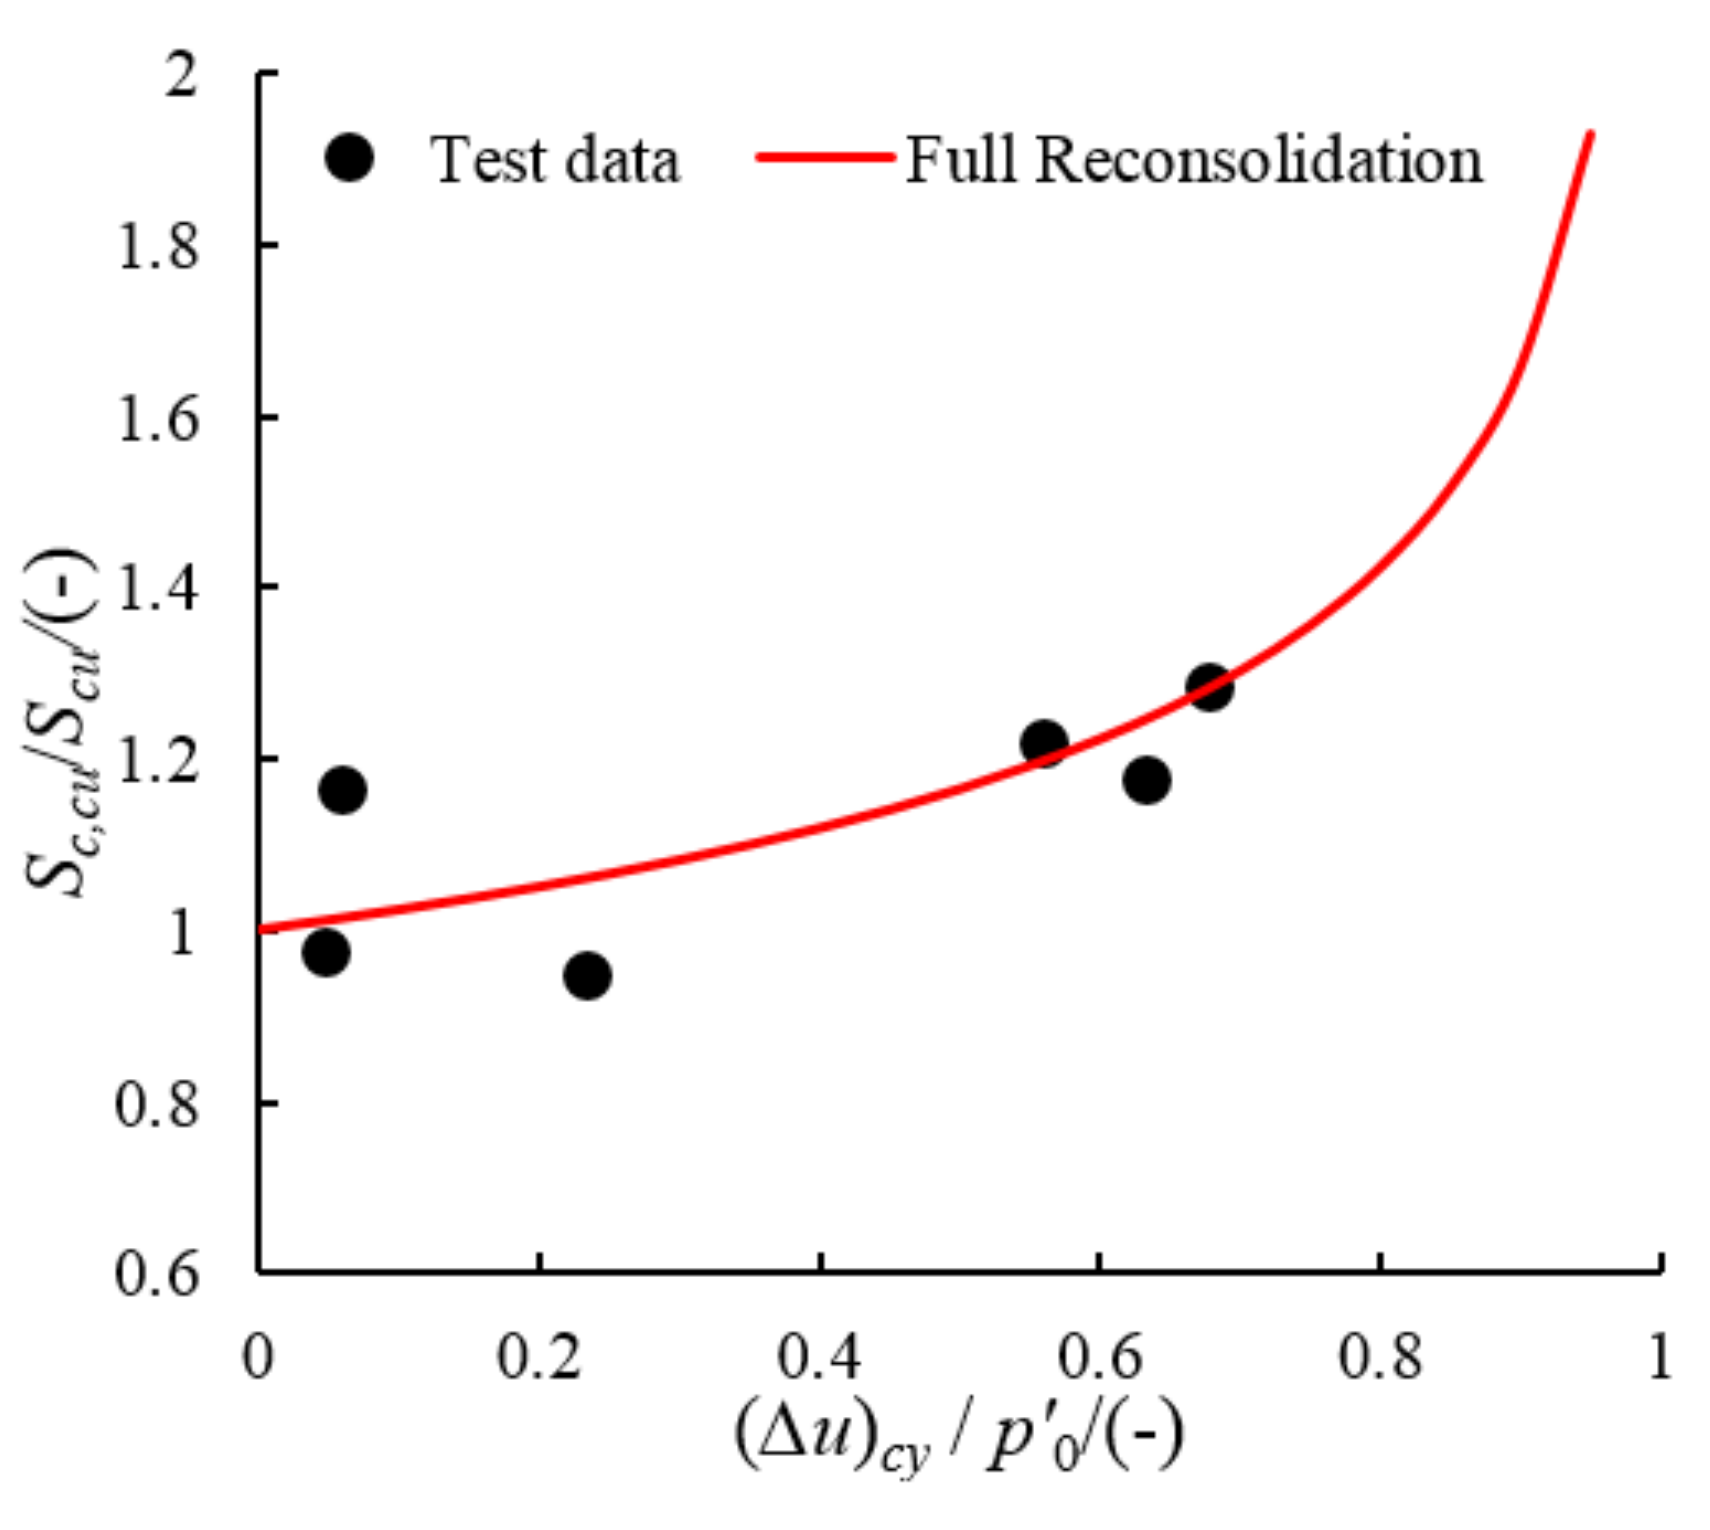
The fundamental factor that causes the difference of post-cyclic stress-strain characteristics may be the difference in specimen microstructure. Therefore, it is necessary to analyze the microstructure of the specimens for a more profound understanding of the post-cyclic shear characteristics. The microstructures of the undisturbed specimen and the post-cyclic specimens with different degrees of reconsolidation were compared as shown in Figure 15. Herein, all images are magnified 5000 times.
The soil particles of undisturbed specimens mainly come into contact in the form of edge-to-edge and edge-to-surface contact. The soil particles are complete, and the intergranular pores are mainly large pores with good connectivity. The overall structure of the undisturbed soil is strong. After cyclic loading, the soil skeleton and the soil particles are destroyed. The soil particles are accumulated in the form of small particles and fragments, and the particles mainly make contact in the form of surface-to-surface interaction. The intergranular pores are no longer connected but are distributed as small, scattered pores. Cyclic loading leads to a significant increase in the number of pores. Image-Pro Plus software was used to analyze the images, and the pore fractions shown thereon were extracted and quantified, as presented in Table 3. Herein, the pore area in the undisturbed soil is 400 μm2, and the corresponding void ratio is 0.151. When the degree of reconsolidation is 0%, 50%, and 100%, the pore area of the post-cyclic specimens is 408 μm2, 360 μm2, and 273 μm2, and the corresponding void ratio is 0.154, 0.132, and 0.098. With the increase in the degree of reconsolidation, the density of the post-cyclic soil increases.
When the degree of reconsolidation is low, the compactness of the soil is similar to that of the undisturbed soil. Since cyclic loading destroys the original structure of the soil, the post-cyclic shear strength of the disturbed soil is lower than the static shear strength, however, for specimens with full reconsolidation, the soil particles are rearranged due to the cyclic loading, and the density increases significantly, resulting in higher shear strength for the fully reconsolidated soil compared with the static strength of the undisturbed soil.

5. Discussion

The effects of confining pressure, cyclic stress ratio, and the degree of reconsolidation on the post-cyclic shear strength are assessed based on the test results. Figure 16 shows the variation in normalized post-cyclic shear strength ratio (Sc,cu/Scu) under a certain influence factor. It is found that the values of Sc,cu/Scu are all larger than unity of soft soil with full reconsolidation. Wang et al. [29,34] investigated the post-cyclic shear behavior of low-plasticity silt and found that the undrained shear strength after cyclic loading increased with full reconsolidation. Hyde et al. [30] and Yasuhara et al. [15,16] also obtained similar conclusions. It can be seen that the effect of confining pressure on the Sc,cu/Scu can be negligible. Wang et al. [37] also found that the increased range of the normalized deviator stress at failure under different confining pressure was within 10%. The effect of cyclic stress ratio on the Sc,cu/Scu with full reconsolidation is moderate: the maximum difference in Sc,cu/Scu is 0.30. It can be seen that the post-cyclic shear strength of soil increases with the increase of cyclic stress ratio. Similar conclusions can be found in the study of post-cyclic shear behavior on reconstituted marine soft soils [37]. The degree of reconsolidation has the greatest effect on the values of Sc,cu/Scu: the maximum difference in Sc,cu/Scu is 0.45. On the whole, the post-cyclic shear strength increases with the degree of reconsolidation. Wang et al. [34] also found that the shear strength and stiffness of MRV silt increased steadily with an increase in the degree of reconsolidation. Besides that, the conclusion that there is a critical degree of reconsolidation between no reconsolidation and full reconsolidation making Sc,cu/Scu = 1 proposed by Wang et al. [37] also confirmed.
At present, some studies have been involved the prediction of the post-cyclic shear strength of the soil. The excess pore water pressure of soil increases, and the effective stress decreases. The post-cyclic shear behavior will be similar to the overconsolidation behavior [5], therefore, some scholars regard the post-cyclic soil as the equivalent overconsolidated soil. Yasuhara et al. [15] used the equivalent overconsolidation ratio to estimate the undrained shear strength of soil after cyclic loading, as shown in Equation (3). It can be used to predict the post-cyclic shear strength after full reconsolidation of soft clay located in the Pearl River Estuary.
S c , c u S c u = ( 1 ( Δ u ) c y p 0 ) Δ 0 Δ 0 1 C s / C c
where (∆u)cy is the accumulated excess pore pressure generated by undrained cyclic loading; Cs and Cc are the swelling and compression indices, respectively. The ratio of Cs/Cc can be obtained from the e versus ln p curve or empirical formula [38]; ∆0 is the experimental constant relating normalized undrained shear strength and OCR, and it can be obtained by using empirical formula [39]:
C s / C c   =   0 . 185   +   0 . 002 I p
Δ 0 = 0.757 3.49 × 10 3 I p + 4.00 × 10 6 I p 2
Herein, Cs/Cc are obtained by using Equation (4), and ∆0 is derived by using Equation (5). Figure 17 illustrates the Sc,cu/Scu versus (∆u)cy/p′0 relationship (as given by Equation (3) and the experimental data) for Ur = 100%. The trend in the experimental results is similar to that suggested by the empirical formula. The ratio Sc,cu/Scu for fully reconsolidated specimens increases with increasing (∆u)cy/p′0. Equation (3) also provides a theoretical explanation for the increase of post-cyclic shear strength of soil with cyclic stress ratio under full reconsolidation. Equation (3) shows that the post-cyclic shear strength (Sc,cu) is proportional to the accumulated excess pore pressure ((∆u)cy). With the increase of CSR, the accumulated excess pore pressure in the soil after cyclic loading also increases. Therefore, the post-cyclic shear strength (Sc,cu) will be enhanced with the increase of CSR for the specimens with full reconsolidation.

6. Conclusions

A series of static and dynamic triaxial tests were conducted to study the post-cyclic mechanical behavior of soft clay in the Pearl River Estuary. The effects of confining pressure, cyclic stress ratio, and degree of reconsolidation were investigated. The main conclusions are obtained as follows:
(1)
The trends in the stress–strain curves during the post-cyclic shear process under different conditions are similar. Compared with undrained shear strength without cyclic loading, the shear strength after cyclic loading with full reconsolidation increases. Furthermore, with increasing of confining pressure, cyclic stress ratio, and degree of reconsolidation, the undrained shear strength increases. Meanwhile, a critical degree of reconsolidation at which the post-cyclic shear strength equals the static shear strength was found.
(2)
The excess pore water pressure increases rapidly at the beginning of the post-cyclic shear process, then decreases with increasing strain, but the excess pore water pressure remains positive during post-cyclic shear. S-shaped effective stress paths are observed, in which the terminal points of effective stress paths cross the CSL line.
(3)
The microstructures of undisturbed soil and specimens with different degrees of reconsolidation were ascertained. Compared with the undisturbed soil, the number of pores of post-cyclic specimens increases significantly, and the large, interconnected pores became small and scattered. Furthermore, with increasing degree of reconsolidation, the void ratio of the soil decreases.
(4)
The effect of the degree of reconsolidation on the post-cyclic shear strength of soft clay in the Pearl River Estuary is the most significant. The post-cyclic shear strength increases with the increase of degree of reconsolidation. Good drainage conditions will effectively improve the bearing capacity after cyclic loading. The post-cyclic shear strength of the soil without reconsolidation can be reduced by up to 29%. The predicted results obtained using the model proposed by Yasuhara et al. [15,16] match the measured data, implying that the model applies to the prediction of the post-cyclic undrained strength of the soft soil located in the Pearl River Estuary. This study provides a rough reference for the range of post-cyclic shear strength with different degree of reconsolidation compared with the strength without cyclic loading history for the engineering design of soft soil in the Pearl River Estuary.

Author Contributions

Y.L. performed the tests, processed the data, and wrote the manuscript; J.H. designed the tests and modified the manuscript; J.C. modified the manuscript; L.F. provided the technique support; S.Y. provided soils; J.L. provided the technique support; C.M. provided the technique support. All authors have read and agreed to the published version of the manuscript.

Funding

This research was funded by the National Natural Science Foundation of China (Grant No. 52079135, 51909259, 52008122) and the International Partnership Program of the Chinese Academy of Sciences (Grant No. 131551KYSB20180042).

Data Availability Statement

The data presented in this study are available on request from the corresponding author.

Conflicts of Interest

The authors declare no conflict of interest.

References

  1. Wu, T.Y.; Cai, Y.Q.; Guo, L.; Ling, D.S.; Wang, J. Influence of shear stress level on cyclic deformation behaviour of intact Wenzhou soft clay under traffic loading. Eng. Geol. 2017, 228, 61–70. [Google Scholar] [CrossRef]
  2. Zhao, K.; Xiong, H.; Chen, G.X.; Zhuang, H.Y.; Du, X.L. Cyclic characterization of wave induced oscillatory and residual response of liquefiable seabed. Eng. Geol. 2017, 227, 32–42. [Google Scholar] [CrossRef]
  3. Hu, X.Q.; Zhang, Y.; Guo, L.; Wang, J.; Cai, Y.Q.; Fu, H.T.; Cai, Y. Cyclic behavior of saturated soft clay under stress path with bidirectional shear stresses. Soil Dyn. Earthq. Eng. 2018, 104, 319–328. [Google Scholar] [CrossRef]
  4. Li, L.L.; Dan, H.B.; Wang, L.Z. Undrained behavior of natural marine clay under cyclic loading. Ocean Eng. 2011, 38, 1792–1805. [Google Scholar] [CrossRef]
  5. Soroush, A.; Soltani-Jigheh, H. Pre- and post-cyclic behavior of mixed clayey soils. Can. Geotech. J. 2009, 46, 115–128. [Google Scholar] [CrossRef]
  6. Gu, C.; Wang, J.; Cai, Y.Q.; Wang, P. Undrained dynamic behaviors of saturated clays under compressive stress paths considering cyclic confining pressure. Chin. J. Geotech. Eng. 2013, 35, 1307–1315. [Google Scholar]
  7. Yan, S.W.; Liu, R.; Fan, Q.J. Study on the strength weakening of soft clay in Yangtze Estuary under wave-induced loading. In Proceedings of the Geoshanghai International Conference, Shanghai, China, 6–8 June 2006; pp. 76–81. [Google Scholar]
  8. Moses, G.G.; Rao, S.N. Degradation in cemented marine clay subjected to cyclic compressive loading. Mar. Georesour. Geotechnol. 2003, 21, 37–62. [Google Scholar] [CrossRef]
  9. Guo, L.; Wang, J.; Cai, Y.Q.; Liu, H.L.; Gao, Y.F.; Sun, H.L. Undrained deformation behavior of saturated soft clay under long-term cyclic loading. Soil Dyn. Earthq. Eng. 2013, 50, 28–37. [Google Scholar] [CrossRef]
  10. Qian, J.G.; Wang, Y.G.; Yin, Z.Y.; Huang, M.S. Experimental identification of plastic shakedown behavior of saturated clay subjected to traffic loading with principal stress rotation. Eng. Geol. 2016, 214, 29–42. [Google Scholar] [CrossRef]
  11. Paramasivam, B.; Banerjee, S. Factors affecting post-cyclic undrained shear strength of marine clay. Geotech. Geol. Eng. 2017, 35, 1783–1791. [Google Scholar] [CrossRef]
  12. Li, T.; Tang, X.; Wang, Z.T. Experimental study on unconfined compressive and cyclic behaviors of mucky silty clay with different clay contents. Int. J. Civ. Eng. 2019, 17, 841–857. [Google Scholar] [CrossRef]
  13. Andersen, K.H.; Pool, J.H.; Brown, S.F.; Rosenbrand, W.F. Cyclic and static laboratory tests on Drammen clay. J. Geotech. Eng. Div. 1980, 106, 499–529. [Google Scholar] [CrossRef]
  14. Matsui, T.; Bahr, M.A.; Abe, N. Estimation of shear characteristics degradation and stress-strain relationship of saturated clays after cyclic loading. Soils Found. 1992, 32, 161–172. [Google Scholar] [CrossRef] [Green Version]
  15. Yasuhara, K.; Hirao, K.; Hyde, A.F.L. Effects of cyclic loading on undrained strength and compressibility of clay. Soils Found. 1992, 32, 100–116. [Google Scholar] [CrossRef] [Green Version]
  16. Yasuhara, K. Postcyclic undrained strength for cohesive soils. J. Geotech. Eng. 1994, 120, 1961–1979. [Google Scholar] [CrossRef]
  17. Yasuhara, K.; Murakami, S.; Hyde, A.F.L. Post-cyclic degradation of saturated plasticity silts. Cycl. Behav. Soils Liq. Phenom. 2004, 275–286. [Google Scholar] [CrossRef]
  18. Erken, A.; Ülker, B.M.C. Effect of cyclic loading on monotonic shear strength of fine-grained soils. Eng. Geol. 2007, 89, 243–257. [Google Scholar] [CrossRef]
  19. Kaya, Z.; Erken, A. Cyclic and post-cyclic monotonic behavior of Adapazari soils. Soil Dyn. Earthq. Eng. 2015, 77, 83–96. [Google Scholar] [CrossRef]
  20. Sakai, A.; Samang, L.; Miura, N. Partially-drained cyclic behavior and its application to the settlement of a low embankment road on silty-clay. Soils Found. 2003, 43, 33–46. [Google Scholar] [CrossRef] [Green Version]
  21. Wang, Z.; Gu, L.; Shen, M.R.; Zhang, F.; Zhang, G.K.; Wang, X. Shear stress relaxation behavior of rock discontinuities with different joint roughness coefficient and stress histories. J. Struct. Geol. 2019, 126, 272–285. [Google Scholar] [CrossRef]
  22. Tavakoli, H.R.; Shafiee, A.; Jafari, M.K. Post-cyclic undrained behavior of compacted composite clay subjected to various cyclic loading paths. Geotech. Geol. Eng. 2011, 29, 1085–1097. [Google Scholar] [CrossRef]
  23. Noorzad, R.; Shakeri, M. Effect of silt on post-cyclic shear strength of sand. Soil Dyn. Earthq. Eng. 2017, 97, 133–142. [Google Scholar] [CrossRef]
  24. Hyde, A.F.L.; Ward, S.J. The effect of cyclic loading on the undrained shear strength of a silty clay. Mar. Georeso. Geotechnol. 1986, 6, 299–314. [Google Scholar] [CrossRef]
  25. Wang, S.Y.; Luna, R.; Onyejekwe, S. Effect of initial consolidation condition on postcyclic undrained monotonic shear behavior of Mississippi River Valley silt. J. Geotech. Geoenviron. 2016, 142, 04015075. [Google Scholar] [CrossRef]
  26. Wang, Y.Z.; Lei, J.C.; Gong, X.L.; Wang, Y.C.; Yang, P.B. Post-cyclic undrained shear behavior of marine silty clay under various loading conditions. Ocean Eng. 2018, 158, 152–161. [Google Scholar] [CrossRef]
  27. Diazrodriguez, J.A. Behavior of Mexico City clay subjected to undrained repeated loading. Can. Geotech. J. 1989, 26, 159–162. [Google Scholar] [CrossRef]
  28. Pillai, R.J.; Robinson, R.G.; Boominathan, A. Effect of microfabric on undrained static and cyclic behavior of kaolin clay. J. Geotech. Geoenviron. 2011, 37, 421–429. [Google Scholar] [CrossRef]
  29. Wang, S.Y.; Luna, R.; Zhao, H.H. Cyclic and post-cyclic shear behavior of low-plasticity silt with varying clay content. Soil Dyn. Earthq. Eng. 2015, 75, 115–120. [Google Scholar] [CrossRef]
  30. Hyde, A.F.L.; Higuchi, T.; Yasuhara, K. Postcyclic recompression, stiffness, and consolidated cyclic strength of silt. J. Geotech. Geoenviron. Eng. 2007, 133, 416–423. [Google Scholar] [CrossRef]
  31. Leal, A.N.; Kaliakin, V.N. General response observed in cyclically loaded cohesive soils. Cienc. Ing. Neogranad. 2016, 26, 21–39. [Google Scholar] [CrossRef]
  32. Yasuhara, K.; Murakami, S.; Song, B.W.; Yokokawa, S.; Hyde, A.F.L. Postcyclic degradation of strength and stiffness for low plasticity silt. J. Geotech. Geoenviron. Eng. 2003, 129, 756–769. [Google Scholar] [CrossRef]
  33. Ashour, M.; Norris, G.; Nguyen, T. Assessment of the undrained response of sands under limited and complete liquefaction. J. Geotech. Geoenviron. Eng. 2009, 135, 1772–1776. [Google Scholar] [CrossRef]
  34. Wang, S.Y.; Luna, R.; Onyejekvve, S. Postliquefaction behavior of low-plasticity silt at various degrees of reconsolidation. Soil Dyn. Earthq. Eng. 2015, 75, 259–264. [Google Scholar] [CrossRef]
  35. Yasuhara, K.; Andersen, K.H. Recompression of normally consolidated clay after cyclic loading. Soils Found. 1991, 31, 83–94. [Google Scholar] [CrossRef] [Green Version]
  36. Wijewickreme, D.; Sanin, M.V. Postcyclic Reconsolidation Strains in Low-Plastic Fraser River Silt due to Dissipation of Excess Pore-Water Pressures. J. Geotech. Geoenviron. Eng. 2010, 136, 1347–1357. [Google Scholar] [CrossRef]
  37. Wang, Y.Z.; Lei, J.C.; Wang, Y.C.; Li, S.J. Post-cyclic shear behavior of reconstituted marine silty clay with different degrees of reconsolidation. Soil Dyn. Earthq. Eng. 2019, 116, 530–540. [Google Scholar] [CrossRef]
  38. Ue, S.; Yasuhara, K.; Fujiwara, H. Influence of consolidation period on undrained strength of clays. Ground Constr. Hiroshima Jpn. 1991, 9, 51–62. [Google Scholar]
  39. Yasuhara, K.; Hyde, A.F.L. Method for estimating postcyclic undrained secant modulus of clays. J. Geotech. Eng. 1997, 123, 204–211. [Google Scholar] [CrossRef]
Figure 1. Particle size distribution of the tested soil.
Applsci 11 07612 g001
Figure 2. Dynamic triaxial test system.
Applsci 11 07612 g002
Figure 3. Loading process applied to the specimens.
Applsci 11 07612 g003
Figure 4. Sketch of cyclic triaxial test results under constant confining pressure: (a) q-n; (b) q-εa; (c) εa-n; (d) ∆u-n.
Applsci 11 07612 g004
Figure 5. Test results of the soft soil under cyclic loading at various consolidated confining pressures: (a) εa,t-n; (b) ∆u-n.
Applsci 11 07612 g005
Figure 6. Relationship between axial deviator stress and axial strain of the soft soil with different confining pressures (n = 1000, CSR = 0.25, Ur = 100%).
Applsci 11 07612 g006
Figure 7. Relationship between axial deviator stress and axial strain of the soft soil with different cyclic stress ratio (n = 1000, p′0 = 60 kPa, Ur = 100%).
Applsci 11 07612 g007
Figure 8. Relationship after cyclic loading between axial deviator stress and axial strain of the soft soil with different degrees of reconsolidation (n = 1000, CSR = 0.25): (a) p′0 = 20 kPa; (b) p′0 = 60 kPa.
Applsci 11 07612 g008
Figure 9. Variations of excess pore water pressure versus axial strain of the soft soil at different confining pressures after cyclic loading (n = 1000, CSR = 0.25, Ur = 100%).
Applsci 11 07612 g009
Figure 10. Variations of excess pore water pressure versus axial strain of the soft soil at various cyclic stress ratios after cyclic loading (n = 1000, p′0 = 60 kPa, Ur = 100%).
Applsci 11 07612 g010
Figure 11. Variations of excess pore water pressure versus axial strain of the soft soil with different degrees of reconsolidation after cyclic loading (n = 1000, CSR = 0.25): (a) p′0 = 20 kPa; (b) p′0 = 60 kPa.
Applsci 11 07612 g011
Figure 12. Effective stress paths of the soft soil at different confining pressures (n = 1000, CSR = 0.25, Ur = 100%).
Applsci 11 07612 g012
Figure 13. Effective stress paths of the soft soil at various cyclic stress ratios (n = 1000, p′0 = 60 kPa, Ur = 100%).
Applsci 11 07612 g013
Figure 14. Effective stress paths of the soft soil with different degrees of reconsolidation (n = 1000, CSR = 0.25): (a) p′0 = 20 kPa; (b) p′0 = 60 kPa.
Applsci 11 07612 g014
Figure 15. The microstructure of the soft soil after cyclic loading with different degrees of reconsolidation: (a) undisturbed soil; (b) CY06; (c) CY10; (d) CY11.
Applsci 11 07612 g015aApplsci 11 07612 g015b
Figure 16. Comparison between undrained shear strength with and without cyclic loading considering different influence factors: (a) different confining pressures; (b) different cyclic stress ratios; (c) different degrees of reconsolidation.
Applsci 11 07612 g016
Figure 17. Comparison of predicted post-cyclic undrained shear strength and measured data for specimens with full reconsolidation.
Applsci 11 07612 g017
Table 1. Physico-mechanical indices of the tested soft clay.
Index PropertyMean Value
Natural density, ρ (g/cm3)1.67
Coefficient of uniformity, Cu15.32
Coefficient of curvature, Cc0.71
Free swelling ratio, δef (%)9
Natural water content, w (%)53.7
Natural void ratio, e1.52
Specific gravity, Gs2.71
Liquid limit, wL (%)50.2
Plasticity limit, wP (%)23.7
Plasticity index, IP (%)27.2
Coefficient of permeability, K (10−7 cm/s)9.80
Coefficient of compressibility, av (MPa−1)0.82
Coefficient of static lateral pressure, K00.44
Cohesion, c (kPa)22.7
Friction angle, φ (°)6.6
Table 2. Summary of cyclic triaxial tests.
Test No.p′0 (kPa)CSRqampl (kPa)nf (Hz)Ur (%)Microscopic TestsDrainage Condition
CY01200.251010000.10-Undrained
condition
CY02200.251010000.125-
CY03200.251010000.175-
CY04200.251010000.1100-
CY05400.252010000.1100-
CY06600.253010000.1100
CY07600.081010000.1100-
CY08600.172010000.1100-
CY09600.334010000.1100-
CY10600.253010000.10
CY11600.253010000.150
ST-2020------
ST-4040------
ST-6060------
Table 3. The area of pore fractions and soil particles.
Test No.Pore Area (μm2)Soil Particle Area (μm2)Void Ratio
Undisturbed40026510.151
CY06 (SEM)40826580.154
CY10 (SEM)36027270.132
CY11 (SEM)27327920.098
Publisher’s Note: MDPI stays neutral with regard to jurisdictional claims in published maps and institutional affiliations.

