1. Introduction
Wood is the basic raw material of wood products and the basic form of wood industry products. Wood is also a hard-fibrous structure and is a natural composite material composed of different types of cells and tissues. Different tree species have huge price differences due to their different materials [
1]. As the world’s largest importer, consumer and exporter of timber and forest products, China is also the world’s largest “illegal timber trading country” [
2]. With the development of the world’s economic construction, the demand for wood is increasing in actual work and life day by day, especially rare wood [
3,
4,
5]. Therefore, finding an accurate method that can identify wood species, is of great significance to standardize the timber trade market and protecting the interests of all parties, which has also become one of the difficult problems in the research of wood-related technologies. With the improvement of computer digital image processing technology, the idea of object-oriented programming, and the emergence of digital microscope technology, it is now possible to automate the measurement of wood micro-structure parameters, and also became necessary to the study of virtual modeling based on wood micro-structure. The technical means provide a new way for the accurate and rapid identification of wood species at the same time [
6].
Deep learning is the most popular research direction in the field of machine learning, which has been rapidly applied in the field of computer vision. Research on classification and recognition of wood species based on deep learning has attracted the attention of scholars at home and abroad [
7]. Deep learning-based approaches require large data sets, but this requirement is not easy to satisfy. Kar Siew et al. [
8] used the (FSD-M) dataset which consists of 2942 labeled high resolution (3264 × 2448) macroscopic images from 41 different wood species of the Brazilian flora. Each category of FSD-M dataset has about 71 images which is relatively low. They applied data augmentation on the input dataset with random flipping to generate more training samples to overcome the limitation of small dataset. Fabijańska et al. [
9] used a dataset of 312 wood core images representing 14 European wood species, including both conifer and angiosperm wood. Figueroa-Mata [
10] et al. used the same dataset presented in [
8]. They also applied data augmentation to reduce overfitting and improve performance. Sun et al. [
11] selected 25 wood species for training and testing. The woodblocks of these species collected in two kinds of ways (wood factories in Yunnan Province, China, the others were obtained from the Wood Herbarium of Southwest Forestry University). Then, 120 images for each species were chosen, and over 3000 images for 25 species were obtained. They used transfer learning to minimize the amount and type of data needed in the target area which optimized the model learning content. The implementation of transfer learning can apply domain-specific models to multiple target domains, and it can promote the learning growth of target domain models. Lopes et al. [
12] used a commercial smartphone equipped with a 14x macro camera lens to capture texture images of 10 North American hardwoods, and constructed a dataset of 1869 images, which identified hardwood species from the macro images using InceptionV4_ResNetV2 convolutional neural network (CNN). He et al. [
13] obtained 10,237 images from the cross-sections of 417 wood specimens of 15
Dalbergia and 11
Pterocarpus species.
Kar Siew et al. [
8] proposed a ConvNet improvement-based approach for wood species identification. Due to the small amount of training data, they proposed the addition of dropout layer to ConvNet architecture and data augmentation to increase the size of training data. Fabijańska et al. [
9] proposed an automatic identification method for wood species from wood core images with a residual convolutional neural network (CNN). The model is then applied to consecutive image patches following the sliding window strategy to recognize a patch central pixel’s membership. Figueroa-Mata [
10] et al. proposed a deep CNN for wood samples of tree species recognition, which used pre-trained weights to fine-tune the Resnet50 model to achieve the highest accuracy of 98.03%. Sun et al. [
11] proposed a deep-learning-based wood species recognition method, which used 20X amplifying glass to acquire wood images, they extracted the image features with ResNet50 neural network, refined the features with linear discriminant analysis (LDA), and recognized the wood species with a k-Nearest Neighbor algorithm (KNN classifier). Lopes et al. [
12] presented the feasibility of the InceptionV4_ResNetV2 convolutional neural network to classify 10 North American hardwood species with 92.60% of accuracy and precision–recall rate of 0.98. He et al. [
13] developed three deep learning models to distinguish wood types, which analyzed the optimal parameters of the deep learning model and visualized the representative wood anatomical features activated by the deep learning model. The results demonstrated that the overall accuracies of the 26-class, 15-class, and 11-class models were 99.3, 93.7 and 88.4%, respectively. The combination of the state-of-the-art deep learning models, parameter configuration, and feature visualization present a high performance for wood species identification.
This paper takes wood microscopic images of 10 different tree species as the research object. Based on studying the establishment of wood microscopic image datasets and improving the deep convolution neural network, it builds the wood microscopic image identification model based on the migration learning fusion model, performs wood microscopic image target detection, optimizes network parameters and prepares for further research on the micro-structure of wood microscopic images.
The rest of the paper is organized as follows. In
Section 2, the acquisition of wood microscopic sample images and small sample images expansion is introduced. In
Section 3, we present the construction of wood microscopic images identification model. In
Section 4, the experimental results are presented and discussed. Finally,
Section 5 concludes the work done in this paper.
2. The Acquisition of Wood Microscopic Sample Images and Small Sample Images Expansion
2.1. Obtaining Experimental Data of Wood Microscopic Sample Images
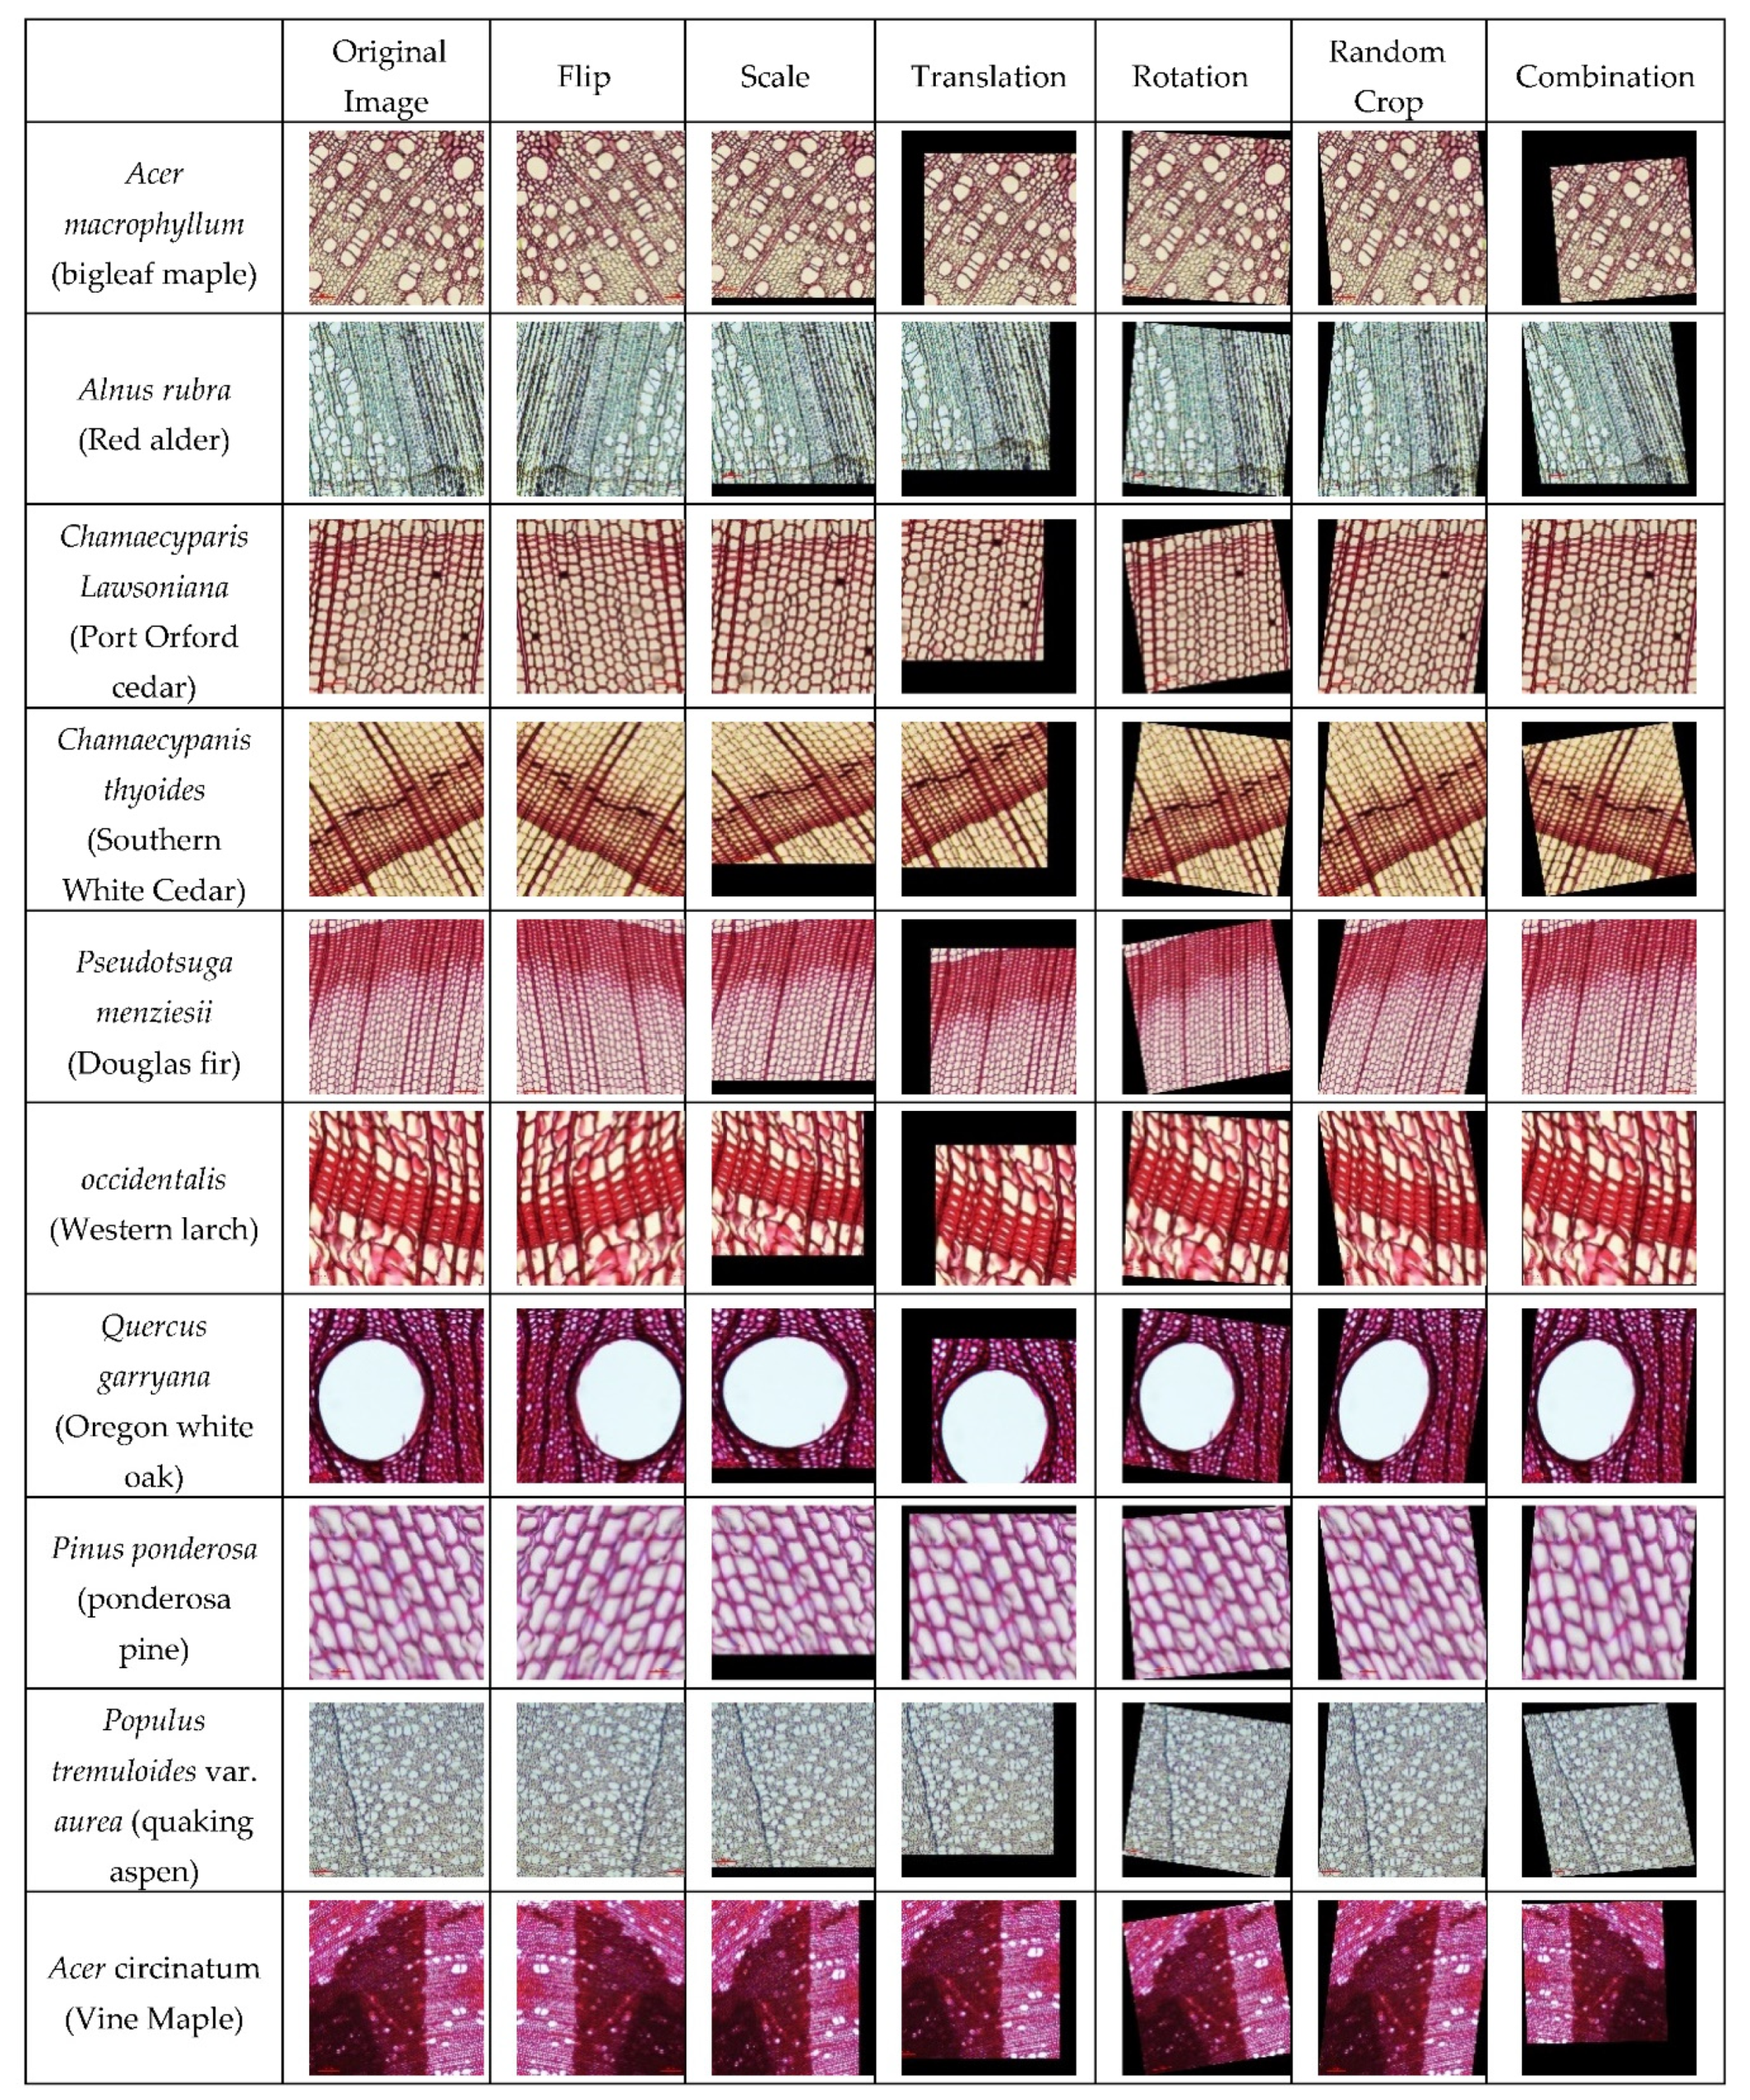
The identification experiment is carried out on 10 samples of wood microscopic images. The original images of the experiment were obtained by taking photos with different wood sample sections to obtain 1216 wood microscopic images. In this paper, we select Acer macrophyllum (bigleaf maple) of the family Sapindaceae (Aceraceae 10-31-64 and CLB369), Alnus rubra (Red alder) of the family Betulaceae, Chamaecyparis lawsoniana (Port Orford cedar) and Chamaecypanis thyoides (Southern White Cedar) of the family Cupressaceae, Pseudotsuga menziesii (Douglas fir) of the family Pinaceae (No. 1, No. 5, No. 18), Larix occidentalis (Western larch) of the family Pinaceae from 35 different wood sample cross-sections (3C and LCLin1986), Quercus garryana (Oregon white oak) of the family Fagaceae (two types of X-sect1989), Pinus ponderosa (ponderosa pine) of the family Pinaceae (No. 1, No. 2), Populus tremuloides var. aurea (quaking aspen) of the family Salicaceae, and Acer circinatum (Vine Maple) of the family Sapindaceae.
We use Nikon Eclipse Ni-U with DS-Ri2 digital camera microscope and NIS-Elements microscopic image software for image acquisition and analysis, the magnification of wood microscopic images is 4 times, 10 times, 20 times, 40 times. The images of each tree species come from multiple sections, and the wood microscopic image sample library and dataset is established.
2.2. Small Sample Image Enhancement
Wood microscopic image sample library and dataset established here in this paper are limited, whereas deep models for image identification always requires a large number of samples. Therefore, the images are expanded in the computer vision field to make up for the training images, which is insufficient to achieve the purpose of expanding the training data. The method of amplifying the number of wood microscopic images (small samples) is to use the same enhanced image processing technology to flip and zoom the original data to expand the sample size of the wood microscopic image dataset; the second method is to enhance the mixed class with using Mix-up data expanding the technology and constructing virtual training samples.
2.2.1. Traditional Data Expansion Technology
We select the available 10 tree species. The original images of the dataset were obtained by taking tree images with different tree sample sections (the sections number range from 3 to 6 sections) to obtain 1216 wood microscopic images in total. Traditional data augmentation technology is an enhanced image processing technology, including the following operations: (1) Flip; (2) Scale; (3) Translation; (4) Rotation; (5) Random Crop; (6) Combination. This paper divides the original dataset into 608 training samples and 608 test samples according to 1:1. Under the premise that the test set is not taken into consideration for data augmentation, 608 training samples were expanded to 2000 by flipping, zooming, translation, rotation, and shearing operations to improve the robustness and generalization of the trained model, and part of the specific expansion is shown in
Figure 1.
2.2.2. Mix-Up Data Expansion Technology
Mix-up is an algorithm used in computer vision to enhance images by mixing, which can mix images between different classes to expand the training dataset [
14]. For target detection tasks, the image enhancement method of Mix-up is different from previous classification tasks. Furthermore, the weighted overlap addition at the image level, the bounding boxes of the two images also need to be overlapped. The detailed picture of some wood microscopic samples under Mix-up data expansion technology is shown in
Figure 2. Where, Sample 1 and Sample 2 are mixed together to form the Mix-up Sample, in order to expand the training dataset.
In this paper, a sequence of image change modes is obtained for the expansion method according to the probability. Then the images are processed in order. The execution probability of each transformation is set to 0.4 in the text. Compared with a single expansion method, the combined expansion strategy adopted in this paper generates a richer sample dataset, which makes the model obtain more condensed information and improves its ability to deal with unfamiliar sample detection problems. As for the image expansion part of the Mix-up method, the paper introduces the strategy to online expansion of samples in the process of model training. It uses a gamma function generator to determine the proportion of the fused image, and weights the loss caused by the corresponding bounding box to improve the model’s performance generalization ability and adaptability.
3. Construction of Wood Microscopic Images Identification Model
To improve the detection performance of the traditional Faster RCNN algorithm for wood microscopic images, the paper adopts the receptive field enhancement module and multi-scale feature fusion strategy to improve it, which improves the algorithm’s robustness to change in the scale of the target to be inspected and the image discriminate information. Specifically, the receptive field enhancement module is introduced into the high-level convolution operation of the backbone network, such as the last convolution block of the Res-Net network. The attention mechanism module is used in the positive and negative classification of the Region Proposal Network (RPN) and the bounding box is added before the rough regression process. The multi-scale feature fusion strategy is designed in the process of extracting features from the backbone network, and finally provides feature maps of different scales for the RPN network to generate high-quality candidate frames.
3.1. The SPP Module of The Receptive Field Enhanced Spatial Pyramid Pooling
Spatial Pyramid Pooling (SPP) is a pooling layer that removes the fixed-size constraint of the network. This paper uses the Spatial Pyramid Pooling (SPP) structure in the receptive field enhancement module [
15], which is composed of five parallel branches, the kernel size is 13 × 13, 25 × 25, 37 × 37 max pooling, one skip connection and one convolution connection. Its composition is shown in
Figure 3. Faster RCNN SPP actually only adds the SPP module, which draws on the idea of spatial pyramid and realizes local features and global features through it. The size of the pooling kernel is related to the size of the feature map in the current research, where 38 × 38 feature map is used, and try to cover the feature map. After the feature map is fused with local features and global features, it enriches the expressive ability of the feature map and is beneficial to the difference in target size of the image to be detected among the larger case.
3.2. Multi-Scale Fusion FPN Module
The FPN module uses the inherent multi-scale structure of a deep CNN to construct the feature pyramid that has rich semantics at all levels, in object detection problems. Through simple network connection changes, the performance of small object detection is greatly improved without basically increasing the calculation amount of the original model [
16]. Its implementation process is shown in
Figure 4. The “bottom-up path” on the left is the feed-forward calculation of the convolution neural network, which calculates the feature map composed of feature maps of different proportions, and the scaling step is 2. The stride of Res-Net, Conv1, CS- Res2, CS-Res3, CS-Res4, and CS-Res5 are set to 2, 4, 8, 16, 32, respectively, and the output feature map is {C2, C3, C4, C5}. On the right, the “top-down path” uses up-sampling of more abstract and more semantic high-level feature maps to illusion high-resolution features. Perform two times the nearest neighbor up-sampling for the feature space adjacent to the upper layer and add and merge the result of the 1 ∗ 1 convolution transformation of the feature map in the “bottom-up path” with the up-sampling result of the upper layer, then merge the result {M2, M3, M4, M5} uses 3 ∗ 3 convolution to reduce the aliasing effect caused by up-sampling. Finally, a multi-scale feature map set {P2, P3, P4, P5} is obtained, and these feature maps have the same size as the corresponding feature maps in {C2, C3, C4, C5} [
17].
3.3. Model Architecture
Based on the traditional Faster RCNN, we use the above-mentioned receptive field SPP module and multi-scale fusion FPN module to replace the C5 and backbone modules in the traditional model. The specific construction process is shown in
Figure 5:
Step1: Resize a given input image to a size of 600 ∗ 600, the purpose is to facilitate small batch training and Stochastic Gradient Descent (SGD) optimization;
Step2: Extract image features at different levels through the backbone network ResNet from bottom to up;
Step3: The feature map C5 extracted from the convolution block at the end passes through the receptive field enhancement module;
Step4: The high-level feature map is sampled and merged with the horizontally connected low-level feature map, from top to down;
Step5: After fusion, each level feature undergoes 3 ∗ 3 convolution for information integration and transition, and input to the RPN network;
Step6: Perform 1 ∗ 1 convolution operation on the two branches to obtain the positive and negative category information of the anchor frame and rough regression;
Step7: Perform Non-Maximum Suppression (NMS) according to classification confidence and eliminate redundant frames;
Step8: Obtain the characteristics of the region of interest through ROI pooling;
Step9: Perform candidate frame classification and fine prediction, after the two fully connected layers integrate the features.
Where, proposal, im_info, bbox_pred, cls_prob are the structure of Faster-RCNN where, Proposal is the proposal regional suggestion Module, im_info is the image information, bbox_pred is the prediction box result, cls_prob is the predict classification results
A Channel Attention Module (CAM) is a module for channel-based attention mechanism in convolutional neural networks [
18]. We produce a channel attention map by using the inter-channel relationship of features. As each channel of a feature map is considered as a feature detector, channel attention focuses on what is meaningful given an input image. To compute the channel attention, we squeeze the spatial dimension of the input feature map. We first aggregate spatial information of a feature map by using both average-pooling and max-pooling operations, generating two different spatial context descriptors (average-pooled features and max-pooled features). Both descriptors are then forwarded to a shared network to produce our channel attention map M
c. Finally, a spatial attention module is used to refine the features.
4. Experimental Results and Discussion
The analysis of influencing factors for the improved wood microscopic image identification model is described in the following subsections:
4.1. Impact of Dataset Expansion on the Test Accuracy
The dataset expansion method selected in this paper is the collaborative use of offline traditional image enhancement methods and online Mix-up data augmentation technology, which better enriches the diversity of original data samples and improves the problem of uneven distribution. The baseline method of experimental comparison is the model trained on the 608 samples before the improvement of the standard Faster RCNN detection method. The ablation method is the model of traditional data expansion and Mix-up data expansion, respectively, and the method used in this paper is in conjunction with the two expansion strategies.
Table 1. shows the detection accuracy of each category after the standard Faster RCNN algorithm is trained on different wood microscopic image datasets. The last row in the
Table 1 represents the average result of the detection accuracy of all categories (Original dataset, traditional data augmentation, Mix-up data augmentation, proposed approach).
By observing the test results in the first three columns of
Table 1, it can be seen that the expansion of the original dataset can bring a certain accuracy improvement. The traditional data expansion operation increased Average accuracy from 73.04% to 75.91%, and the Mix-up data expansion operation increased it to 76.44%, highlighted the importance of enriching the training set sample information. In addition, comparing the two data expansion methods, it can be concluded that the dataset processing method based on Mix-up can achieve better generalization of the test samples than the traditional method, and it obtained an increase of 0.53% on the basis.
The reason is that the mix-up method refers to different data in a batch of training samples for fusion processing, and the resulting fusion image can retain the characteristics of the corresponding original image according to a certain proportion. Furthermore, such training data are very useful for training the network, so that in the process of optimization and learning, it pays more attention to discriminative features that help distinguish different categories, and better captures the edge information between features. However, traditional data expansion methods that focus on enriching the diversity of the sample itself, such as flipping, panning, zooming, etc., also have the effect of improving the robustness of the network, which can be found from the mAP improvement of 2.9% relative to the original data set. Therefore, this paper combines the two data expansion methods and introduces the mix-up data fusion strategy on the basis of traditional expansion operations to improve the learning efficiency of sample features and make the network more specific for the learning of similarity between classes and diversity within classes.
4.2. Impact of Improvement Strategies on the Test Accuracy
This paper conducts a series of ablation experiments to explore the impact of improved strategy configuration parameters and improved strategy combinations on the accuracy of the test. First, due to the diversity of the SPP module structure in the receptive field enhancement strategy and the incompatibility of module parameters between different tasks, four model configurations were introduced for experimental comparative analysis, denoted as SPP-A, SPP-A#, SPP-B, SPP-B#. The SPP-A configuration draws on the YOLOv3 detection algorithm [
19], performs three different scales of maximum pooling on the input feature map, and adds a shortcut branch, which maintains the spatial resolution by zero-filling during maximum pooling. The SPP-B configuration is derived from the semantic segmentation network PSPNet [
20], consisting of five branches, of which four are the maximum pooling of different scales, and the other is the direct connection of the input. The parameter configuration details: the pooling core size of SPP-A is 13 ∗ 13, 25 ∗ 25, 37 ∗ 37; the pooling core size of SPP-A# is 5∗5, 9∗9, 13∗13; the pooling core size of SPP-B is 5 ∗ 5, 9 ∗ 9, 13 ∗ 13, 30 ∗ 30; the pooling core size of SPP-B# is 10 ∗ 10, 20 ∗ 20, 30 ∗ 30, 60 ∗ 60.
The detection accuracy of the receptive field enhancement strategy SPP module on the test set is shown in
Table 2. In
Table 2, “shortcut” represents the direct connection of the input end, and “extra branch” represents whether to introduce the fourth maximum pooling branch. There is a fourth branch by default under the SPP-B configuration. The first four rows of data in the table reflect the influence of additional branches and direct input terminals on the configuration of A. It can be found that adding additional branches and direct input terminals can bring certain performance improvements (0.4% and 1.2%), and the effect is more obvious with the shortcut improvements. However, the cooperative use of the two did not bring about the expected performance improvement, which may be caused by the in-adaptability of multiple receptive field combinations to the current problem target scale.
In addition, by observing the test accuracy of the model before and after parameter adjustment, it can be concluded that it is very necessary for the model to be properly adjusted on a given network. It can better extract different scale information in the current network feature map. For example, 3.1% in the SPP-A configuration and 2.4% in the SPP-B configuration. It is worth noting that the parameter adjustment principle of the module proposed in the improved model is that the pooling operation covers the entire feature map space scale as much as possible. In the task solved in this paper, the scale of the feature map after down sampling the backbone network is 38 ∗ 38.
Secondly, this paper conducts ablation experiments on each improvement strategy proposed to evaluate its influence on the generalization ability and adaptability of the model. The experimental results are shown in
Table 3. The ablation experiments were carried out on six models, respectively. “Model 0” represents the baseline method, as the standard Faster RCNN model without any improvement strategy; “Model 1” to “Model 3” represent the individual improvement strategies introduced Model; “Model 4” to “Model 5” represent a combination model of improvement strategies.
From the above
Table 3, it can be seen that the spatial pyramid pooling SPP strategy in the “Model 1” receptive field enhancement module has improved significantly, from 77.8% to 80.1%. This module expands the experience field of standard convolution operations through the hole convolution with different expansion rates and the maximum pooling operation with different pooling kernel sizes. The network not only pays attention to the acquisition of local features, but also extracts the most discriminative information of the entire feature map from a global and complete perspective, so the detection effect is improved. The experimental results of “Model 2” illustrate the necessity of generating candidate frames of various scales on feature maps of different levels after multi-scale features are merged with each other. Only using the feature pyramid structure FPN has achieved a performance improvement of 3.1%, which is more effective than the receptive field enhancement module and the attention mechanism module. We believe that the fusion of feature maps at different levels effectively compensates for the shortcomings of a single feature. Shallow features have better spatial information, which is helpful to the target positioning process, while deep features have rich semantic information, which helps Judgment of target category information. The result of “Model 3” reflects the impact of post-processing operations on detection accuracy. Although only a 0.3% performance improvement is obtained, its easy implementation and low complexity are easy to embed into the established model. Compared with the above-mentioned modules, this solution does not need to change the model structure to improve the detection accuracy. Additionally, it avoids the phenomenon of missed detection of similar objects of the same category due to more “critical” threshold setting, which improves the practical application value of higher precision in certain specific scenarios. In addition to the ablation experiment that uses the above improved strategy alone, the influence of the combination of different modules on the detection effect is also studied in this section. In “Model 4”, it can be seen that the combination of the improved strategy’s receptive field enhancement SPP and the multi-scale feature fusion module has achieved a significant increase of 5.7%. Finally, “Model 5” added the softer-NMS post-processing operation to improve the missed detection of neighboring targets. The model was improved by 0.3% after the fusion of the two improved strategies, and the final test accuracy was 83.8%.
5. Conclusions
This paper focuses on the identification problem for wood microscopic images based on deep transfer learning. The wood microscopic images sample library and dataset established in the experiment are limited. In addition, the use of deep models for image classification and recognition requires the construction of datasets for model training and testing and the demand for samples is relatively large. The paper uses a combination of traditional data expansion technology and Mix-up expansion technology to generate a sample dataset with richer content, which makes the model obtain more condensed and diverse information. Based on the traditional Faster RCNN algorithm, the paper proposes to use the receptive field enhancement SPP module and the multi-scale feature fusion RFN module strategy to improve the traditional model. Experiments show that the accuracy of target detection and recognition in wood microscopic images is as high as 83.8%, which is 6% higher than the traditional Faster RCNN algorithm. The experimental results prove that the improved model greatly enhances the recognition of wood microscopic images and provides a fast method for the identification of forestry wood species. In the follow-up, other influencing model factors should be further studied to improve the identification accuracy, which provides conditions for the micro-structure of wood. Additionally, we may focus on the content of the wood samples (the tissues and what anatomical features they contain: such as vessels, fibers, parenchyma, and rays).


