Abstract
The adsorption of different isotopic ozone mixtures on TiO2 at 77K was studied using FTIR spectroscopy and DFT calculations of cluster models. In addition to weakly bound ozone with band positions close to those of free or dissolved molecules, the spectrum of chemisorbed species was observed. The splitting of the ν1+3 combination band to eight maxima due to different isotopomers testified to the loss of molecule symmetry. The frequencies of all the isotopic modifications of the ozone molecules which form monodentate or bidentate complexes with four- or five-coordinated titanium atoms were calculated and compared with those of experimentally observed spectra. The four considered complexes adequately reproduced the splitting of the ν1+3 vibration band and the lowered anharmonism of chemisorbed O3. The energetically most favorable monodentate complex with four-coordinated titanium atoms showed good agreement with the observed spectra, although a large difference between the frequencies of ν1 and ν3 modes was found. For better coherence with the experiment, the interaction of the molecule with adjacent cations must be considered.
1. Introduction
The type of interaction of ozone with solid surfaces is a key factor determining the activity of different materials for catalyzing ozone decomposition and the reactivity towards other adsorbed molecules. Adsorption at the surface of atmospheric aerosol particles could affect the thickness of the ozone layer. Water purification by photo-ozonolysis catalyzed by TiO2 in the case of certain types of contamination may result in the formation of undesirable products. Ozone emitted by some devices is harmful for human health. Although the problem is of extreme importance for industry and ecology, the number of spectral studies regarding ozone adsorption is limited, apparently because of the technical difficulties of working with this highly active and unstable compound. Using low-temperature FTIR spectroscopy it was possible to study ozone adsorbed on SiO2 [1,2,3], Al2O3 [4], MgO [5], CaO [6], TiO2 [2,7,8], CeO2 [8,9], ZnO, and some zeolites [8]. In the spectra of TiO2 and CeO2, besides the bands of weakly bound molecules, ozone chemisorption with serious frequency shifts with respect to the band positions of physisorbed molecules were observed.
Recent data on the splitting of the ν1+3 combination band of chemisorbed ozone into eight maxima testified to the decrease in the symmetry of molecules which were supposed to be bound to the surface Ti4+ ion by one of the terminal atoms, forming a kind of monodentate complex [8]. However, the DFT calculation of ozone adsorbed on nanocrystalline TiO2 [10] has shown that while a triplet monodentate complex, where the molecule is bound to titanium atom via one of the terminal oxygen atoms, is the most stable, the computed difference between the frequencies of ν1 and ν3 vibrations is in a better agreement with the experimental values for singlet bidentate species. In contrast, our data on isotopic splitting support monodentate species where the molecule is no longer symmetrical and there are no equivalent oxygen atoms. A profound analysis of the experimental data, partially presented in [8], in comparison with the DFT calculations of isotopically substituted ozone complexes, clarifies this point.
In our study we provide a more detailed analysis of the FTIR spectra of different ozone isotopomers adsorbed on TiO2 at various degrees of enrichment. The obtained data are compared with the results of DFT calculations of ozone complexes with TiO2 clusters to check the proposed assignment of the distinct components in the complex structure of the observed spectra of chemisorbed isotopically mixed ozone. Modeling the interaction of ozone with clusters of titanium dioxide with differing types of coordination of surface Ti4+ cations should help to establish the geometry of adsorption complexes and clarify the nature of adsorption sites.
2. Experiment
2.1. FTIR Spectroscopy
Batches of TiO2 powder (Hombifine N 340 m2/g) were pressed into tablets and pretreated by heating at 723 K in vacuum for 1 h and then cooled in oxygen to avoid the reduction.
The experimental setup and the procedure of ozone adsorption have previously been described in detail [6,7,8]. The low-temperature stainless steel cell for studying the infrared spectra of adsorbed species was described elsewhere [11]. Ozone was prepared from gaseous 16O2 or its mixtures with 18O2 in the electric discharge and manipulated as previously reported. Before recording the spectra, about 0.5 Torr of helium was introduced into the cell to improve thermal contact of the sample with the cold environment. Spectra were recorded with a Nicolet FTIR 710 spectrometer with 2 cm−1 resolution. To eliminate the bulk absorption, the spectra of cooled samples were subtracted from those after exposure to ozone. For the deconvolution of the complex bands of isotopically mixed ozone the MagicPlot 2.9 program was used. The width was set at 6.6 cm−1, and band positions were fixed.
2.2. Computational Procedure
DFT is a successful method that is currently used to calculate the energy as well as the electronic and spectral properties of molecular systems. The inclusion of the exchange correlation functional directly into the Hamiltonian makes it possible to model and calculate sufficiently large objects, including the adsorption of molecules on the surface of solid bodies. The possibility of considering weak dispersion interactions leads, as a rule, to a better agreement with experimental data [12]. In the case of TiO2 + O3 system, electrostatic forces contribute to the energy of the interaction. Our calculation of the simplest model system with dispersion correction has shown that it results in an insignificant decrease in the total energy and does not affect the calculated vibrational frequencies. Therefore, the below results were obtained without considering the dispersion interactions.
Geometry optimization and the calculation of vibrational modes were performed by the density functional theory at the level B3LYP/6-311+G (d). In addition to the harmonic, anharmonic frequencies were calculated for all the isotopic forms of ozone adsorbed on TiO2 clusters. The adsorption energy was obtained as a difference between the whole energy of the complex and that calculated with the same parameter’s energies of the cluster and the molecule separately.
All calculations were performed using the quantum-chemical package Gaussian 16 (Revision A.03) [13], installed in the Huawei cluster at the Computing Center at St. Petersburg State University.
3. Results
3.1. FTIR Spectroscopy Data
When ozone is adsorbed at 77 K on titanium dioxide pretreated at 773 K, two groups of bands arise [7,8]. One, with bands of stretching vibrations at 1109 and 1034 cm−1 accompanied by a weak band of combination ν1+3 mode at 2107 cm−1 (close in position to those of free or dissolved ozone), gradually diminishes in intensity until almost disappearing after about 1 h. Weaker bands of another group with the maxima of fundamental vibrations at 1147 and 993–989 cm−1 and a combination at 2136 cm−1 are more stable and resist at 77 K.
If we adsorb the ozone prepared from a 50:50% isotopic mixture of 16O and 18O, then in the region of the ν1+3 combination immediately after adsorption the structure of six bands arises, forming two triplets typical of symmetrical O3 molecules, as in the spectrum of ozone adsorbed on aerosolized SiO2 [1]. After about 1 h, these bands significantly lose their intensity and a group of more strongly held ozone molecules becomes visible, consisting of eight maxima of almost the same intensity, as shown in Figure 1 (solid line).
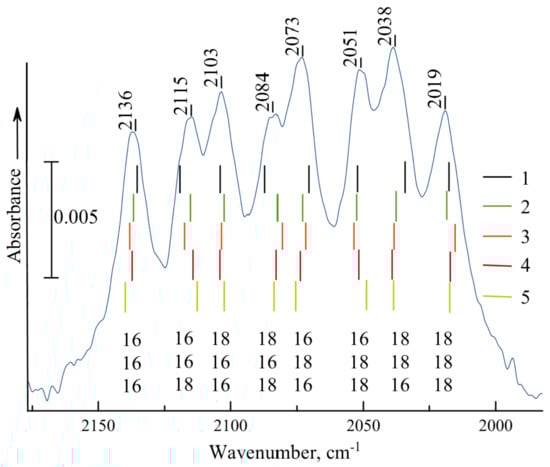
Figure 1.
Experimental spectrum of a 50% 18O isotopic mixture of ozone chemisorbed on TiO2 (solid curve) and the calculated frequencies of the ν1+3 combination mode of 8 ozone isotopomers forming a monodentate complex with the TiO2 cluster (1), with 5- (2) and 4-coordinated (3) Ti4+ ions of the Ti20O40 cluster, and bidentate complexes with 5- (4) and 4-coordinated (5) Ti4+ sites of the same Ti20O40 cluster. The values 16 or 18 under the bands denote the positions of isotopic atoms in the ozone molecule: the lower index corresponds to the oxygen atom nearest the Ti4+ cation. To provide the coincidence of the mean positions of the band of different species, the calculated values were multiplied by the following scaling factors: 0.9698, 0.8961, 0.9002, 0.9128, and 0.9107, for 1–5, respectively.
If ozone is prepared from an isotopic oxygen mixture containing the excess of usual 16O (about 57%), the intensities of the eight constituents are not equal, as can be seen from Figure 2, where the figures at each peak show the relative intensity with respect to the total intensity taken as 1. If the abundance of every isotopomer is purely statistical and the absorbance for ν1+3 mode of all eight isotopic species is supposed to be the same (measurements for ozone isotopomers in liquid oxygen [14] show that for some vibrations it could be different for symmetrical molecules like 16O18O16O and asymmetric molecules such as 16O16O18O, but for the ν1+3 mode the relative vibrational transition strengths are almost the same), then the relative intensities of molecules containing 0, 1, 2, or 3 18O atoms for isotopically mixed ozone with 57% 16O should be 0.185, 0.140, 0.105, and 0.08, respectively. A comparison of these figures with those in Figure 2 enables us to divide the three peaks of mixed isotopomers into two groups: those with intensities of 0.17–0.13 and those with intensities of 0.10–0.09. These two groups of bands should naturally be associated with molecules containing one or two 18O atoms, respectively.
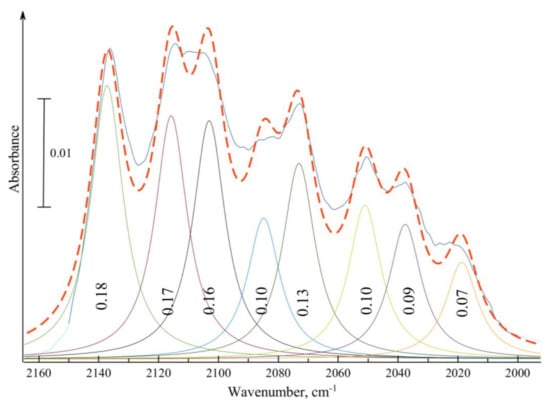
Figure 2.
Deconvolution of the band of the ν1+3 combination mode of the isotopic mixture of ozone (43% of 18O) chemisorbed on TiO2 (solid curve). The band is represented by a sum of 8 Gaussians (dashed line). Figures inside of each Gaussian indicate the relative area if the total band intensity is taken as 100%.
Thus, introduction of one 18O atom shifts the band of ν1+3 vibration from 2136 to 2115, 2103, or 2073 cm−1, that is, by 21, 33, or 63 cm−1. Apparently, the two first shifts correspond to substitution of terminal atoms, which are no more equivalent. Replacement of both by 18O shifts the band to 2084 cm−1 (by 52 cm−1), close to the sum of the two shifts, and we have a group of four bands, caused by the substitution of two terminal oxygens. Such additivity of shift values on the substitution of different atoms is manifested by the shift of the whole structure of four bands by 63–65 cm−1as a result of the exchange of a central atom in the ozone molecule.
This analysis leads to the assignment of the eight maxima presented in the bottom of Figure 1. The only problem is the form of molecule attachment to the surface. In [8] it was supposed that if the molecule was bound to the surface Ti4+ ion via O atom number 1 (the lowest digit in Figure 1), its substitution would lead to the smallest shift of the ν1+3 band by 21 cm−1, as shown in the figure. The calculation should verify this as well as the real geometry and binding energy of surface complexes of ozone bound to Ti4+ centers with different types of coordination. The calculations in the anharmonic approach should reproduce the frequencies and anharmonicity of ν1+3 combination vibrations. The anharmonicity (i.e., the difference between the sum of ν1 and ν3 frequencies and the position of ν1+3 band for free, dissolved, or physisorbed ozone molecules) is about 35 cm−1, but for chemisorbed O3, as shown in experimental data [8], it practically drops to zero.
3.2. Results of Calculations
As the simplest model of the interaction of ozone with the uttermost coordinately unsaturated titanium ion, we considered the O3 complex with the TiO2 molecule. Geometry optimization led to two stable structures, the monodentate (a) and bidentate (b) ozone complexes, as shown in Figure 3.
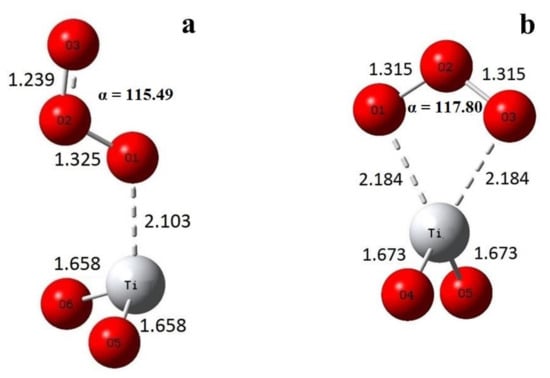
Figure 3.
Optimized geometry of (a) monodentate (symmetry Cs) and (b) bidentate (symmetry C2v) ozone complexes with TiO2.
The calculated interatomic distances, angles, and adsorption energies of ozone complexes with TiO2 clusters are given in Table 1. One can see that the angle does not change much on adsorption, slightly decreasing by less than 1.5°. Interatomic distances in bidentate complex with two-coordinated Ti increased by 0.06 Å, and the adsorption energy due to simultaneous interaction by two oxygen atoms with coordinately unsaturated titanium was rather high. However, such sites or spectral features of adsorbed ozone have nothing to do with the experimental data, indicating the nonequivalence of terminal oxygen atoms, and we shall consider this case only for comparison.

Table 1.
Adsorption energy (E), geometry, and the difference in fundamental frequencies (ν1 − ν3) of O3 molecule bound to TiO2 model clusters.
In the monodentate ozone complex with the TiO2, the molecule adsorption energy and the short distance between the molecule and Ti4+ atom provide evidence of a very strong interaction with the cluster, which results in a serious deformation of the molecule: the O-O bond adjacent to the titanium atom becomes longer, while another is shortened. This means that the force constants become quite different, leading to an increase in the difference between the frequencies of ν1 and ν3 vibrations shown in the right column of Table 1. The two vibrations, which for the free molecules were the symmetric and antisymmetric stretching modes, become now localized at different bonds, O1-O2 and O2-O3, respectively, if we numerate the oxygen atoms from that nearest the Ti atom.
For the monodentate ozone complex with TiO2 we calculated the frequencies of all the combinations of ozone isotopic mixtures; the results are presented in Table 2. Regarding how the calculated frequencies were shifted with respect to those observed experimentally, to compare the isotopic splitting of the bands the calculated values were multiplied by scaling factors chosen for each vibrational mode by minimizing the mean square deviation. The factor values are presented in the bottom line of the table. As seen from the table, even this oversimplified model reproduces the experimental frequencies assigned to the calculated isotopic configurations.
Table 2.
Experimental and calculated frequencies of different isotopomers of monodentate ozone complex with cluster TiO2.
As expected for the localized vibration, the substitution of the second or third oxygen atoms resulted in almost equal large (about 30 cm−1) shifts of the band of ν1 vibration, while the effect of replacement of the first O atom did not exceed 1 cm−1 (Figure 4). As a result, the structure of the split ν1 band is typical of an isotopically mixed diatomic: a triplet with the central band twice as intense as the others for a 50:50% mixture. The frequency of ν3 vibration is sensitive to substitution of the first and second atoms, but the shifts in this case are different, at about 19 and 30 cm−1, respectively. The effect of the third atom is much weaker (about 4 cm−1). A strong bulk absorption of TiO2 below 1000 cm−1 precludes the observation of a better spectrum than that shown in Figure 3b with the resolved peaks of different isotopomers. Nevertheless, the computed frequencies of the ν1+3 combination vibrations shown in Figure 1 are in perfect agreement with the observed spectrum.
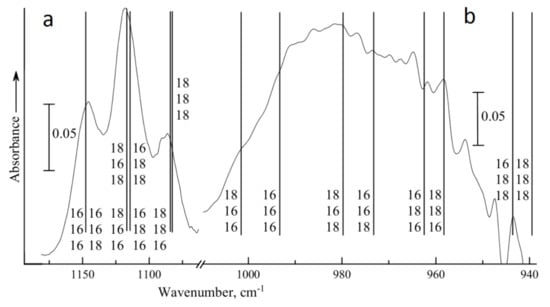
Figure 4.
Experimental spectrum of isotopically mixed ozone with 50% 18O content (solid curve) and the calculated frequencies (vertical lines) of 18O-containing ozone complexes with a TiO2 cluster in the regions of ν1 (a) and ν3 (b) vibrations. Masses of oxygen atoms number 1–3 are shown from bottom to top.
As a more complex model, we chose the Ti20O40 cluster (Figure 5), which simulates the predominant (101) anatase crystal face. The geometry of this cluster was optimized for the relaxation of Ti-O bonds. There are 16 four-coordinated and 4 five-coordinated Ti4+ ions in this cluster after relaxation. As for oxygen, there are 8 three-coordinated, 28 two-coordinated, and 4 one-coordinated O2- ions in this model cluster. The presence of the latter in the model in order to save stoichiometry should not create a problem. The structure allows us to model the monodentate and bidentate complexes with ozone on different surface centers.
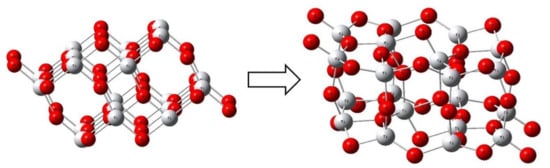
Figure 5.
Geometry of the initial and relaxed anatase Ti20O40 cluster (symmetry C2h).
The optimized geometries of monodentate and bidentate ozone complexes with four-coordinated and five-coordinated Ti4+ ions of the Ti20O40 anatase cluster are shown in Figure 6. The calculated values on the geometry and energies are given above in Table 1 together with those for the TiO2 cluster. According to the calculations, monodentates are the most stable ozone complexes for all the sites. In the order of adsorption energy decrease, the monodentate complex with four-coordinated titanium I is followed by monodentate complex III with the five-coordinated Ti4+ ion, then the bidentate complex IV, and finally the bidentate complex II.
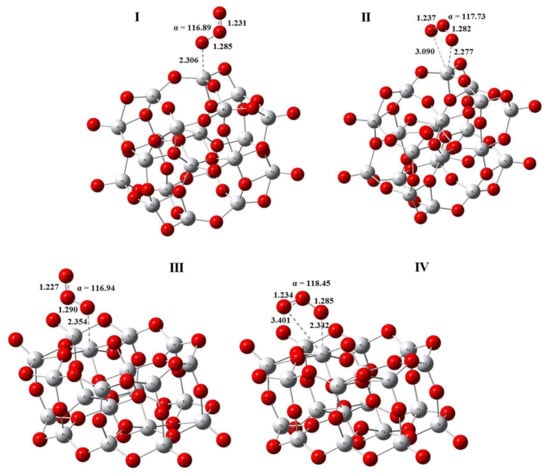
Figure 6.
The optimized geometry of the monodentate (I) and bidentate (II) ozone complexes on the 4-coordinated Ti4+ ions, and of the monodentate (III) and bidentate (IV) complexes with 5-coordinated Ti4+ ions of the anatase cluster Ti20O40.
As to the geometry of ozone adsorbed on Ti20O40 cluster, the valence angle α decreased slightly as compared with free ozone molecules, like in the case of TiO2 cluster, and the distance between the O1 and O2 atoms also increased, while that between the O2 and O3 atoms became shorter (the numbering of O atoms always starts from that bound to Ti). The geometry of ozone molecules in monodentate complexes with four- and five-coordinated sites of Ti20O40 cluster was almost the same in bond lengths and valence angles, but as expected, the distance from the TiO2 surface to the nearest O1 ozone atom was shorter in the case of the stronger four-coordinated Ti4+center. Similar trends were observed for bidentate complexes; however, despite the shorter distance from the TiO2 surface, the bidentates lost to the monodentates in terms of adsorption energy, and the bidentate complex with the five-coordinated titanium atom was more strongly bound (by about 2 kJ/mol) than that with the four-coordinated one.
We calculated the frequencies of all the isotopomers of mono- and bidentate complexes of ozone on four- and five-coordinated Ti atoms; the results are presented in Table 3. These data corrected by the corresponding factors were used for a comparison of the observed and calculated splitting (Figure 1). A mutual arrangement of band positions of ν1 and ν3 modes is shown in Figure 7. One can see that for all four considered structures of the Ti20O40 cluster the ν1 band of isotopically mixed ozone was split into three groups of lines, as in the case of the complex with the molecular TiO2 cluster. Similarly, the band of ν3 vibration was split into four pairs of close lines 0.2–2.5 cm−1 apart.
Table 3.
Calculated frequencies of ozone isotopomers forming complexes with the relaxed anatase cluster Ti20O40.
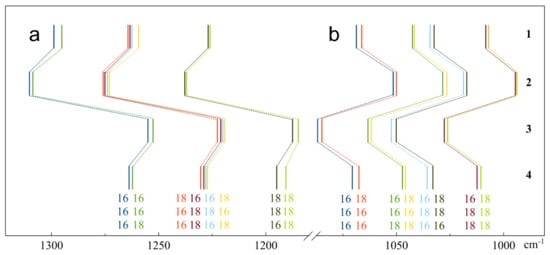
Figure 7.
Positions of the bands of ν1 (a) and ν3 (b) vibrations of ozone isotopomers forming complexes with the Ti20O40 cluster. Monodentate with 4- (1) and 5-coordinated (2) Ti4+ ions, and bidentate complexes with the same sites of the latter cluster (3,4).
Besides the frequency values of fundamental vibrations ν1 and ν3, as well as the combination mode ν1+3, in Table 3 we present the difference between the sum ν1 + ν3 and ν1+3 as a measure of anharmonicity. For gaseous ozone, this value was 1042.1 + 1103.1−2110.8 = 34.4. Our calculation for a free molecule provided a value of 21 cm−1, but as seen from the table, for all the isotopomers of ozone complexes this value is always negative and varies between −1 and −11, thus diminished by 22–32 cm−1 with respect to free molecules.
4. Discussion
An unexpected result of our modeling was that for all the considered titania clusters we found two stable configurations, which we call monodentate and bidentate configurations. The real bidentate complex with two equivalent bonds, however, was formed only with the molecular TiO2 cluster, which can be considered as a model of a highly unsaturated two-coordinated Ti4+ center. The formation of two bonds with an energy value of 69.5 kJ/mol each made it energetically the most favorable. The only bond with the Ti atom in the monodentate complex is shorter and has higher adsorption energy of 92.7 kJ/mol. A greater adsorption energy as compared with bidentate complexes is typical of monodentate complexes with clusters of Ti20O40. What we call here “bidentate” should rather be called “tilted” or even “bridged”. In fact, the distance of the second terminal oxygen (O3) from the four-coordinated titanium ion is much greater than from the first one (3.090 against 2.277 Å). Although the bond to the surface Ti4+ ion is shorter than the only bond in the monodentate complex, the interaction energy is lower. This can probably be explained by the additional repulsion between ozone oxygen atoms and the surface oxygen anions. If we compare adsorption energies of ozone in monodentate complexes with four- and five-coordinated Ti4+ ions, we find that interaction with the former is stronger. This is also reflected in the shorter O-Ti bond length and is a natural manifestation of the higher strength of coordinately more unsaturated centers.
However, this explanation does not work for bidentate complexes, where the interaction with five-coordinated is stronger. Here we must consider that, as seen from Figure 6, the distance of the terminal oxygen atom from the titanium is even greater, at about 3.4 Å. At approximately the same distance from the oxygen there is one more Ti4+ ion and ozone complex can be considered as asymmetric “bridged” one. The formation of two bonds with the same cation here means an increase of its coordination number up to seven, that is completely not typical of titanium. Therefore, we suppose that the reason for the greater adsorption energy of such a complex with a weaker five-coordinated site is an additional attraction to the second cation. This means that interaction of ozone with a surface of oxide is not restricted to the bond formation with a single cation, but includes the influence of neighboring atoms.
The difference between the fundamental frequencies ν1−ν3 was considered as a criterion for the choice between the predicted ozone complexes on the titania surface [10]. These values for ozone in complexes I–IV are given in the right column of Table 1, and those calculated for the 18O substituted ozone can be seen in Table 3. For a free ozone molecule this difference is 61.0 cm−1 [14]. The calculated value is 66.5 cm−1, and it does not change greatly with the rather strong interaction with the TiO2 cluster (64.2 cm−1). The proximity of these values signals the reliability of our calculation, and the value itself can be considered as a measure of the resonance interaction between the vibrations of the two O-O bonds. An increase in the ν1−ν3 difference for chemisorbed ozone of up to 152 cm−1 in the experimental spectra or even more in our model calculations testifies to the redistribution of the fourth constants of the two bonds, apparently overestimated in the calculation.
The calculated values of the ν1−ν3 difference for the substituted ozone molecules are consistent with the suggested assignment. In fact, substitution of the first O atom nearest titanium by 18O lowers the frequency of ν3 vibration and does not affect the ν1, leading to an increase in the ν1−ν3 distance. The substitution of the central oxygen lowers the frequencies of both vibrations, and hence has a small effect upon the ν1−ν3 value, while the species with substituted terminal oxygen (O3) have a lowered ν1 frequency and a shorter distance between the two vibrations.
The obtained value for the bidentate ozone complex II is the most consistent with the experimentally observed ν1−ν3 difference. However, energetically the most favorable complex is monodentate species I. Our results suggest an explanation for this apparent contradiction. In fact, the value of ν1−ν3 is smaller for asymmetric bidentate complexes when the terminal oxygen has the possibility of interacting with the same and adjacent cation. In our model we considered only the case of adsorption on single sites, such as those at the ribs of nanocrystals. At the crystal faces of anatase there are rows of cations or dual sites that are 3.73 or even 3.00 Å apart, close enough for the terminal oxygen atoms of ozone molecules chemisorbed at one site to interact with another. Such an interaction should lead to an increase in adsorption energy and diminution of the ν1−ν3 difference. An attempt to model ozone adsorption on the slab representing the (110) face of rutile with the rows of Ti4+ ions was undertaken in [15]. It was found that in fact the molecules forming bridges between adjacent cations were energetically favorable, but the vibrational spectra were not reported. Our next step is to model such kinds of complexes. Work is in progress.
5. Conclusions
The adsorption of different isotopic ozone mixtures on TiO2 at 77K studied by FTIR spectroscopy, in addition to the weakly bound molecules with band positions close to those of free or dissolved molecules, revealed chemisorbed species with well-shifted vibrational frequencies. The anharmonicity, i.e., the difference between the sum of the frequencies of ν1 and ν3 modes and the band position of ν1+3 combination vibration, diminished from about 35 cm−1 for the gas down to zero. Unlike gaseous or weakly perturbed molecules, where the combination band of isotopically mixed ozone split in six components, the ν1+3 band of chemisorbed species split into eight maxima of different isotopomers, thus showing that the two terminal oxygen atoms were no longer equivalent. The intensity distribution of the components in the spectra of isotopic mixtures with different enrichments enabled us to identify all the eight species on the assumption of a monodentate model. These new data confirmed by calculations, in addition to the existing basic knowledge, can be used in promising experiments on infrared laser-induced resonance photoozonolysis reactions [16].
DFT calculations of clusters modeling 2-, 4-, or 5-coordinated Ti4+ cations showed that on all these sites 2 stable configurations were possible: monodentate and what we called bidentate. The latter was symmetric and energetically favorable only for hypothetical structure with two-coordinated titanium. In bidentate complexes with four- or five-coordinated Ti4+ cations, two bonds differed in their length and, apparently, in force constants. The frequencies of all the isotopic modifications of ozone molecule which formed monodentate or bidentate complexes with four- or five-coordinated titanium atoms were calculated and compared with those of experimentally observed spectra. The four considered complexes adequately reproduced the splitting of the ν1+3 combination vibration band and the lowered anharmonism of chemisorbed O3. The energetically most favorable monodentate complex with four-coordinated titanium atoms showed good agreement with the observed spectra; however, the distance between the frequencies of ν1 and ν3 vibrations was greater than that in the experiment. To further understand the mechanism of ozone adsorption and decomposition on titanium dioxide, molecule interactions with the adjacent cations of dual sites should be considered.
Author Contributions
Conceptualization, I.K. and A.T.; methodology, I.K.; investigation, T.A. and O.P.; data curation, I.K. and A.T.; writing—original draft preparation, A.T.; writing—review and editing, A.T. and O.P.; visualization, T.A. and O.P.; supervision, A.T. All authors have read and agreed to the published version of the manuscript.
Funding
The work was supported by Russian Foundation for Basic Research, grant No. 19-33-90296.
Institutional Review Board Statement
Not applicable.
Informed Consent Statement
Not applicable.
Data Availability Statement
Not applicable.
Acknowledgments
We are grateful to the Computing Center of St. Petersburg State University, http://www.cc.spbu.ru, for calculation facilities.
Conflicts of Interest
The authors declare no conflict of interest.
References
- Bulanin, K.M.; Alexeev, A.V.; Bystrov, D.S.; Lavalley, J.C.; Tsyganenko, A.A. IR study of ozone adsorption on SiO2. J. Phys. Chem. 1994, 98, 5100–5103. [Google Scholar] [CrossRef]
- Tsyganenko, A.A.; Bulanin, K.M.; Lavalley, J.C. IR spectra of adsorbed ozone. Colloids Surf. A. 1995, 101, 153–158. [Google Scholar] [CrossRef]
- Tsyganenko, A.A.; Storozheva, E.N.; Manoilova, O.V. Manifestations of the acidity of adsorbed molecules in H-bonded complexes with silanol groups. Lewis acidity of ozone. Catal. Today 2001, 70, 59–71. [Google Scholar] [CrossRef]
- Thomas, K.; Hoggan, P.E.; Mariey, L.; Lamotte, J.; Lavalley, J.C. Experimental and theoretical study of ozone adsorption on alumina. Catal. Lett. 1997, 46, 77–82. [Google Scholar] [CrossRef]
- Berlier, G.; Yamamoto, T.; Spoto, G.; Lamberti, C.; Gribov, E.; Zecchina, A. IR spectra of ozone adsorbed on MgO. Phys. Chem. Chem. Phys. 2002, 4, 3872–3875. [Google Scholar] [CrossRef]
- Bulanin, K.M.; Lavalley, J.C.; Tsyganenko, A.A. Infrared study of ozone adsorption on CaO. J. Phys. Chem. B 1997, 101, 2917–2922. [Google Scholar] [CrossRef]
- Bulanin, K.M.; Lavalley, J.C.; Tsyganenko, A.A. Infrared study of ozone adsorption on TiO2 (anatase). J. Phys. Chem. 1995, 99, 10294–10298. [Google Scholar] [CrossRef]
- Tsyganenko, A.A.; Aminev, T.R.; Baranov, D.A.; Pestsov, O.S. FTIR spectroscopy of adsorbed ozone. Chem. Phys. Lett. 2020, 76, 138071. [Google Scholar] [CrossRef]
- Bulanin, K.M.; Lavalley, J.C.; Lamotte, J.; Mariey, L.; Tsyganenko, N.M.; Tsyganenko, A.A. Infrared study of ozone adsorption on CeO2. J. Phys. Chem. B 1998, 102, 6809–6816. [Google Scholar] [CrossRef]
- Kevorkyants, R.; Chizhov, Y.V.; Bulanin, K.M. Ab initio study of ozone adsorption on a nanocrystalline titania. Langmuir 2020, 36, 1930–1936. [Google Scholar] [CrossRef] [PubMed]
- Tsyganenko, A.A. Variable temperature IR spectroscopy in the studies of oxide catalysts. Top. Catal. 2013, 56, 905–913. [Google Scholar] [CrossRef]
- Al Zoubi, W.; Kamil, M.P.; Fatimah, S.; Nashrah, N.; Ko, Y.G. Recent advances in hybrid organic-inorganic materials with spatial architecture for state-of-the-art applications. Prog. Mater. Sci. 2020, 112, 100663. [Google Scholar] [CrossRef]
- Frisch, M.J.; Trucks, G.W.; Schlegel, H.B.; Scuseria, G.E.; Robb, M.A.; Cheeseman, J.R.; Montgomery, J.A., Jr.; Vreven, T.; Kudin, K.N.; Scalmani, G.; et al. Gaussian 16; Revision, A.03; Gaussian, Inc.: Wallingford, CT, USA, 2016. [Google Scholar]
- Bulanin, K.M.; Bulanin, M.O.; Tsyganenko, A.A. Infrared spectra of 18O-enriched ozones in liquid oxygen solution. Chem. Phys. 1996, 203, 127–136. [Google Scholar] [CrossRef]
- Dall Rasmussen, M. Theoretical Investigation of the Adsorption of Oxygen on TiO2. Ph.D. Thesis, University of Aarhus, Aarhus, Denmark, February 2005. Available online: https://phys.au.dk/fileadmin/site_files/publikationer/phd/Maria_Dall_Rasmussen.pdf (accessed on 30 May 2021).
- Tsyganenko, A.A.; Kompaniets, T.N.; Novikov, R.G.; Pestsov, O.S. Resonance laser-induced processes and energy transformations in adsorbed layers. Curr. Opin. Chem. Eng. 2019, 24, 69–78. [Google Scholar] [CrossRef]
Publisher’s Note: MDPI stays neutral with regard to jurisdictional claims in published maps and institutional affiliations. |
© 2021 by the authors. Licensee MDPI, Basel, Switzerland. This article is an open access article distributed under the terms and conditions of the Creative Commons Attribution (CC BY) license (https://creativecommons.org/licenses/by/4.0/).