Abstract
The evolution behavior of anode gas during aluminum electrolysis has been a hot spot of research for energy saving and process control. In the present work, the bubble evolution behavior during aluminum electrolysis was investigated using a lab-scale see-though cell. The bubble evolution characters on an 11 cm2 (bottom surface area) flat anode, an 11 cm2 slotted anode, and a 50 cm2 flat anode were investigated with statistical analysis, respectively. The results showed that bubbles tended to generate and adhere to certain regions on the anode surface due to the heterogeneity of the carbon material, and the adhering regions moved when current density was increased. The anode slot lowered the actual current density on the anode significantly by reducing the anode bubble coverage. Influenced by the group effect of bubbles, the 50 cm2 flat anode behavior constituted a lower bubble coverage rate, lower average bubble size, and lower actual current density than the 11 cm2 flat anode.
1. Introduction
The Hall–Héroult electrolytic process is the most common technology for primary aluminum production nowadays. In this process, the raw material—alumina—is fed into the molten cryolite-based electrolyte at the temperature of 920–960 °C. Carbon is used as both anode and cathode material and the direct current goes through the anode to the cathode. As the electrochemical reactions take place, liquid aluminum is reduced at the cathode and deposited at the bottom of the cell, creating a separate fluid layer between the carbon cathode and the molten electrolyte, where the liquid aluminum layer behaves as the actual cathode [1,2]. Simultaneously, oxygen-containing complex ions from dissolved alumina discharge and gaseous CO2 is formed on the surface of the anode. During the aluminum electrolysis, the bottom surface of the anode is the main interface for the anodic reaction [2,3]:
[Al2O2F4]2− + 2F− + C = CO2 + 2AlF3 + 4e (under high alumina concentration)
2[Al2OF6]2− + C = CO2 + 4AlF3 + 4e (under low alumina concentration)
It has been proved that CO2 is the primary gas product of aluminum electrolysis [4]. However, due to the secondary reactions of CO2 with anode and aluminum, the byproduct CO takes a proportion of 10–20 vol.% in the final anode gas. The generated anode gas will overlie on the reaction interface, inhibiting the efficient contact between the electrolyte and the anode. As a consequence, the anodic process becomes unstable and difficult to predict [5].
Among all the influencing factors, the alumina concentration in the electrolyte and the anode gas evolution process contributes to most of the uncertainties. The lack of alumina, or uneven alumina distribution in the electrolyte would induce the anode effect due to the lack of Al-O-F complex ions in the anodic reaction [2,6]. Meanwhile, the nucleation, growth, coalescence and release mechanism of the anode gas bubbles at the anode bottom surface could cause significant variation in the effective reaction area, and further the actual anode current density, which could trigger the anode effect as well [7,8]. Once the anode effect happens, the current efficiency is reduced, and a large amount of PFCs greenhouse gas is released [9]. The CO2 bubble layer adhered on the anode surface also introduces an extra voltage drop of about 0.15–0.35 V to the cell voltage [10], causing a non-negligible waste of energy.
The anode gas generated on the anode also has positive effects on the electrolysis process. The release of the bubble from the bottom surface of the anode drives the flow of the electrolyte in industrial cells, greatly enhancing the heat convection and accelerating the dissolution rate of alumina at the feeding zone [11,12].
Due to the high temperature and strong corrosive nature of cryolite electrolyte, the direct measurement of bubble properties on industrial cells cannot be conducted, and the observation of anode bubbles in a laboratory electrolysis experiment is not easy. However, the double-chamber see-through cell has been designed and used to study the bubble behavior during aluminum electrolysis. In the previous study [13], the thickness, coverage, and releasing frequencies of the bubbles on both laboratory and industrial cells were initially studied. The results showed that the influence of the bubble layer on the anode working condition is significant, and the evolution principle obtained from the lab-scale cell is similar to that from the industrial cell.
The aim of this paper was to investigate the bubble generation and evolution behavior under the anode, and the results help to understand bubble-induced resistance during electrolysis, give insights into the anode working condition, and inspire the development of the method for reducing the bubble layer voltage drop.
In this paper, the anode gas evolution phenomenon during aluminum electrolysis was observed and recorded with a bottom-view see-through cell through lab experiments. The bubble evolution principles were investigated with image processing and the data statistical analysis method. The influences of anode geometry and current density on the bubble evolution behavior were analyzed and discussed.
2. Experiment
2.1. Materials and Chemicals
Reagents LiF, CaF2, Al2O3, and NaCl were analytically pure (>99.7 wt.%). Reagents Na3AlF6 and AlF3 were chemically pure (>99.0 wt.%). All reagents were manufactured by Sinopharm Chemical Reagent Co. Lt.d., Shanghai, China. All chemicals were dried at 150 °C for 24 h to remove the absorbed water and were kept in a dry box before use.
High-purity graphite (>99.6 wt.%, manufactured by Jinke company, Shenyang, China) with a density of 1.85 g·cm−3 was used as the anode and cathode material. The anode and cathode were dried at 110 °C for 48 h and kept in a dry box before use.
2.2. Apparatus
A transparent see-through cell was used to observe and record the bubble evolution behavior, as shown in Figure 1. In this apparatus, in order to keep the electrolyte in a transparent state during electrolysis, the anode and cathode were placed in two separate chambers. The anode and cathode were placed separately in the anode chamber and cathode chamber, and the two chambers were connected through a 1 mm width gap at the bottom of the central quartz flap. The double chamber quartz crucible was installed on a quartz holder, through which the anode phenomenon could be observed from underneath the furnace by a camera.
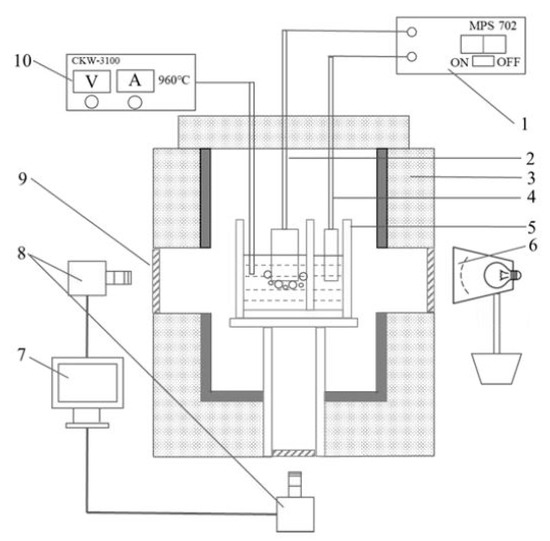
Figure 1.
Schematic of the bottom- and side-view see-through cell. 1—DC power supply, 2—anode, 3—furnace, 4—cathode, 5—transparent quartz crucible, 6—light source, 7—computer for data collection, 8—cameras, 9—quartz window, 10—temperature controller.
When the operating temperature reached above the liquidus temperature, the electrolyte gradually melted and became colorless and transparent. Once the electrolysis began, the aluminum was reduced on the cathode. The dispersed aluminum, or so-called ‘metal fog’, dispersed in the cathode chamber quickly; as a consequence, the electrolyte in the cathode chamber became non-transparent. With the double-chamber design, the ‘metal fog’ formed at the cathode did not affect the vision in the anode chamber [14].
Though the cell design in this experiment is a bit different from that of the industrial cell, the anode gas evolution behavior is supposed to be similar in the two cases. However, the main differences between this experimental cell and industrial cell on bubble behavior might come from the discrepancies in the electrolyte flow rate and environment magnetic field. From previous research, influences from these two factors do not affect the bubble distribution patterns significantly [15,16]. In the present paper, the influences from electrolyte flow and environment magnetic field on bubble evolution behavior are ignored. Since the anode and cathode were placed, respectively in the anode chamber and cathode chamber, the ACD (anode cathode distance) in the experimental cell was bigger than that in the industrial cell. Consequently, a small proportion of current would flow through the anode sidewall during electrolysis. This could cause the underestimation of the actual current density in this investigation than that of the industrial cases; however, the results obtained under the same experimental condition can be compared and the evolution principle can be derived.
When the temperature became stable and the electrolyte melted completely, the preheated anode and cathode were immersed slowly into the electrolyte with the immersion depth of 30 mm. To ensure that the anodes reached a stable state, the image recording started 10 min after the pre-electrolysis.
The frame frequency of the camera (model: MV-VS078FC, manufactured by Microvision Ltd., Guangzhou, China) was 30 Hz, with image resolution of 800 × 600. A DC power supply (MPS 702, Tradex Electronic Technology Corp., Hongkong, China) was used to provide the DC current for electrolysis.
2.3. Experimental Design
Two series of experiments were conducted in this study, as listed in Table 1. In Experiment 1, graphite anodes with the dimensions of 50 mm (length) × 22 mm (width) × 70 mm (height) were tested. The size of the quartz crucible used in Experiment 1 was 105 mm (length) × 65 mm (width) × 100 mm (height) with an anode chamber of 70 mm (length) × 65 mm (width) × 100 mm (height) and wall thickness of 3 mm. The slotted anode was prepared by cutting a longitudinal slot of 50 mm (length) × 4 mm (width) × 15 mm (depth) in the middle of the anode bottom surface.

Table 1.
Experimental design.
The size of the bubbles is determined by many aspects, including the size of the anode, anode surface properties, bath properties, and gas compositions, etc. Compared to the water model, the high temperature model–see through cell model has obvious disadvantages in anode size, as the earlier publications only reported experimental results on an anode around 11 cm2 (bottom surface area) [15,16,17]. The anode size sets a strict limit on the active area of the bubbles, which introduces considerable influence on the bubble behavior. Meanwhile, the same bubble on anodes of different sizes could cause different influences on the electrolysis process, which in turn affect the bubble generation process. Additionally, from the viewpoint of industrial application, the slotting experiment conducted on the 50 mm × 22 mm anode could be an extreme small case. In the industrial cases, the influence of anode size on bubble distribution should be much steadier than the results obtained under this experimental conditions since size of the industrial anode is much bigger than that of the anode bubbles. With this consideration, in Experiment 2, the dimensions of the anode were set as 100 mm (length) × 50 mm (width) × 70 mm (height), where the anode bottom surface area was increased to 50 cm2. Correspondingly, the dimensions of the quartz crucible were enlarged to 170 mm (length) × 90 mm (width) × 100 mm (height), with the anode chamber of 140 mm (length) × 90 mm (width) × 100 mm (height) and the wall thickness of 3 mm. With an increase in the crucible size, the experimental cost increased as well as the risk of failure.
Two electrolyte compositions were selected, respectively, for Experiment 1 and Experiment 2, both of which had low liquidus temperatures so that the quartz crucible could have a long service life of approximately 1 h and the electrolyte volatilization could be reduced to some extent. If the experiments were carried out at a higher temperature, the quartz crucible would quickly be corroded by the cryolite electrolyte.
In Experiment 1 and Experiment 2, the molar ratio of NaF and AlF3 was maintained to be the same as 2.2, so that the main component of the bath was within the reasonable range of an industrial electrolyte. LiF, CaF2, and NaCl additives were added into the electrolyte to lower the liquidus temperature, where LiF and CaF2 are the common additives used in industrial cells. In Experiment 2, 10 wt.% of NaCl was introduced into the electrolyte to lower the liquidus temperature further. Since the electrolyte was pre-dried, chloride ions in the molten electrolyte could not be oxidized during electrolysis, so that the anodic process was not affected by NaCl addition; in this case, the molar ratio of NaF and AlF3 in Experiment 1 and Experiment 2 was maintained to be the same. The superheats of the electrolyte for Experiment 1 and Experiment 2 were set as 20 °C to ensure a clear vision from the bottom view.
2.4. Methodology
2.4.1. Image Processing and Bubble Information Extraction
With the see-through cell, the bubble evolution phenomena under various conditions were recorded from the bottom view of the anodes. The recorded images were then processed, and the bubble distribution information on each image was transferred into a data matrix in Matlab software. Based on these data matrixes, the information on the number of bubbles, single bubble size, and bubble coordinates, as well as any changes on these with time, could be collected, and evolution principles could be derived.
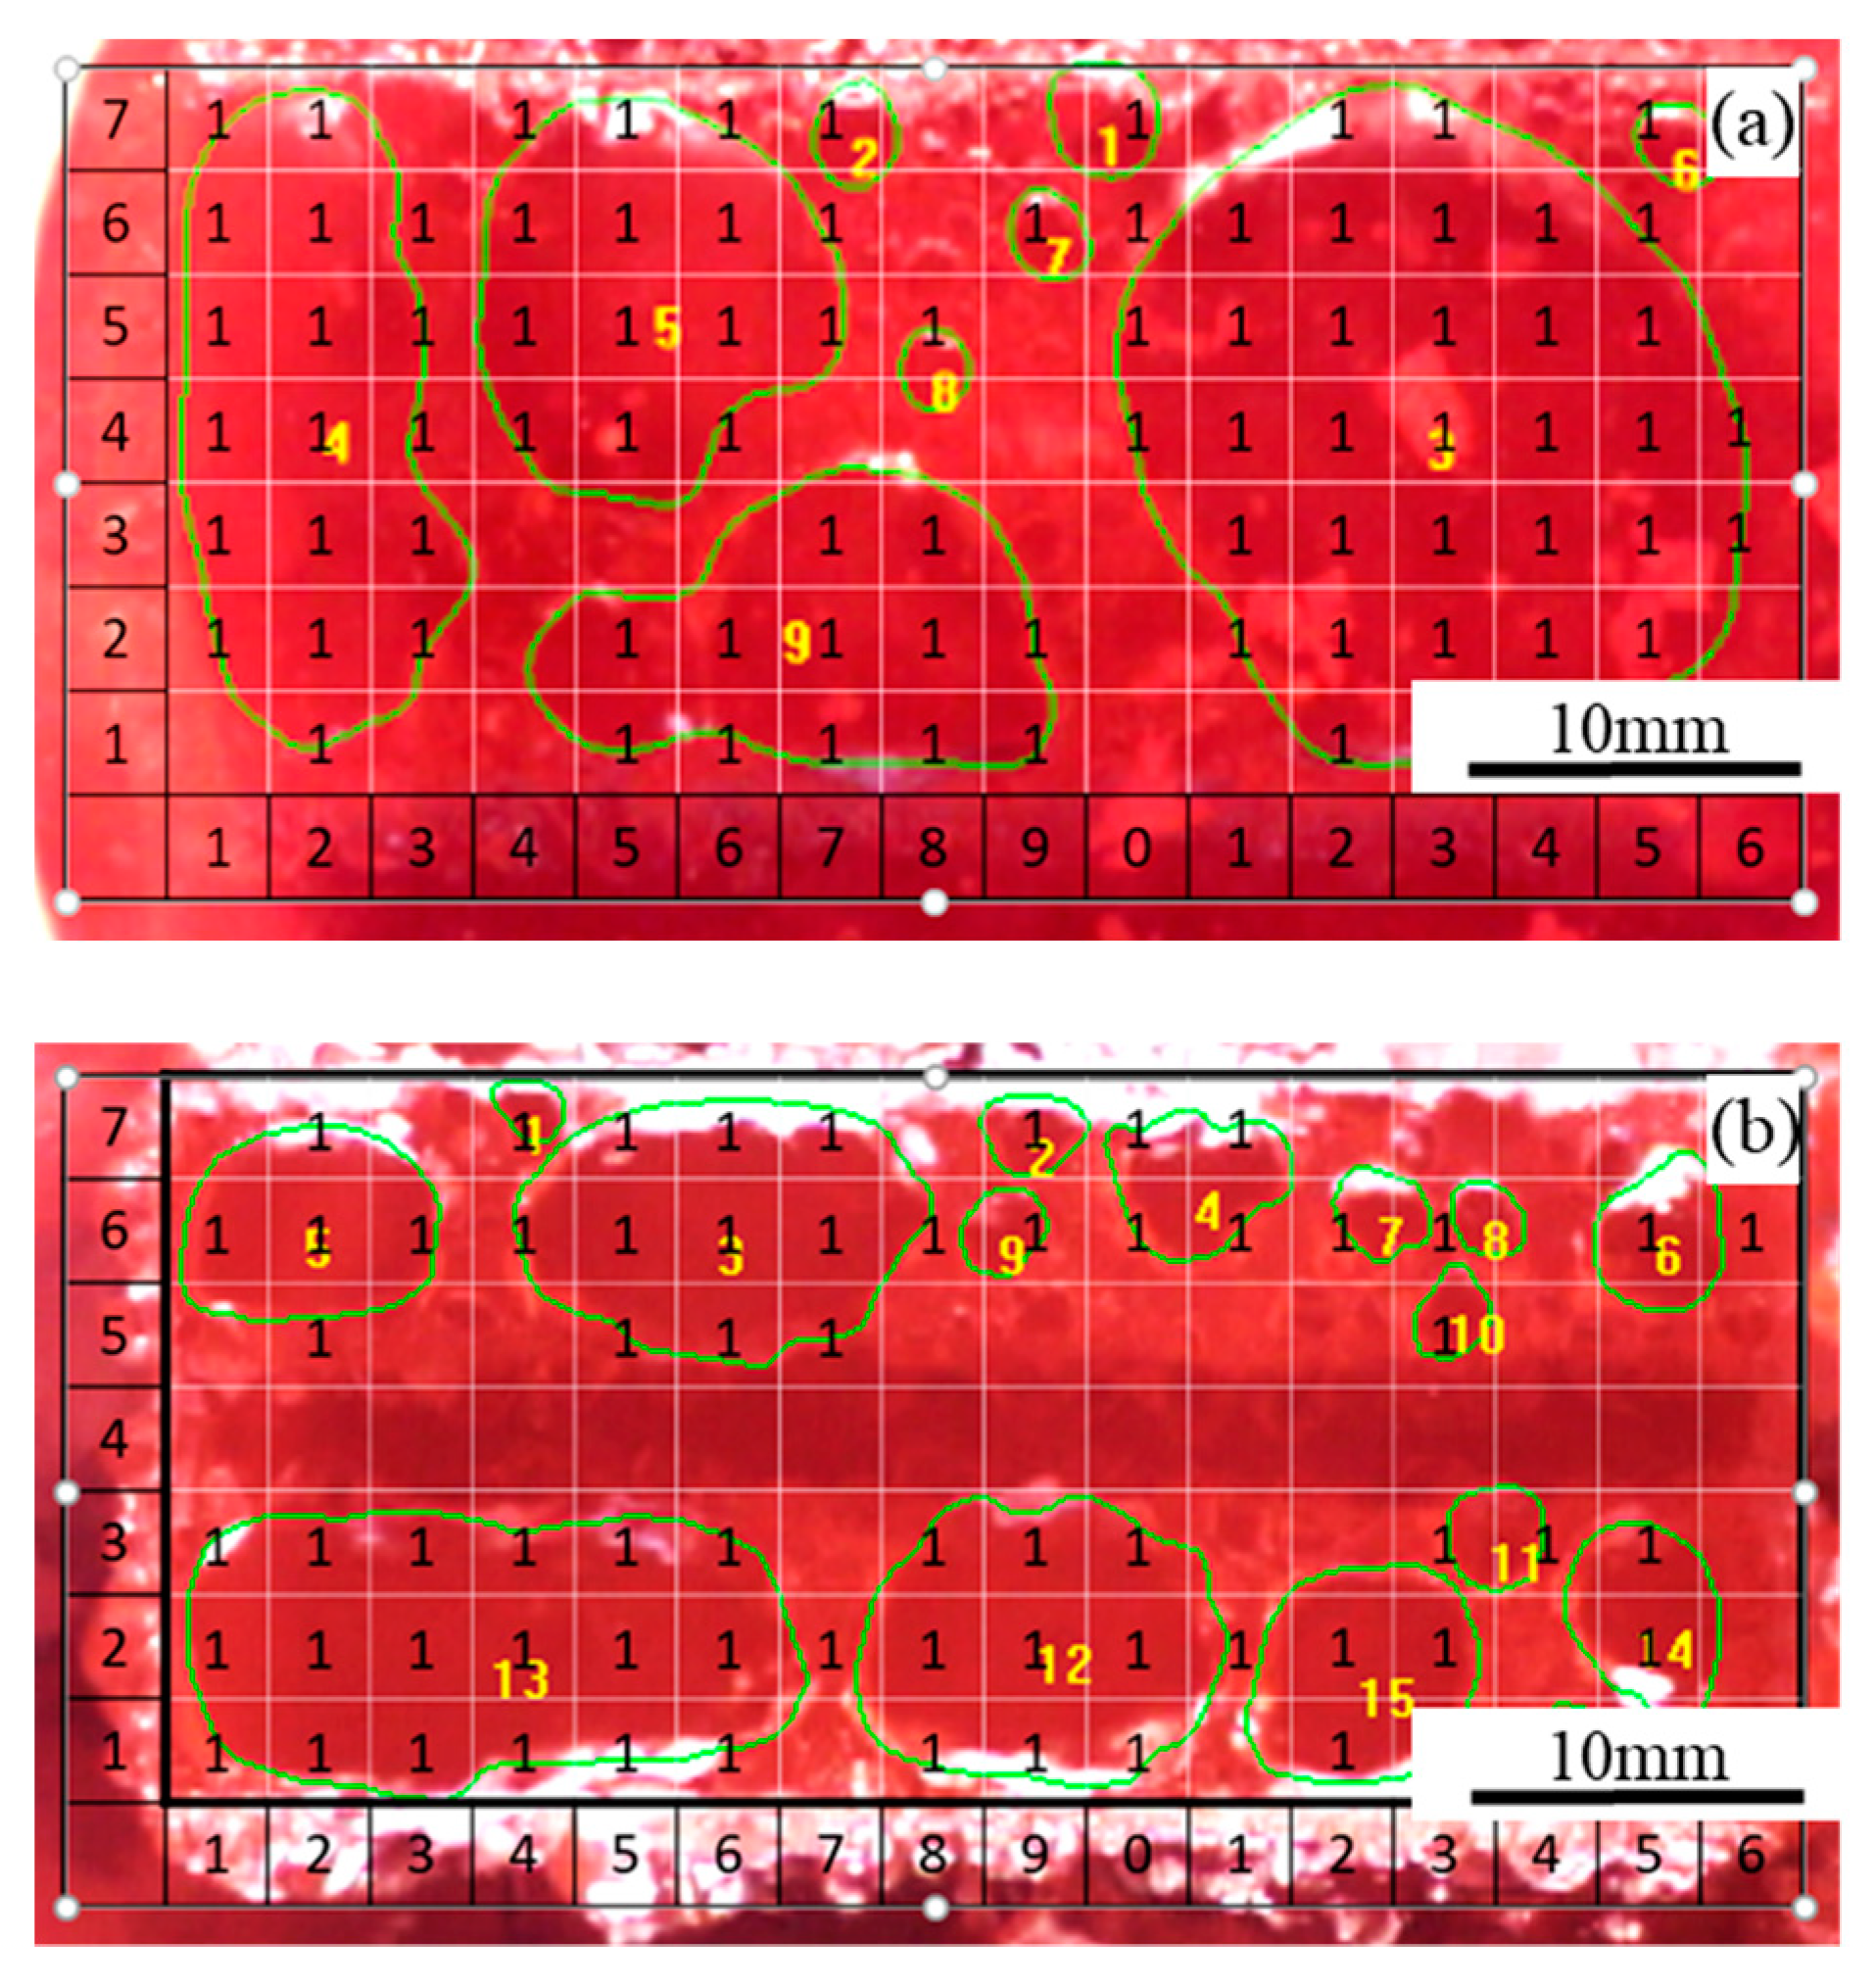
Two images obtained in Experiment 1 under the apparent current density of 0.9 A·cm−2, respectively, with the flat anode and slotted anode, are shown in Figure 2. For the experiments carried out under each condition, images were picked for every 0.5 s within the time period of 60 s. During the image processing, firstly, the image processing software found the boundary of the bubbles by its color. After the bubble boundaries were drawn, the surrounded area by the boundaries were defined as the ‘bubbles’. Each picked image was meshed into grids of approximately 3 mm × 3 mm; then, the image was overlapped with a data matrix with the same size. In each grid, when the bubble accounted for more than 1/3 area of the grid area, the corresponding matrix data were defined as ‘1′, or otherwise defined as ‘N/A’. Every bubble on the image was numbered and the area of each bubble was calculated. At the same time, each bubble on the image was numbered and its dimension/area was calculated with Image Pro-Plus software. Bubbles with the size of less than 1.5 mm in diameter were not counted.
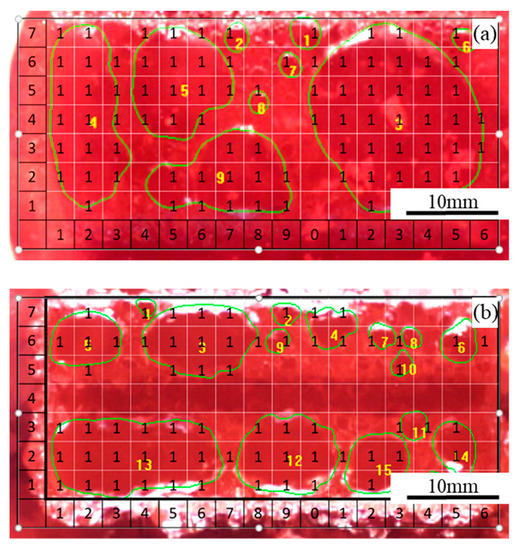
Figure 2.
Two images obtained during electrolysis on (a) flat anode and (b) slotted anode under apparent anode current density of 0.9 A·cm−2 in Experiment 1 (refer to Table 1).
Based on these raw data, statistical analysis could be conducted to investigate: (i) the bubble distribution principle could be derived by counting the occurrence frequency and coordinates of the bubbles in the grids; (ii) the variation of bubble characters with time and current density could be derived by counting the area of each bubble; (iii) the actual anode current density could be calculated by subtracting the area of the non-conducting bubble layer from the total anode area, as well as its variation trend with time and anode geometry.
2.4.2. Calculation of the Bubble Distribution Patterns on the Anode Surface
In each experiment, under each current density, within the time period of 60 s, the location information of the bubbles on 121 images was extracted and imported into 121 corresponding data matrixes which could be invoked by Matlab software. Under each experimental condition, based on the selected 121 images, the information of approximately 1000–1500 bubbles was collected and used in the statistical analysis.
The general bubble distribution pattern under each experimental condition was obtained by overlapping the bubble patterns on the 121 images that were collected from 60 s of electrolysis.
2.4.3. Calculation of the Bubble Size Distribution on the Anode Surface
Meanwhile, under each experimental condition, based on the selected 121 images that were collected within 60 s, every single bubble on the 121 pictures was numbered and its dimension information was collected and summarized. In this way, the size distribution of the bubbles within 60 s could be obtained.
2.4.4. Calculation of the Bubble Coverage and Actual Current Density on the Anode Surface
The non-conductive bubble layer blocked local current flow from the anode surface, which resulted in the fluctuation in actual anode current density. Within a period of 60 s of electrolysis, the variation of bubble coverage on the anode bottom surface with time could be derived from the total area of bubbles on each image.
The changes in bubble coverage with time resulted in the change of the actual current density on the anode since the electrolysis cell ran under constant current. The relationship between the actual current density and the bubble coverage are shown below:
where Jactual is the actual current density, Janode is the apparent current density, and Coverage refers to bubble coverage.
Jactual = Janode/(1-Coverage)
3. Results and Discussion
3.1. Bubble Distribution Pattern on the Anode—Experiment 1
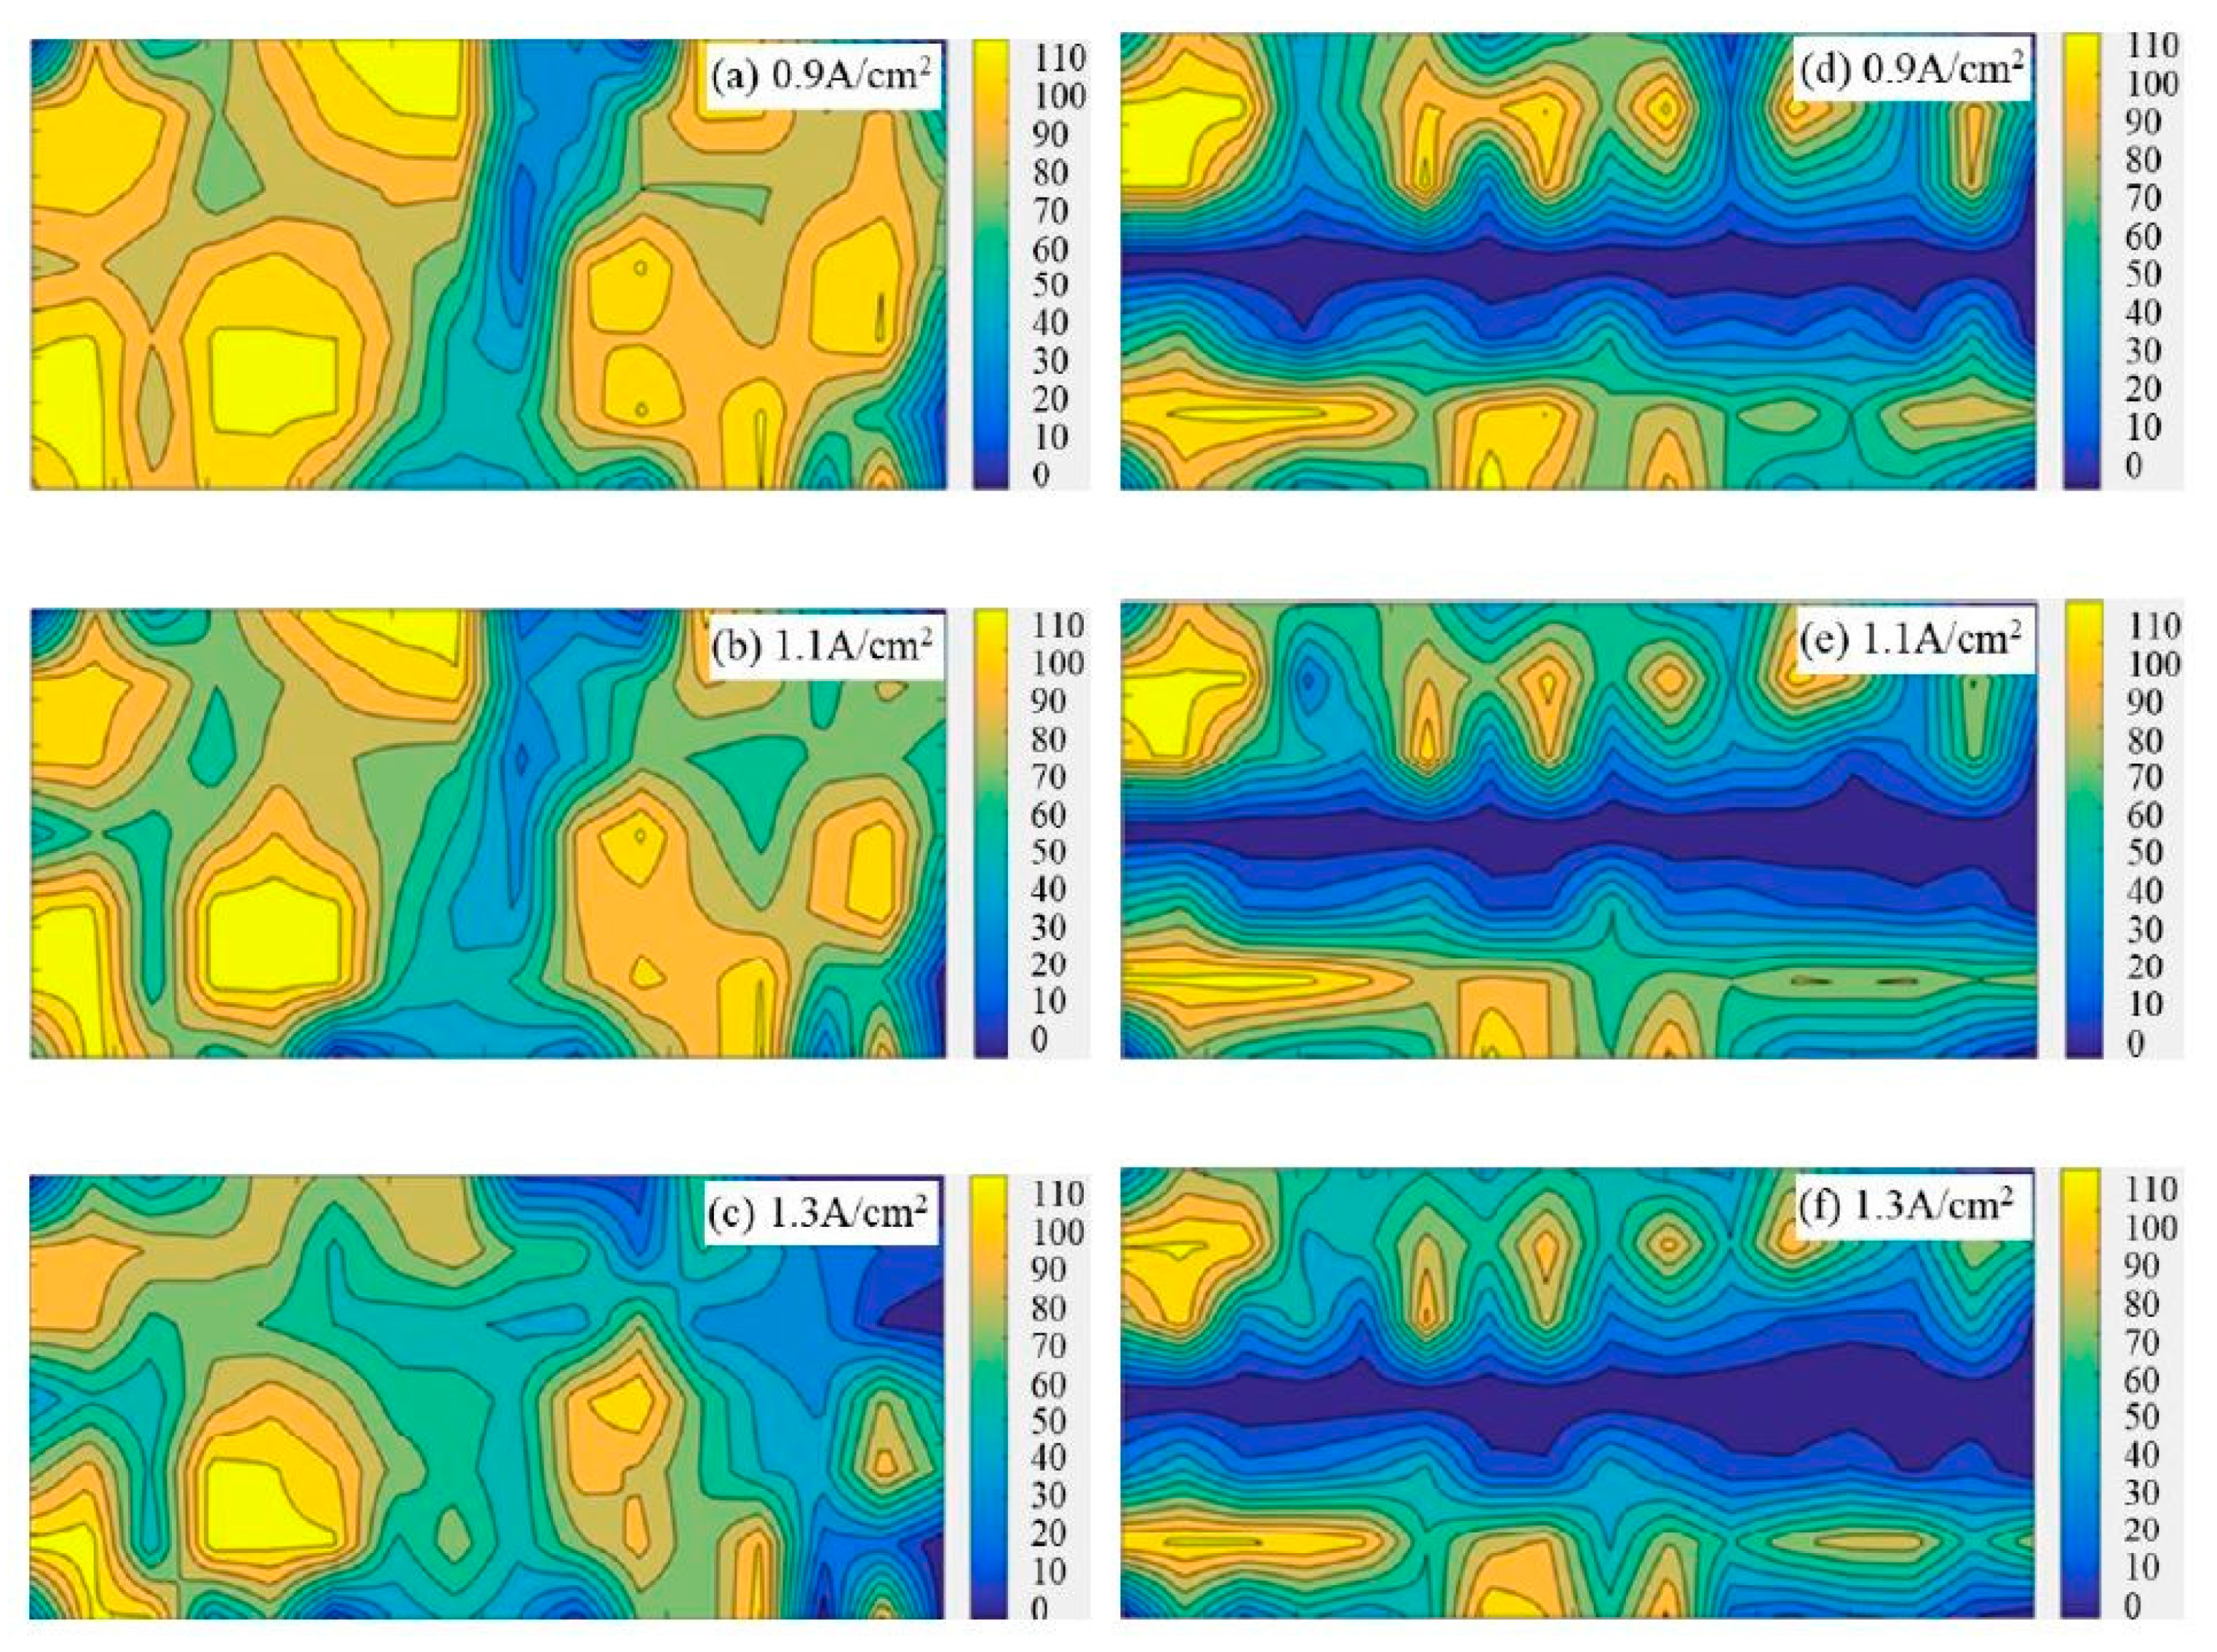
Figure 3 shows the bubble distribution patterns on the flat anode and slotted anode under different experimental conditions. The bright/yellow zones suggest that bubbles are more frequently observed in these areas. The gradient bars indicate the number of occurrences of bubbles on the specific anode surface in the 121 images within 60 s.
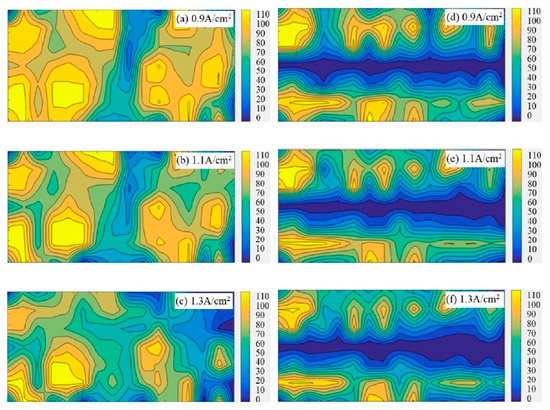
Figure 3.
Accumulated bubble distribution patterns on the 50 mm × 22 mm flat and slotted anodes from statistical analysis within 60 s; the gradient bars indicate the number of occurrence of bubbles on the specific anode surface in the 121 images within 60 s. (a) Apparent current density 0.9 A·cm−2, flat anode (b) 1.1 A·cm−2, flat anode (c) 1.3 A·cm−2, flat anode (d) 0.9 A·cm−2, slotted anode (e) 1.1 A·cm−2, slotted anode (f) 1.3 A·cm−2, slotted anode.
From Figure 3, it is found that the anode bubbles tend to coalesce and adhere to a certain region (marked as bright yellow in Figure 3) for both flat anodes and slotted anodes. It looks like some certain regions or points of the anode are the preferred site for bubble formation or accumulation. These bubble-concentrated areas, termed as ‘inactive regions’, shrink with the increase in the anode current density in both the flat anode and the slotted anode cases. The decrease in the ‘inactive area’ suggests the more uniform distribution of the current on the anode under higher current density.
Compared to the flat anode, the bubble distribution pattern shows the slotted anode has much smaller bubble-concentrated areas under all the investigated current densities. The existence of large areas of ‘inactive’ regions suggests the frequent appearance of large bubbles; thereby, it is proof that the slotted anode design has a faster gas releasing rate than the flat anode.
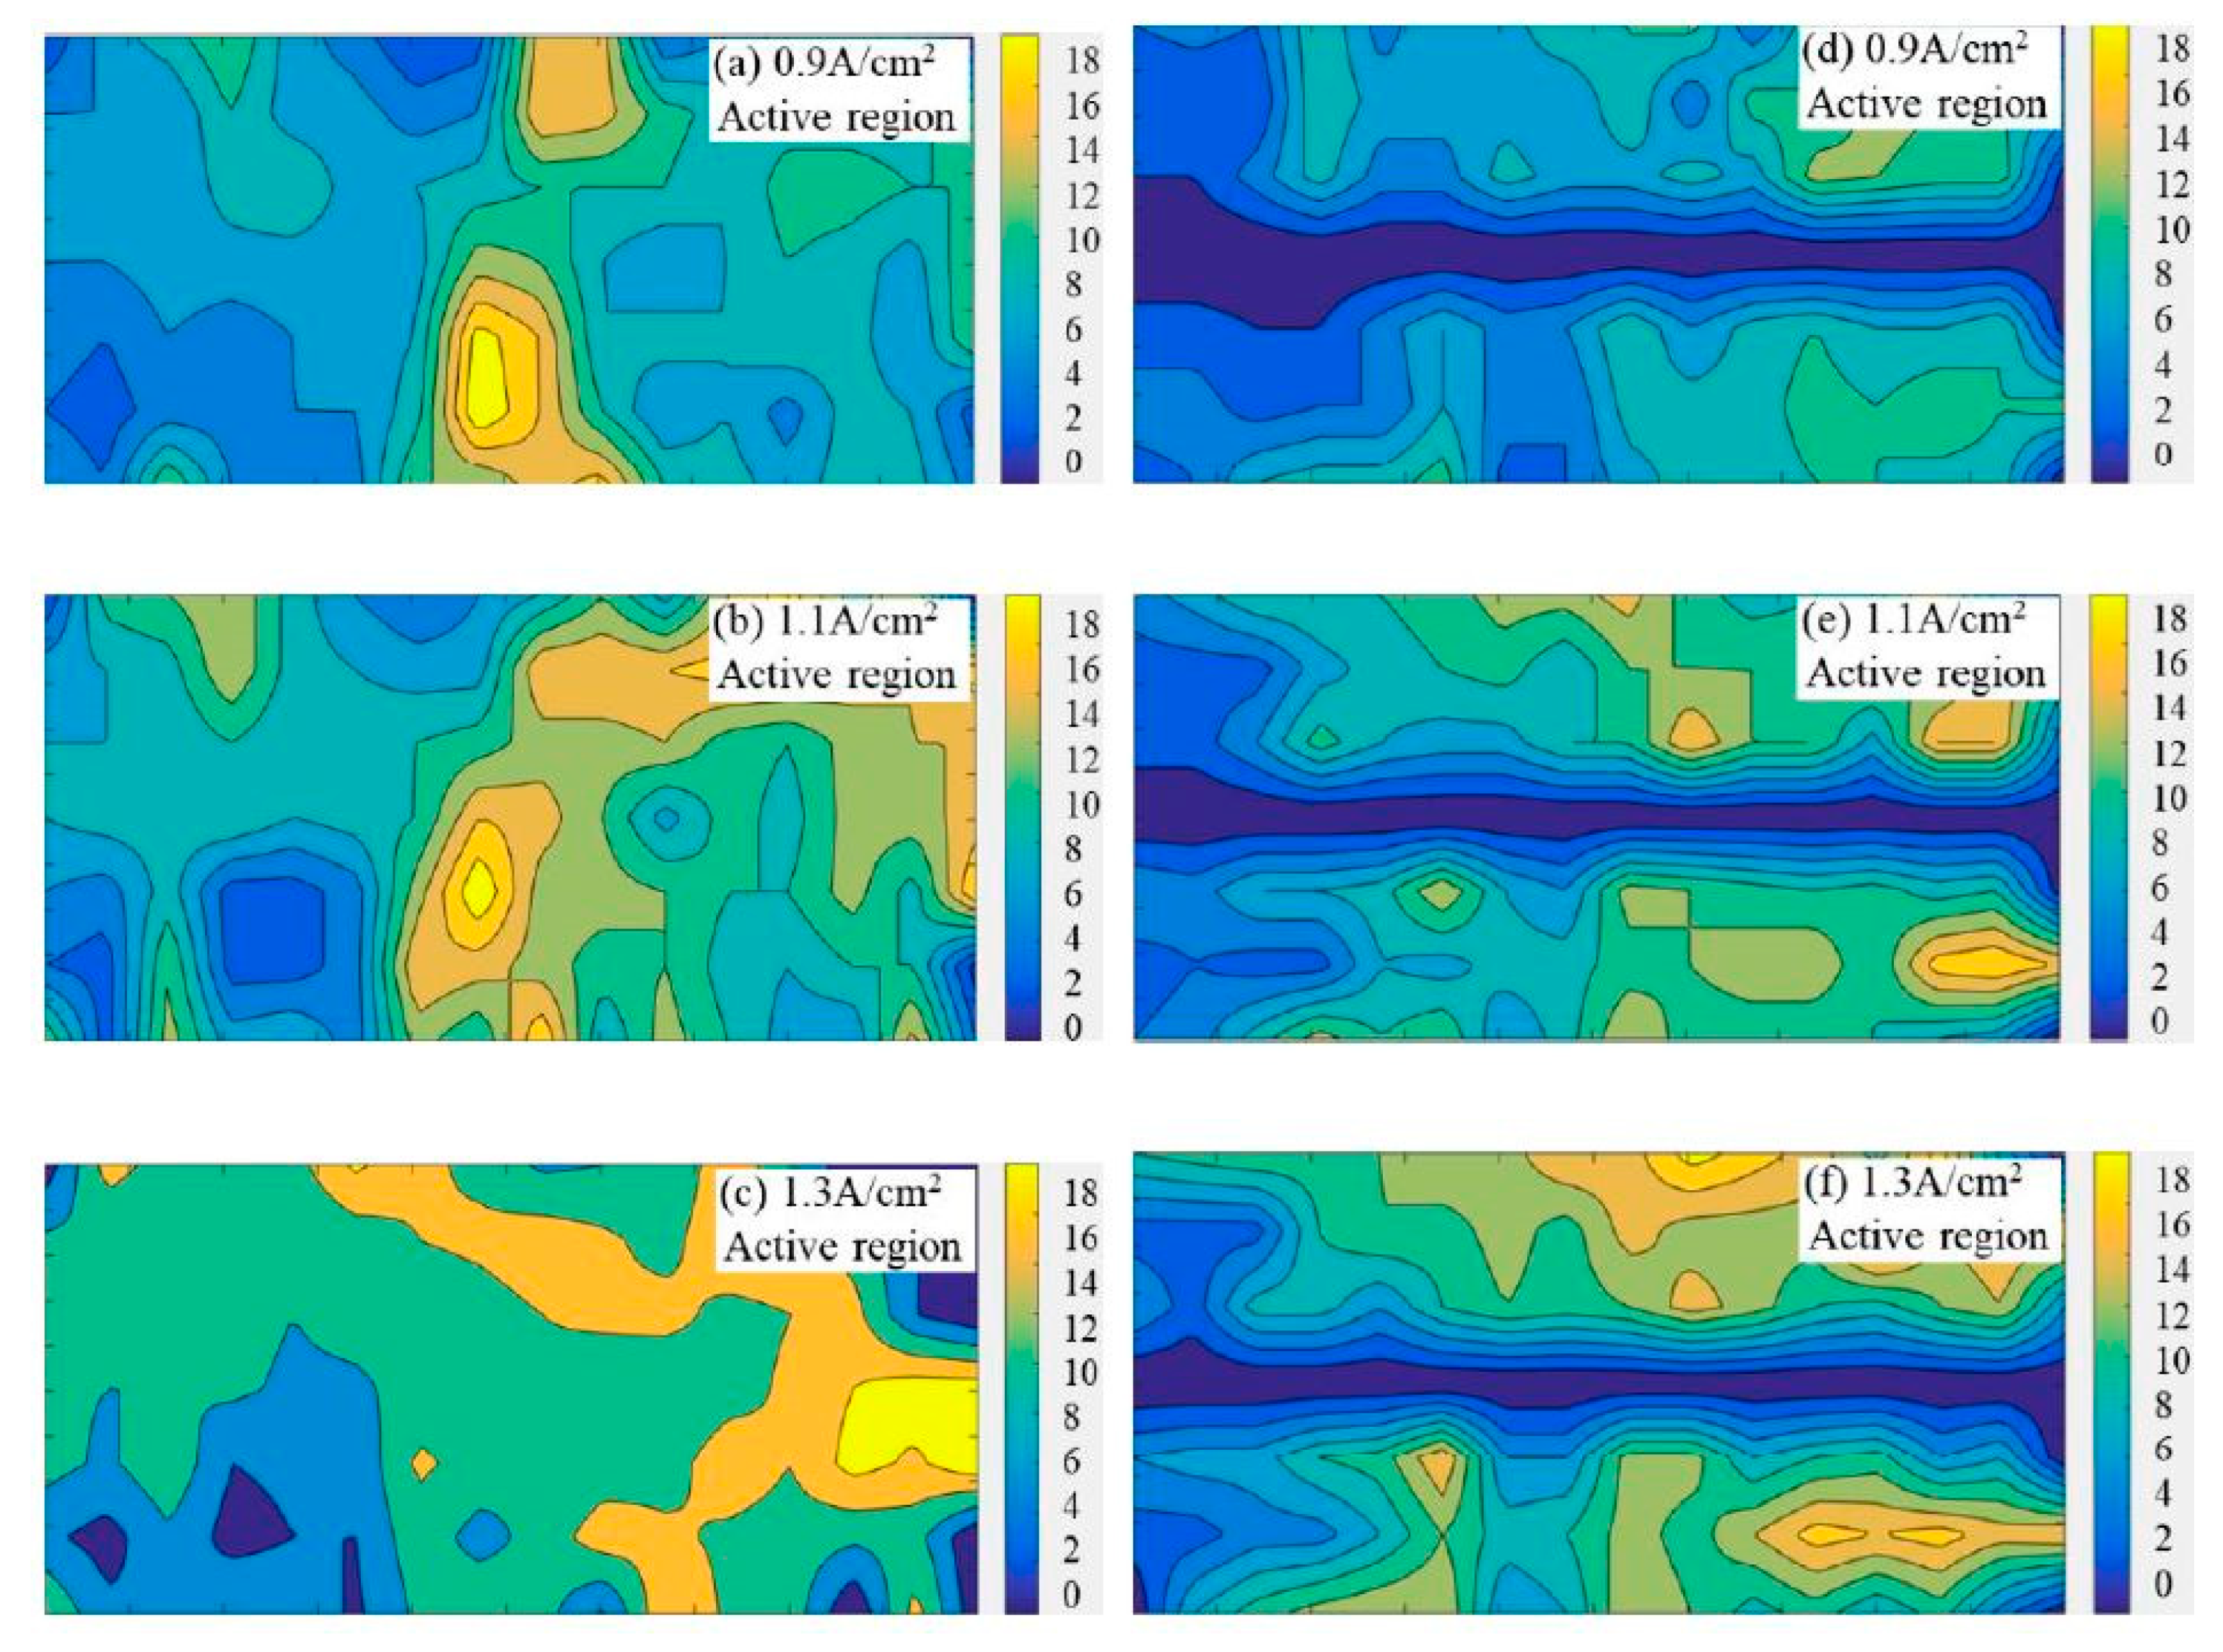
The generation rate of bubbles on the anode was calculated by counting the number of newly generated bubbles in each grid. The bubble generation patterns within 60 s on the flat anode and slotted anode are drawn in Figure 4. The bright/yellow zones suggest a faster generation rate of the bubble than the dark/blue zones. The gradient bars indicate the number of newly generated bubbles on the specific anode surface within 60 s.
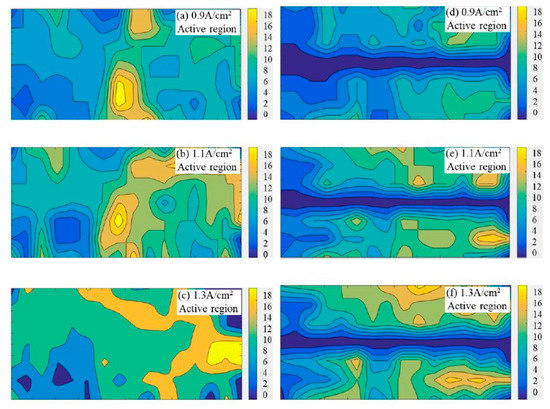
Figure 4.
The bubble generation patterns on the flat and slotted anodes from statistical analysis within 60 s, the gradient bars indicate the number of newly generated bubbles on the specific anode surface within 60 s. (a) Apparent current density 0.9 A·cm−2, flat anode (b) 1.1 A·cm−2, flat anode (c) 1.3 A·cm−2, flat anode (d) 0.9 A·cm−2, slotted anode (e) 1.1 A·cm−2, slotted anode (f) 1.3 A·cm−2, slotted anode.
From Figure 4, the regions marked as bright yellow display a higher generation rate of the bubble than the regions marked as dark blue. Since the anode gas is the product of the electrochemical reactions, a higher bubble generation rate corresponds to higher electrochemical activity at a certain area, or is termed as an ‘active region’, in contrast to the ‘inactive region’, as discussed in Figure 3. In Figure 4, with the increase in current density, the area of the ‘active region’ increased significantly in both the flat anode and the slot anode cases. When the apparent current density reached up to 1.3 A·cm−2, the locations of the active regions changed; this is evidence that the active regions on the anode can be substitutable during electrolysis. It indicates that the electroactive region of the carbon anode is not only related to the material structure, but is also affected by the electrode potential. However, this trend is not observed in the slotted anode cases, probably because the slotted anode has a faster gas release rate than the flat anode, indicating a more ordered bubble evolution pattern on the slotted anode.
It is worth mentioning that the active regions in Figure 4 are more likely to appear on the right-hand side of the anode; this is because the right hand side of the anode was close to the cathode due to the design of the double chamber quartz crucible. However, this influence could be minimized by comparison under the same experimental conditions.
It is as expected that the bubble generation pattern (in Figure 4) generally matches with the bubble distribution pattern (in Figure 3). The bubble concentrated areas in Figure 3 overlap with the areas with a low bubble generation rate in Figure 4. Additionally, the areas with few bubbles in Figure 3 respond to areas with a high bubble generation rate in Figure 4. It is easy to understand that the large bubbles could form a bubble layer covering some local areas on the anode surface, inhibiting effective contact between the anode and electrolyte. Therefore, these local areas showed low bubble generation rates, while for the ‘active regions’ on the anode surface, where high bubble generation rates are observed, the appearance of a large number of small bubbles can also be found at the same location in Figure 3.
It is inevitable that the anode surface behaves inhomogeneously in material properties since the carbon anode consists of carbon particles and binder, for both the graphite anode and industrial prebaked anode. As is illustrated in the bubble patterns (Figure 3), the ‘active regions’ on the anode are not uniformly distributed as well (Figure 4). Anyway, the location of the ‘active regions’ are probably to change in the long term with the consumption of the anode. However, significant variation was not observed within 60 s under the apparent current density of 0.9–1.3 A·cm−2 in this investigation.
The bubble evolution behavior on several carbon materials has been reported in other investigations [18,19,20]. Combined research should be carried out in the future to understand the relationship between the bubble behavior and the material properties, with the aim of improving the performance of industrial anode.
In the commercial aluminum reduction cell, the carbon anode behaves as self-adaptive to the change of anode cathode distance (ACD) during electrolysis. In commercial cells, the ACD is maintained at a relative constant of 3–5 cm. With the consumption of carbon material at the ‘active regions’, the ‘active regions’ appear as concave shapes on the surface; consequently, the ‘less active regions’ protrude from the surface. Due to the change in the local ACD, the convex regions gain extra over potential and are activated to take a larger proportion of current than they used to [21].
3.2. Bubble Size Distribution on the Anode—Experiment 1
Figure 5 shows the size distribution of the bubbles on the anode under different apparent current densities and anode geometries.
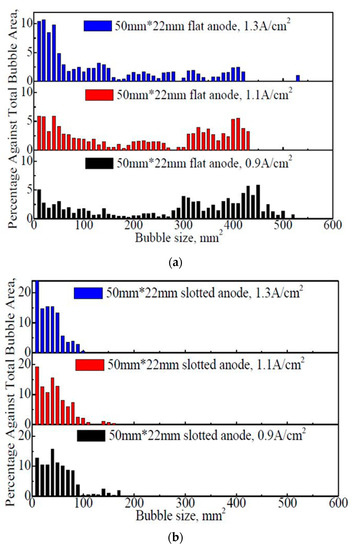
Figure 5.
The size distribution of the bubbles on the flat and slotted anodes within 60 s. (a) 50 mm × 22 mm flat anode (b) 50 mm × 22 mm slotted anode.
From Figure 5, for both 50 mm × 22 mm flat and slotted anodes, the general bubble size showed an overall decreasing trend with the increase in the apparent current density. The proportion of the large bubbles decreased, while the percentage of small bubbles increased significantly. For example, in Figure 5a, the dimensions of the bubbles are mostly distributed in the range of 0–500 mm2, and the average bubble sizes at apparent current density of 0.9 A·cm−2, 1.1 A·cm−2, and 1.3 A·cm−2 are 324 mm2, 223 mm2, and 73 mm2, respectively. The existence of large bubbles is obvious, and the proportions of large bubbles (a bubble covering more than 1/3 of the anode surface) are 40.8%, 23.1%, and 10.4%, respectively, at 0.9 A·cm−2, 1.1 A·cm−2, and 1.3 A·cm−2.
In Figure 5b, most of the bubbles are less than 170 mm2, which is different from the case with the 50 mm × 22 mm flat anode (Figure 5a). It is apparent that the anode slot can reduce the bubble dimension. As a contrast, the average bubble sizes at 0.9 A·cm−2, 1.1 A·cm−2, and 1.3 A·cm−2 are 40 mm2, 34 mm2, and 26 mm2, respectively. No bubble is found over the size of 1/3 anode bottom surface. Additionally, with the increase in the apparent current density, the proportion of the small bubbles increase significantly.
3.3. Bubble Coverage and Actual/Effective Current Density on the Anode—Experiment 1
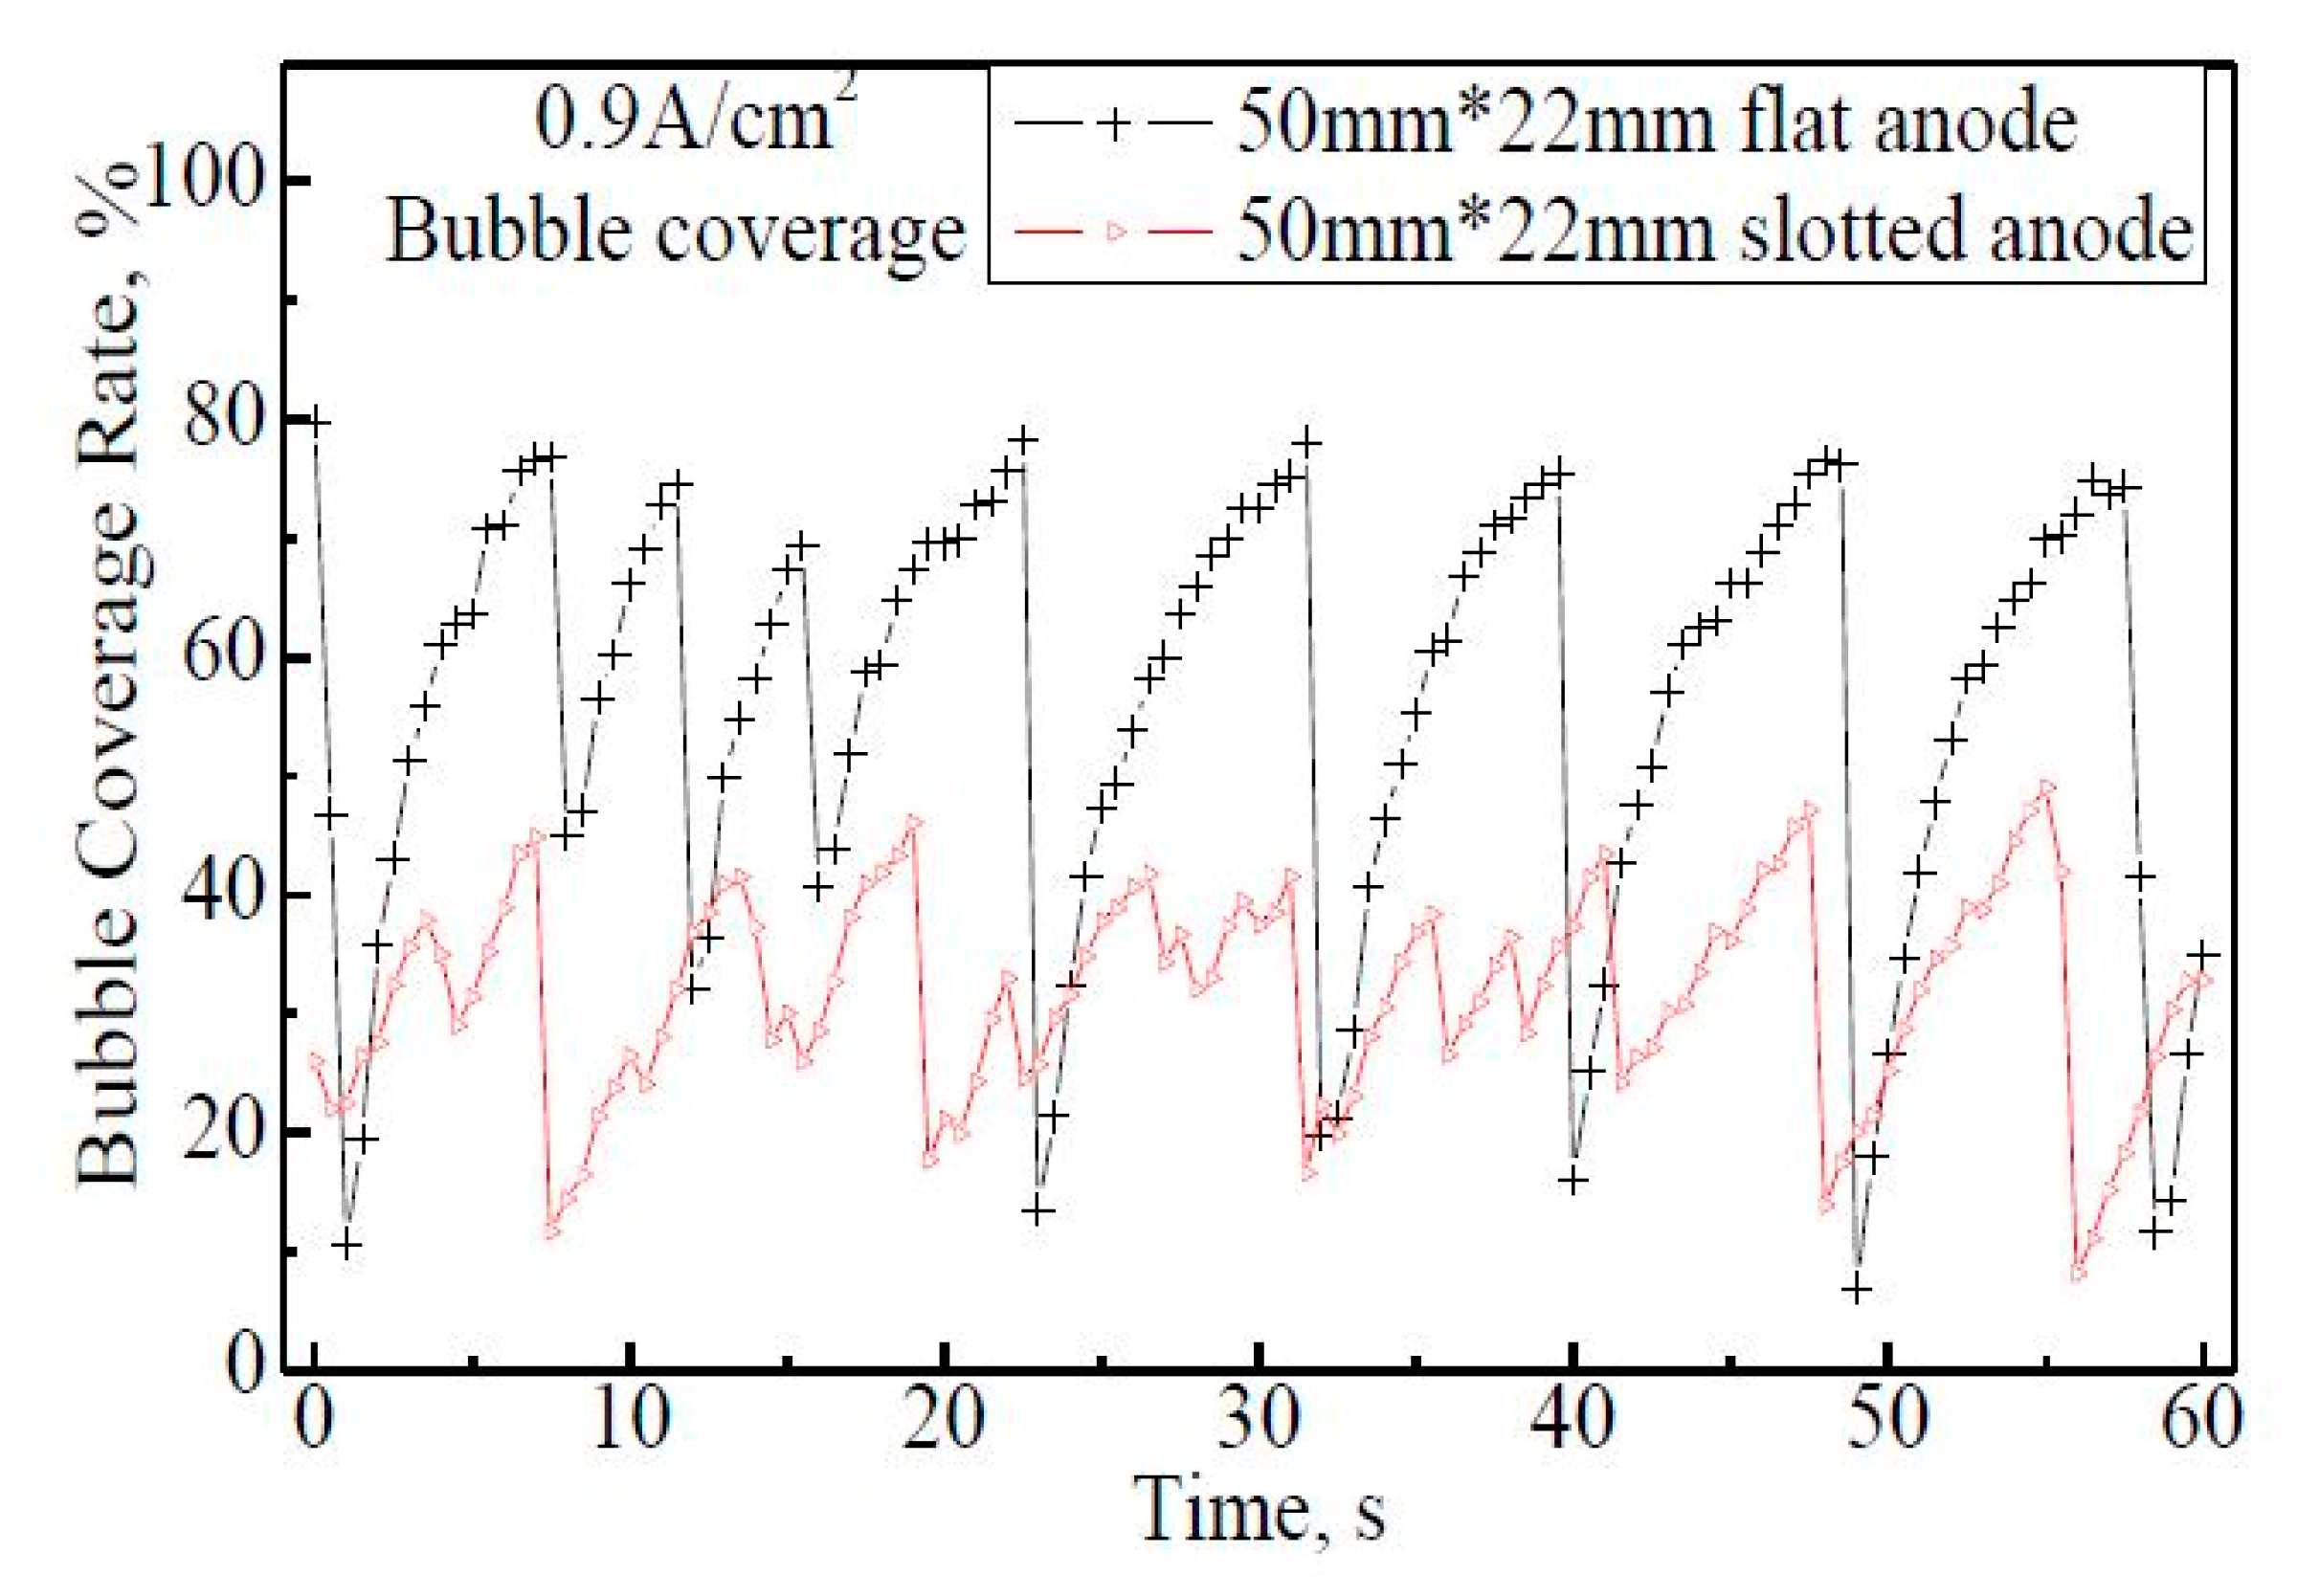
Figure 6 shows the fluctuations of the bubble coverage rate on the 50 mm × 22 mm anodes within 60 s. From the bubble coverage curve of 50 mm × 22 mm flat anode, eight release cycles are observed. The coverage rate varies from 7% to 78% regularly, and the average coverage within 60 s is 56%. For the 50 mm × 22 mm slotted anode case, 13 bubble release cycles can be distinguished although the cycle curve; is not as obvious as that on the flat anode, which indicates that bubbles get released more frequently than on the flat anode. By slotting on the anode, the coverage rate is greatly reduced to 8−49%, with the maximum coverage of 32−49%, much lower than the 70−78% rate on the flat anode. The average coverage within 60 s is 32%.
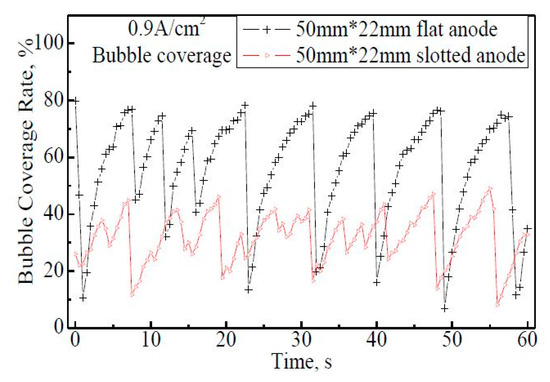
Figure 6.
The bubble coverage rate on the 50 mm × 22 mm flat and slotted anodes within 60 s, apparent anode current density 0.9 A·cm−2.
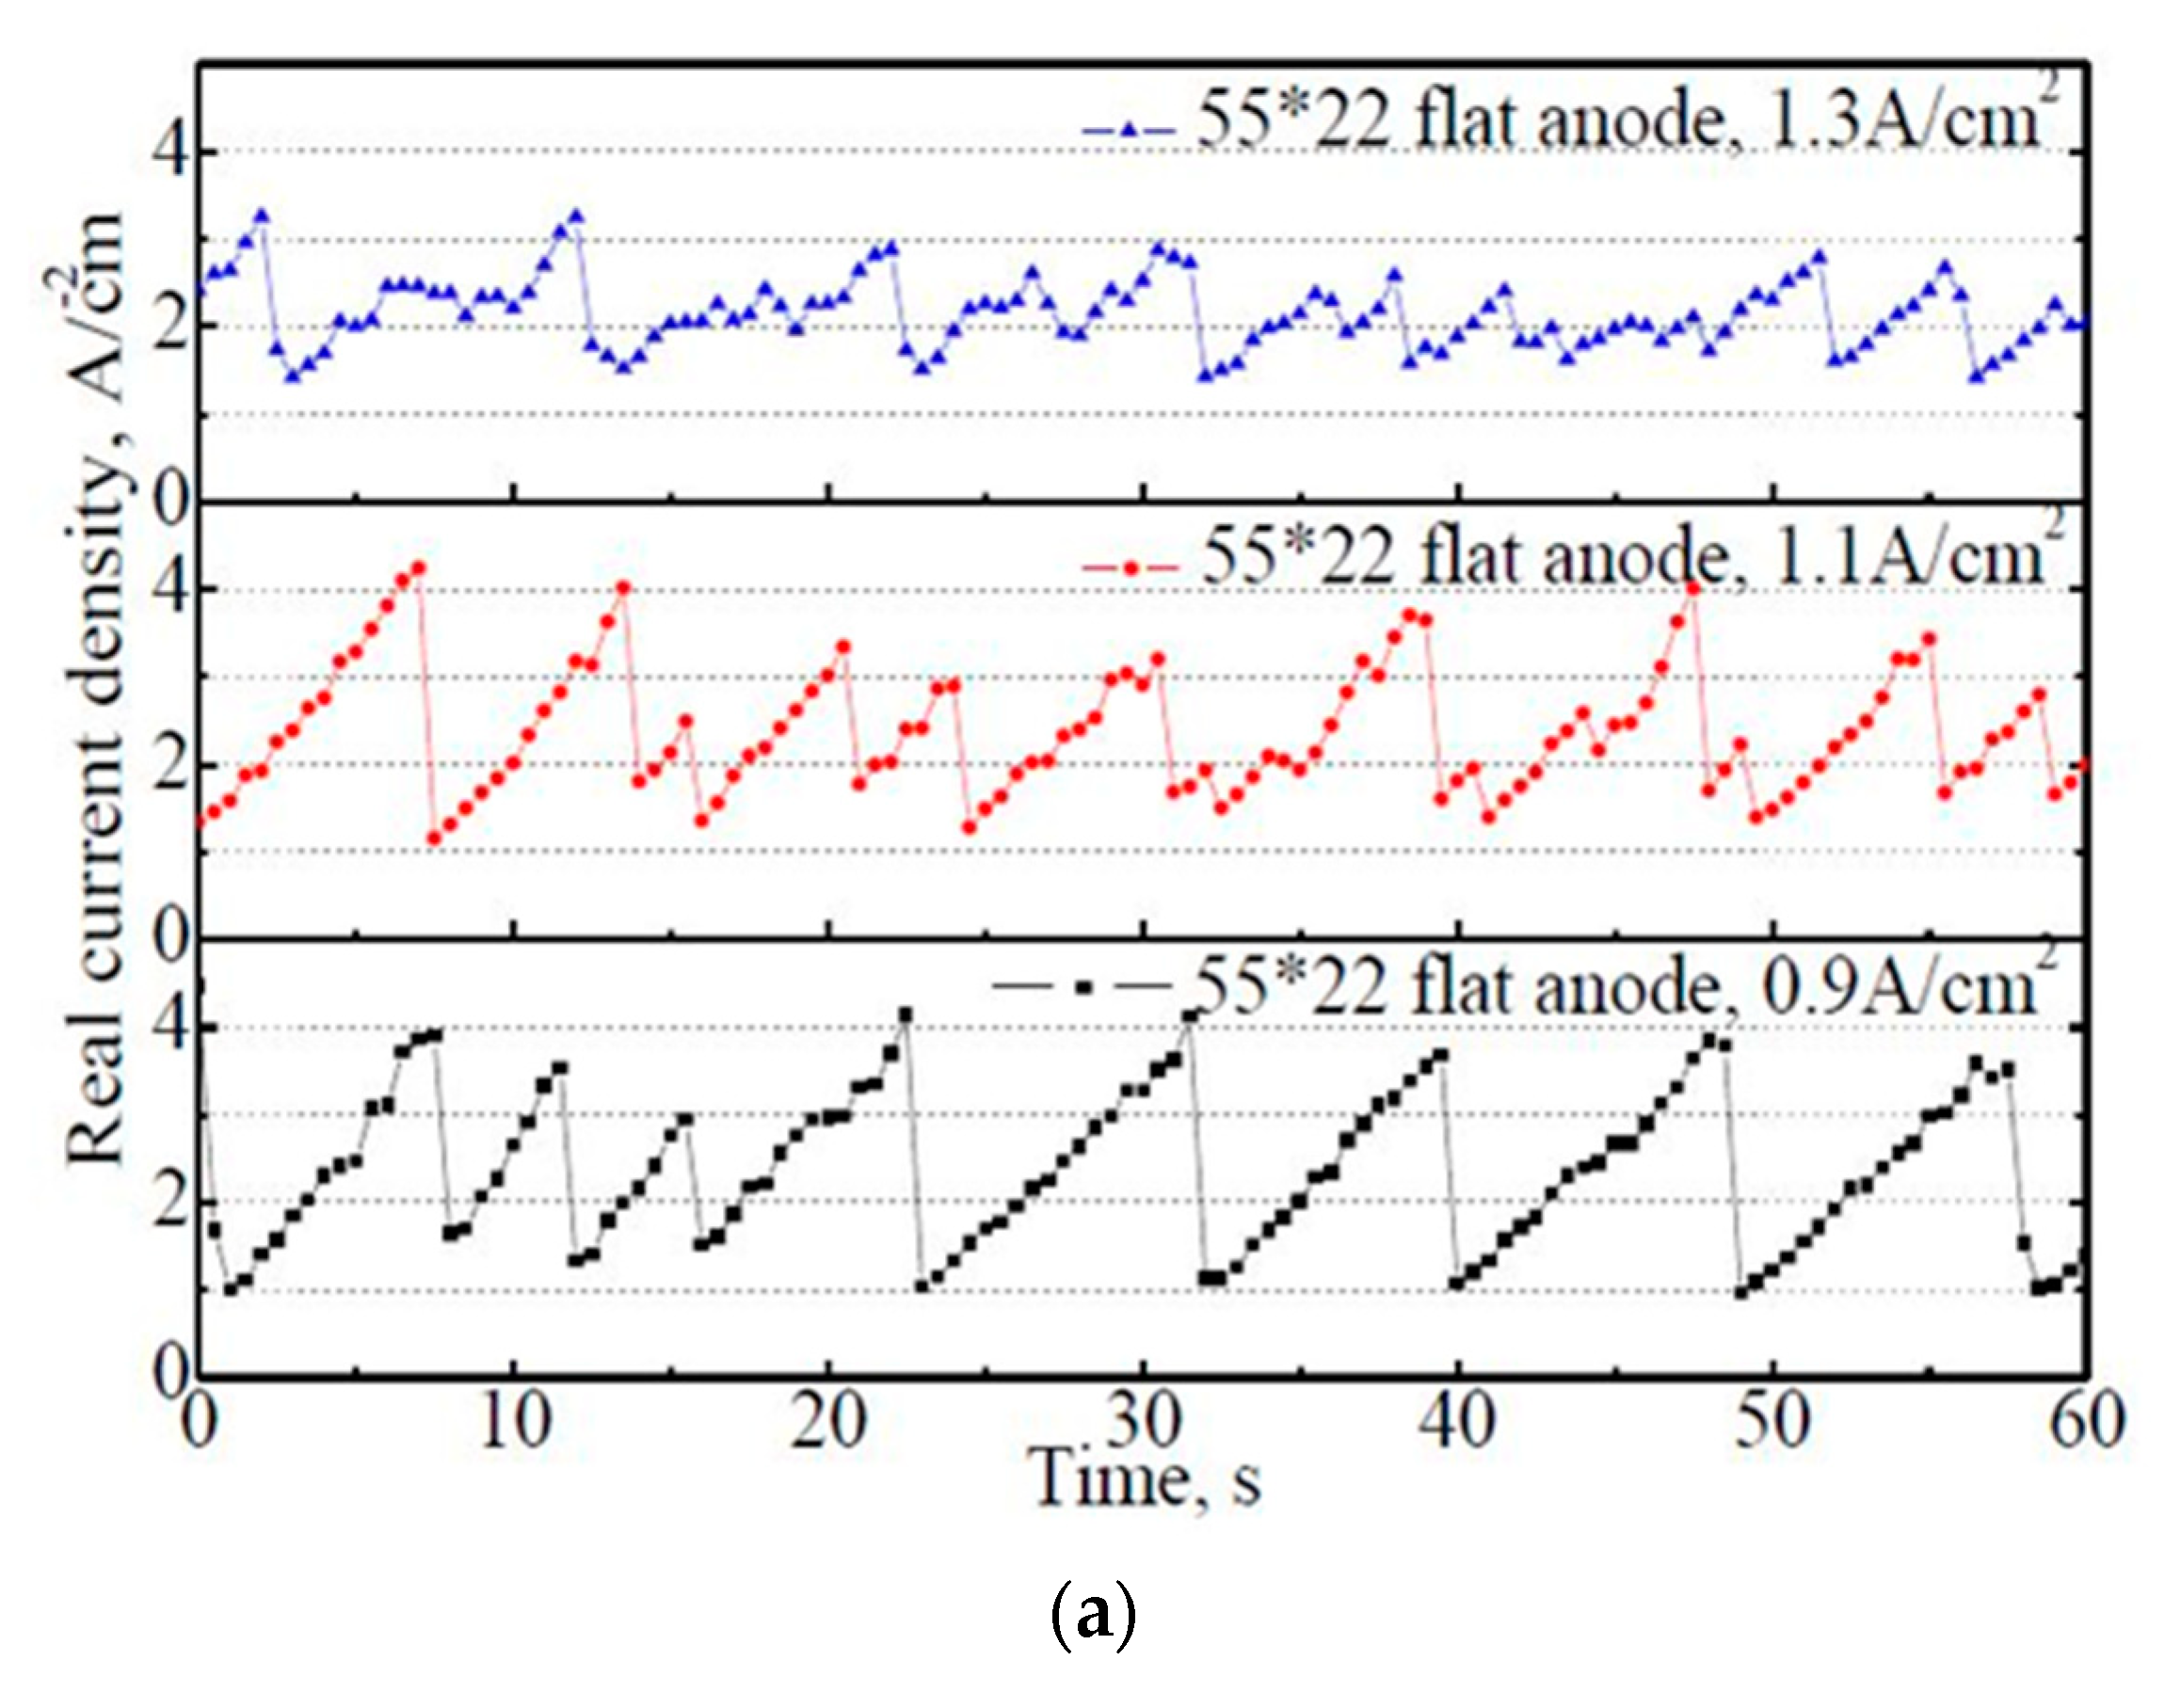
The changes in the bubble coverage would result in the change of the actual current density on the anode. The variation of the actual current density on 50 mm × 22 mm anodes with time are drawn in Figure 7.
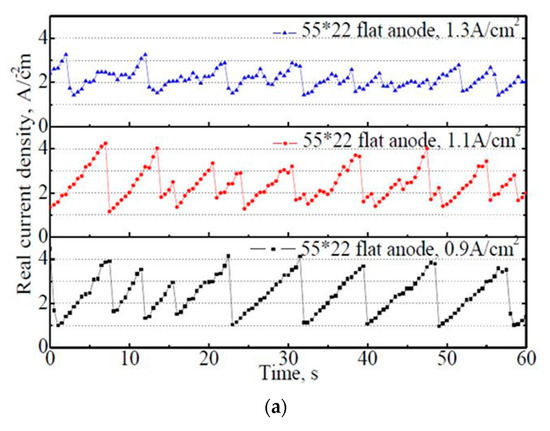
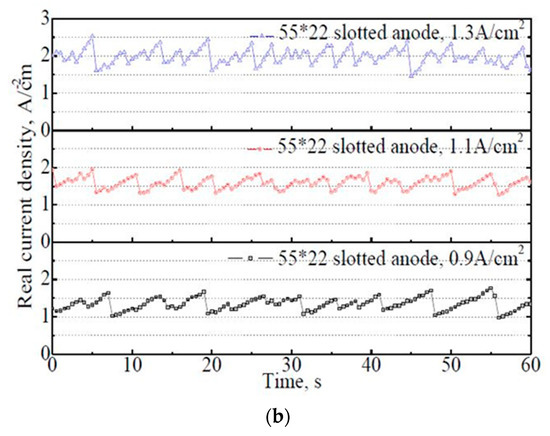
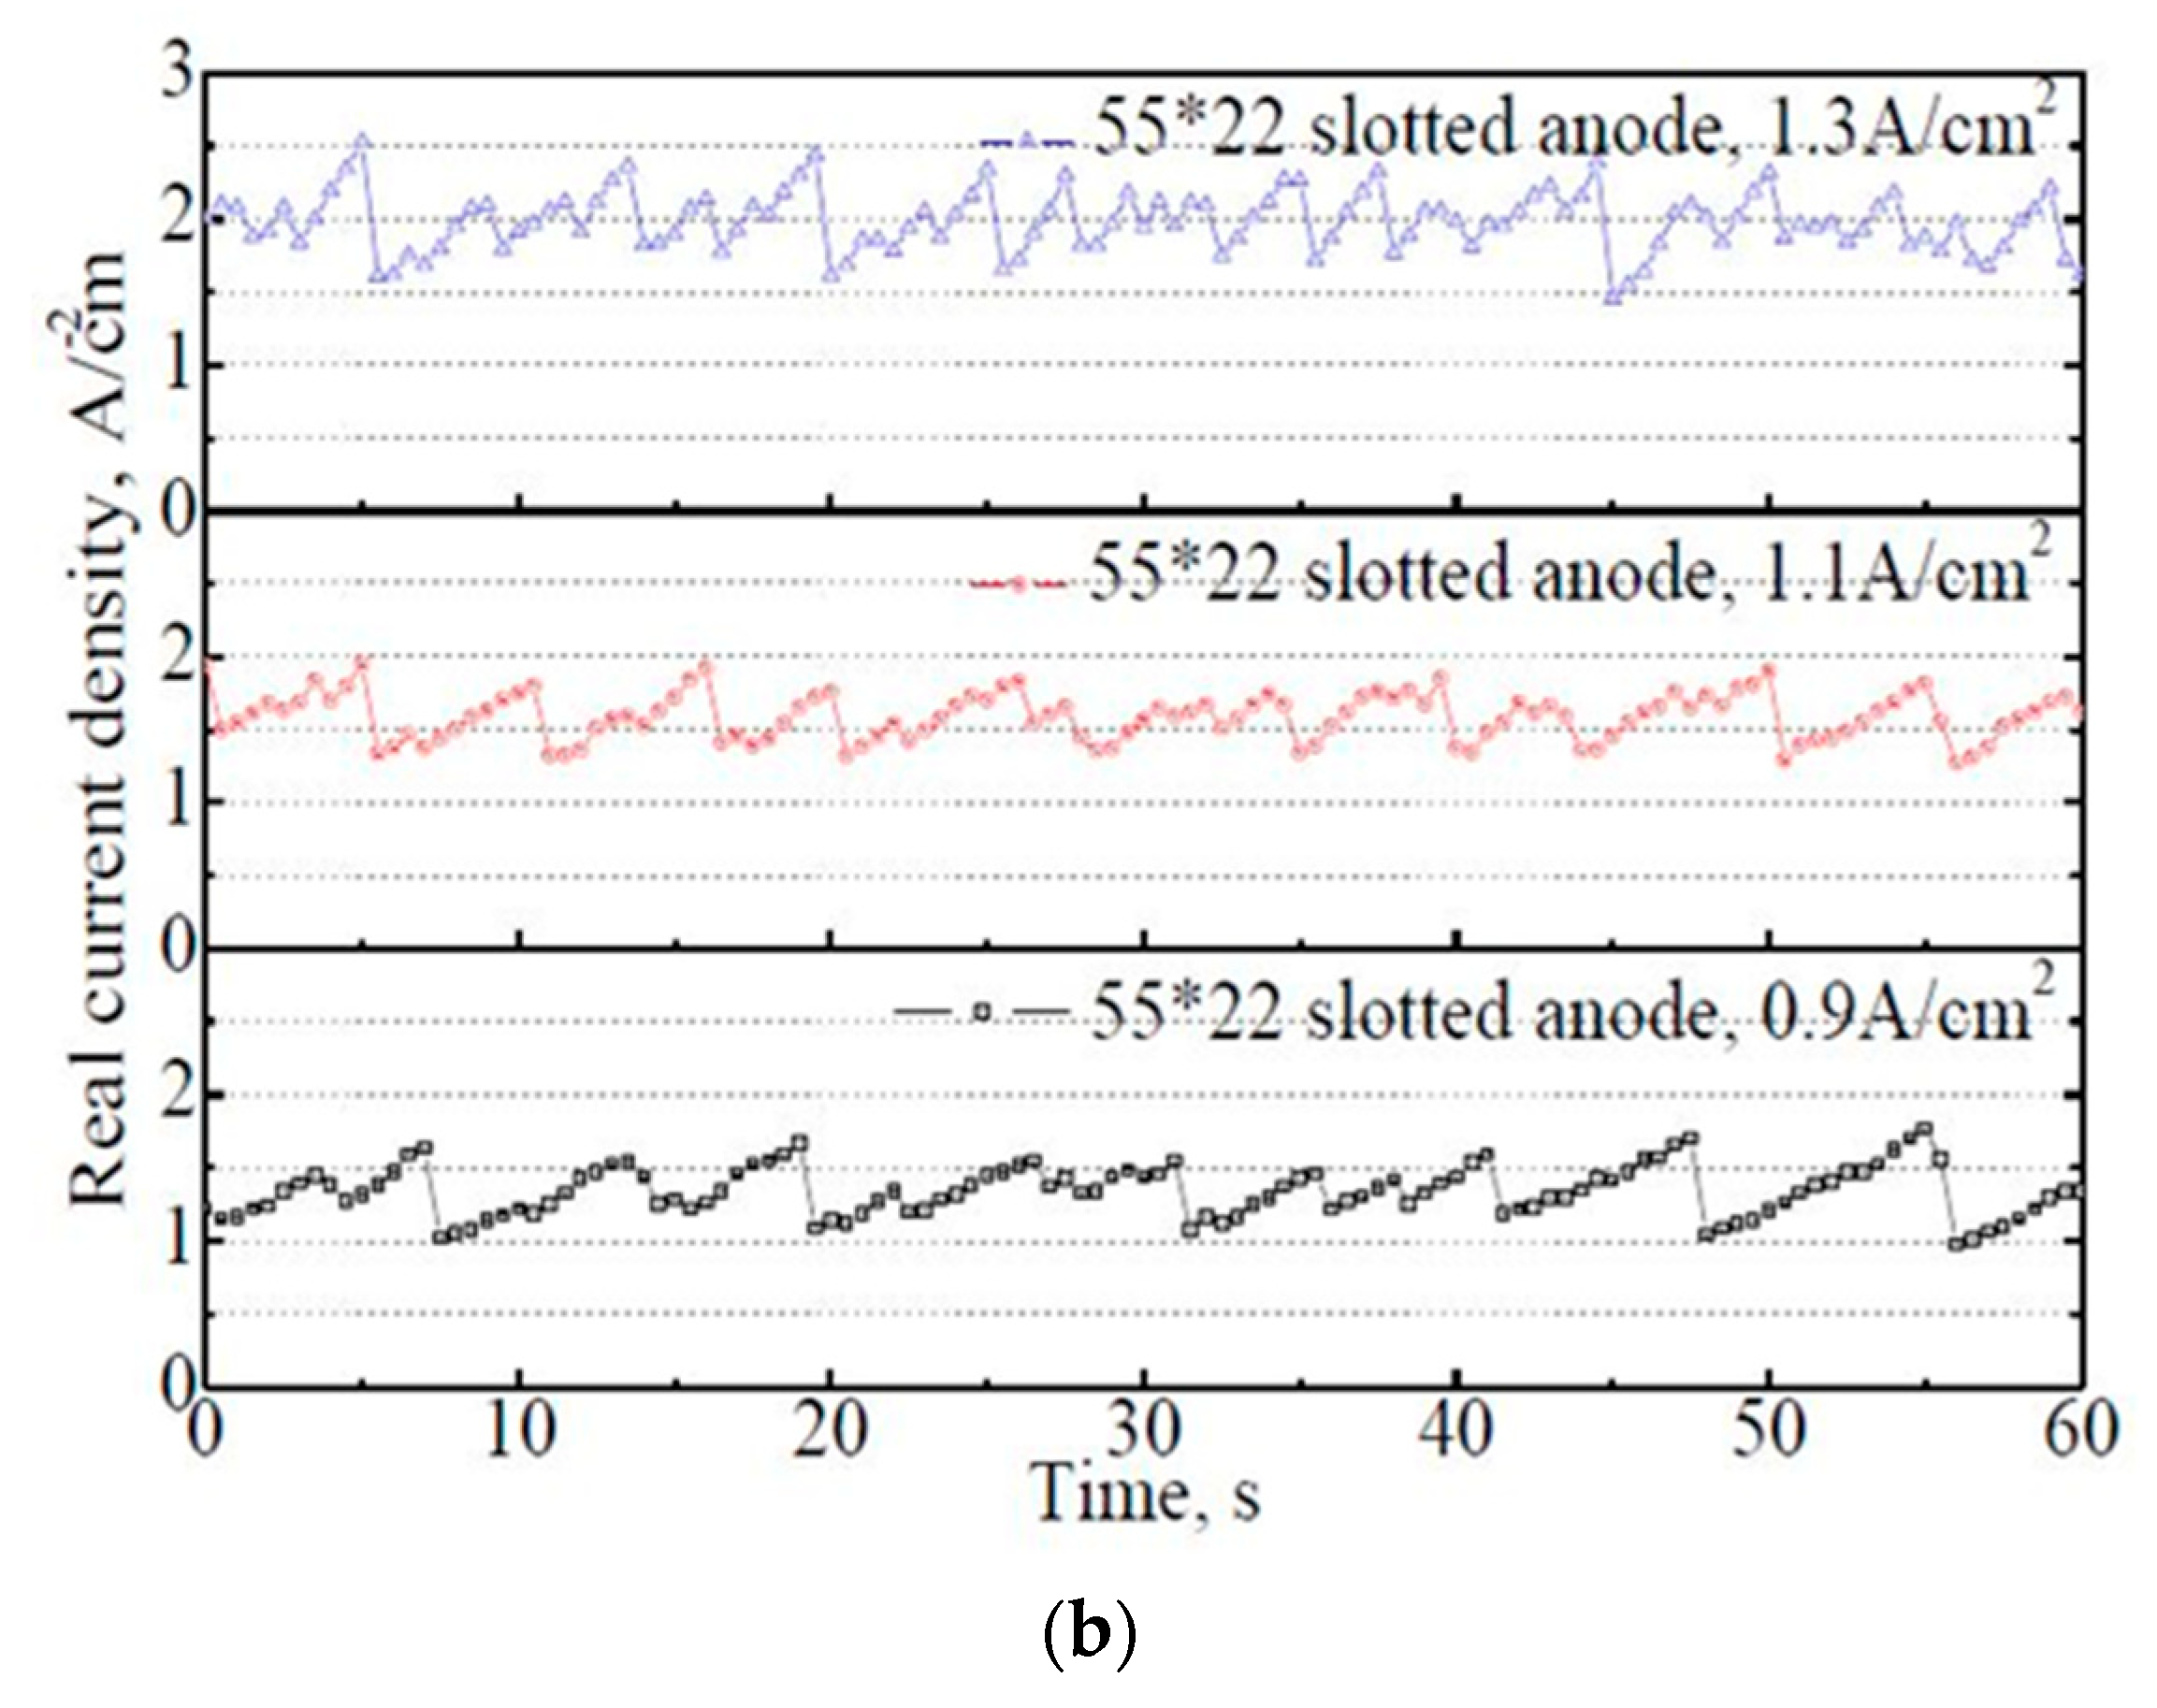
Figure 7.
The variation of actual current density on the 50 mm × 22 mm flat and slotted anodes within 60 s. (a) 50 mm × 22 mm flat anode, (b) 50 mm × 22 mm slotted anode.
From Figure 7a, it is found that the actual current density exhibits regular fluctuations with time, which corresponds to the bubble evolution process on the anode. Under the apparent anode current density of 0.9 A·cm−2, the actual current density varied regularly between 1.0–4.1 A·cm−2. With the increase in the apparent current density from 0.9 A·cm−2 to 1.3 A·cm−2, the variation amplitude of the actual current density decreased significantly. However, the variation frequencies increased subsequently, indicating a faster bubble evolution rate under a higher apparent current density. Consequently, the average actual current density within 60 s decreased slightly with the increase in the apparent current density, with 2.38 A·cm−2, 2.35 A·cm−2, and 2.14 A·cm−2 under the apparent current density of 0.9 A·cm−2, 1.1 A·cm−2, and 1.3 A·cm−2, respectively.
From Figure 7b, a similar principle was observed on the 50 mm × 22 mm slotted anode. The bubble evolution rate, or in other words, the variation frequency of the actual current density, increased significantly with increasing apparent current density. With the slotted anode, under the apparent current density of 0.9 A·cm−2, the actual current density dropped to 1.0–1.8 A·cm−2. The average actual current density within 60 s was 1.34 A·cm−2. The significant decrease in the actual current density demonstrated the effects of the anode slot. In industrial practice, a low actual current density would be very friendly to the prebaked anode carbon material (specifically the working condition of carbon in an industrial aluminum electrolysis cell) during electrolysis [8,20].
The fluctuation ranges of the actual current density on the slotted anode showed no obvious change with the apparent current density. However, the average actual current density increased slightly with increasing apparent current density, with 1.34 A·cm−2, 1.58 A·cm−2, and 1.98 A·cm−2 under the apparent current density of 0.9 A·cm−2, 1.1 A·cm−2, and 1.3 A·cm−2, respectively. The actual current density on the anode is probably influenced by the relative sizes between the anode and bubbles. For the slotted anode in this investigation, the maximum bubble diameter was limited to 9 mm due to the shape of the anode bottom surface. Once the bubble touches the edge of the anode or slots, it gets released immediately. Obviously, the bubble evolution is not the limiting factor of the electrolysis process for the investigated slotted anode. Therefore, with the increase in the input current, more bubbles are generated and then released frequently, showing an overall increase trend in the actual current density.
3.4. Comparison of Bubble Evolution Behavior on 11 cm2 and 50 cm2 Anodes—Experiment 2
For the small anode previously tested in Experiment 1, the bottom surface area of the anode was as small as 11 cm2; thereby the generated bubbles have very small area to grow and coalesce before they get released. As a consequence, the anode performance, including the bubble layer coverage, actual current density on the anode, and subsequently the cell voltage fluctuation, is greatly dependent on the evolution of a single or several large bubbles, as discussed previously in Figure 6 and Figure 7.
In this part, a larger anode with bottom surface area of 50 cm2 was tested. On this anode, there was enough space for more bubbles to evolve independently at the same time, which is closer to a realistic industry situation. Actually, the influence of the bubbles on the electrolysis process should be the combined effects of many bubbles rather than a single or several bubbles. So, Experiment 2 could give a better perspective and understanding to the ‘group effect’ of bubbles evolution, and a more complex and stable operating condition of the anode could be expected.
Figure 8 shows the bubble size distribution on the 100 mm × 50 mm flat anode within 60 s. It is found that a large portion of bubbles are concentrated in the range of 0–200 mm2 although the bubble size is distributed in a very wide range. With the increase in the apparent current density from 0.9 A·cm−2 to 1.3 A·cm−2, the percentage of fine bubbles (<10 mm2) showed a slight increasing trend, indicating a faster generation rate of the new bubbles. However, the average bubble size and the percentage of larger bubbles (larger than 200 mm2) showed an increasing trend with the increase in the apparent current density. The proportions of larger bubbles are 42.2%, 45.3%, and 50.6%, respectively, at 0.9 A·cm−2, 1.1 A·cm−2, and 1.3 A·cm−2. The average bubble sizes within 60 s are 159 mm2, 160 mm2, and 209 mm2, respectively, at 0.9 A·cm−2, 1.1 A·cm−2, and 1.3 A·cm−2.
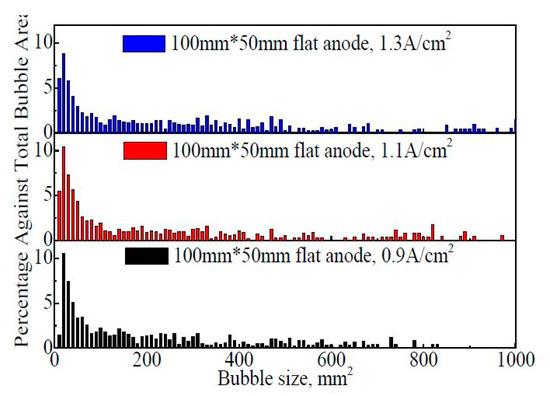
Figure 8.
The size distribution of the bubbles on the 100 mm × 50 mm flat anode within 60 s.
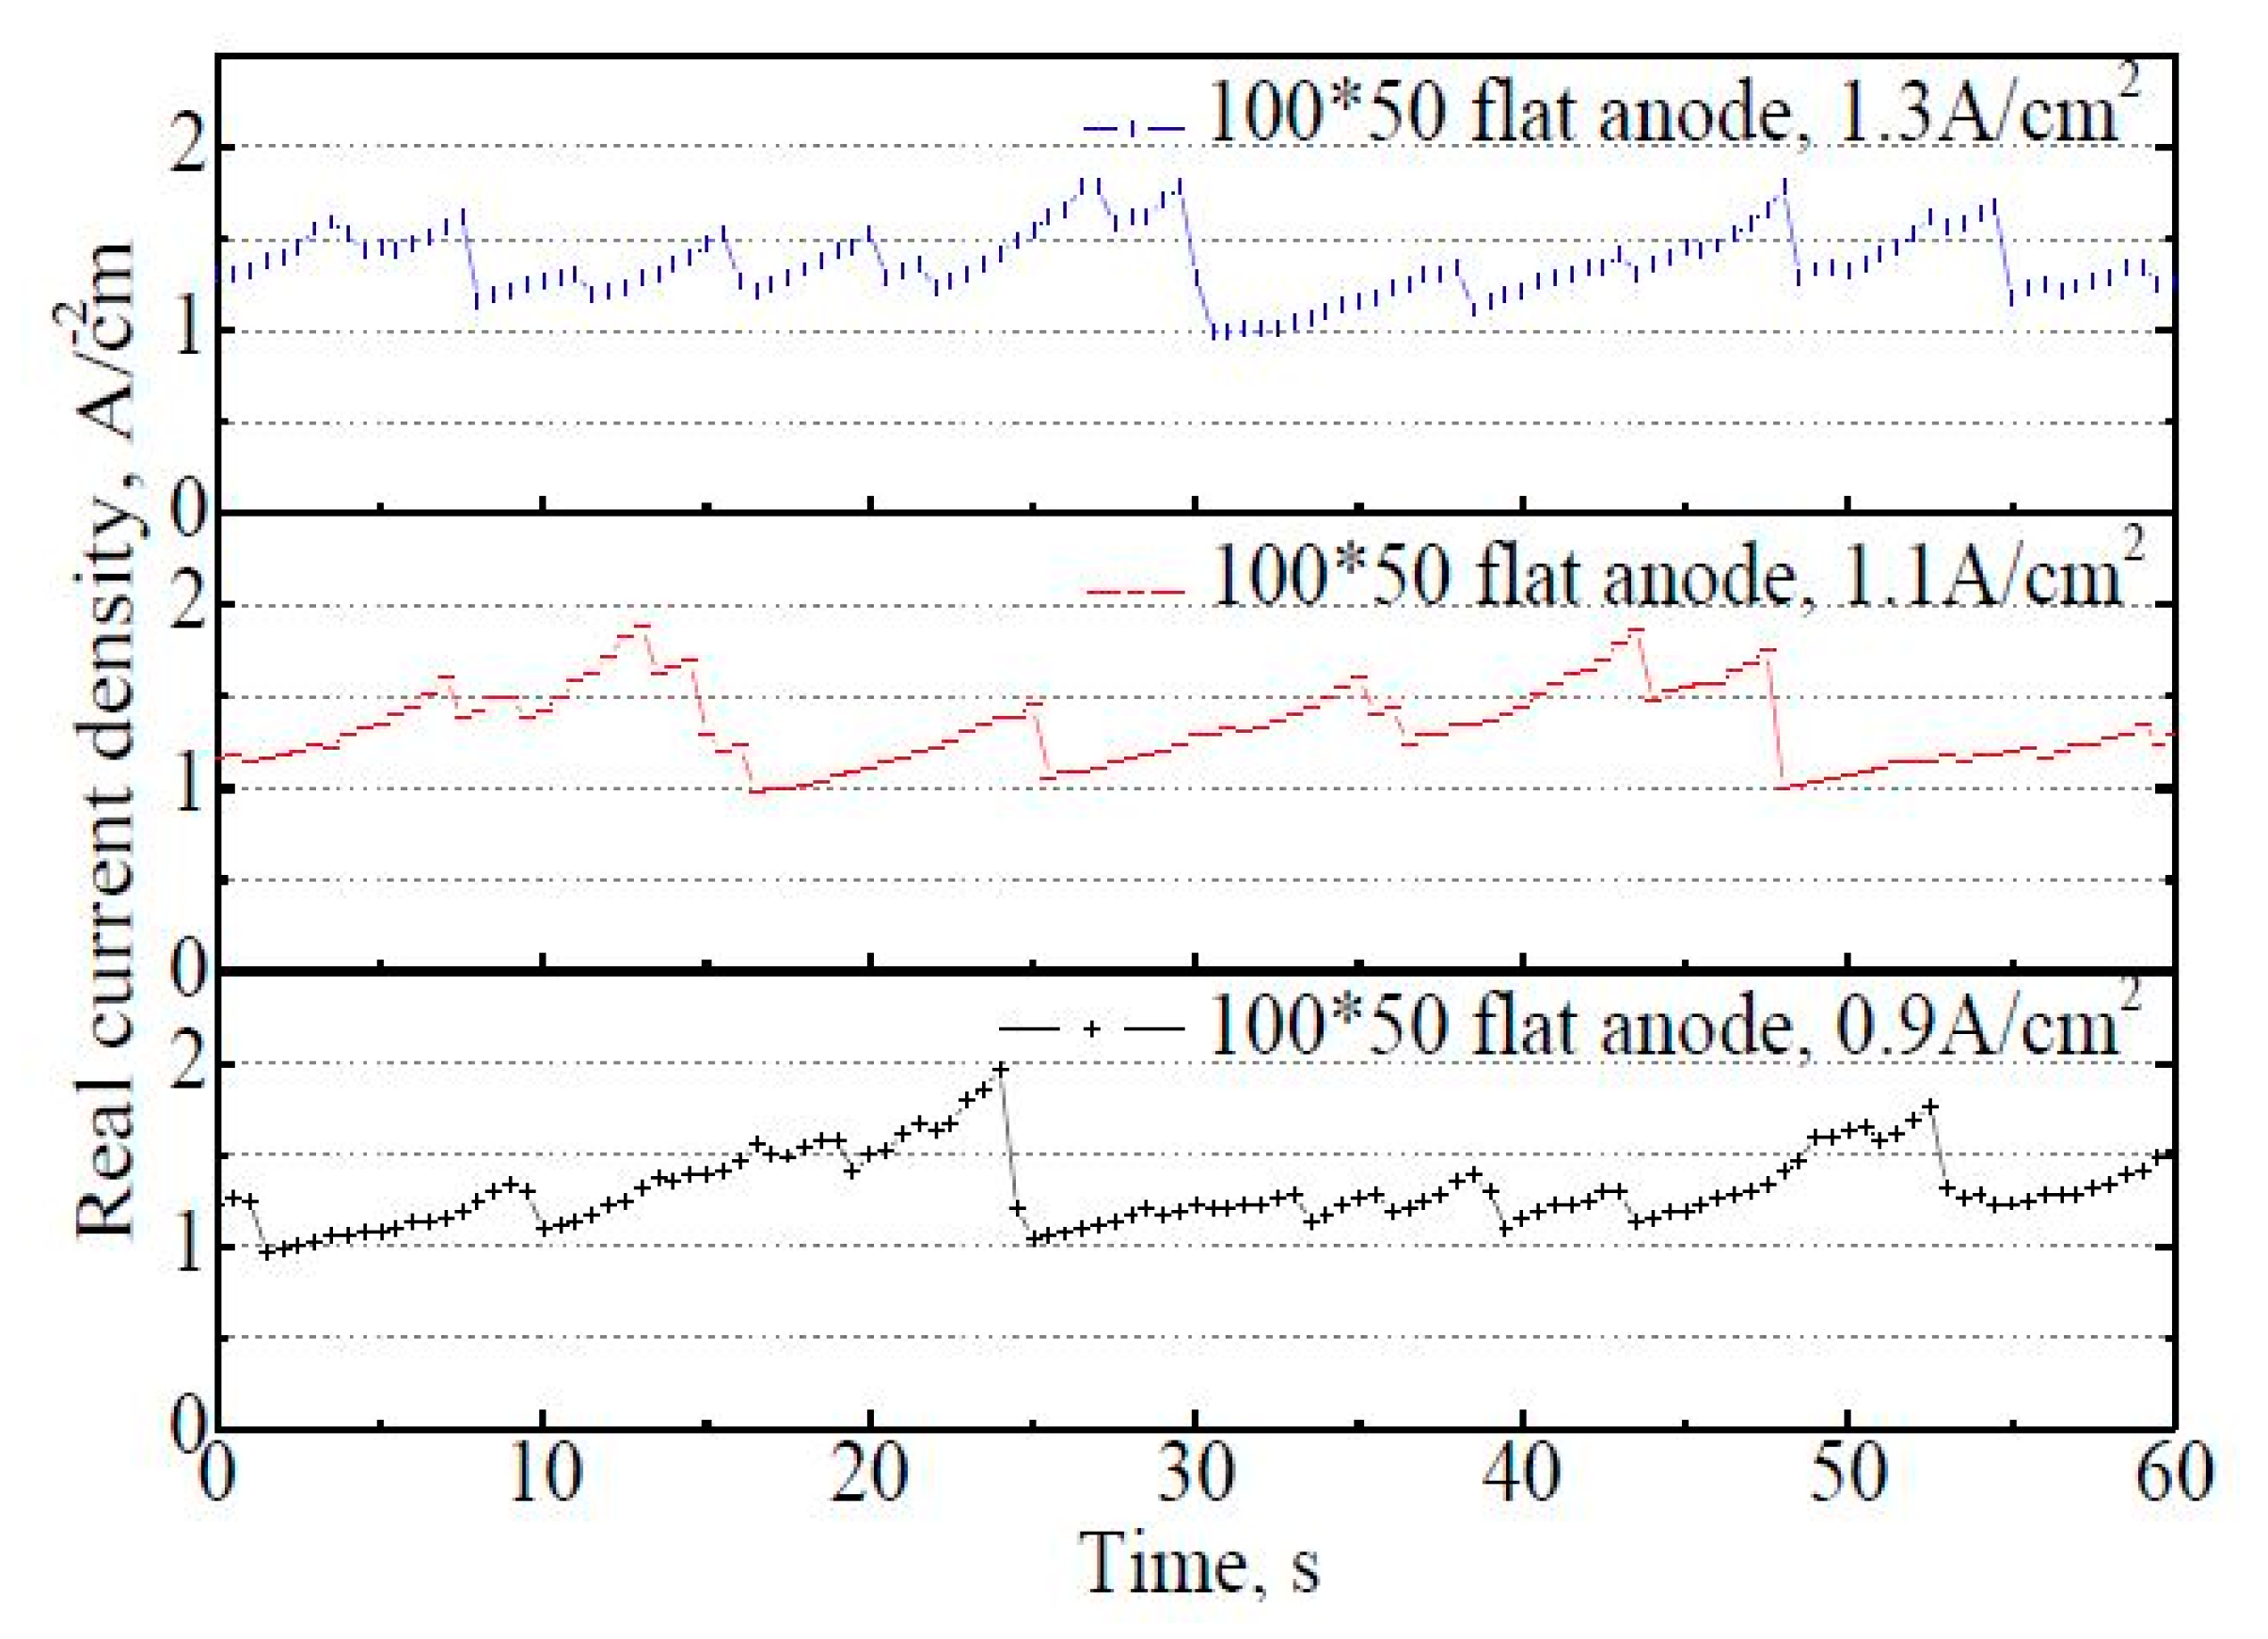
Figure 9 shows the variation of actual current density on the 100 mm × 50 mm flat anode within 60 s. It is found that there are fluctuations in the real apparent current density with time, but the fluctuation frequency is not stable (at least not as stable as it was with the 50 mm × 22 mm flat anode in Figure 7a). The fluctuation range of the actual current density is reduced to 1.0–2.0 A·cm−2 at the apparent current density of 0.9 A·cm−2, in contrast to 1.0–4.1 A·cm−2 on the 50 mm × 22 mm flat anode under the same situation. The average actual current density within 60 s showed a slight increase with the increasing apparent current density, at 1.31 A·cm−2,1.33 A·cm−2, and 1.37 A·cm−2, respectively, under the apparent current density of 0.9 A·cm−2, 1.1 A·cm−2, and 1.3 A·cm−2. The fluctuation frequency of the actual current density curves also increased with an increasing apparent current density. For the 100 mm × 50 mm flat anode case, about eight bubble release cycles could be roughly distinguished within 60 s at 0.9 A·cm−2. The bubble coverage varied from 7% to 54%, with the average coverage of 30% at 0.9 A·cm−2.
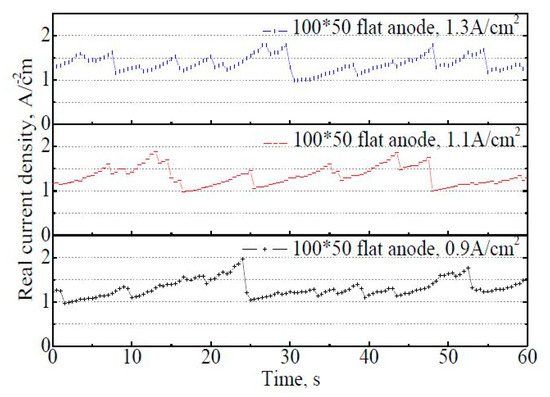
Figure 9.
The variation of actual current density on the 100 mm × 50 mm flat anode within 60 s.
In Table 2, the bubble size distribution on three tested anodes at 0.9 A·cm−2 are summarized and compared. The 100 mm × 50 mm flat anode case showed a higher percentage of small bubbles (for every step that bubble size < 300 mm2), in contrast to the 50 mm × 22 mm flat anode case.
Table 2.
The size distribution of the bubbles obtained from the see-through cell experiments, apparent anode current density 0.9 A/cm2.
For the 50 mm × 22 mm flat anode case, a large amount of bubbles was concentrated in the size of 300–500 mm2 (Table 2 and Figure 5a), while this phenomenon was not observed on the 100 mm × 50 mm flat anode (Table 2 and Figure 8). Instead, the large bubbles (bubble size > 300 mm2) on the 100 mm × 50 mm flat anode were relatively uniformly distributed, suggesting that the bubble evolution is less affected by the size of the anode. A larger anode could provide a higher level of freedom for the bubbles during its evolution process.
A larger anode is supposed to be less sensitive to the evolution process of single bubbles, although these bubbles affect the local actual current density regularly. This is because the anode has enough space to accommodate many bubbles at the same time. All these bubbles evolve independently at different stages of evolution. As a result, the group effect of the bubbles becomes evident, and the evolution character of single bubbles becomes less obvious. This trend is very clear, and it leads to different evolution behavior on anodes; for example, the average bubble size within 60 s on the 50 mm × 22 mm flat anode was 324 mm2; in contrast, the average bubble size decreased to 160 mm2 on the 100 mm × 50 mm flat anode.
When a slot was introduced on the 50 mm × 22 mm anode, the average bubble size was significantly reduced to 40 mm2 from 324 mm2. It was observed that the bubbles could not cross over the anode slot (Figure 2 and Figure 3). During the experiments, once a bubble touched the edge of the anode or anode slot, the bubble was released immediately. Therefore, due to the restriction from the anode slot, the bubble size was limited to below 200 mm2, as most of the bubbles were less than 100 mm2.
Owing to the limitation from the anode size, experiments carried out on the 50 mm × 22 mm flat and slotted anodes give more information on the evolution characters of a single bubble, while the investigation on the 100 mm × 50 mm anode provides details that are closer to the realistic anode working condition.
4. Conclusions and Prospect
In this work, the bubble evolution behavior on aluminum electrolysis anodes was observed in a see-through cell. The bubble distribution on flat and slotted anodes were analyzed using image processing and the statistical analysis method. The following conclusions can be derived:
- From the bubble distribution patterns on the anode bottom surface, the bubbles tend to generate and adhere to certain regions of the anode surface due to the heterogeneity of the carbon material, and the adhering regions would move when the apparent current density was changed;
- For the three kinds of anode as investigated in this work, with the increase in apparent current density, the size of the bubbles that adhered to the anode bottom surface showed an overall decreasing trend, indicating a faster generating rate and faster releasing rate of the bubble under a higher current density;
- A slot on the 50 mm × 22 mm graphite anode could reduce the average bubble size greatly, therefore reducing the actual anode current density significantly;
- When the graphite anode bottom working surface increased from 11 cm2 to 50 cm2, the bubble coverage rate, average bubble size, and the actual current density on the anode significantly decreased. For the 11 cm2 anode, the variation of anode coverage with time reflects the evolution character of a single or several bubbles, while for the 50 cm2 graphite anode, the anode coverage was affected by the group effect of many independent bubbles;
- The effect of slotting on a larger graphite anode (50 cm2) would probably be weakened compared to that on a smaller 11 cm2 slotted anode; however, more details need to be investigated in the future study. Information on the size of released bubbles need to be collected in the next step to provide more data for the investigation of bubble-driven electrolyte flow.
Author Contributions
Conceptualization and methodology, Y.Y.; software, Y.Y. and Y.Z.; validation, Y.Y. and J.Y.; formal analysis and supervision, Z.W.; investigation, Y.Z.; data curation, Y.Z.; writing—original draft preparation, Y.Y. and Y.Z.; writing—review and editing, Z.S.; project administration and funding acquisition, Y.Y. and Z.W. All authors have read and agreed to the published version of the manuscript.
Funding
This research was funded by the National Natural Science Foundation of China and the Fundamental Research Funds for the Central Universities [grant no. 51804069, N2025033, and 51974081].
Data Availability Statement
The data presented in this study are available on request from the corresponding author. the data can also be found in Zhang Y. (one of the authors of this paper)’s graduation thesis, from Northeastern University’s online library system (http://www.lib.neu.edu.cn/index.html).
Conflicts of Interest
The authors declare that there is no conflict of interest regarding the publication of this paper.
References
- Grjotheim, K.; Welc, B.J. Aluminium Smelter Technology: A Pure and Applied Approach; Aluminium-Verlag: Dusseldorf, Germany, 1980. [Google Scholar]
- Grjotheim, K. Textbook of Aluminum Electrolysis: Fundamentals of the Hall-Héroult Process, 2nd ed.; Aluminium-Verlag: Dusseldorf, Germany, 1982. [Google Scholar]
- Robert, E.; Olsen, J.E.; Danek, V.; Tixhon, E.; Ostvold, T.; Gilbert, B. Structure and thermodynamics of alkali fluoride-aluminum fluoride-alumina melts. vapor pressure, solubility, and Raman spectroscopic studies. J. Phys. Chem. B 2014, 101, 9447. [Google Scholar] [CrossRef]
- Ginsberg, H.; Wrigge, H.C. Anodic and Cathodic Current Efficiency in Electrolysis of Cryolite-Alumina Melts. Metall 1972, 26, 997. [Google Scholar]
- Doheim, M.A.; EI-Kersh, A.M.; Ali, M.M. Computational modeling of flow in aluminum reduction cells due to gas bubbles and electromagnetic forces. Metal. Mater. Trans. B 2007, 38, 113. [Google Scholar] [CrossRef]
- Zhang, Y.; Rapp, R.A. Modeling the dependence of alumina solubility on temperature and melt composition in cryolite-based melts. Metal. Mater. Trans. B 2004, 35B, 509. [Google Scholar] [CrossRef]
- Richards, N.E. The dynamics of components of the anodic overvoltage in the alumina reduction cell. In Light Metals; Welch, B., Ed.; Springer: Warrendale, PA, USA; Cham, Switzerland, 1998; p. 521. [Google Scholar]
- Dion, L.; Kiss, L.I.; Poncsak, S.; Lagace, C. Simulator of non-homogenous alumina and current distribution in an aluminum electrolysis cell to predict low-voltage anode effects. Metal. Mater. Trans. B 2018, 49B, 737. [Google Scholar] [CrossRef] [Green Version]
- Wong, D.; Welch, B.; Nunez, P.; Dion, L.; Spirin, A. Latest progress in IPCC methodology for estimating the extent of PFC greenhouse gases co-evolved in the aluminium reduction cell and challenges in reducing these emissions. In Proceedings of the 37th International ICSOBA Conference, Krasnoyarsk, Russia, 16–20 September 2019; p. 16. [Google Scholar]
- Haupin, W.E. A scanning reference electrode for voltage contours in aluminum smelting cells. JOM 1971, 23, 46. [Google Scholar] [CrossRef]
- Feng, Y.; Cooksey, M.A.; Schwarz, M.P. CFD modelling of alumina mixing in aluminium reduction cells. In Light Metals; Lindsay, S.J., Ed.; Springer: Warrendale, PA, USA; Cham, Switzerland, 2011; p. 543. [Google Scholar]
- Zhan, S.; Li, M.; Zhou, J.; Yang, J.; Zhou, Y. CFD simulations of gas–liquid multiscale flow characteristics in an aluminum electrolysis cell with population balance model: Effect of anode slot configuration. JOM 2019, 71, 803. [Google Scholar] [CrossRef]
- Yang, Y.; Gao, B.; Wang, Z.; Shi, Z.; Hu, X. Study on the Inter-electrode Process of Aluminum Electrolysis. Metal. Mater. Trans. B 2016, 47B, 621. [Google Scholar] [CrossRef]
- Qiu, Z.; Fan, L.; Grjotheim, K.; Kvande, H. Formation of metal fog during molten salt electrolysis observed in a see-through cell. J. Appl. Electrochem. 1987, 17, 707. [Google Scholar] [CrossRef]
- Huang, Y.; Wang, Z.; Yang, Y.; Gao, B.; Shi, Z.; Hu, X. Anodic bubble behavior in a laboratory scale transparent electrolytic cell for aluminum electrolysis. Metals 2018, 8, 806. [Google Scholar] [CrossRef] [Green Version]
- Zhao, Z.; Wang, Z.; Gao, B.; Feng, Y.; Shi, Z.; Hu, X. Anodic bubble behavior and voltage drop in a laboratory transparent aluminium electrolysis cell. Metal. Mater. Trans. B 2016, 47, 1962. [Google Scholar] [CrossRef]
- Zhao, Z.; Gao, B.; Feng, Y.; Huang, Y.; Wang, Z.; Shi, Z.; Hu, X. Effects of anode wettability and slots on anodic bubble behavior using transparent aluminium electrolytic cells. JOM 2017, 69, 281. [Google Scholar] [CrossRef]
- Thorne, R.J.; Sommerseth, C.; Ratvik, A.P.; Rorvik, S.; Sandness, E.; Lossius, L.P.; Linga, H.; Svensson, A.M. Bubble evolution and anode surface properties in aluminium electrolysis. J. Electrochem. Soc. 2015, 162, E104. [Google Scholar] [CrossRef] [Green Version]
- Gebarowski, W.; Ratvik, A.P.; Rorvik, S.; Lossius, L.P.; Linga, H.; Svensson, A.M. Effect of coke properties on the bubble formation at the anode during aluminium electrolysis in laboratory scale. In Light Metals; Ratvik, A.P., Ed.; Springer: Warrendale, PA, USA; Cham, Switzerland, 2017; p. 1203. [Google Scholar]
- Yao, Y.; Bao, J.; Skyllas-Kazacos, M.; Welch, B.J.; Akhmetov, S. Fault detection and diagnosis in Hall- Héroult cells based on individual anode current measurements using dynamic kernel PCA. Metal. Mater. Trans. B 2018, 49B, 2077. [Google Scholar] [CrossRef]
- Dorreen, M. Cell Performance and Anodic Processes in Aluminium Smelting Studied by Product Gas Analysis. Ph.D. Thesis, The University of Auckland, Auckland, New Zealand, 2000. [Google Scholar]


Publisher’s Note: MDPI stays neutral with regard to jurisdictional claims in published maps and institutional affiliations. |
© 2021 by the authors. Licensee MDPI, Basel, Switzerland. This article is an open access article distributed under the terms and conditions of the Creative Commons Attribution (CC BY) license (https://creativecommons.org/licenses/by/4.0/).