Featured Application
The proposed method may be used in the production process for fast identification of eggs originating from poultry infected with MS.
Abstract
Mycoplasma synoviae (MS) is a pathogen that causes economic losses in the poultry industry. It can be transmitted, amongst others, via the respiratory tract and spread relatively quickly. As such, MS infections are mainly controlled by maintaining MS-free breeder flocks. Routine diagnosis for the detection of MS may be based on serological, culture, and molecular tests. Here, we propose an optical solution where AI-based analysis of spectral data obtained from the light reflected from the eggshells is used to determine whether they originate from healthy or Mycoplasma synoviae-infected hens. The wavelengths proposed for spectral MS detection are limited to those of VIS and NIR DPSS lasers, which are freely accessible on market. The results are satisfactory: for white eggshells, the F-score is over 95% for five different combinations of wavelengths (using eight or nine wavelengths); for brown eggshells, the F-score is above 85%, also for five different combinations of 6–9 wavelengths.
1. Introduction
M. synoviae is a member of the genus Mycoplasma of the class Mollicutes, a group of wall-less Gram-positive bacteria causing economic losses in the poultry industry. It is one of the major avian pathogenic agents and has a multifactorial etiology that involves complex interactions amongst pathogen, host, and environmental factors [1]. Poultry healthcare problems in this global industry associated with M. synoviae infections are related to respiratory infections, arthropathic problems, and strains causing eggshell pathology [1,2,3,4]. Eggs with eggshell apex abnormalities (EAAs) have a clear demarcation zone on the top zone of the egg, up to approximately 2 cm from the apex. Eggshell pathologies are also characterized by a roughened shell surface, shell thinning, increased translucency, cracks, and breaks [3,4].
Egg quality is important to the commercial egg industry. The deterioration in the quality of eggshells causes significant losses in the egg industry [5,6]. Any infection of the reproductive system of a laying hen can affect the quality of the eggs and eggshells [7]. The eggshell plays a crucial role in the development of the embryo, protecting it from mechanical damage, regulating gas exchange, and providing a source of nutrients. The eggshell protects the egg from contamination by bacteria and other pathogens, ensuring healthy embryo development [8].
M. synoviae is vertically transmitted and can cause egg infertility, embryonic death, poorly developed embryos, and weak poults, sometimes even without overt signs of active infection in the parent flock [9,10]. The occurrence of clinical signs may be related to many factors, such as high levels of ammonia, inadequate ventilation, high stocking densities, and extremes of temperature. Infections with other microorganisms, such as E. coli, infectious bronchitis virus, Newcastle disease virus, and Ornithobacterium rhinotracheale, are also often involved in the etiology of these diseases [11].
Mycoplasmas are important causes of disease and loss of production in intensively reared poultry, particularly in those that are under environmental stress [12].
The disease caused by MS is among the diseases for which the OIE must be notified [13]. As MS can be transmitted via the respiratory tract and egg, the main method of controlling MS infections is to maintain MS-free breeder flocks [14]. Routine diagnosis for the detection of MS may be based on serological, culture, and molecular tests. Sera collected from the flock can be tested for the presence of antibodies using the serum plate agglutination test (SPA), enzyme-linked immunosorbent assay (ELISA), and, rarely, hemagglutination inhibition (HI) [15,16]. The culture method requires the use of PPLO broth and is expensive and time-consuming (28 days). The most frequently used and more sensitive method is the detection of DNA using polymerase chain reaction (PCR) and its modifications, real-time PCR, multiplex PCR, and LAMP [17,18,19,20]. A quick and sensitive method is polymerase spiral reaction (PSR) [21]. The method is 100 times more sensitive than PCR and has a higher positive rate (69.9%) than ELISA (65.3%).
Optical methods can be used to classify eggs as being from healthy or MS-infected hens using spectroscopy in transmitted light [22]. The authors obtained the best results for a group of brown shells, attaining 88% accuracy. With the destruction method, an egg is required because the measurement is taken through a single eggshell piece. To overcome this disadvantage, we propose a significant change to the spectroscopic data acquisition process.
The proposed approach for spectroscopic data acquisition is based on the detection of reflected VIS light. Since the eggs are not destroyed, this method can be used on the production line for egg analysis.
2. Materials and Methods
For the evaluation of the proposed approach, a set of 1475 measurements of eggshell samples was used. The set consisted of brown- and white-colored eggshells with a confirmed origin from healthy or MS-infected hens. Table 1 shows the quantity of each subset of samples.

Table 1.
Samples: quantity of each egg subset.
The samples from the healthy subgroups originated from the inner reference flock of the National Veterinary Research Institute (NVRI), while the MS-infected eggs originated from commercial flocks that were under the veterinary supervision of the NVRI and were confirmed by three techniques: a specific MS PCR [17,18,21], LAMP [19], and sequencing of the vlhA gene [20,21].
2.1. Spectral Data Acquisition
Spectral data were collected in a laboratory setup; a schematic of the setup is shown in Figure 1. The measured sample was placed on an XY translation stage, enabling proper sample positioning. The light source used was an incandescent lamp. The light beam was formed by a condenser lens for proper illumination of the object. The spectrometer fiber head (Thorlabs CCS100/M with M14L01 fiber head attached) was mounted on a movable arm that could be angularly adjusted to maximize the reflected signal on the detector. Such placement of the head enabled the easy and fast adjustment of the setup to different curvatures of egg samples.
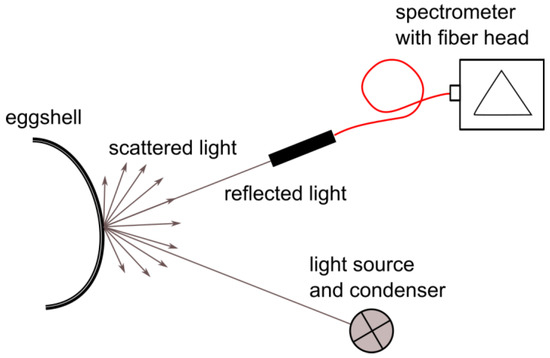
Figure 1.
Scheme of the laboratory setup for spectral data acquisition.
Due to the large number of measurements, these measurements were recorded over several days. Before each measurement set, the setup was calibrated by the acquisition of spectral data of the calibration object—a white grinding plate. All measurements results were divided by the result of the measurement of the calibration object. This procedure removed the influence of sample illumination and recording path parameters.
2.2. Obtained Spectral Data—Initial Analysis
All data obtained in the laboratory setup (Figure 1) were collected in the spectral range of 350–750 nm, with a resolution of 0.5 nm. The amount of data collected in a real stand, for example, by a sorting machine, requires large calculation capacities when the whole range is analyzed. Researchers have tended to apply the method in commercial designs with VIS illumination; therefore, we needed to decrease the amount of analyzed data to ensure a reasonable processing time. From the whole spectral range registered by the spectrometer, we chose the wavelengths that correspond to commercially available lasers, such as diode-pumped solid-state (DPSS) lasers. The DPSS lasers were chosen because of their potential applicability in sorting and detecting systems, and their lasing parameters, stability, and relatively small dimensions. The available wavelengths of the DPSS lasers that are within the measurement range used for eggshells are 457, 473, 501, 515, 523, 526, 532, 543, 556, 561, 589, 593, 660, 671, 690, and 729 nm. The incandescent lamp used in the laboratory setup had a significant drop in intensity for wavelengths lower than 450 nm, which is the main reason for the lower limit on DPSS wavelengths because, based on the experiment, no reliable data were to be obtained from that region. Table 2 shows the exact wavelength and its full width at half maximum (FWHM) together with the assigned name, symbolizing the input variable.
Table 2.
Notation of input data variables and corresponding DPSS wavelengths and their full width at half maximum (FWHM).
Figure 2 visualizes an example of data for ten samples from each measurement category.

Figure 2.
The visualization of an exemplary ten samples taken from each categorical subset: brown eggshell from (a) MS-infected and (b) healthy hens; white eggshell from (c) MS-infected and (d) healthy hens. Different colors determine different samples.
2.3. Support Vector Machine
Support vector machine (SVM) is a supervised learning algorithm introduced by Vapnik [23]. This algorithm aims to find a hyperplane that separates two classes of a multi-dimensional dataset with a maximum margin. For data to be classified by SVM, the dataset must be linearly separable. If the dataset does not fulfill this requirement, another kernel function must be used that will transform the data to a higher dimension to ensure they are linearly separable by a hyperplane that spans these dimensions. The choice of kernel depends on the type of data. The radial basis function (RBF) kernel is considered the best choice for practical applications [23]. When classifying spectral data collected from diseased and healthy eggs, the problem is the overlap of measurements from both classes. In this case, the use of RBF is preferred because it transforms the data to infinite dimensions in which the relationship between observations might be found. Then, the resulting value enables the creation of the decision boundary that enables the classification of multidimensional data [23,24,25].
2.4. Metrics
To determine whether the SVM algorithm was able to find the optimal solution for binary classification of the data, the numerical values that determine the quality of such a prediction were calculated.
Firstly, we define the outcomes of the model classification compared to their real labels. The technique that helps to represent the quality of classification is the confusion matrix. In binary classification, this matrix consists of four values: true positives (TPs), false positives (FPs), false negatives (FNs), and true negatives (TNs) [26]. Every observation is placed in the proper cell according to the real and predicted value. Then, the confusion matrix is analyzed to define the quality of the classification.
For binary classification, the three metrics extracted from the confusion matrix are used often when a dataset is unbalanced [27]. The first is precision:
Precision = TP/(TP + FP).
Precision indicates how well the algorithm classifies a positive class out of a provided dataset.
The second metric is recalled, which indicates the ability of the model to capture positive cases:
Recall = TP/(TP + FN).
Since the goal of the experiment was to maximize both metrics, the third, auxiliary metric is usually introduced, the F-score:
F-score = 2(Precision·Recall)/(Precision + Recall).
The F-score represents the harmonic mean of the above two metrics. Therefore, maximizing this metric will improve the overall quality of the classification and in the case where harmonic mean smaller values have a strong impact on the result. In our case, this was especially important because the dataset was unbalanced. Thus, using a simple accuracy metric would not be sufficient. A model that classifies everything as one class may obtain a high score depending on the level of unbalance of the set. In addition, the previously mentioned metrics can be used to maximize individual classification tasks. For example, maximizing precision will allow for a much better classification of positive cases, i.e., eggs from sick hens. Unfortunately, this action incurs a tradeoff, i.e., observations belonging to the negative class are more likely to be incorrectly classified. This phenomenon is called the precision–recall tradeoff.
2.5. Hyperparameters Optimization
Using SVM with RBF as the kernel function, there are two important hyperparameters, C and gamma, that need to be optimized to obtain a robust and properly regularized classifier. The problems that arise in optimization are overfitting and underfitting of the classifier. The former means that the algorithm will fit its decision boundaries too strongly relative to the test dataset. Thus, when a new observation is being classified, there is a high probability that it will be classified incorrectly. This error can be verified using either an additional partitioning of the set into a validation dataset or k-fold cross-validation algorithms. Underfitting is easy to recognize because the model performs poorly by assigning random classes to the classified observations. The hyperparameter C is responsible for how the decision boundary is generated. The smaller the C, the smoother the decision boundary, but as C increases, the decision boundary becomes increasingly complicated, until it can separate individual observations, achieving maximum classification quality on the training set, but generating a highly overfitted model that is unusable when the predicted observations are not the same as in the learning set. The gamma used in the kernel function is responsible for the strength of the influence of each observation. When gamma is large, a single observation only affects observations in closer proximity in multidimensional space.
In our case, to optimize hyperparameters, a grid search algorithm was used [28,29]. The algorithm trained many models (classifying algorithms) on given data within given ranges of selected hyperparameters. After finishing the process, the best model with the chosen values of hyperparameters was returned. To increase the accuracy of classification, the process was repeated twice. Firstly, a coarse search was performed for a wide range of values (depending on the chosen parameter) with a large step size. The algorithm was then used again within the ranges based on the first search results and a much smaller step size. To obtain a model, regularized 5-fold cross-validation was used. Using k-fold cross-validation helps ensure that the model performs well with different training and learning sets, but for large datasets, this solution is not optimal because the learning time is multiplied k times [30]. In the subsequent sections, we use five-fold cross-validation with the F-score metric.
3. Results
The RBF-based SVM algorithm is highly susceptible to the different magnitudes of the individual features submitted for learning. Therefore, the features all need to be standardized so that one feature is not predominant compared to the rest [31]. In our case, the features were the integer reflectance intervals corresponding to the individual half-widths of the previously selected lasers. The standardization was performed by subtracting the mean of all observations from each observation and dividing by their standard deviation. This yielded a distribution with the mean at zero and a standard deviation equal to one. Even though all measurements were previously normalized after the data collection process, the use of additional standardization raised the classification result by 2% and 4% for white and brown eggs, respectively. However, this should be performed on a case-by-case basis, and it is best to test which of the scaling measures returns the highest quality classification. It is also important to check for outliers in the dataset, as they will disrupt not only the standardization process but also the learning process. In our dataset, there were no outliers, so it was possible to start learning. Since the dataset was not large, this provided the possibility of generating subsets consisting of all combinations without repetition from one to nineteen of all selected wavelengths. The combinations were ranked, and the top twenty positions are shown in Table 3 and Table 4 for the white and brown eggshells, respectively.
Table 3.
Top 20 ranking for multiple wavelength usage for white eggshells, without hyperparameter optimization.
Table 4.
Top 20 ranking for multiple wavelength usage for brown eggshells without hyperparameter optimization.
The quality of classification with hyperparameter optimization was then tested for each subset of features, and those with the highest results were selected. A new ranking for white and brown eggshells is shown in Table 5 and Table 6, respectively. This activity was important because an overabundance of features can lead to noise in the best solution, and too few features can lead to underfitting the classification model.
Table 5.
Top 20 ranking for multiple wavelength usage for white eggshells with hyperparameter optimization.
Table 6.
Top 20 ranking for multiple wavelength usage for brown eggshells with hyperparameter optimization.
The importance of proper values of the C parameter and gamma were discussed in Section 2.2. A new ranking for wavelength combinations was performed, but with a lower value of C and a higher value of gamma. The results are shown in Table 7 (for white eggshells) and Table 8 (for brown eggshells).
Table 7.
Top 20 ranking for multiple wavelength usage for white eggshells with hyperparameter optimization and decreased C parameter value.
Table 8.
Top 20 ranking for multiple wavelength usage for brown eggshells with hyperparameter optimization and decreased C parameter value.
Table 9 and Table 10 are included to increase the clarity of the results. The exact combination of wavelengths is shown; the bold ones are the key parameters that carry crucial spectral information for the proper classification of eggshells.
Table 9.
Top 10 ranking for multiple wavelength usage for white eggshells with hyperparameter optimization and decreased C parameter value. Parameters given in bold indicate the key wavelengths for white eggs examination.
Table 10.
Top 10 ranking for multiple wavelength usage for brown eggshells with hyperparameter optimization and decreased C parameter value. Parameters given in bold indicate the key wavelengths for brown eggs examination.
4. Discussion
For obtaining reliable results with the proposed algorithm, the value of the optimization parameter C must be decreased, and the value of the gamma parameter must be increased. The ranking of wavelength combinations together with the five-fold CV mean for white and brown eggshells are shown in Table 9 and Table 10, respectively. The obtained F-score results are satisfactory. As predicted, the F-score value for the white eggshell dataset is higher than that for the brown eggshell dataset due to the broader variety of brown eggshell pigmentation, which strongly affects the spectral characteristics of the reflected light.
The F-score being higher than 94% in the white eggshell dataset indicates the key wavelengths are A0 = 457 nm, A11 = 593 nm, A12 = 632 nm, A13 = 660 nm, A14 = 671 nm, and A15 = 690 nm, which should be accompanied at least by one (A16 = 729 nm; F-score 94.912%) or two (A16 = 729 nm and A10 = 589 nm; F-score in this case reaches 95.755%) other wavelengths. The usage of only the key wavelengths (A0 = 457 nm, A11 = 593 nm, A12 = 632 nm, A13 = 660 nm, A14 = 671 nm, and A15 = 690 nm) results in an F-score of 93.957%, and a five-fold CV SD of 2.27 with C = 107.63 and gamma = 0.25.
For the brown eggshell dataset, to obtain an F-score higher than 83%, it was necessary to use at least five wavelengths (out of 17). Analysis of the data shown in Table 10 resulted in four key wavelengths: A4 = 532 nm, A8 = 556 nm, A14 = 671 nm, and A15 = 690 nm. The fifth wavelength necessary to reach a high F-score is A3 = 515 nm; nevertheless, the highest score (86.21%) was obtained by adding a sixth wavelength, A5 = 526 nm. Additional wavelengths that may be added to the key ones are A6 = 532 nm and A7 = 543 nm. The usage of only the key wavelengths (A4 = 532 nm, A8 = 556 nm, A14 = 671 nm, A15 = 690 nm) resulted in an F-score of 78.552%, and a five-fold CV SD of 3.35 with C = 76.1 and gamma = 0.84.
5. Conclusions
The application of the proposed algorithm (with the optimization of hyperparameters) for the classification of eggshells into groups from either a healthy flock or from an MS-infected flock produced the following results: for the white eggshell dataset, an F-score over 95% was obtained; for the brown eggshell dataset, 86% was the highest obtained result. The significantly lower F-score for the brown eggshell dataset is due to having the widest range of pigmentation in the samples. Analysis was performed using the wavelengths of DPSS lasers, which are easily available on the market, so further research with different wavelengths may result in better scores. The crucial conclusion drawn from obtained results is that parallel classification of white and brown eggshells requires increasing the number of wavelengths to eight. Only two wavelengths are common among the key ones for both groups: A14 = 671 nm, A15 = 690 nm. The sets differ in the number of key wavelengths and the spectral ranges of those wavelengths.
For white eggshells, an F-score higher than 94% was obtained with seven wavelengths, but to reach the top result (95.755%), eight wavelengths were required. For brown eggshells, five wavelengths were sufficient, with six required to reach the top F score (86.21%).
Author Contributions
Conceptualization, A.P. and S.P.; methodology, A.P.; software, R.K.; validation, S.P.; formal analysis, R.K.; investigation, A.P.; resources, O.K.; data curation, O.K.; writing—original draft preparation, A.P. and R.K.; writing—review and editing, S.P.; visualization, S.P. and R.K.; supervision, A.P.; project administration, A.P.; funding acquisition, A.P. All authors have read and agreed to the published version of the manuscript.
Funding
This research was funded by the Warsaw University of Technology, grant number 504/04557/1143/43.090003.
Institutional Review Board Statement
Not applicable.
Informed Consent Statement
Not applicable.
Data Availability Statement
The data presented in this study are available on request from the corresponding author. The data are not publicly available due to privacy issues.
Conflicts of Interest
The authors declare no conflict of interest. The funders had no role in the design of the study; in the collection, analyses, or interpretation of data; in the writing of the manuscript, or in the decision to publish the results.
References
- Kleven, S. Mycoplasmas in the etiology of multifactorial respiratory disease. Poult. Sci. 1998, 77, 1146–1149. [Google Scholar] [CrossRef] [PubMed]
- Landman, W.J.M.; Feberwee, A. Aerosol-induced Mycoplasma synoviae arthritis: The synergistic effect of infectious bronchitis virus infection. Avian Pathol. 2004, 33, 591–598. [Google Scholar] [CrossRef] [PubMed]
- Feberwee, A.; De Wit, J.J.; Landman, W.J.M. Induction of eggshell apex abnormalities by Mycoplasma synoviae: Field and experimental studies. Avian Pathol. 2009, 38, 77–85. [Google Scholar] [CrossRef]
- Kursa, O.; Pakuła, A.; Tomczyk, G.; Paśko, S.; Sawicka, A. Eggshell apex abnormalities caused by two different Mycoplasma synoviae genotypes and evaluation of eggshell anomalies by full-field optical coherence tomography. BMC Vet. Res. 2019, 15, 1. [Google Scholar] [CrossRef]
- Bondoc, I. The veterinary sanitary control of egg and egg products. In Veterinary Health Control of Food Quality and Safety; Bondoc, I., Șindilar, E.V., Eds.; Iași Publishing: Iași, Romania, 2002; Volume I, pp. 377–396. ISBN 973-8014-64-6. [Google Scholar]
- Bondoc, I. The official veterinary sanitary control of table eggs. In Control of Products and Food of Animal Origin; Iași Publishing: Iași, Romania, 2014; Volume I, pp. 222–263. ISBN 978-973-147-139-6. [Google Scholar]
- Solomon, S. The eggshell: Strength, structure and function. Br. Poult. Sci. 2010, 51, 52–59. [Google Scholar] [CrossRef]
- Hunton, P. Research on eggshell structure and quality: An historical overview. Braz. J. Poult. Sci. 2005, 7, 67–71. [Google Scholar] [CrossRef]
- Lierz, A.M.; Obon, E.; Schink, B.; Carbonell, F.; Hafez, H.M. The role of mycoplasmas in a conservation project of the lesser kestrel (Falco naumanni). Avian Dis. 2008, 52, 641–645. [Google Scholar] [CrossRef] [PubMed]
- Kursa, O.; Tomczyk, G.; Sawicka, A. Effect of Mycoplasma synoviae strains isolated from the respiratory and reproductive tracts of chicken on SPF chicken embryos. Med. Weter. Red. 2019, 75, 54–58. [Google Scholar] [CrossRef]
- Ferguson-Noel, N.; Noormohammadi, A.H. Mycoplasma synoviae infection. In Diseases of Poultry, 13th ed.; Swayne, D.E., Glisson, J.R., McDougald, L.R., Nolan, L.K., Suarez, D.L., Nair, V.L., Eds.; Wiley: Ames, IA, USA, 2013; pp. 900–906. [Google Scholar]
- Bencina, D. Haemagglutinins of pathogenic avian mycoplasmas. Avian Pathol. 2002, 31, 535–547. [Google Scholar] [CrossRef]
- OIE. Avian Mycoplasmosis (Mycoplasma gallisepticum, M. synoviae). In OIE Terrestrial Manual; World Organisation for Animal Health: Paris, France, 2018; Chapter 3.3.5; pp. 68–70. [Google Scholar]
- Kleven, S.H.; Eidson, C.S.; Anderson, D.P.; Fletcher, O.J. Decrease of antibody response to Mycoplasma synoviae in chickens infected with Marek’s disease herpesvirus. Am. J. Veter. Res. 1972, 33, 2037–2042. [Google Scholar]
- Feberwee, A.; de Vries, T.S.; Landman, W.J.M. Seroprevalence of Mycoplasma synoviae in Dutch commercial poultry farms. Avian Pathol. 2008, 37, 629–633. [Google Scholar] [CrossRef]
- Hong, Y.; García, M.; Leiting, V.; Bencina, D.; Dufour-Zavala, L.; Zavala, G.; Kleven, S.H. Specific detection and typing of Mycoplasma synoviae strains in poultry with PCR and DNA sequence analysis targeting the hemagglutinin encoding gene vlhA. Avian Dis. 2004, 48, 606–616. [Google Scholar] [CrossRef] [PubMed]
- Fraga, A.P.; de Vargas, T.; Ikuta, N.; Fonseca, A.S.K.; Celmer, Á.J.; Marques, E.K.; Lunge, V.R. A multiplex real-time PCR for detection of Mycoplasma gallisepticum and Mycoplasma synoviae in clinical samples from Brazilian commercial poultry flocks. Braz. J. Microbiol. 2013, 44, 505–510. [Google Scholar] [CrossRef][Green Version]
- Kursa, O.; Woźniakowski, G.; Tomczyk, G.; Sawicka, A.; Minta, Z. Rapid detection of Mycoplasma synoviae by loop-mediated isothermal amplification. Arch. Microbiol. 2014, 197, 319–325. [Google Scholar] [CrossRef] [PubMed]
- Hammond, P.P.; Ramírez, A.S.; Morrow, C.J.; Bradbury, J.M. Development and evaluation of an improved diagnostic PCR for Mycoplasma synoviae using primers located in the haemagglutinin encoding gene vlhA and its value for strain typing. Vet. Microbiol. 2009, 136, 61–68. [Google Scholar] [CrossRef] [PubMed]
- Kursa, O.; Tomczyk, G.; Sawicka, A. Prevalence and phylogenetic analysis of Mycoplasma synoviae strains isolated from Polish chicken layer flocks. J. Veter. Res. 2019, 63, 41–49. [Google Scholar] [CrossRef] [PubMed]
- Wu, Q.; Xu, X.; Chen, Q.; Zuo, K.; Zhou, Y.; Zhang, Z.; Kan, Y.; Yao, L.; Ji, J.; Bi, Y.; et al. Rapid and visible detection of Mycoplasma synoviae using a novel polymerase spiral reaction assay. Poult. Sci. 2019, 98, 5355–5360. [Google Scholar] [CrossRef]
- Lorenc, Z.; Paśko, S.; Kursa, O.; Pakuła, A.; Sałbut, L. Spectral technique for detection of changes in eggshells caused by Mycoplasma synoviae. Poult. Sci. 2019, 98, 3481–3487. [Google Scholar] [CrossRef] [PubMed]
- Raviv, Z.; Kleven, S.H. The development of diagnostic real-time TaqMan PCRs for the four pathogenic avian mycoplasmas. Avian Dis. 2009, 53, 103–107. [Google Scholar] [CrossRef] [PubMed]
- Cortes, C.; Vapnik, V. Support-vector networks. Mach. Learn. 1995, 20, 273–297. [Google Scholar] [CrossRef]
- Patle, A.; Chouhan, D.S. SVM kernel functions for classification. In Proceedings of the 2013 International Conference on Advanced ICT (Information and Communication Technology) for Education (ICAICTE2013), Hainan, China, 20–22 September 2013. [Google Scholar]
- Wang, J.; Chen, Q.; Chen, Y. RBF kernel based support vector machine with universal approximation and its application. Comput. Vis. 2004, 3173, 512–517. [Google Scholar] [CrossRef]
- Bharadwaj, K.; Prakash, B.; Kanagachidambaresan, G.R. Sparse kernel machines. In Pattern Recognition and Machine Learning; Springer: Berlin, Germany, 2021; Chapter 7. [Google Scholar]
- Géron, A. Classification. In Hands-On Machine Learning with Scikit-Learn, Keras, and TensorFlow; O’Reilly Media Inc.: Sebastopol, CA, USA, 2019; Chapter 3. [Google Scholar]
- Lameski, P.; Zdravevski, E.; Mingov, R.; Kulakov, A. SVM parameter tuning with grid search and its impact on reduction of model over-fitting. In Rough Sets, Fuzzy Sets, Data Mining, and Granular Computing; Springer: Cham, Switzerland, 2015. [Google Scholar] [CrossRef]
- Luque, A.; Carrasco, A.; Martín, A.; Heras, A.D.L. The impact of class imbalance in classification performance metrics based on the binary confusion matrix. Pattern Recognit. 2019, 91, 216–231. [Google Scholar] [CrossRef]
- Arora, M.; Bhambhu, L.; Scholar, M.T. Role of scaling in data classification using SVM. Int. J. Adv. Res. Comput. Sci. Softw. Eng. 2014, 4, 2277. [Google Scholar]


Publisher’s Note: MDPI stays neutral with regard to jurisdictional claims in published maps and institutional affiliations. |
© 2021 by the authors. Licensee MDPI, Basel, Switzerland. This article is an open access article distributed under the terms and conditions of the Creative Commons Attribution (CC BY) license (https://creativecommons.org/licenses/by/4.0/).