Abstract
This study characterizes and compares the parameters of the quality reproduction of fine elements in flexography on coated and uncoated paper as well as on OPP film (oriented polypropylene). A monochrome test form was created and printed using cyan UV ink. The analysis of results confirms the importance of interaction between the printing substrate and ink; it also indicates identical line and text deformations on the print. Quality reproduction on coated paper is higher in relation to OPP film for all the research parameters. The ink penetrates significantly more and with more irregularity into the pores and throats of the uncoated paper, which results in less homogeneous elements, and in such way that it loses its original shape. In coated paper and OPP film, the ink spreads more on the substrate area which gives it a significantly more homogeneous shape. However, due to the surface spread of the ink, the biggest changes in the size of fine elements are noticeable in the OPP film. The scientific contribution of this paper is based on the comparison of print quality parameters of fine elements, which can contribute to the optimization of the production process and quality of the final graphical product.
1. Introduction
The ability of a printing system to reproduce a sharp image with clear details is of crucial importance for high-quality reproduction [1]. The geometry of printed elements, sharpness and noise of the edge, together with a uniform ink layer, are important indicators of quality reproduction that need to be analyzed. They are directly connected to the reproduction of lines, text and dots that are part of every image [2]. Quality parameters of fine elements can be assessed by measuring line wicking, which makes line and text become fuzzy or bold.
The quality reproduction in flexography is conditioned by a combination of different parameters that relate to platemaking technology and the type of polymer plates [3], specification of the anilox roller, the strength of pressure in print and characteristics of the printing substrate [4]. The print quality of prints performed with flexographic printing technology is influenced by various parameters such as viscosity of the printing inks, printing substrates, plates, anilox rolls, etc. [5]. The lightest pressure or “kiss impression” is ideal for printing. Kiss impression is a clean print image created while applying the lowest value of pressure possible with the plate against the paper [6]. It is often not easy to print using kiss impression, primarily due to the characteristics of the printing substrate surface, uneven height of the printing elements or the types of printing jobs. On the other hand, if the pressure is too high, dots will be squeezed more and can be deformed [7]. Tomašegović et al. investigated how different pressures in flexographic printing and smoothness of the paper affect the printed line width and legibility of the printed typographic elements of 4pt size [8]. Printouts were obtained on five different printing substrates made of recycled paper and was found that the smoothness of the paper is directly related to ink spreading on the surface of the print.
The composition and the surface characteristics of the printing substrate significantly influence the ability of the ink to penetrate into its structure [9]. Coated glossy or matte papers are harder to absorb the ink than the uncoated ones because they are less porous and less permeable [10]. Therefore, the ink spreads more over the surface of the printing substrate, and the ink layer on the printing surface is more uniform. Ding et al. analyzed the print quality of edible inks on a coated printing substrate in the technique of flexographic and screen printing [11]. It is important for the ink to adhere well to the printing substrate [12], which is directly influenced by the texture of the printing surface or treating the surface of PET films in order to decrease the surface tension [13]. Mariappan et al. in their work researched the dynamics of liquid transfer between nanoporous stamps and solid substrates [14]. Although many types of printing substrates (plastics, film and foil) are widely used for flexible packaging, paper-based materials remain popular due to their good printing characteristics [15]. The most important properties for the packaging material are: the gas barrier property, mechanical, thermal, rheological, optical and physical properties.
The entire process of flexography consists of a large number of influential parameters that need to be standardized for specific printing conditions [16]. This research comprises the comparison of the most important quality parameters of graphic reproduction in accordance with the ISO 12647-6 standard for three types of printing substrates: uncoated and coated paper and OPP film. Zhang et al. found that by analyzation, the ink penetration depth into the substrate can theoretically predict the quality of printed matter [17], and presented the mechanism of interaction between the ink and paper based on two models, static penetration and dynamic diffusion.
The common way of evaluating the quality of graphic reproduction consists of an objective evaluation of the color and tone in the printed image using the spectrometric and densitometric measurement methods. Havenko et al. analyzed the influence of surface roughness of cardboard as a printing medium on printing properties of environmentally friendly inks, and in their research they presented the effect of the surface layer of cardboard on the microgeometry of prints formed by cyan, yellow, black and magenta inks [18]. Plazonić et al. investigated colorimetric changes of the water-based flexographic ink printed on three types of hemp-based printing substrates subjected to artificial ageing [19], and it was proven that the most stable prints under the influence of light were made with black ink. The application of both instruments and measurement standards together has contributed substantially to the improvement of print quality in flexography. As flexographic printing technology fast evolved over the last two decades, the application of an increasing number of substrate materials of different characteristics and types of printing ink, many critical print quality issues such as sharpness, line quality and text quality and micro and macro uniformity often become worse. The quantification of these parameters requires a completely different approach to determining print quality based on image analysis systems or image analyzers. This specific metrics can determine the effect of surface structure of the printing substrate on print quality of fine elements which cannot be determined by standard methods. In order to obtain a broader perspective of quality reproduction, in addition to standard evaluation methods, more space is being given to image analysis. The ability to measure image structure characteristics such as sharpness and line edge noise, as well as other fine detail deformations is what contributes to an image analysis system, while also distinguishing it from a conventional densitometer or spectrometer [20]. Therefore, during the evaluation of the quality reproduction these parameters need to be analyzed as well.
The goal of this paper is to research the influence of printing substrate on quality reproduction of the lines and text based on image analysis and visual evaluation in precisely defined conditions for three chosen printing substrates. The obtained results will show the importance of interaction between the three types of printing substrate and printing ink, and the influence on the print quality parameters.
2. Parameters of Quality Reproductions of the Fine Elements in the Process of Image Analysis Evaluation
A typical system for image analysis consists of a high-resolution digital camera or microscope which captures areas of interest and of a specialized software which analyzes quality reproduction characteristics based in a digital image. Microscopes with a high-resolution optical model (5 μm per pixel or 5080 ppi) are applied in different methods of research for displaying fine elements invisible to the naked eye.
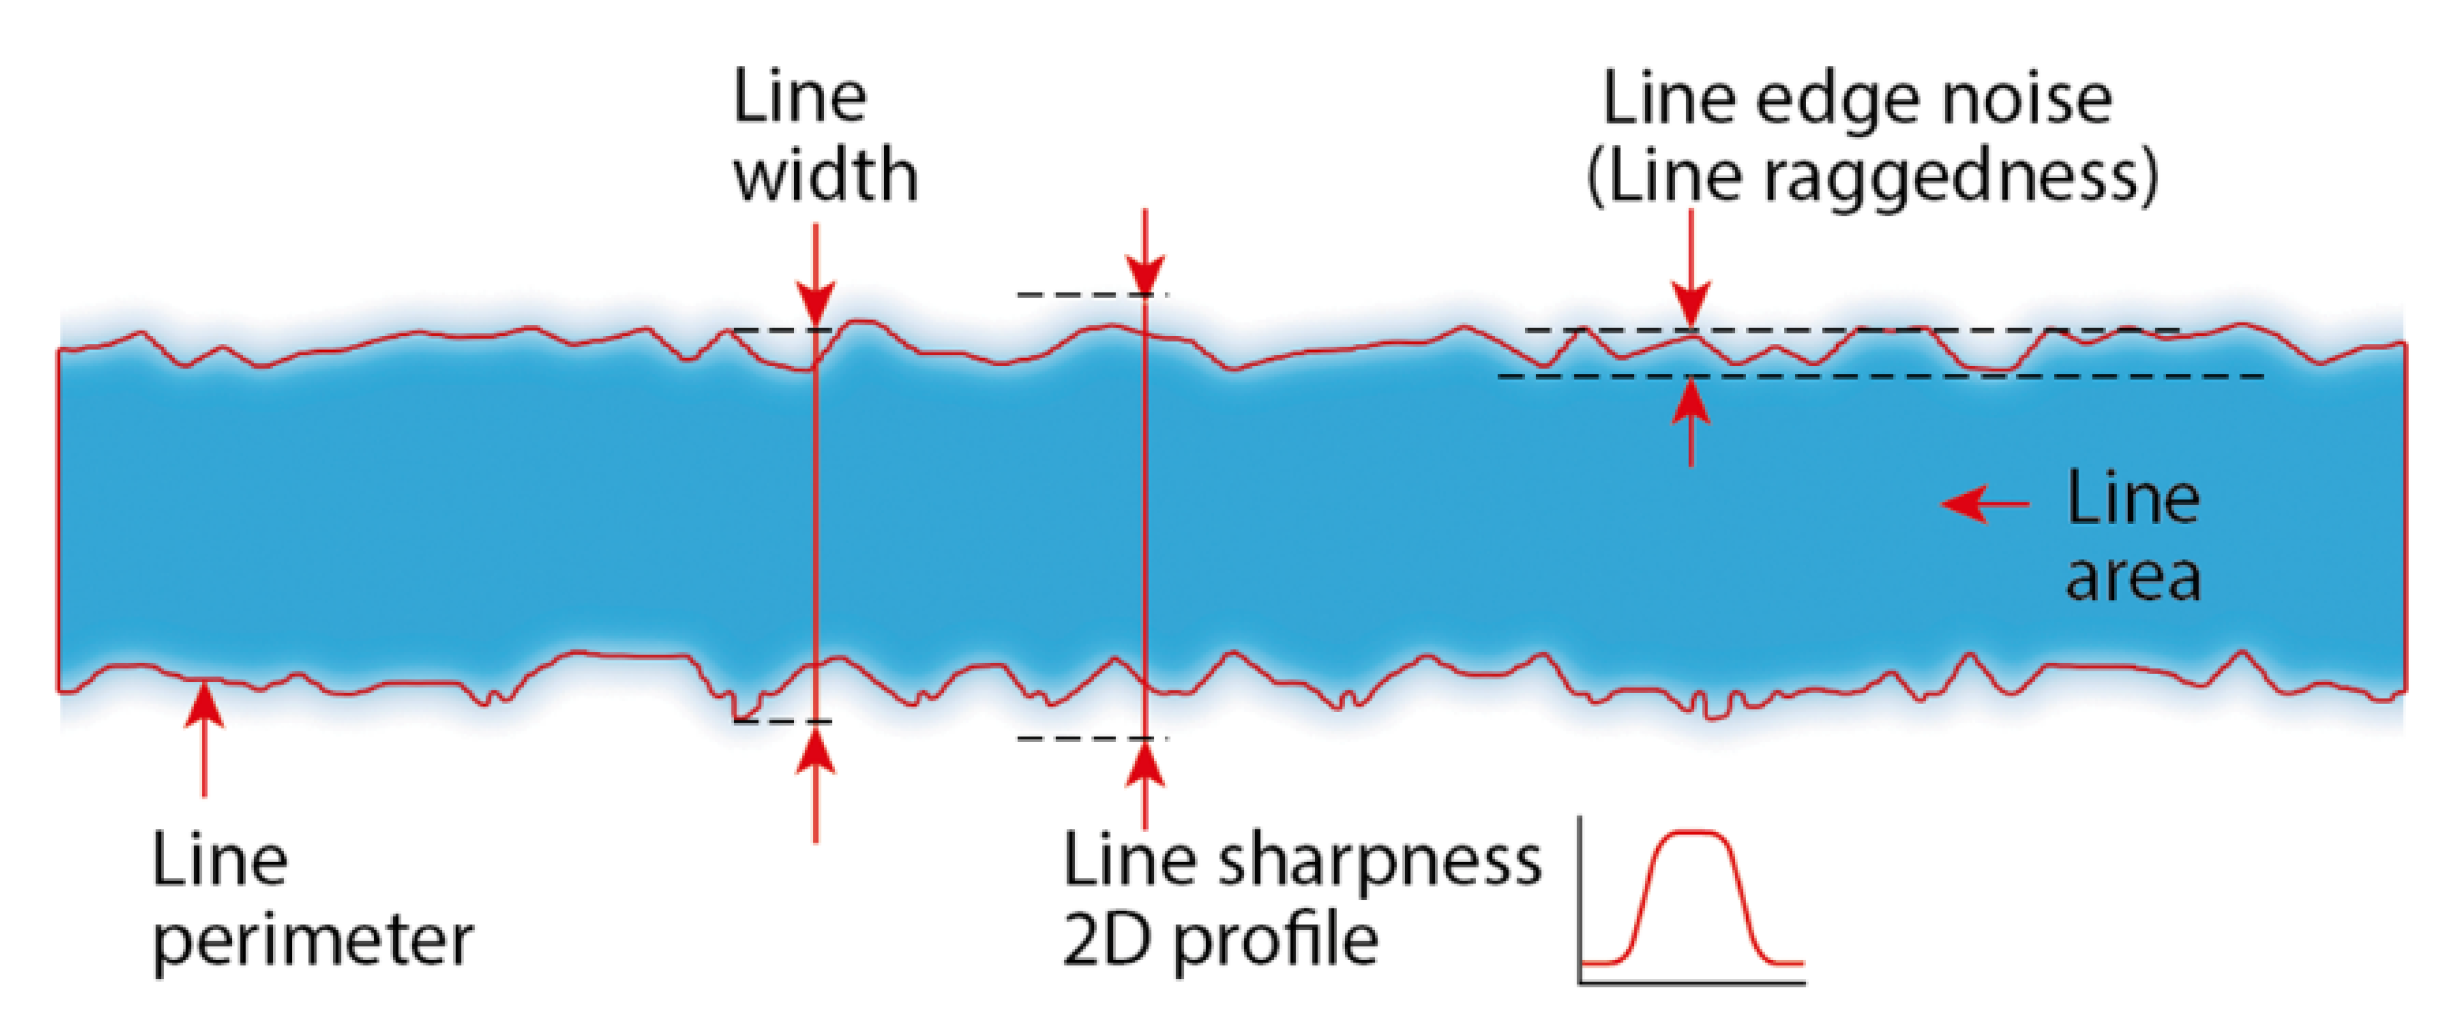
The evaluation of quality reproduction in line with the ISO13660 standard is based on the following three parameters (Figure 1): line width, raggedness and blurriness [21].

Figure 1.
Line print quality parameters.
- Line width: The evaluation is determined based on the average line width on the print in relation to the theoretically defined line width. Blurry line edges, disproportionally distanced from the full line color, are included in the evaluation process into the total width, which can significantly influence the change of the line width. Data on widening or narrowing of the line can be obtained by evaluating its area.
- Line edge noise: This characteristic is also called line raggedness. Line raggedness is a shift of a black and white line boundary relative to the ideal boundary line. The ideal boundary line is the best fitted line passing through most of the edge dots. Dispersion or the appearance of dots near the edge of the full line is the result of bleeding of the colors during the printing process. Data on line raggedness can be obtained by evaluating its perimeter.
- Line sharpness: This is a cross-section profile of the line edge describing the characteristics of transition from black to white, that is, the transition from full color to the color of the printing substrate [22]. A sharper, that is, sudden transition on the edge indicates a higher degree of line sharpness as well as higher quality reproduction. In blurry, softer edges, the transition from full line color to the color of the printing substrate is gradual, that is, smoother.
The quality of text reproduction is evaluated based on the edge degradation, fidelity of the character shapes and uniform ink layer [23] which is manifested in the touching, breaking and smearing of text characters, and it significantly influences the legibility of the text. In accordance with the evaluation of the line, an examination of the text can also be performed on the area and perimeter of each character. This will show whether the smearing or some other ink spreading mechanism has modified the shape of the characters and to what extent. Acceptable text quality is defined based on the acceptable tolerance of the area and perimeter. Tolerance is defined in percentages in relation to the referent value measured in the digital template.
Imaging-based research methods allow visualization, inspection and quantification of image data, which are necessary for objective quantitative print quality analysis [24]. Image analysis methods serve a crucial role in the print quality determination and have had tremendous growth in the past decade [25]. The print quality of the fine elements can also be judged by visual evaluation based on comparison of the images, captured on printouts using an image analysis system [26].
3. Experimental Methodology
The goal of this study is to determine the influence of printing substrate on quality reproduction of fine elements such as thin lines and small text sizes in order to compare quality reproduction parameters and optimization of the production process. The study was conducted by evaluating the most important parameters of line and text quality reproduction, and those are line edge noise, line sharpness and uniformity of density. The research framework describing the purpose and process of research is shown in Figure 2.
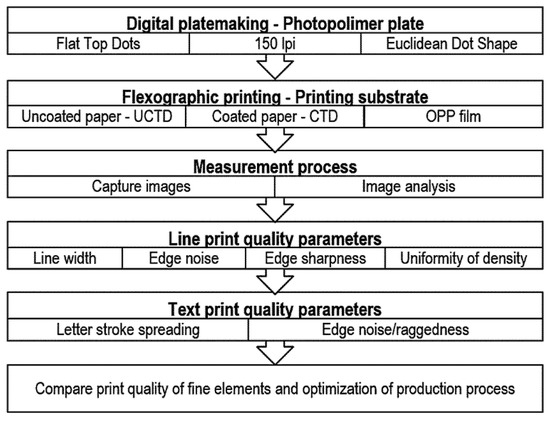
Figure 2.
Research framework.
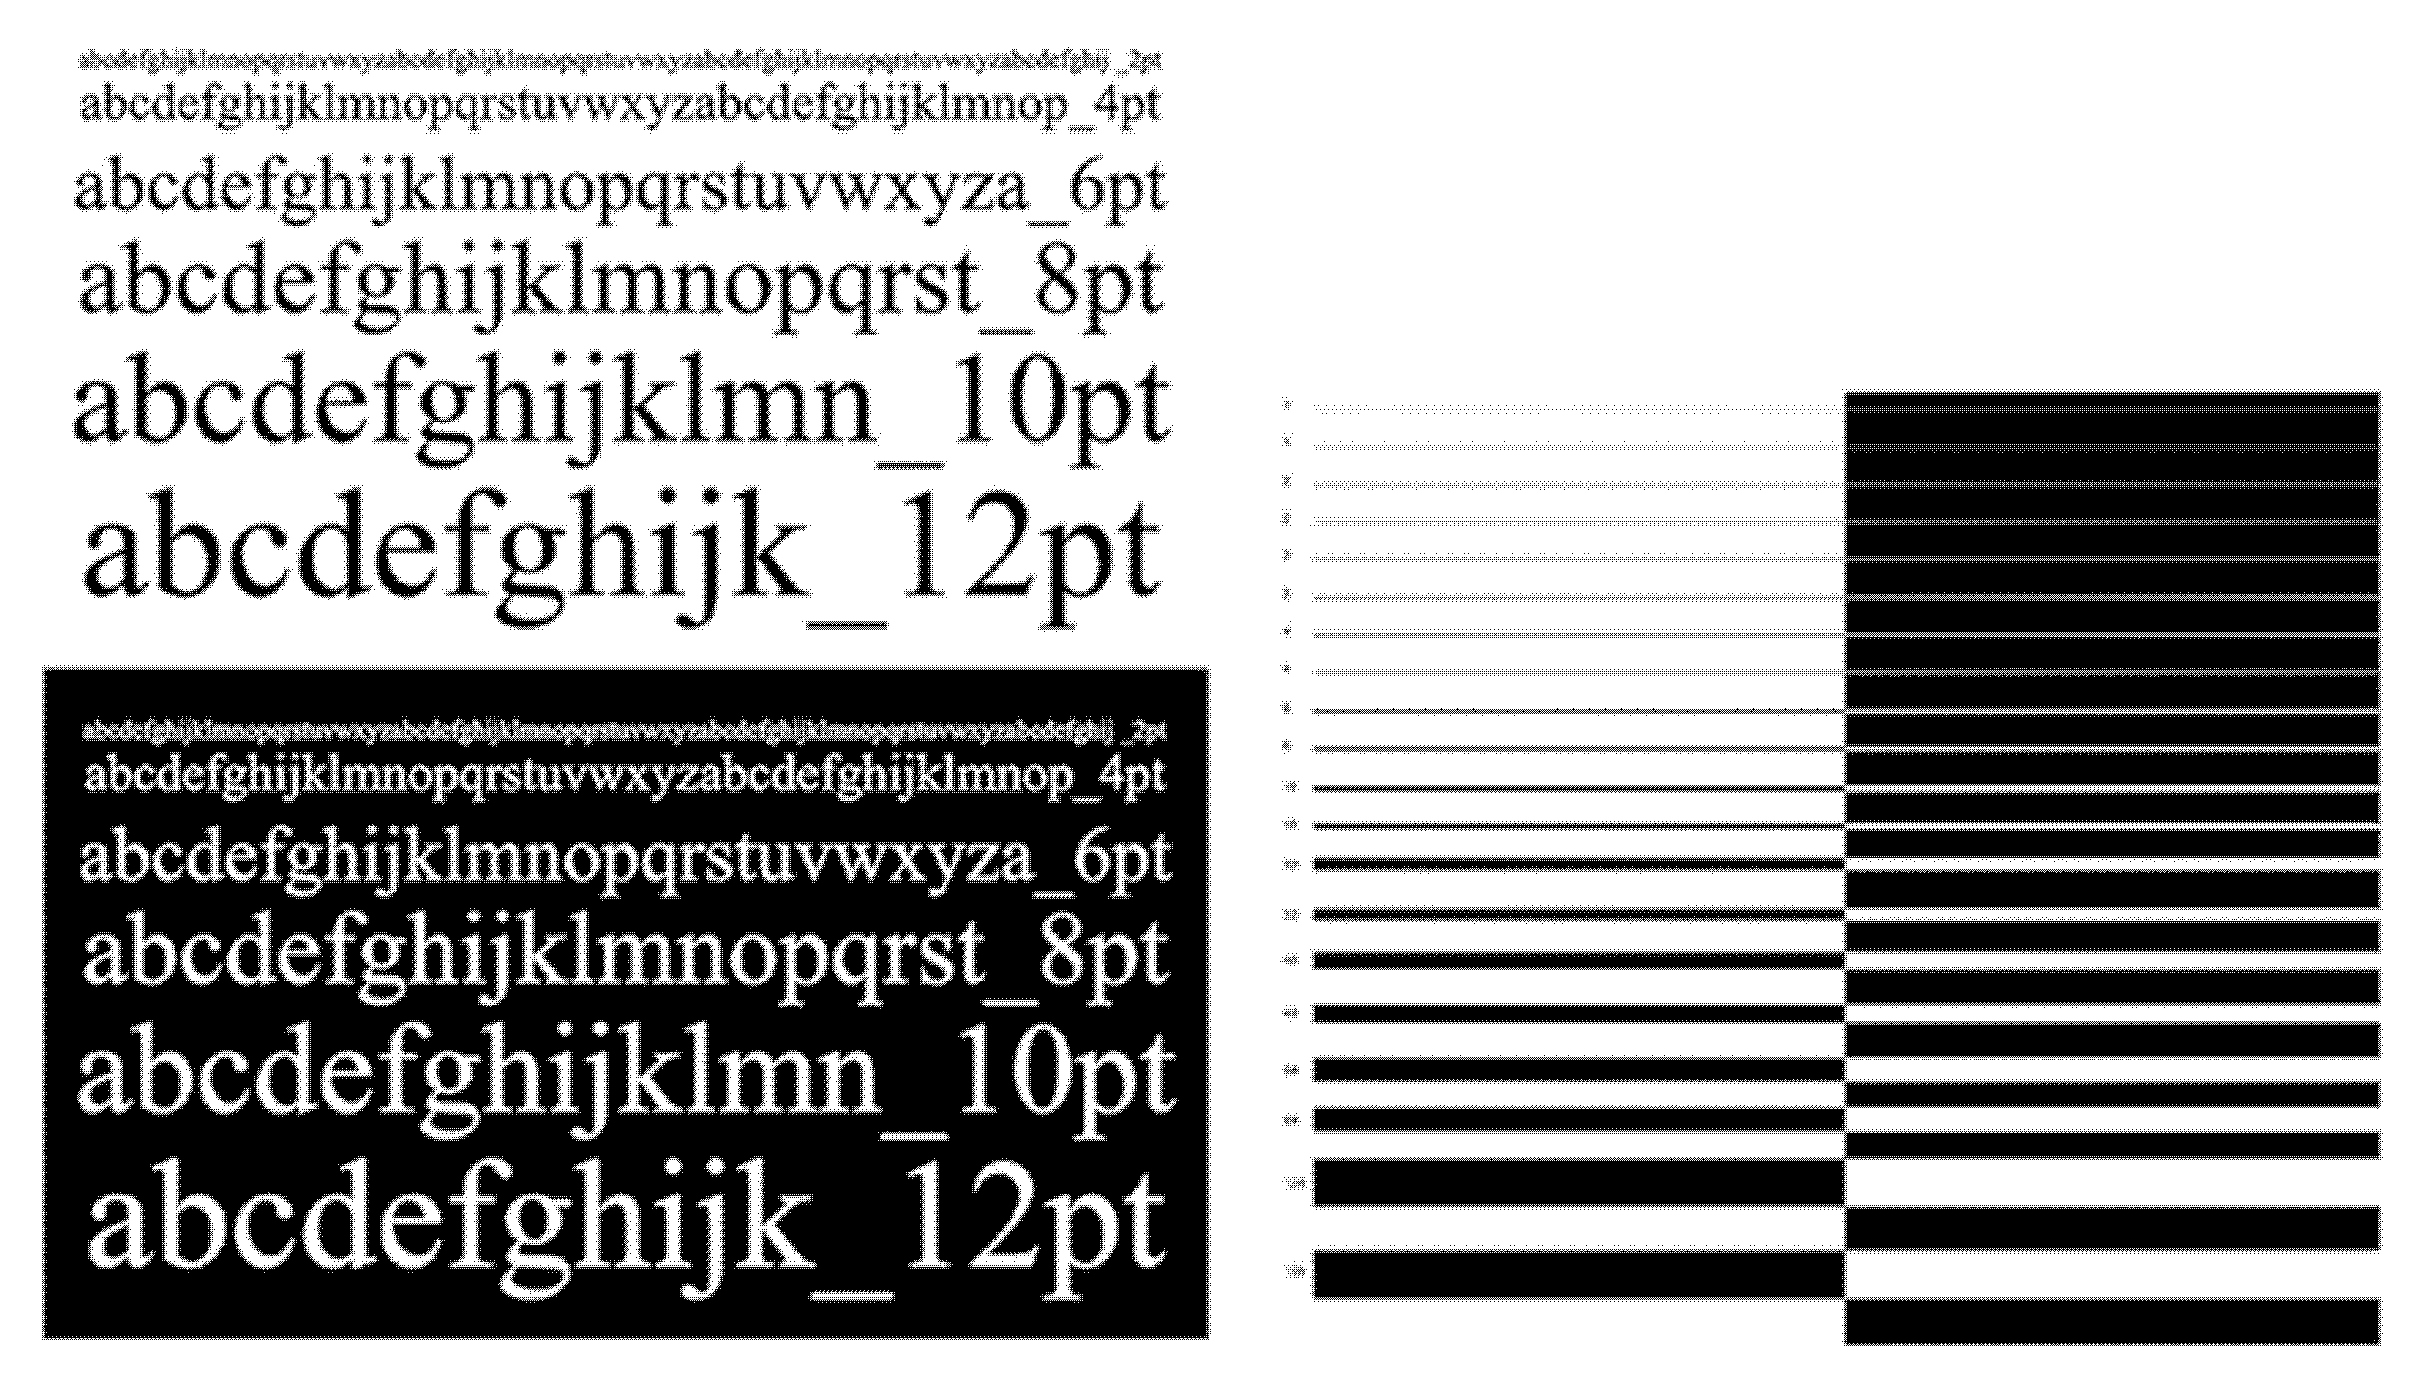
The experimental part of this paper begins with the creating of a test image designed to enable the evaluation of the quality reproduction in fine elements, by using acceptable and validated scientific methods and research techniques. The test image was not newly designed. Instead of that, a standard test form Kodak_NX_Target_v10 provided by the equipment supplier in 1-bit tiff document was used. The test image is monochrome, and all evaluated elements of the testing image have a solid tone, that is, 100% surface coverage. A part of the test form, which served for the analysis of fine elements, contains the following elements (Figure 3):

Figure 3.
The part of the test form for analysis of line and text print quality in positive and negative shape.
- serif text 2–12 pt in positive and negative shape
- line width 1–128 pixels at 2400 ppi in positive and negative shape (0.01–1.36 mm)
The positive version of the shape used dark colors for the front elements on a light background, and the negative versions of the shape used light colors for the front elements on a dark background. The following parts of test image are used for the analysis of fine elements: 85 µm and 170 µm line thickness, and 6 pt and 8 pt text size.
The flexographic photopolymer printing plate used for this research was the Kodak Flexcel NX plate (hardness acc. to DIN 53505: Shore A is 73) without advanced DigiCap NX patterning of the surface on the polymer plate. The characteristics of Flexcel NX platemaking technology [27] include a flattened top of the halftone dot which requires a light impression and, in such way, enables quality transfer of ink from the printing plate to the printing substrate [28].
Plate-making process specification:
- CtP device: Kodak Trendsetter NX;
- Resolution: 2400 dpi;
- Photopolymer: Kodak Flexcel NX Digital Plate;
- Plate thickness: 1.14 mm;
- Base layer thickness: 0.125 mm;
- Line ruling: 150 lpi;
- Screen angle: 37.5°;
- Screening type: conventional AM, Euclidean dot shape.
A six-color flexo printing machine Nilpeter FB4200, max printing width 420 mm, was used for printing. Printing was performed using the principle “from Roll to Roll”, with a printing speed of 60 m/min, applying UV cyan ink. UV inks have a number of good printing properties: almost 100% of transferred color is used for creating ink film; smaller anilox volume is needed in comparison with water inks; the ink does not change consistency; due to lower viscosity there is less color bleeding; the ink can remain in the inking system for a longer time without requiring to be cleaned. The optimal anilox line screen for printing is determined in line with halftone screen and minimum dot size [29]. During the printing process, a substrate passes between the plate cylinder and the impression cylinder. The space between them must be optimal to give the proper printing pressure [30]. The gap value or the nip engagement between the plate cylinder and impression cylinder for the lightest printing pressure is one three-thousandth of an inch, or 75 µm (0.0762 mm). The next level of pressure is a higher pressure, and the gap value is one six-thousandth of an inch or 150 µm (0.1524 mm). During the printing experiment, the test form was printed on three different printing substrates while other printing parameters, i.e., speed, pressure level, anilox roller characteristics and UV curing system settings, were kept to constant.
Printing specification:
- Flexo printing machine: Nilpeter FB4200;
- Printing speed: 60 m/min;
- Flexo ink: PULSE SLM 318 UV cyan;
- UV Curing: UV Lamp-Mercury Wavelength, 600 WPI output power (Watts Per Inch);
- Printing width: 330 mm;
- Printing length: 490.00 mm;
- Anilox line count: 405 l/cm (1020 lpi);
- Anilox cell volume: 3.1 BCM (Billion Cubic Microns);
- Plate mounting tape: 3M E315, 0.38 mm thickness, Medium Soft;
- Substrate: uncoated paper, coated paper, OPP film.
The amount of ink delivered by anilox roller is controlled by a pattern of small precisely sized dimples, or cells. Cell volumes are typically expressed in billion cubic microns per square inch (BCM/in2). The power and the position of the UV lamps did not change for the whole printing experiment. The distance to the printing substrate is constant across the entire web width and adjusted in line with manufacturer’s instructions and recommendations.
Specification of the three chosen printing substrates:
- Uncoated, white, machine-finished label paper HERMA white (601), grammage 72 g/m2, opacity 83% (abbreviation UCTD).
- White label paper, semi-gloss coated on one side HERMA extracoat (242) grammage 80 g/m2, opacity 86%, area gloss 30% (abbreviation CTD).
- White, high gloss, opaque OPP (Oriented Polypropylene) label film Treofan décor -LWD, thickness 38 μm, unit weight 23.5 g/m2, opacity 82%, gloss 65%, one side corona treated by the film manufacturer, surface tension of 40 dyne/cm. (abbreviation OPP film).
In order to be able to compare the results of the research, it is important for the printing experiment to take place under controlled printing conditions. Each of the chosen substrate types belongs to an individual quality group regarding their characteristics. The control of CIELCH cyan values on prints for three groups of printing substrates is the basis for color matching of prints with target values and allowed tolerances in accordance with ISO 12647-6 [31]. Color matching with the mentioned standard is based on the difference in the color tone ∆hab, based on CIELCH values for the solid tones of the process colors.
Due to the analysis of deformation in fine elements, it is necessary to capture the chosen areas on the prints of all the three printing substrates. Digital Microscope Dino-Lite AM4000 is used for this purpose, with a resolution of 1.3 pixels and in-built LED light which enables a better display of the captured object. Samples for the analysis are captured with 200× magnification and 1280 × 1024 resolution. The software ImageJ 1.47 was used for processing and analysis of the microscopic images; different image analysis techniques were used for evaluation. Measurement results must be shown in real values (mm, µm, …). Therefore, it is necessary to set a correspondent ratio based on known values at the same magnification while doing the measuring. A ratio 500:1 is set for image analysis, i.e., 500 pixels amounts to 1 mm, which gives the image size of 2.56 × 5.12 mm. When evaluating the area and the perimeter of fine elements in the ImageJ software, the threshold method of image processing was used. Thresholding is a method where the image converts from color or grayscale mode into a binary image mode. Then, the red threshold color in the image was used to measure the area and perimeter of the evaluated elements. The following values of color threshold in HSB color space were used: in positive shapes (Hue 0–255; Saturation 80–255; Brightness 125–255), and in negative shapes (Hue 0–255; Saturation 80–255; Brightness 185–255).
The measured results for the particular imprints do not depend on the number of measurements and are valid for the specific measurement condition, especially color threshold settings. However, during the printing process, additional deformations of fine elements occur, which would certainly give different results, and are not the subject of research in this paper. Extremely often it is a variation of certain parameters of the printing process that change during printing, especially during the printing of large print runs. Fine element deformation in the printing process due to wear of soft and flexible material of photopolymer printing plates is a highly common occurrence, which is a good topic for further research.
Evaluation of print quality of fine elements includes the following parameters in this research:
- Line quality: line width, edge noise/raggedness, edge sharpness/smoothness and uniformity of ink layer density.
- Text quality: letter/character stroke spreading and text edge noise/raggedness.
The values of area and perimeter of fine elements measured on three types of printing substrates are compared with target values. Target values are ideal values of the observed parameters measured on digital halftone screening document. Those values are used as a reference for determining positive and negative deviations in percentage regarding the type of printing substrate. Diagrams showing changes in relation to 0% value reference are designed based on percentage deviations. Higher deviation implies a lower quality of reproduction.
4. Results and Discussion
All the important parameters of printout quality reproduction of line and text elements were researched, such as edge degradation and uniformity of color density.
4.1. Analysis of Line Deformation
Line deformation on the imprint is researched based on three printed lines’ physical characteristics: line area, line perimeter and line width. Two types of line width were chosen for the analysis: 85 µm and 170 µm. The values of area and perimeter for 2.56 mm line length and line widths are shown in Table 1.

Table 1.
Results of measuring of area, perimeter and width for two lines thickness of 85 µm and 170 µm printed in positive and negative shape on three different printing substrates.
Line width can be directly connected with line spreading, which was obtained by measuring line area. All printed lines show a deviation from target values. This spreading of the line in the positive shape leads to an increase in the thickness of the line, and in the negative shape to the closing of the line. Higher deviation of line width occurs in the negative shape (−23 µm) in relation to the positive shape (+11 µm for 170 µm line thickness). With a thicker line, the value of the total deviation in negative shape increases, and in the positive shape it decreases. For example, deviation for 85 µm line thickness in the positive shape on coated paper is +16 µm, and for the line of 170 µm the deviation amounts to +7 µm (Table 1). The average value of measured line width is correspondent with the measures of their area. This only confirms the authenticity of the measuring results.
A more detailed insight into the print quality of lines printed in positive and negative shapes is shown by percentage deviation of line area and line perimeter from target value (Figure 4). The dotted line in the diagram shows the target value.
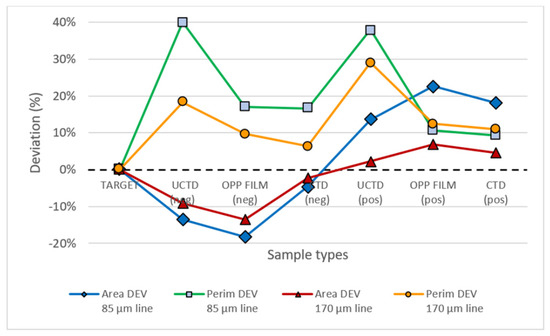
Figure 4.
Deviation of area and perimeter (%) for lines thickness of 85 µm and 170 µm printed in positive and negative shape on three different printing substrates.
Lines printed in positive shapes for all three printing substrates indicate mildly positive deviations of line area, and in negative shapes there are mildly negative deviations from the target area (Figure 4). The biggest percentage deviation from the target value can be seen on OPP film (22.7% in positive shape, −18.2% in negative shape for line width of 85 µm). The reason is the surface characteristics of the material, which is non-absorbent; therefore, the ink spreads only on the surface of the material. It can be noticed that absolute line area increases with increases of line thickness, but percentage deviation decreases for all three printing substrates. The increase in line thickness has the least influence on the change in deviation on coated paper in negative shapes (−4.5% for line thickness of 85 µm and −2.3% for line thickness of 170 µm).
Completely different tendencies in percentage deviations can be seen in the results of line perimeter measurements. Line perimeter is used to evaluate line raggedness, that is, line edge noise. Therefore, an assumption can be made that higher line perimeter values are indications of the higher line raggedness characteristics, which can be related to the absorbency of the printing substrate. All perimeter measurements show a positive deviation from target with significantly higher deviations on uncoated paper (over 38% regarding the target in positive and negative shapes for 85 µm line thickness). Although the OPP film is a completely non-absorbent printing substrate, there are no significant differences in the values of percentage deviation between coated paper and OPP film. It refers to each observed line thickness for each shape separately, for both positive and negative shapes (up to 1.5% at 85 µm line thickness and up to 3.5% at 170 µm). Significantly larger deviations on uncoated paper are the result of surface irregularities of the printing surface, which leads to the conclusion that the rough surface due to its better absorption characteristics has a favorable effect on the irregular spreading of lines, i.e., on the appearance of edge noise.
The line quality in negative shapes is influenced by the same parameters as in positive shapes. However, the main characteristics of the line quality in a negative shape is openness. Thinner lines printed in negative shape are particularly sensitive to filling, which influences their visibility. Increased line edge noise, ink spreading on printing substrate and blurriness are the main reasons for the decrease of line quality in a negative shape. Ink spreading influences the line edge sharpness, which results in blurry edges.
Figure 5 compares the quality reproduction of lines in positive and negative shapes. The line with least edge noise and sharpest edge is a line printed on coated paper, and it is visually the most homogeneous, which is directly related with the result of perimeter measurements. Significantly bigger edge raggedness on uncoated paper can be particularly easily noticed, visually.
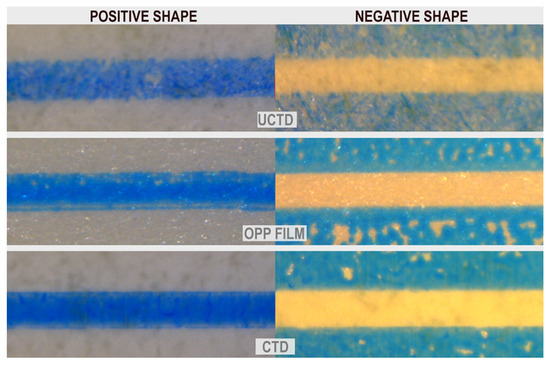
Figure 5.
Visual comparison of line edge noise 170 µm in width printed in positive and negative shapes on three different printing substrates.
4.2. Analysis of Text Deformation
For the analyses of quality reproduction of text, the area and perimeter of lowercase characters “r” and “s” were measured for two text sizes, 6 pt (2.15 mm) and 8 pt (2.82 mm). The values of area and perimeter of characters together with their target values are shown in Table 2.
Table 2.
Results of measuring of area and perimeter for two text sizes of 6 pt and 8 pt printed in positive and negative shapes on three different printing substrates.
The biggest change in text area for both observed text character, “r” and “s”, was noticed on OPP film (similar to cases of previously considered line area characteristics) which can be seen in the highest value of character area in a positive shape (0.66 mm2 for character “s”), and the lowest in a negative shape (0.50 mm2 for the same character “s”) (Table 2). Higher text character perimeter values indicate higher line raggedness. The highest values for this print quality parameter were obtained on uncoated paper (8.98 mm), then OPP film (8.24 mm) and coated paper (8.08 mm). Those text perimeter distinctions between the samples printed on OPP film and coated paper are extremely slight (0.16 mm in negative shape and 0.1 mm in positive shape).
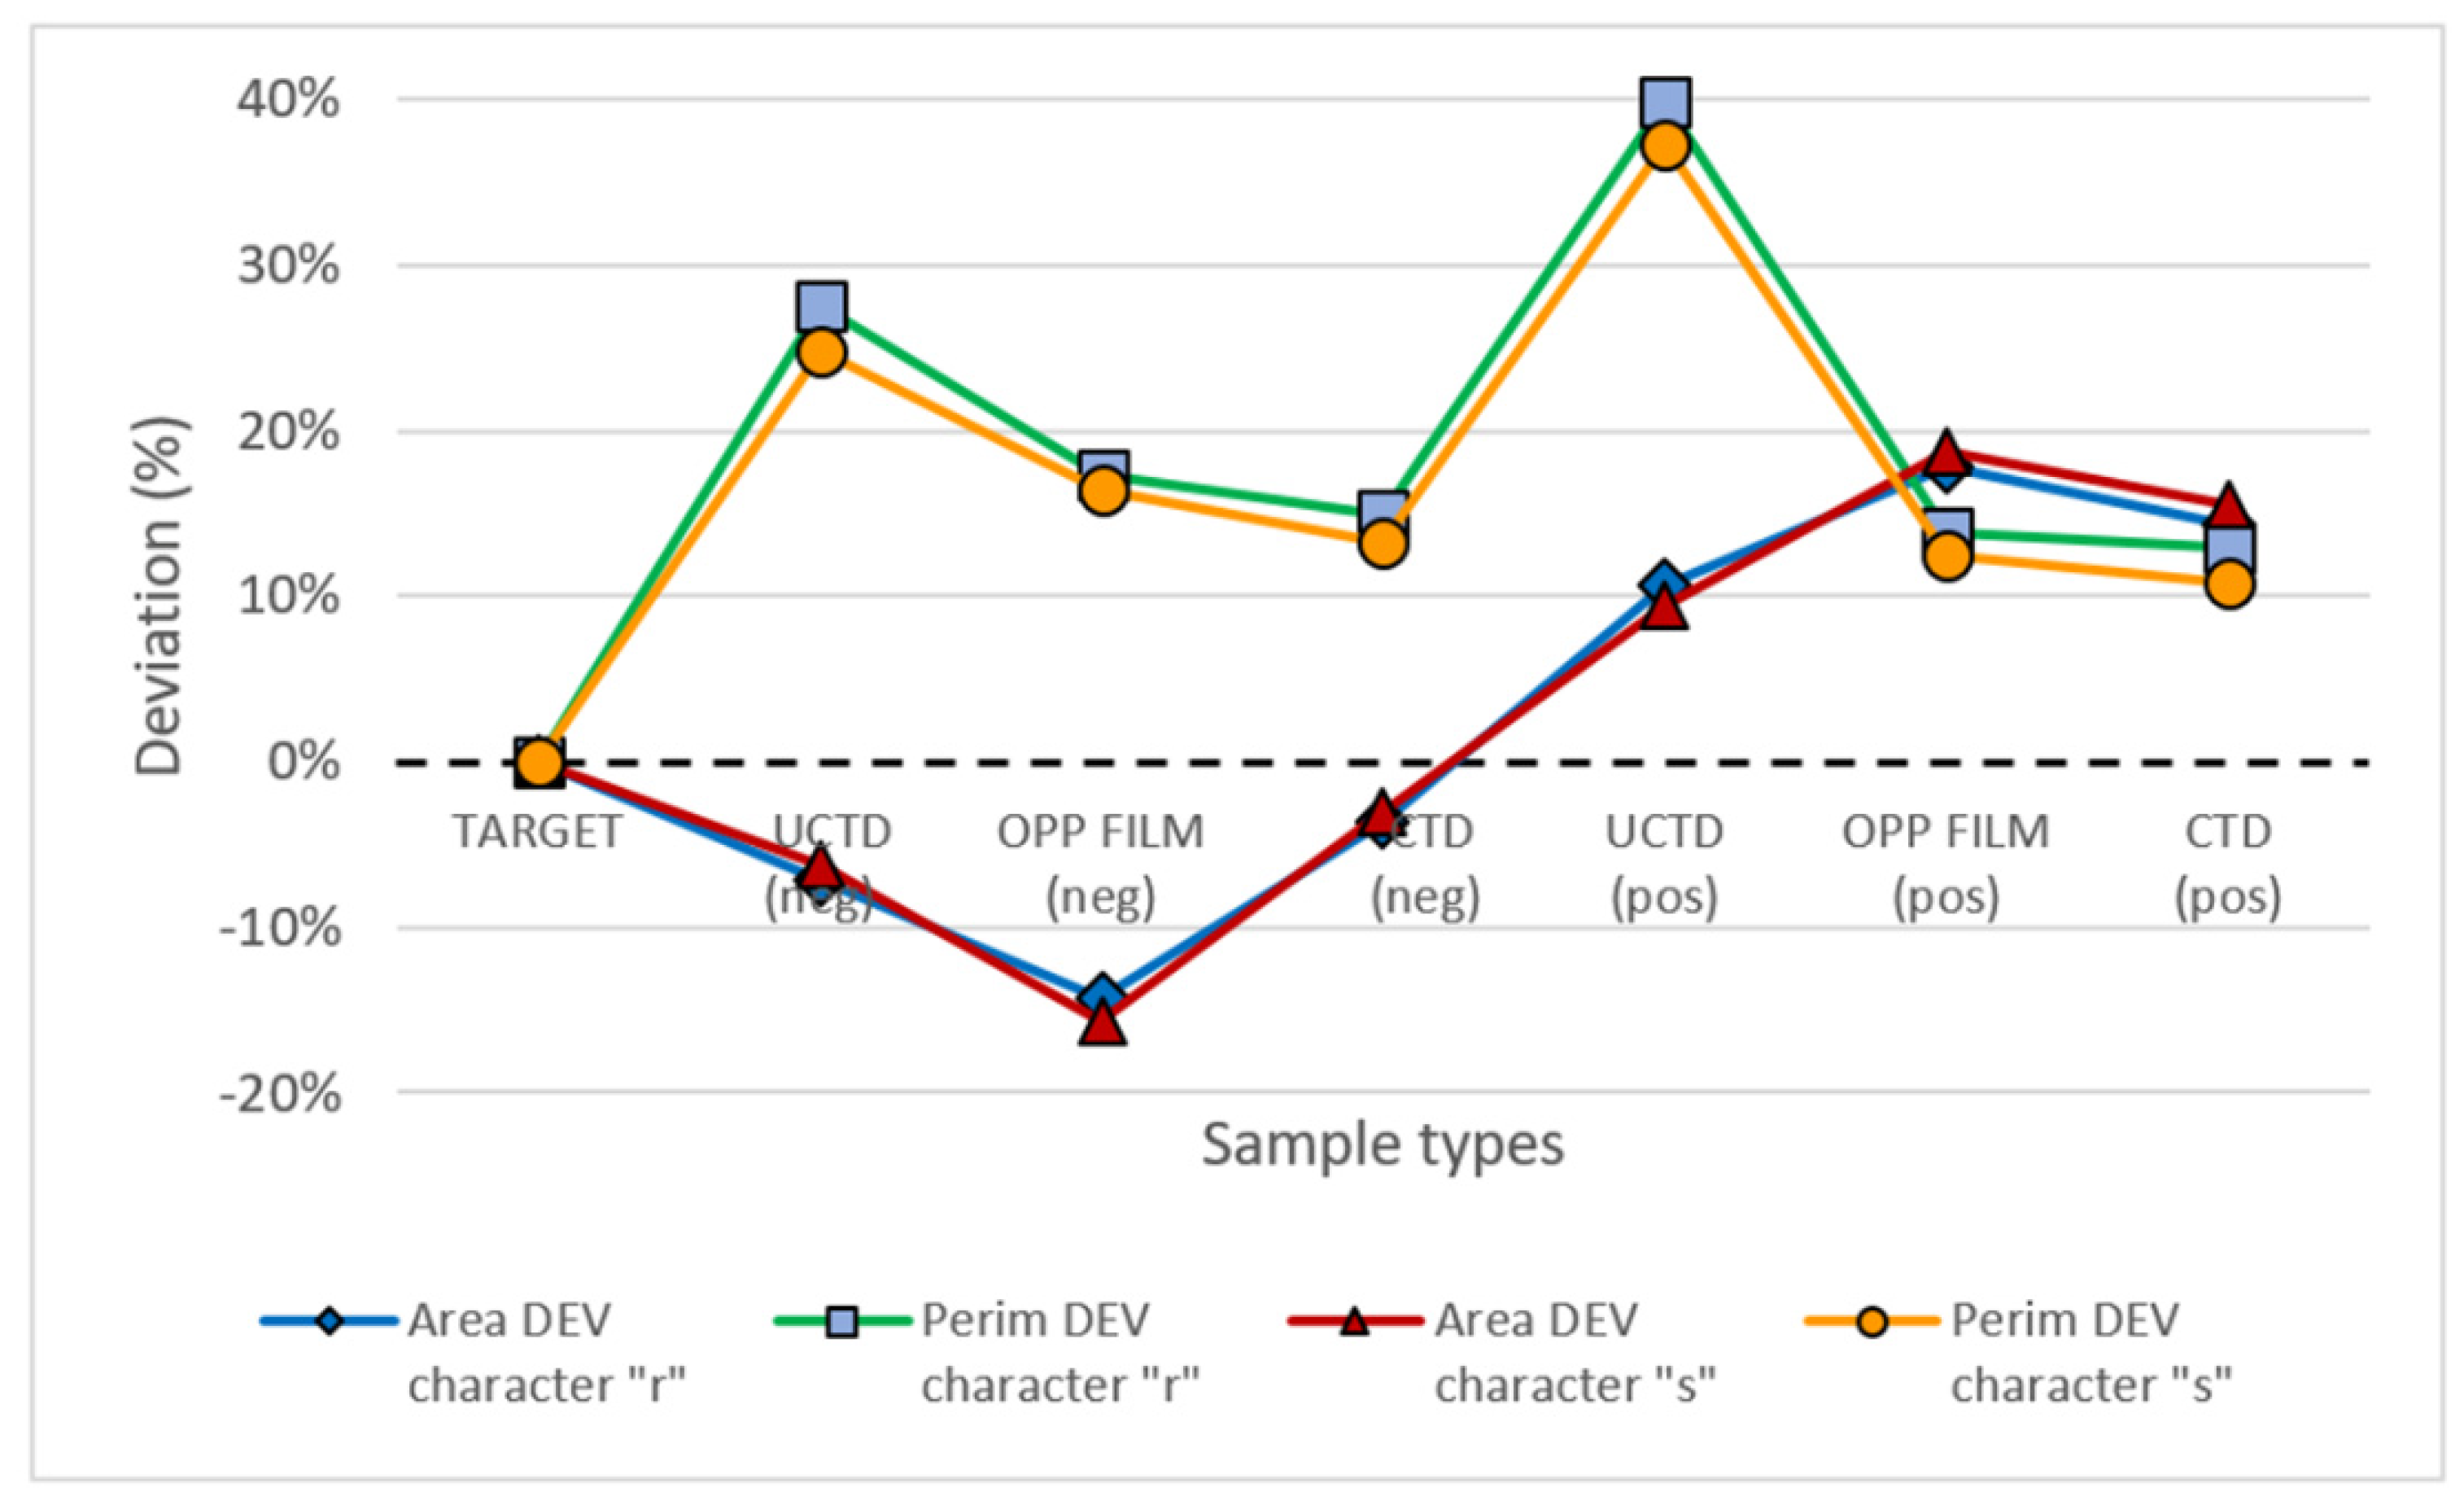
The relative values of deviation of text area and text perimeter in percentage from target value give a complete insight into the quality of reproduction (Figure 6). The dotted line shows the target value.

Figure 6.
Deviation of area and perimeter (%) for text characters “r” and “s” of 8 pt size printed in positive and negative shape on three different printing substrates.
Although the surface of the text character “s” is 20% bigger than the surface of the text character “r”, the difference in area deviation percentage, but also in the perimeter between the analyzed letter characters (Figure 6), is completely negligible (on OPP film and coated paper it is up to 3%, and on uncoated paper it is up to 5%). This can be seen on line diagrams which are identical for individual parameters, text area and text perimeters.
Smaller deviations of area values from target value on paper, especially on coated paper (up to −3.6% in negative shape), are associated with good absorption of paper as a printing substrate; therefore, the ink quickly penetrates into the structure of the material and spreads less on the surface of the material [32]. In text deformation in a negative shape, mild closures of characters occur due to the spread of ink. For this reason, the character area is smaller than in the text deformation in a positive shape.
Perimeter analysis assesses the edge degradation of the characters, which is extremely important for visibility, fidelity character shape and text legibility. The deviations from the target value on coated paper and OPP film are extremely similar (up to 3% in negative shape, and 1.5% in positive shape) and significantly smaller than on uncoated paper, which also means smaller edge raggedness of the text (Figure 6). The analysis of the results shows that the relative raggedness of the text (percentage deviations) on uncoated paper increases as the area of the evaluated element decreases, i.e., with a decrease in text size (from 8 pt to 6 pt) and with the decrease in stroke length of the characters (character “s” has a longer stroke length than character “r”). The same trend is visible also on the other two investigated printing substrates. This analysis confirms why quality reproduction of a smaller size text is extremely difficult to achieve, particularly in absorbent printing substrates.
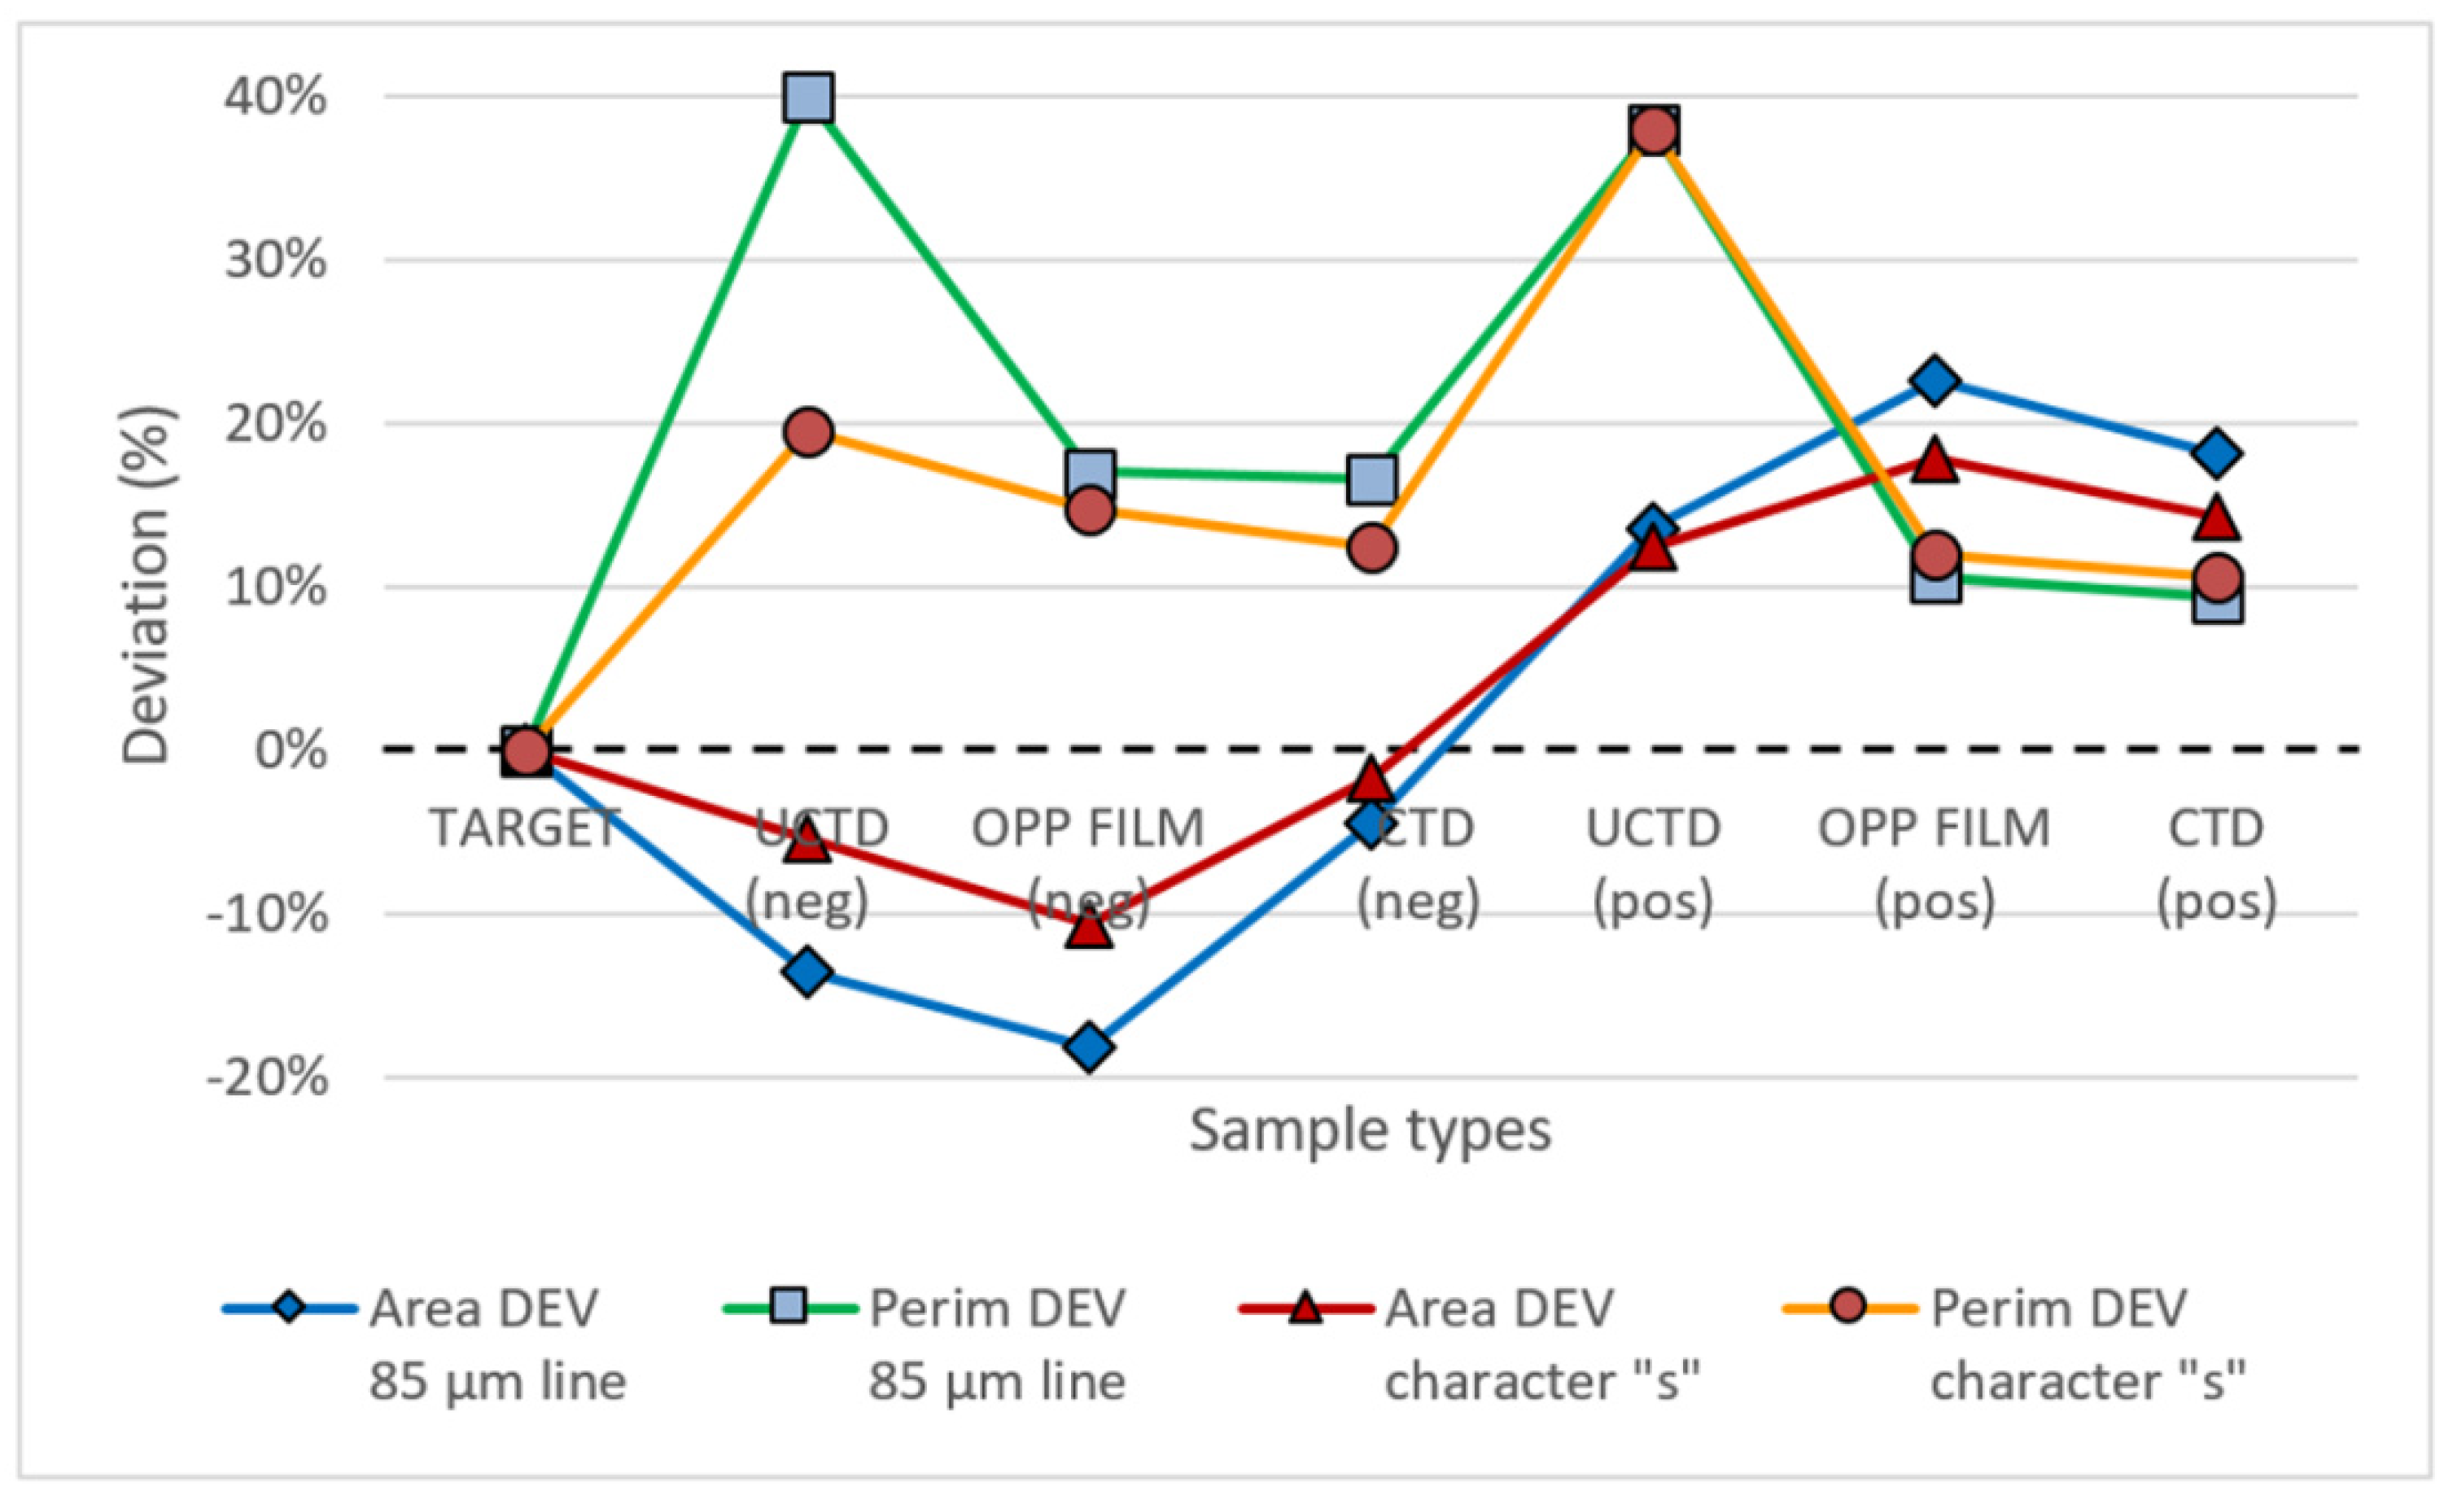
Additional comparison of percentage deviations between the text and lines will give an insight into the general behavior of fine elements during the printing process on three types of printing substrates. Figure 7 compares the results of percentage deviations and perimeter of 85 µm lines and 8 pt text size from the target value.

Figure 7.
The comparison of area and perimeter deviation (%) for character “s” 8 pt size and line 85 µm thickness printed in positive and negative shape on three different printing substrates.
Line diagrams for each parameter, area and perimeter show that percentage deviations of the line and text follow the same trends. There is more data dissemination in the negative shape. In most cases, the deviation is up to 10%, which means that the reproduction of fine elements can be described using common positive and negative deviations for all three types of printing substrates. Therefore, the deformation of fine elements is directly connected to the length of stroke, in both the printouts of line and text.
Raggedness (percentage perimeter deviation) is still somewhat bigger in lines than in text characters, especially in the negative shape. This can be connected with characters which have curved strokes, and for that reason compensate ink spreads more easily.
The text with the most edge noise along the stroke (edge raggedness) is printed on uncoated paper which is visually noticeable (Figure 8, upper images), and it is directly connected to the results of perimeter measurement. Excessive noise at the edges of the strokes of the characters makes the text blurry and unclear, reducing its visibility and legibility.
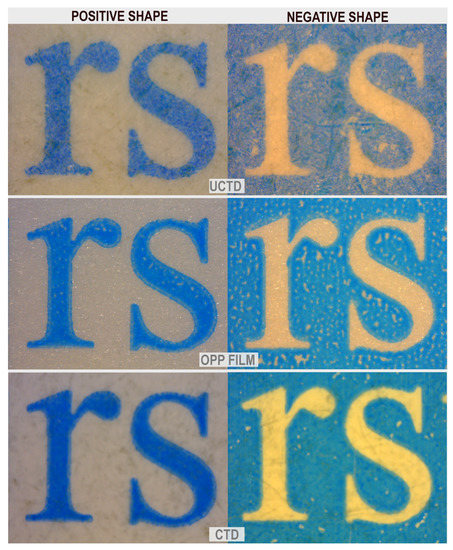
Figure 8.
Visual comparison of edge degradation for text size of 8 pt printed in positive and negative shapes on three different printing substrates.
4.3. Line Sharpness
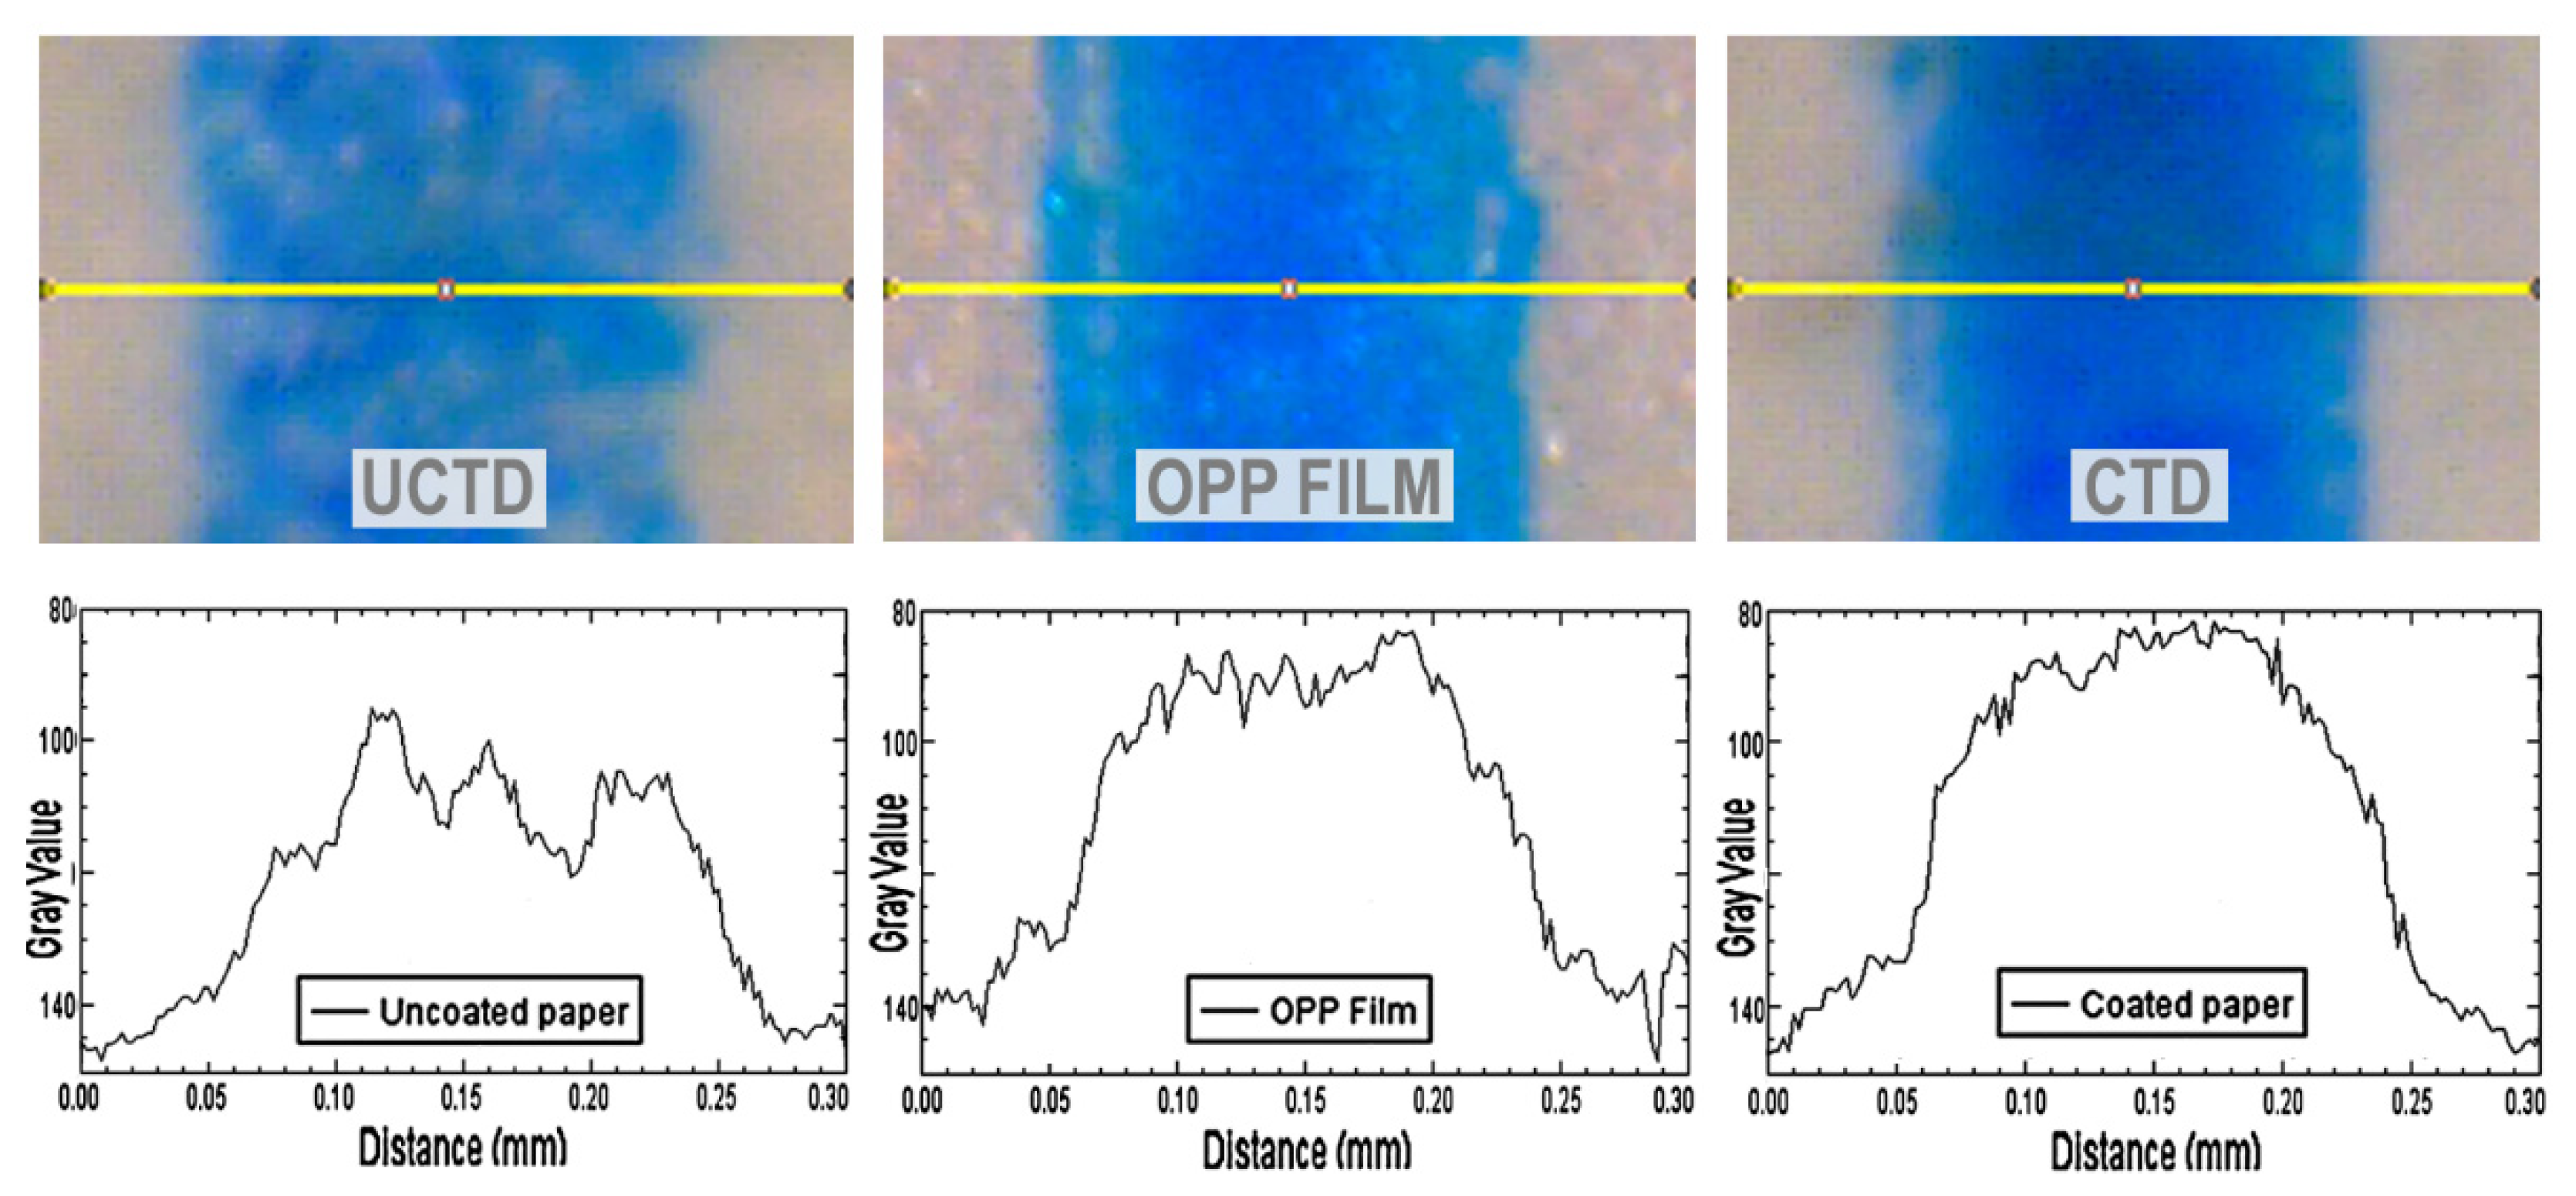
ImageJ software (Plot Profile Tool), which generates a 2D line profile based on microscopic images, was used for the analysis of line edge sharpness. First, a line is drawn perpendicular to the stroke to mark the area for the analysis (Figure 9, upper images), and then a 2D line profile is created based on the color density. The X-axis represents the distance along the line and the Y-axis is the pixel intensity. Figure 9 displays a two-dimensional graph of the intensities of pixels along a yellow line (Figure 9, lower images) for a line of 170 µm width for three printing substrates. The graph curve shows grey values (grey levels of 80–150) along the entire measurement length, which is the same for all three printing substrates, and amounts to 300 µm (0.30 mm).
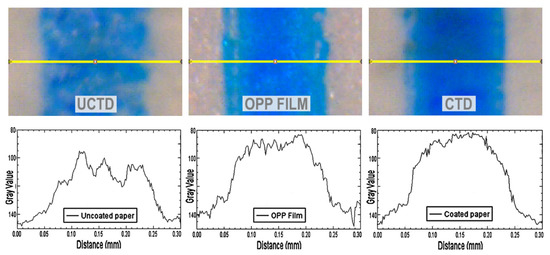
Figure 9.
Two-dimensional profile of line 170 µm width for three printing substrates.
Sharpness of the printed element actually represents the evaluation of sharpness or smoothness of the edge in the analyzed element [33]. According to this, the line sharpness is defined using the distance needed for the transition from the lightest to the darkest edge level. In this study, the transition to gray level 95 was analyzed as this is the highest value for uncoated paper. This distance measured for uncoated paper is 80 µm, while for the other two types of printing substrates it amounts to 60 µm, which is directly related to line edge sharpness (Figure 9). A smaller transition means that the sharpness of the printed element is greater (lines on uncoated paper have the least sharpness). A significantly lower maximum value in graphs for uncoated paper is an indication of lower color density. Edge sharpness is highly important for line elements, especially for reading line codes since they directly influence the reading speed.
4.4. Uniformity of Line Ink Density
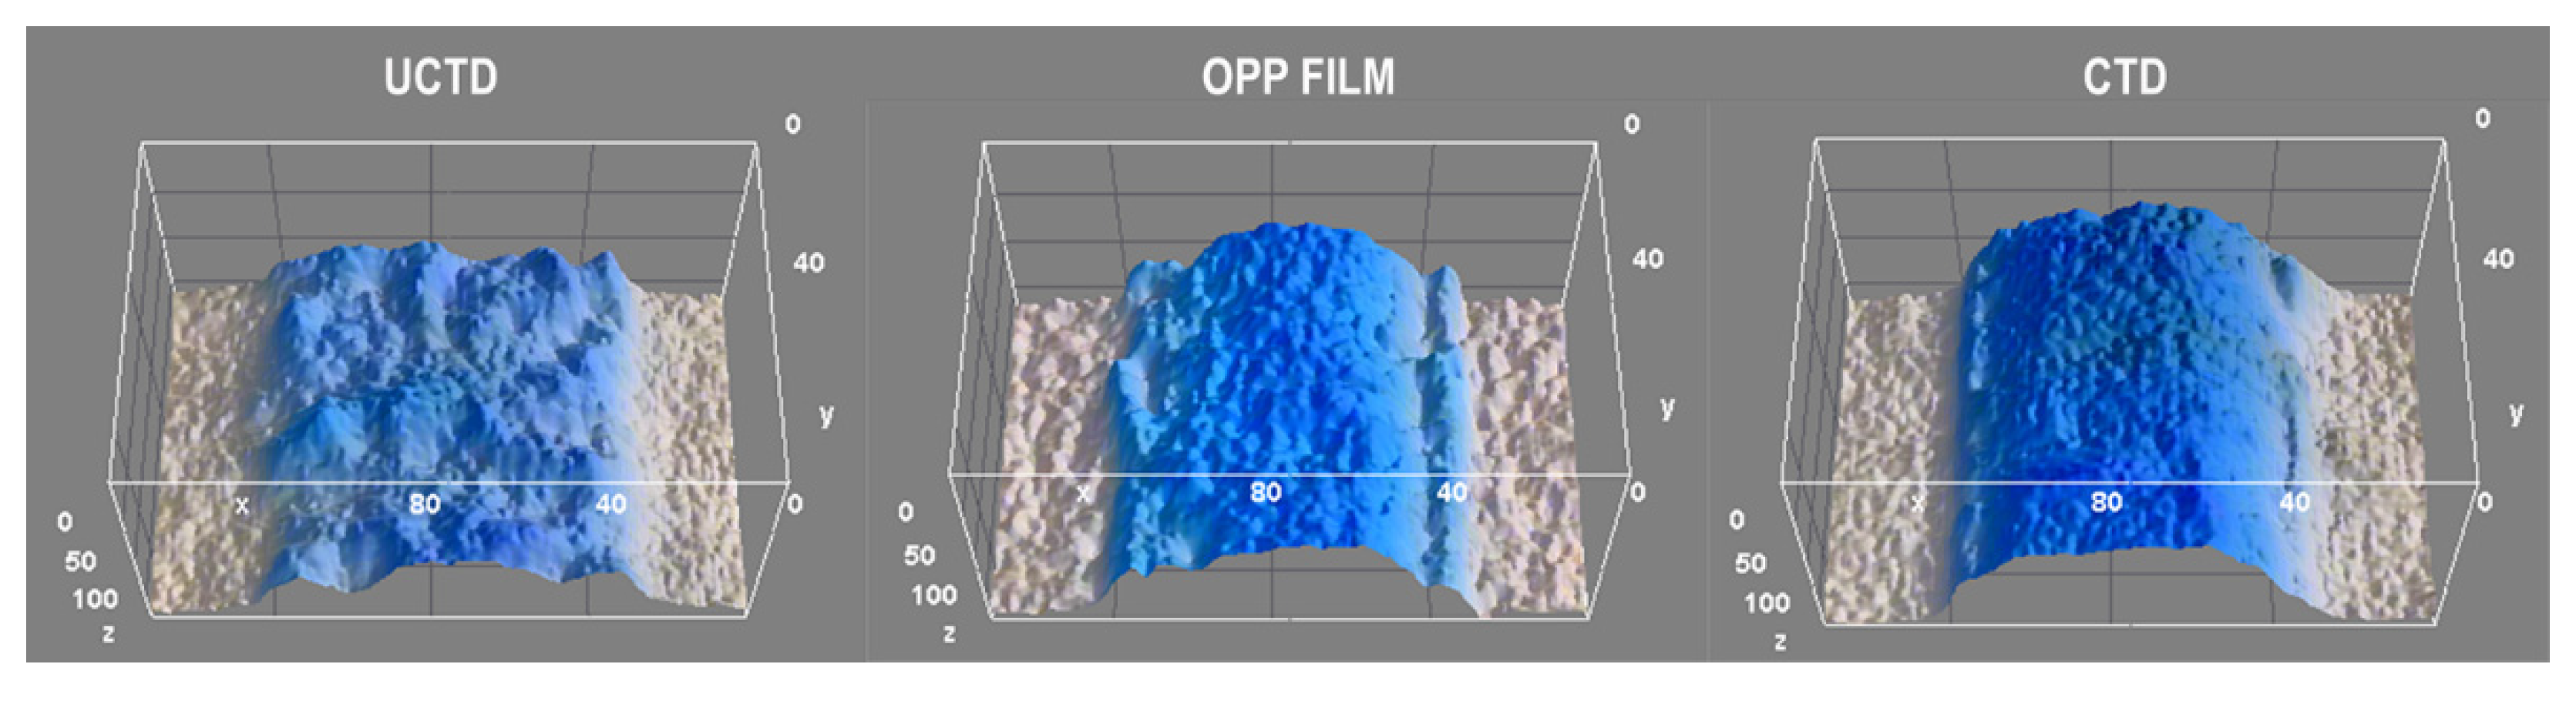
The analysis of the ink layer uniformity for the solid tone of cyan was performed by visual evaluation of microscopic images from the print based on a 3D topographic representation of the cyan color density. Microscopic images of the evaluation elements are analyzed through a 3D rendering program (tool: Interactive 3D Surface Plot) that transforms density into proportional height to see just how thick the ink film is. The average value of solid ink density (SID) during the printing process for each printing substrate amounted to: SID (uncoated paper) = 1.05, SID (OPP film) = 1.24, SID (coated paper) = 1.41.
Visual evaluation is based on the number of dominant peak protrusions on the printing surface of each line that are visible on the 3D view of the observed samples [34]. Uncoated paper (Figure 10, left image) shows a significantly higher degree of line non-homogeneity, i.e., non-uniformity of color density in relation to the remaining two printing substrates, which is clearly visible in a larger number of dominant peaks. This non-homogeneity is characterized by gaps that occur on the line surface due to incomplete coverage of the printing substrate, i.e., lower color density. This can also indicate that the surface tension of the printing ink and the surface tension of the substrates are not optimally adjusted to each other. Uniform ink layer on coated paper is insignificantly higher in relation to OPP film.
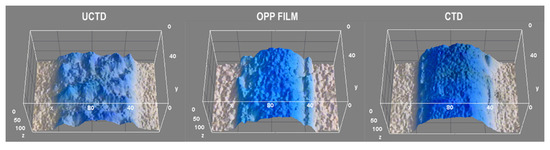
Figure 10.
3D topographic view of line 170 µm width at three different printing substrates.
The mentioned results for edge sharpness and the uniformity of the line color density can be fully attributed to the text since this concerns a correspondent evaluation of fine elements in an identical printing process.
5. Conclusions
Analysis of measurement results indicates correlation in the deformation of lines and text on printouts. Correlation in deformation of fine elements is visible in line diagrams and is related to the type of printing substrate and the type of reproduction mode in positive or negative shapes.
Spreading of fine elements on printouts was estimated based on their area measurements. The biggest deviations from target were recorded on OPP film (22.7% in positive shape, −18.2% in negative shape). Therefore, fine elements printed in the positive shape have the tendency to expand, and those printed in the negative shape have the tendency to close. Deviation of line area in relation to the text area is negligibly small for all three printing substrates (up to 8% in a negative shape and up to 5% in a positive shape). Ink spreading can have a negative effect on the print quality of fine elements, especially tiny text in a negative shape on a colored background, which can result in poor text legibility. On uncoated paper, the ink expands more into the structure of the material itself; therefore, the surface spread of the ink is less.
Edge degradation of fine elements on printouts was evaluated based on perimeter measurements and the 2D profile plot. The analysis of both examined parameters also yielded correlating data. Significantly increased edge noise (edge raggedness) was recorded in uncoated paper (up to 40% deviation) due to easier penetration and capillary spreading of ink. The two remaining substrates show similar values (up to 20% deviation) with a slightly smaller deviation from target in coated paper. The lowest edge sharpness was recorded on uncoated paper (distance is 80 µm), and on OPP film and coated paper is it higher and amounts to 60 µm. Excessive edge noise of fine elements affects the clarity and visibility of the elements as well as the shape fidelity and legibility of the text. Percentage of area and perimeter deviation of fine element increases with the decrease of the text size and line thickness.
Visual evaluation of ink layer uniformity of fine elements on the printouts based on the number of dominant peaks showed significantly smaller homogeneity on the uncoated paper. Some unexpected uniformity of the ink layer is higher on coated paper compared with OPP film, although the ink layer on OPP film spreads only on the surface of the substrate.
It can be concluded that the coated paper showed the best results in all research parameters, which were slightly better results than those on OPP film. The analysis of microscopic images showed that the deformation of fine elements occurs due to a mechanism involving the spreading and penetration of ink. The share of each occurrence in deformation depends on the surface characteristics of the printing substrate. The evaluation of qualitative reproduction parameters has yielded important indicators that can significantly improve the production process and result in an increase in the print quality of fine elements.
Author Contributions
Data curation, D.V.; Investigation, I.M.; Methodology, D.Č.; Visualization, K.H. All authors have read and agreed to the published version of the manuscript.
Funding
This research received no external funding.
Institutional Review Board Statement
Not applicable.
Informed Consent Statement
Not applicable.
Conflicts of Interest
The authors declare no conflict of interest.
References
- White, A. High Quality Flexography: A Literature Review; Pira International: Leatherhead, UK, 1992. [Google Scholar]
- Milošević, R.; Kašiković, N.; Dragoljub, N.; Stančić, M.; Adamović, S. Investigation of the printing pressure level application influence on sheet-fed offset print quality. Reproduction 2013, 5, 171–176. [Google Scholar]
- Poljaček, S.M.; Tomašegović, T.; Cigula, T.; Milčić, D.; Donevski, D.; Kurečić, M.S. Effect of the post-treatment of printing plate on the quality of fine printed elements in flexography. In Proceedings of the Eighth International Symposium GRID, Novi Sad, Serbia, 3–4 November 2016; pp. 117–128. [Google Scholar]
- Leloup, L.G. Measurement and Prediction Procedures for Printability in Flexography; Numerisk Analys och Datalogi: Stockholm, Sweden, 2002. [Google Scholar]
- Ołek-Tryznowska, Z.; Rombel, M.; Petriaszwili, G.; Dedijer, S.; Kašiković, N. Influence of Some Flexographic Printing Process Conditions on the Optical Density and Tonal Value Increase of Overprinted Plastic Films. Coatings 2020, 10, 816. [Google Scholar] [CrossRef]
- Bould, D.; Claypole, T.; Bohan, M. An experimental investigation into flexographic printing plates. J. Graph. Technol. 2004, 1, 1–8. [Google Scholar]
- Bohan, M.F.J.; Townsend, P.; Hamblyn, S.M.; Claypole, T.C.; Gethin, D.T. Evaluation of pressures in flexographic printing. TAGA 2003, 1998, 41–43. [Google Scholar]
- Tomašegović, T.; Pibernik, J.; Poljaček, S.M.; Madžar, A. Optimization of flexographic print properties on ecologically favorable paper substrates. J. Graph. Eng. Des. 2021, 12, 37–44. [Google Scholar] [CrossRef]
- Kim, B.-S.; Jung, H.-C.; Park, J.-Y. Investigation on relationship between pore structure of coating layer and ink residual behavior. J. Korea TAPPI 2002, 34, 53–58. [Google Scholar]
- Rosenholm, J.B. Liquid spreading on solid surfaces and penetration into porous matrices: Coated and uncoated papers. Adv. Colloid Interface Sci. 2015, 220, 8–53. [Google Scholar] [CrossRef] [PubMed]
- Ding, F.; Hu, B.; Lan, S.; Wang, H. Flexographic and screen printing of carboxymethyl chitosan based edible inks for food packaging applications. Food Packag. Shelf Life 2020, 26, 100559. [Google Scholar] [CrossRef]
- Kipphan, H. Handbook of Print Media: Technologies and Production Methods; Springer: Berlin/Heidelberg, Germany, 2001. [Google Scholar]
- Tomerlin, R.; Tomiša, M.; Vusić, D. Deviations of Spot Colorimetric Values on Multi-layered Flexible Packaging during the Graphic Reproduction and Sterilisation Process. Teh. Vjesn. Tech. Gaz. 2019, 26, 552–559. [Google Scholar]
- Mariappan, D.D.; Kim, S.; Boutilier, M.S.H.; Zhao, J.; Zhao, H.; Beroz, J.; Muecke, U.; Sojoudi, H.; Gleason, K.K.; Brun, P.-T.; et al. Dynamics of Liquid Transfer from Nanoporous Stamps in High-Resolution Flexographic Printing. Langmuir 2019, 35, 7659–7671. [Google Scholar] [CrossRef]
- Theohari, S.; Fraggedakis, E.; Tsimis, D.; Mandis, D. Effect of paper properties on print quality by flexographic method. In Proceedings of the 46th Annual International Conference on Graphic Arts and Media Technology, Athens, Greece, 25–29 May 2014. [Google Scholar]
- Valdec, D.; Miljković, P.; Auguštin, B. The influence of printing substrate properties on color characterization in flexography according to the ISO specifications. Tech. J. 2017, 11, 73–77. [Google Scholar]
- Zhang, X.D.; Qian, J.H.; Jia, J.W. Ink Penetration Model Research Based on Ink Permeability. Appl. Mech. Mater. 2015, 731, 462–465. [Google Scholar] [CrossRef]
- Havenko, S.; Ohirko, M.; Ryvak, P.; Kotmalova, O. Determining the factors that affect the quality of test prints at flexographic printing. East. Eur. J. Enterp. Technol. 2020, 2, 53–63. [Google Scholar] [CrossRef]
- Plazonić, I.; Bates, I.; Džimbeg-Malčić, V.; Zember, D. Colorimetric changes of waterbased flexographic ink printed on hemp-based papers exposed to artificial ageing. In Proceedings of the Tenth International Symposium GRID, Novi Sad, Serbia, 12–14 November 2020. [Google Scholar]
- Briggs, J.C.; Tse, M.-K. Objective Print Quality Analysis and The Portable Personal IAS® Image Analysis System. J. Imaging Soc. Jpn. 2005, 44, 505–513. [Google Scholar]
- Xu, R.; Chen, G.; Jia, C.; Tai, J.; Zhao, L.; Li, X. Line Quality Analysis in Digital Printing; Society for Imaging Science and Technology: Springfield, VA, USA, 2011; pp. 418–421. [Google Scholar]
- Wolin, D.; Johnson, K.; Kipman, Y. The Importance of Objective Analysis in Image Quality Evaluation; Society for Imaging Science and Technology: Springfield, VA, USA, 1998; pp. 603–606. [Google Scholar]
- Tse, M.-K. A Predictive Model for Text Quality Analysis: Case Study; Society for Imaging Science and Technology: Springfield, VA, USA, 2007; pp. 419–423. [Google Scholar]
- Tse, M.-K. PIAS-IITM–A High-Performance Portable Tool for Print Quality Analysis Anytime, Anywhere; Quality Engineering Associates (QEA): Billerica, MA, USA, 2007; pp. 1–4. [Google Scholar]
- Fleming, P.D.; Cawthorne, J.E.; Mehta, F.; Halwawala, S.; Joyce, M.K. Interpretation of dot fidelity of ink jet dots based on image analysis. J. Imaging Sci. Technol. 2003, 47, 394–399. [Google Scholar]
- Jacobson, J.; Keif, M.; Rong, X.; Singh, J.; Vorst, K. Flexography printing performance of PLA film. J. Appl. Packag. Res. 2009, 3, 91–104. [Google Scholar]
- d’Andrea, S. Kodak Flexcel NX Digital Flexographic System; Eastman Kodak Company: Rochester, NY, USA, 2008. [Google Scholar]
- Valdec, D.; Miljković, P.; Čerepinko, D. The Impact of Top Dot Shapes of the Printing Plate on Dot Formation in Flexography. Teh. Vjesn. Tech. Gaz. 2018, 25, 596–602. [Google Scholar]
- Harper, C. Aniloks line screen–stabilizer of the ink film. Flexo Grav. Asia 2005, 4, 14–15. [Google Scholar]
- Bould, D.C.; Hamblyn, S.M.; Gethin, D.T.; Claypole, T. Effect of impression pressure and anilox specification on solid and halftone density. Proc. Inst. Mech. Eng. Part B J. Eng. Manuf. 2011, 225, 699–709. [Google Scholar] [CrossRef]
- Simseker, O. Investigation of Different Solvents in Flexographic Printing Ink’s Effects to Print Quality on Coated and Uncoated Paper. Asian J. Chem. 2011, 23, 2903–2906. [Google Scholar]
- Bohlin, E.; Lestelius, M.; Johansson, C. Flexographic ink-coating interactions—Effects of porous structure variations of coated paperboard. Nord. Pulp Pap. Res. J. 2013, 28, 573–581. [Google Scholar] [CrossRef]
- Bould, D.; Claypole, T.; Bohan, M.; Gethin, D.T. Deformation of flexographic printing plates. In Proceedings of the 56th TAGA Technical Conference, San Antonio, TX, USA, 18–21 April 2004; pp. 146–162. [Google Scholar]
- Miljković, P.; Valdec, D.; Matijević, M. The Impact of Printing Substrate on Dot Deformation in Flexography. Teh. Vjesn. Tech. Gaz. 2018, 25, 509–515. [Google Scholar]


Publisher’s Note: MDPI stays neutral with regard to jurisdictional claims in published maps and institutional affiliations. |
© 2021 by the authors. Licensee MDPI, Basel, Switzerland. This article is an open access article distributed under the terms and conditions of the Creative Commons Attribution (CC BY) license (https://creativecommons.org/licenses/by/4.0/).