Article

Applying NMR T2 Spectral Parameters in Pore Structure Evaluation—An Example from an Eocene Low-Permeability Sandstone Reservoir

1
School of Geosciences, China University of Petroleum (East China), Qingdao 266580, China
2
Key Laboratory of Deep Oil and Gas, China University of Petroleum (East China), Qingdao 266580, China
3
Bohai Oilfield Research Institute, CNOOC China Limited, Tianjin Branch, Tianjin 300452, China
*
Author to whom correspondence should be addressed.
Appl. Sci. 2021, 11(17), 8027; https://doi.org/10.3390/app11178027
Submission received: 11 August 2021 / Revised: 25 August 2021 / Accepted: 27 August 2021 / Published: 30 August 2021

Abstract

:
The Eocene low-permeability sandstone reservoirs in the Dongying Depression, Bohai Bay Basin, China host a significant amount of oil reserves. The development of the reservoirs has been hampered by our inability to understand the complex and heterogeneous pore structures of the reservoirs. In this study, the pore systems, pore sizes, pore connectivity, and movable fluid distribution of the Eocene Shahejie Formation (Es4) sandstone reservoirs were investigated using an integrated analysis of optical and scanning electron microscopy (SEM), mercury injection capillary pressure (MICP), and nuclear magnetic resonance (NMR). The full-range pore structures of the Es4 sandstone reservoirs were evaluated by using NMR experiments. Various NMR T2 spectral parameters suitable for describing the pore structures and movable fluid distribution were extracted through morphological and statistical analysis of NMR T2 spectra. In combination with corresponding MICP data and petrophysical properties, we have demonstrated the reliability and robustness of the T2 spectral parameters for pore structure characterization. Four types of pore structures (I, II, III, and IV) were distinguished from the NMR T2 spectral parameters in association with other petrophysical properties and macroscopic behaviors. We have demonstrated the effectiveness of using the NMR T2 spectral parameters to characterize and classify micropore structures, which may be applied to effectively evaluate and predict low-permeability reservoir quality.

1. Introduction

The Eocene low-permeability sandstone reservoir is a major petroleum source in the Dongying Depression, Bohai Bay Basin, China [1,2,3]. The reservoirs are characteristic of poor petrophysical properties, complex pore structures, and strong reservoir heterogeneities owing to their terrestrial depositional environments and complex diagenetic modifications. Detailed and integrated analyses of pore structures are crucial for reservoir quality evaluation [4,5,6,7], permeability prediction [8,9,10], and identification of reservoir formation mechanisms [11,12]. Pore structures are defined as the geometric shape, type, size, distribution, and connectivity of pore throats, as well as the relationships among various properties [13,14]. The complex pore systems, highly variable pore size distribution, and poor connectivity in the Eocene sandstone reservoirs pose a great challenge in the adequate characterization of their microscopic pore structures.
Various analytical methods have been applied to investigate the pore structures of sandstone reservoirs, including optical petrography [15,16,17], SEM [18,19], MICP [20,21,22], X-ray computer tomography [23,24,25], nitrogen gas adsorption [26,27], and NMR [28,29]. NMR, as a non-invasive technique, is widely used in pore structure characterization and movable fluid evaluation [30,31,32,33,34]. The NMR technique has also been successfully applied in other fields, such as CO2 storage and geological modeling [35,36].
Previous studies mainly invoked indirect analysis of NMR data, including qualitative characterization of pore size distribution [30,37], simulation of capillary pressure curves [38,39], and estimation of movable fluid distribution in pore space [40,41]. Several researchers also paid attention to analyzing some sensitive NMR parameters for pore structure characterization and evaluation (e.g., NMR porosity, T2 geometric mean value (T2gm), T2 cut-off time (T2cutoff), maximum T2 relaxation time (T2max), porosity for effective movable fluids, and pore components (S1, S2, and S3) [42,43]. We had reported the effectiveness of fractal analysis and machine learning on pore structure characterization [3]. In this paper, we attempt to shed light on the application of the NMR T2 spectral parameters in pore structure evaluation. Different from the previous study, to the focus is on the morphological analysis of NMR T2 spectra. From the perspective of pore geometry, NMR T2 spectra show similar morphological characteristics with the pore size distribution derived from MICP measurements. Hence, the direct extraction of quantitative NMR parameters based on mathematical morphology analysis of NMR T2 spectra would be more practical. We also try to verify the feasibility of using the NMR T2 spectral parameters to derive pore structure information by correlating the NMR T2 spectral parameters, petrophysical parameters, and capillary parameters. NMR spectral parameters can also be potentially applied to evaluate pore structures and further extend the NMR logging capability.
In this study, several technical methods were combined to quantify pore structure features in low-permeability sandstone reservoirs. We attempted to directly extract NMR T2 spectral parameters from the morphological and statistical analysis of NMR data. We also hoped to shed light on pore structure identification and evaluation using extracted NMR T2 spectral parameters in combination with other experimental data. In this paper, the first section describes the significance, aims, and scopes of this study. The second section presents the geological background, sampling information, and methodology; The third section investigated the petrophysical properties, pore structures, and effective movable fluid in pore space using an integrated method. The final section discusses the effectiveness of the NMR T2 spectral parameters in pore structure evaluation by establishing a reservoir quality classification scheme for the Eocene sandstones.

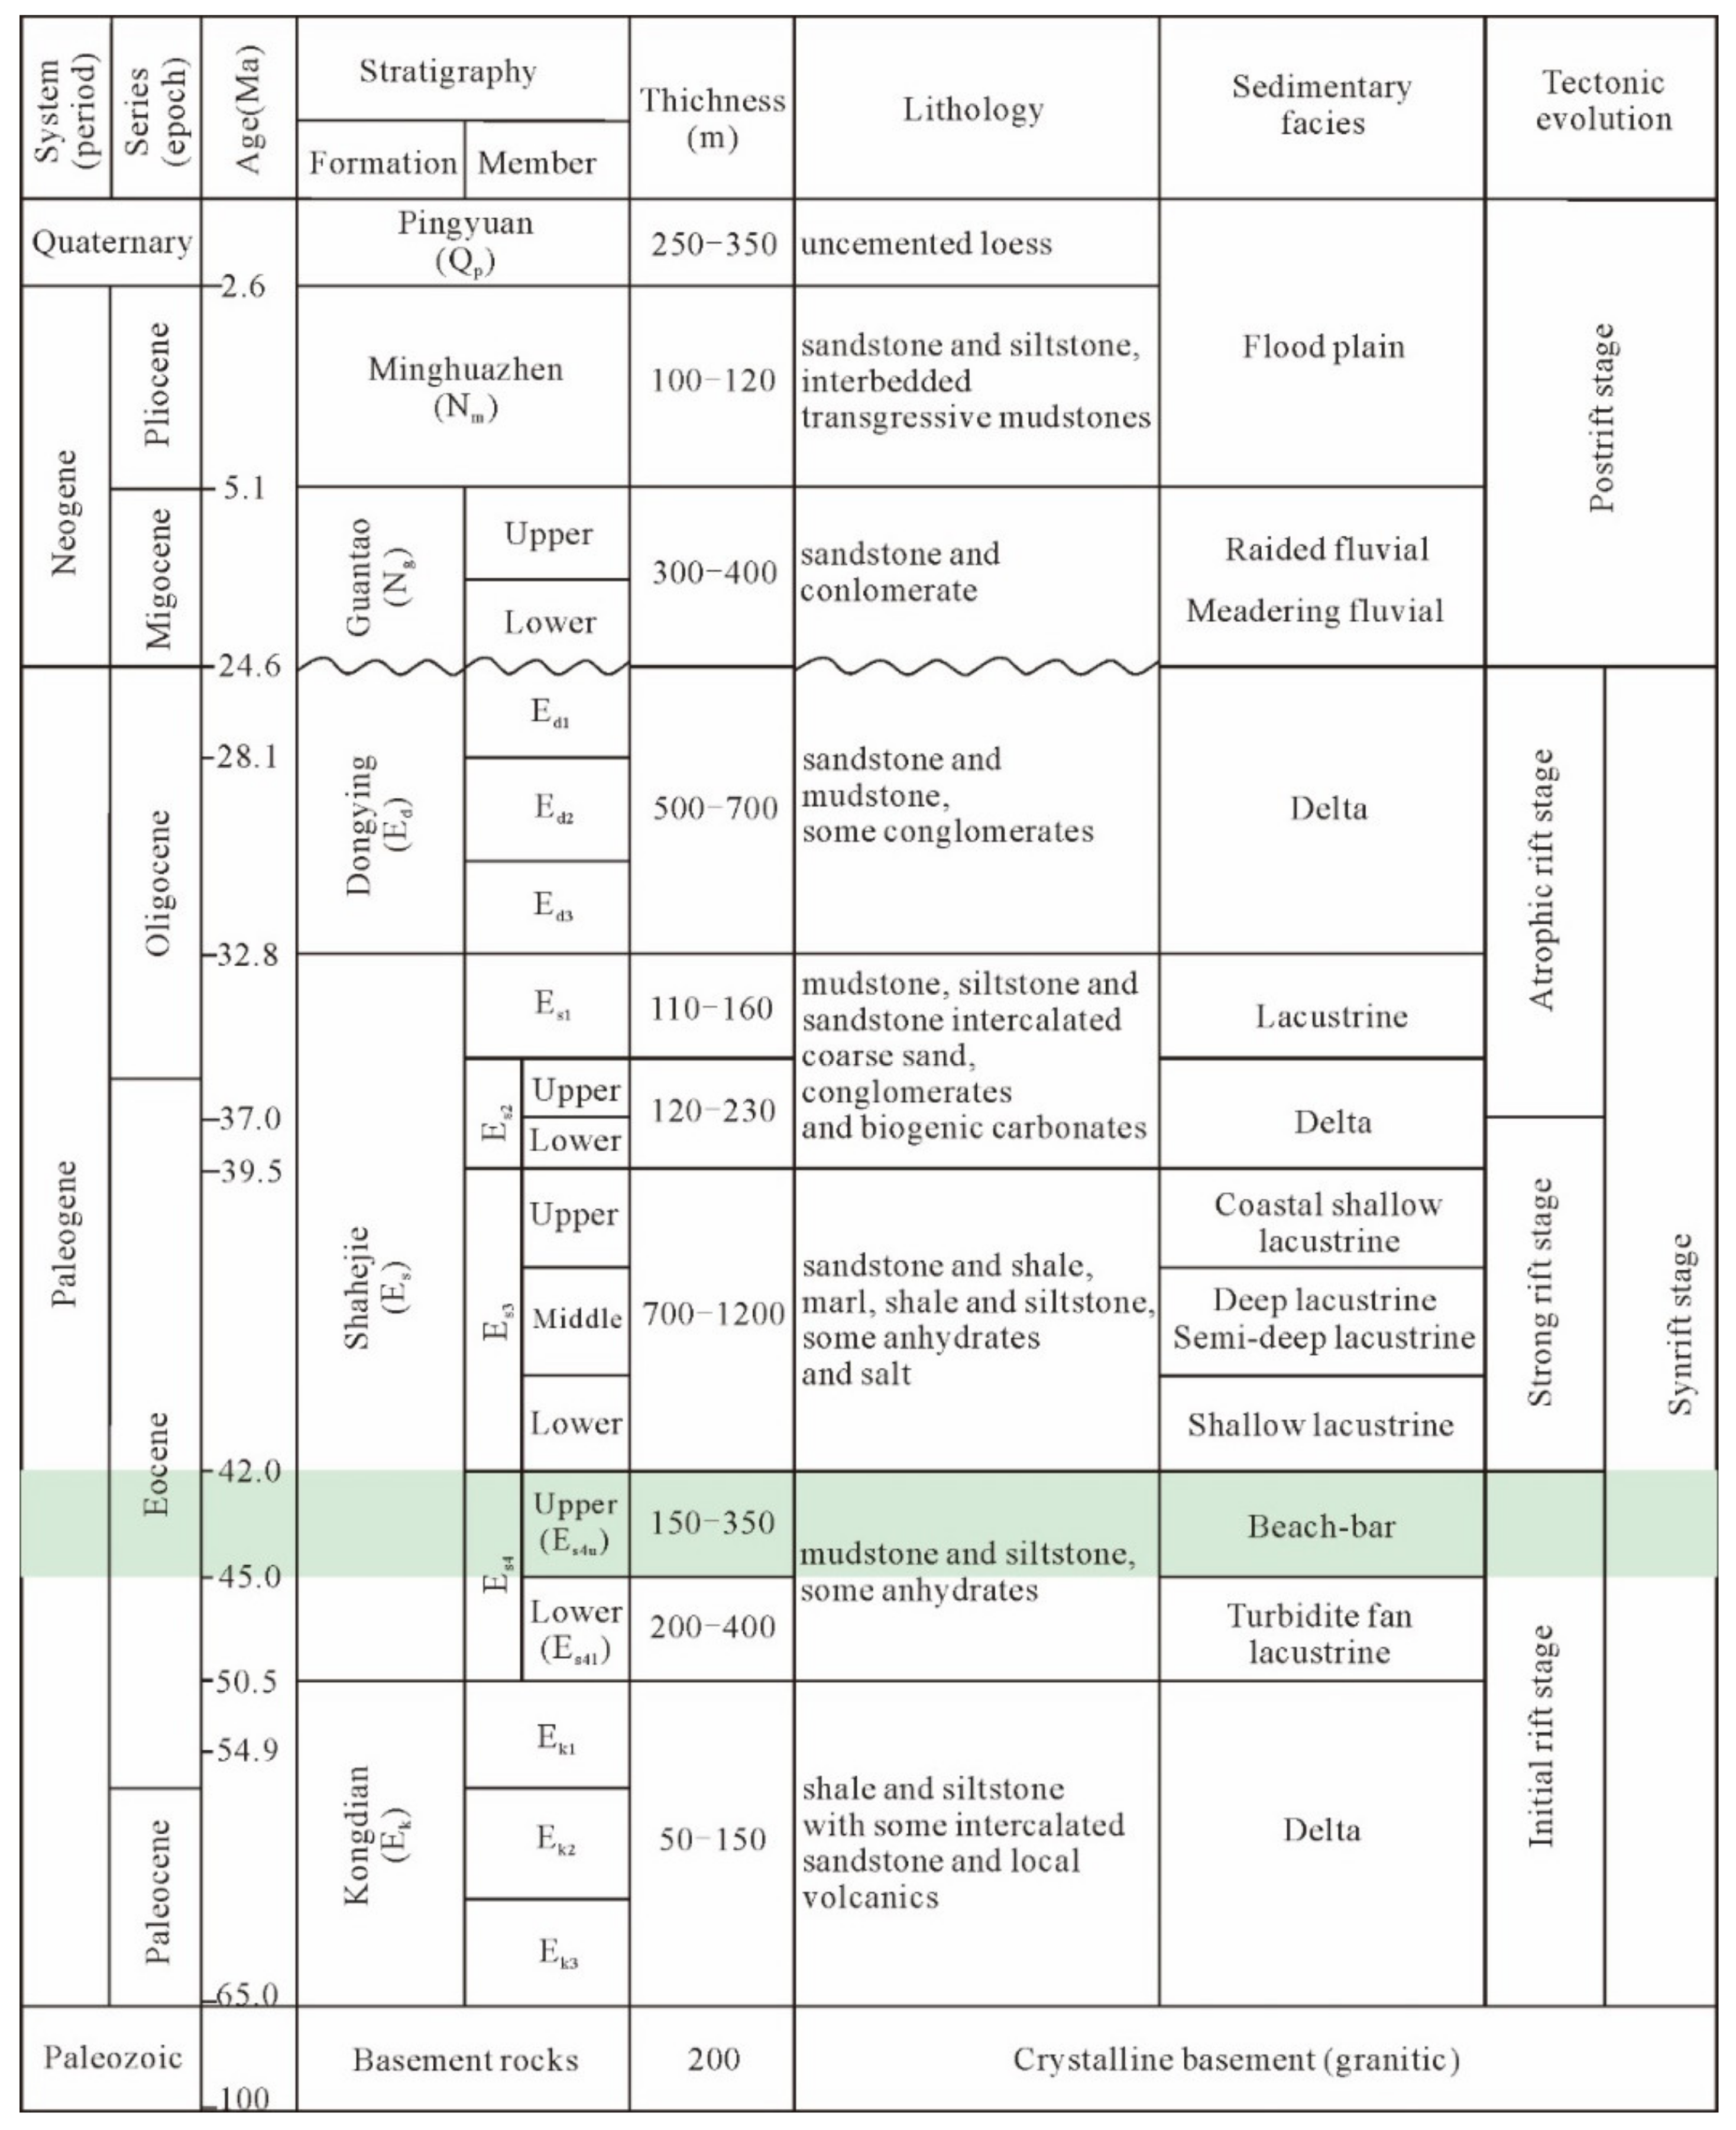
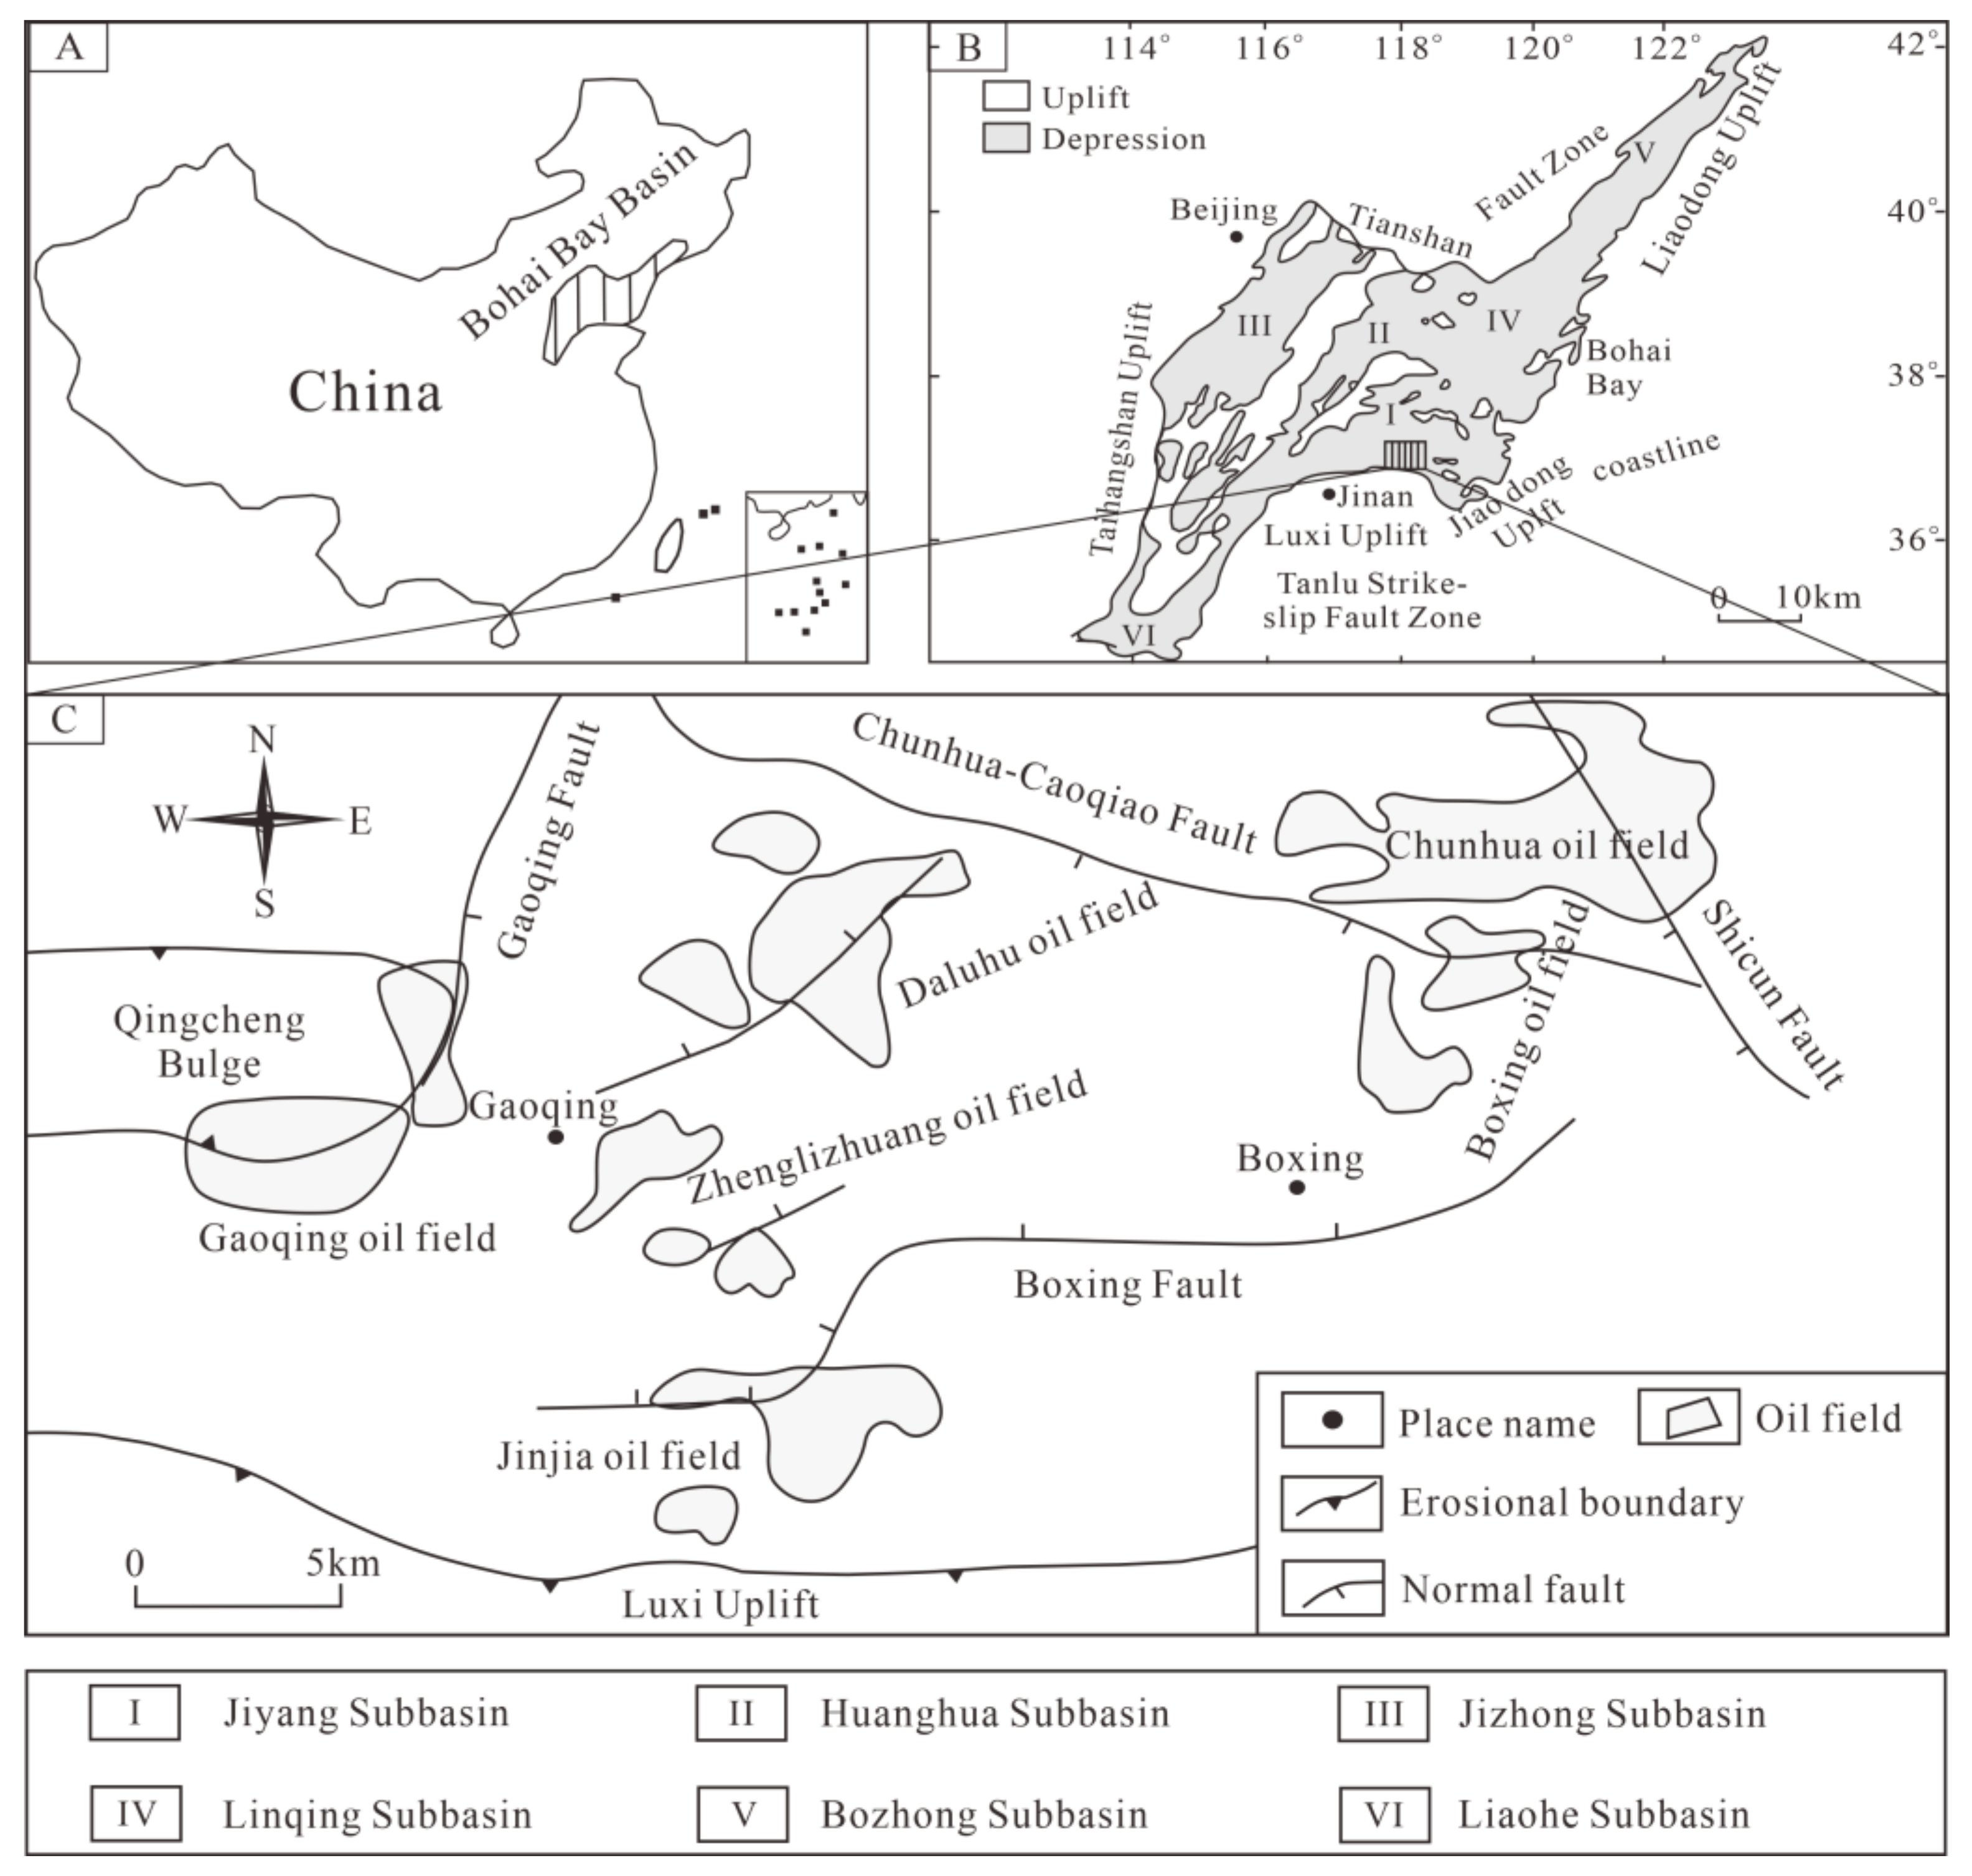
2. Geological Background

The Bohai Bay Basin is an important petroliferous basin in eastern China (Figure 1A) [2,39]. The Dongying Depression, a secondary tectonic unit in the Bohai Bay Basin (Figure 1B,C), experienced both synrift and postrift tectonism (Figure A1) [44,45]. The Eocene Shahejie Formation (Es) is the main regional reservoir containing four units, including Es4, Es3, Es2, and Es1 from bottom to top. The upper Es4 (Es4u) member is the target reservoir interval in the Dongying Depression, which is characterized by low-permeability sandstones deposited in near shore-shallow beach-bar environments (Figure A1) [1]. The sandstone reservoirs primarily comprise fine sandstones, siltstones, and argillaceous siltstones with interbedded thin mudstone layers. The Es4u sandstone reservoir is widely distributed and contains abundant hydrocarbons. However, the reservoirs are characterized by poor petrophysical properties and a highly variable pore size distribution from nano-scale to micro-scale. Optical petrography, SEM, MICP, and NMR analyses were conducted to probe the pore structures of the Es4u reservoirs aiming to better characterize and evaluate the reservoirs.

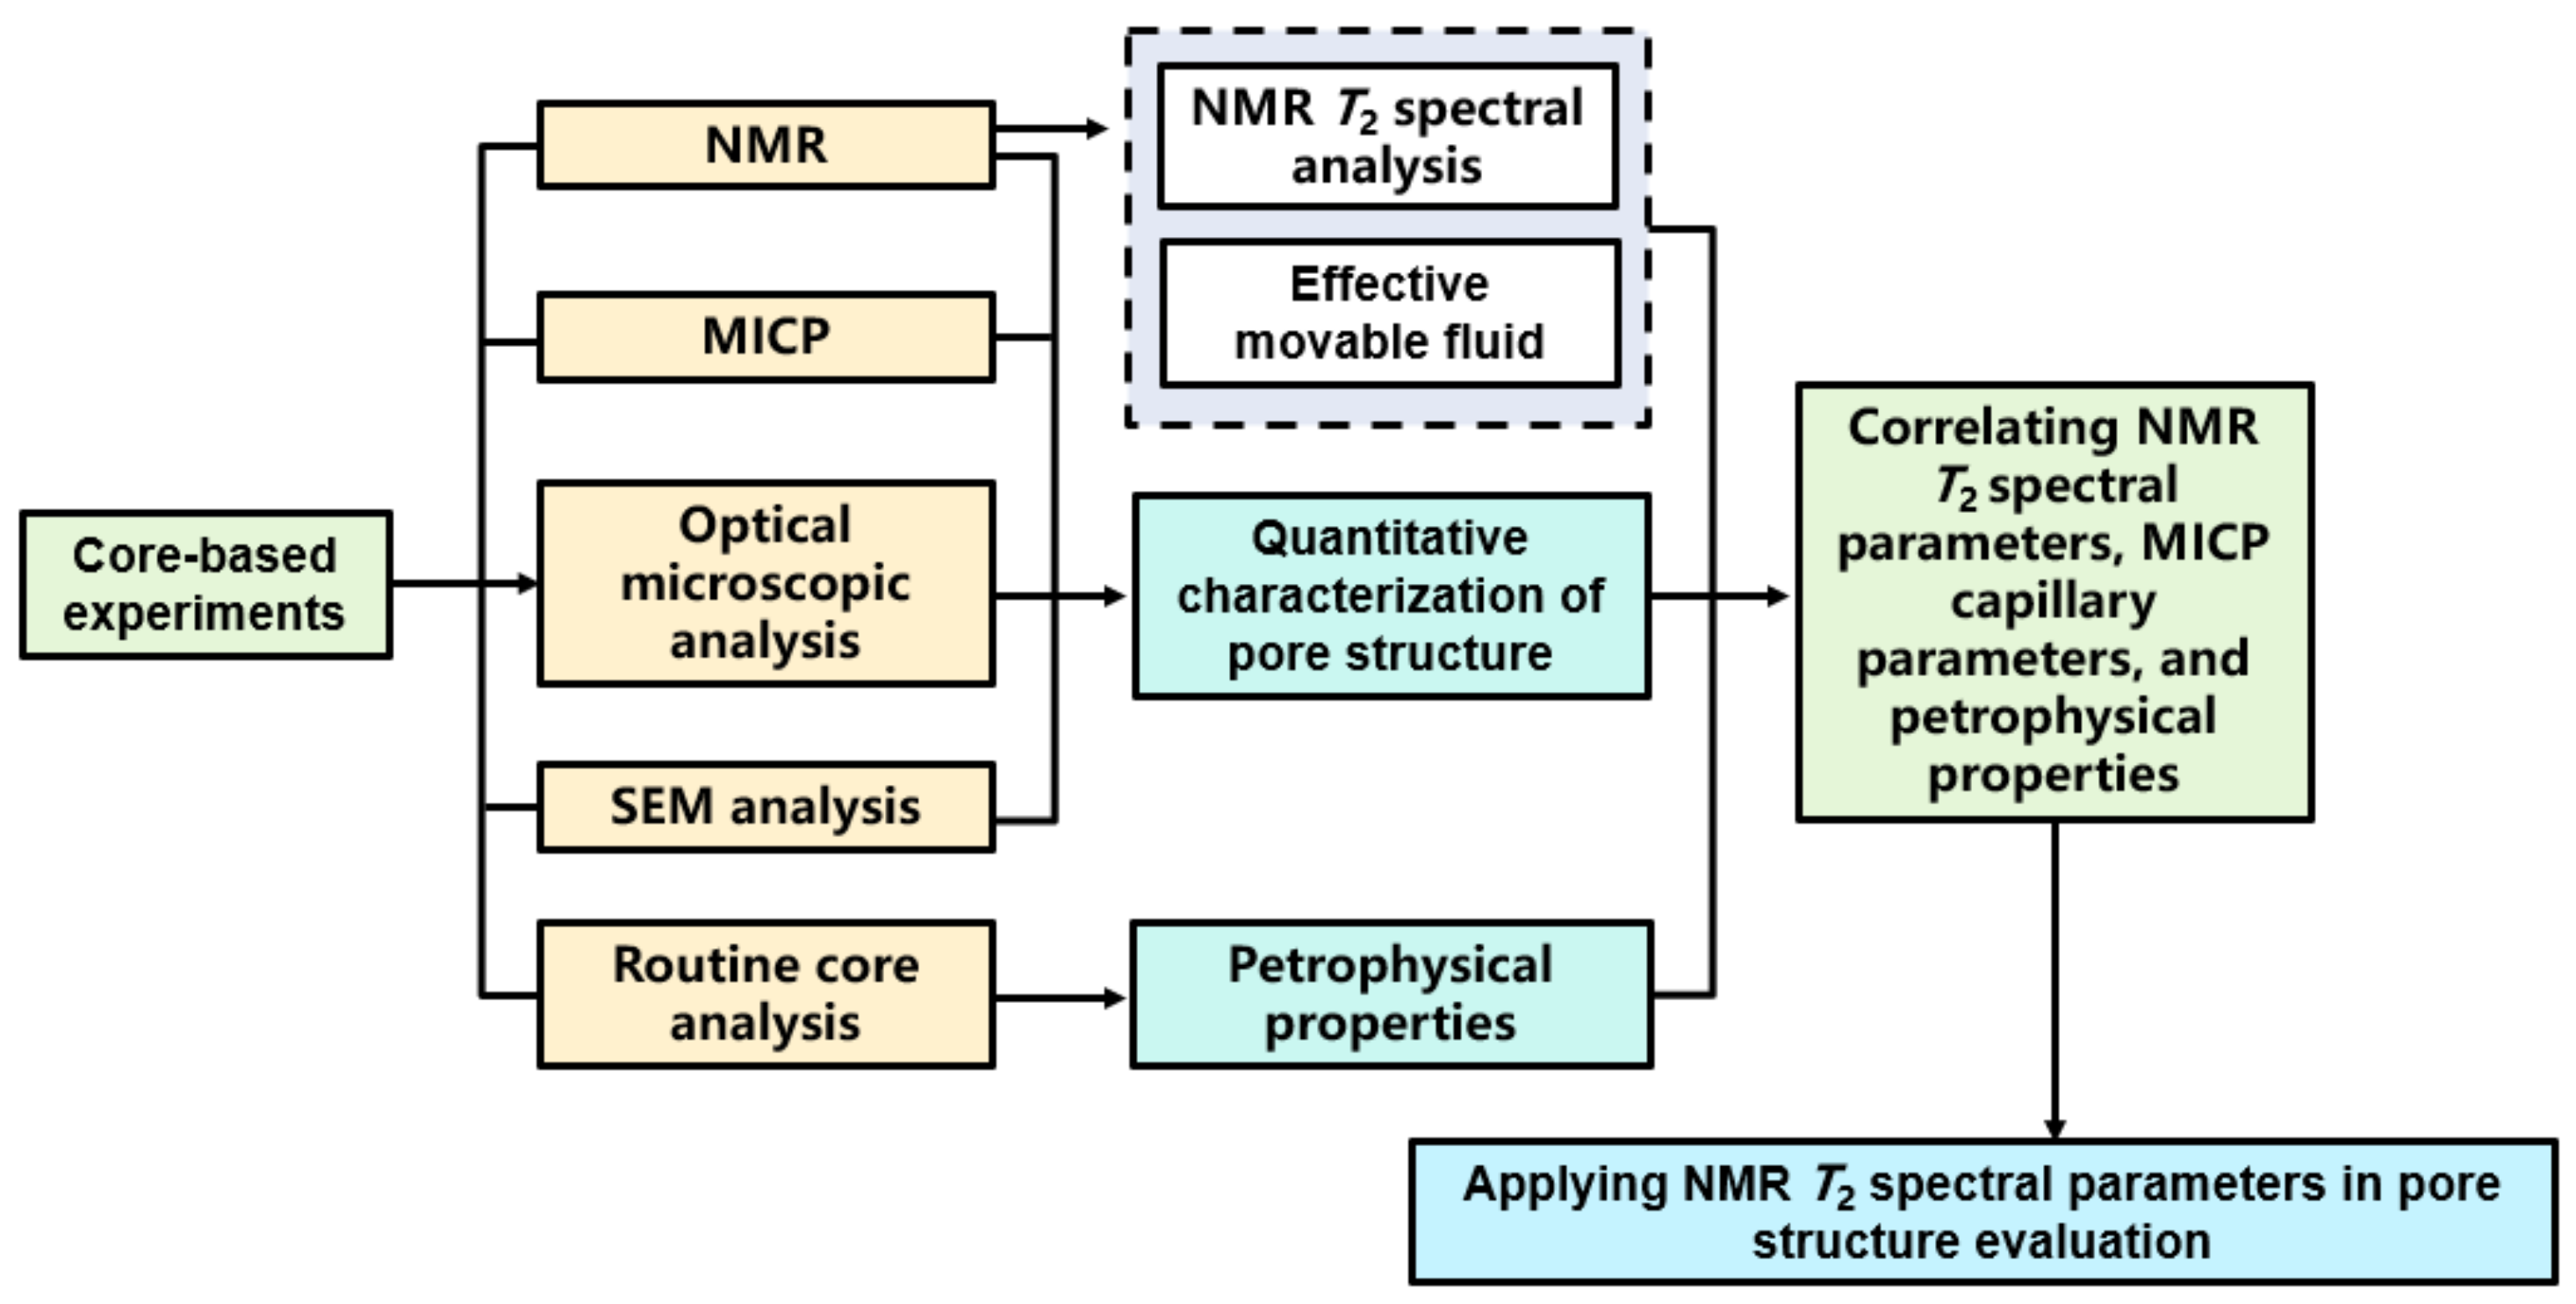
3. Sampling and Methodology

3.1. Samples and Analytical Techniques

A total of 753 sandstone samples from the Eocene sandstone reservoirs were analyzed in the laboratory of China University of Petroleum (East China). The samples were first cleaned with petroleum ether for removing the oil and then dried for 24 h under a temperature of 95 °C. Core plug samples (50 mm long and 25.4 mm in diameter) were drilled for helium porosity, air permeability, MICP, and NMR measurements. Core chips were used to make thin sections for optical microscopic analysis and SEM analyses. The sample preparation procedure conforms to the protocol of GB/T23561.1-2009 “Methods for Determining the Physical and Mechanical Properties of Coal and Rock”. The experimental procedure and workflow for pore structure evaluation are shown in Figure 2.
Helium porosity and air permeability measurements were conducted on 753 core plug samples at a net confining pressure of 400 psi. Optical petrographic analysis was conducted on 327 thin sections with 500 point-counting per sample to identify pore throats and petrological characteristics of the reservoir sandstones. SEM analysis was performed on 103 samples to identify pore throat types, sizes, and contact relationships between the pore throat and clay minerals. The pore structures and pore throat size distribution of 23 core plug samples were analyzed by MICP. The maximum mercury inlet pressure is 116 MPa, corresponding to a minimum throat radius of 0.0063 μm.
NMR T2 spectra of 21 core plug samples were measured under 100% water-saturated and centrifuged states. The samples were saturated with sodium chloride solution with a salinity of 12,000 mg/L. The experimental temperature and humidity used are 25 °C and 50%, respectively. Firstly, the samples were saturated for 24 h with sodium chloride solution under a net pressure of 30 MPa. Then, NMR T2 spectra under a water-saturated state were extracted. The echo interval, waiting time, and the number of echoes were set to 0.21 ms, 6000 ms, and 2048, respectively. The samples were centrifuged at 6000 r/min to remove free water in the core plugs, and then, they were measured again to obtain NMR T2 spectra.

3.2. MICP Methodologies

In the MICP measurement, an external pressure is required to drive mercury into the pore space and to obtain the pore throat volumes. The relationship between the injection pressure and pore throat radius is described by the Washburn equation (Equation (1)) under the assumption that pores are cylindrical [46]. It should be mentioned that MICP measures only pore throat sizes.
P c = 2 γ cos θ r
where Pc is the threshold capillary pressure (MPa); r is the pore throat radius (μm); γ is the surface tension (mN/m); and θ is the contact angle (°).

3.3. NMR Methodologies

3.3.1. NMR Measurement

The transverse relaxation time T2 can be expressed as the following [47]:
1 T 2 = 1 T 2 B + 1 T 2 D + 1 T 2 S 1 T 2 S = ρ S V
where T2B, T2D, and T2S are the bulk, diffusion, and surface transversal relaxation time in ms, respectively; S/V is the surface-to-volume ratio; and ρ is the transversal surface relaxivity (μm/s) [48]. Since rapid diffusion is dominated by surface relaxation in most geological media, the T2 time of pore space is directly related to S/V (Equation (3)).
1 T 2 ρ S V = ρ N r
where N is the pore shape factor (N = 2 for cylindrical model and N = 3 for spherical model) [49]. Generally speaking, short T2 relaxation times are associated with small pores, whereas long T2 relaxation times correspond to large pores and fractures. Thus, the pore sizes can be characterized by T2 relaxation times.

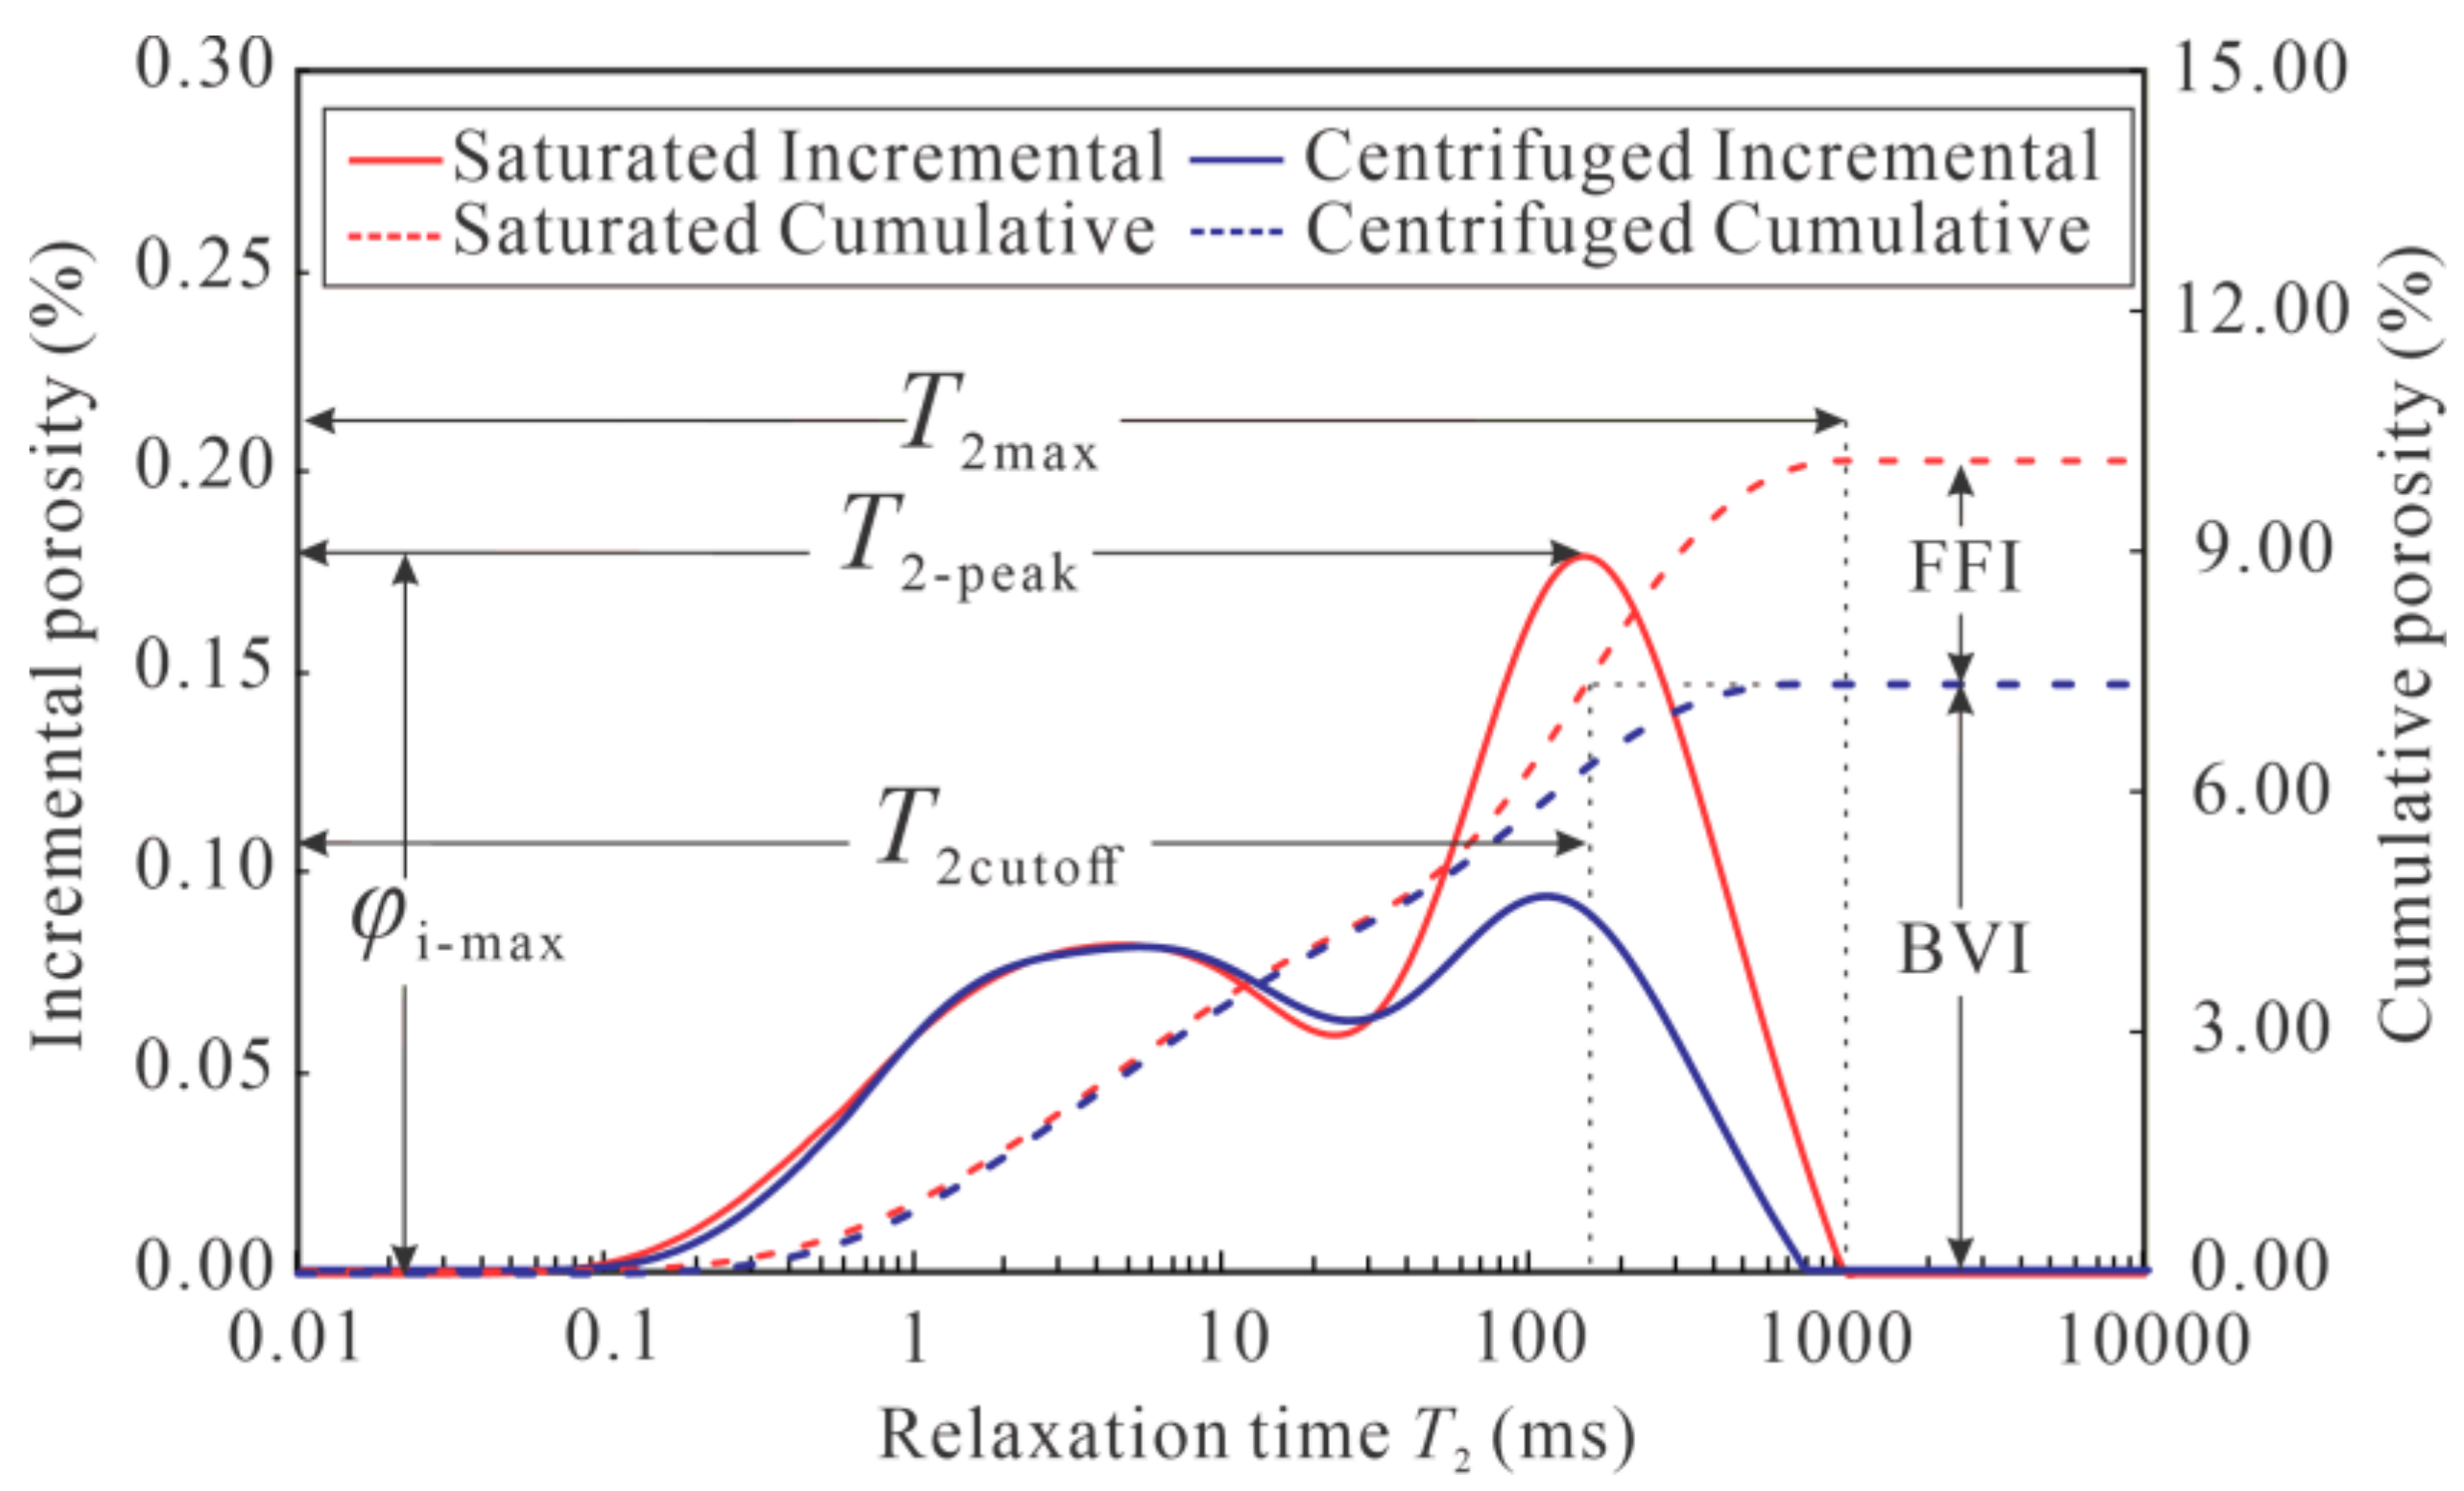
3.3.2. NMR T2 Spectral Parameters

NMR T2 spectra contain essential information on the petrophysical properties, pore size distribution, and fluid occurrence states. Therefore, NMR T2 spectra are vital for pore structure evaluation [50,51]. In addition to the Free Fluid Index (FFI), Bulk Volume of Immovable Fluid (BVI), NMR porosity, and T2cutoff, a number of quantitative parameters can be extracted from T2 spectral analysis, including T2gm, T2 arithmetic mean value (T2ave), T2max, median T2 relaxation time (T2mid), sorting coefficient (σNMR), and skewness (Skp) [41,43]. Among them, T2max is associated with the NMR response corresponding to the maximum pore size. T2mid is defined as the T2 relaxation time corresponding to 50% of the total NMR porosity under a 100% water-saturated state. It is a vital parameter for pore size evaluation. T2-peak is the T2 relaxation time associated with the highest peak of the NMR T2 spectra. φi-max is the highest interval porosity, which is indicative of high content of pore fluid and porosity contribution. The graphical representations of various quantitative parameters in an NMR T2 spectrum are shown in Figure A2.
T2gm and T2ave can be used to characterize the average T2 relaxation time [52]. The calculation equations are shown in Equations (4) and (5).
T 2 g m = ( i = 1 N T 2 i φ i ) 1 φ n m r
T 2 a v e = i = 1 N T 2 i φ i φ n m r
The sorting coefficient (σNMR) and skewness (Skp) can also be derived from the morphological analysis of NMR T2 spectra. Among them, σNMR describes the dispersion degree of the T2 relaxation time centered on T2ave (Equation (6)). A small sorting coefficient indicates a uniformity distribution of the T2 relaxation time.
σ NMR = T 2 i T 2 a v e 2 φ n m r
The asymmetric distribution of the T2 relaxation time can be described by Skp, and the variation range of Skp is [–1,1]. A positive value suggests that the sample is dominated by a short T2 relaxation time, while a negative value implies a high proportion of long T2 relaxation time (Equation (7)).
S kp = φ 84 + φ 16 2 φ 50 2 φ 84 φ 16 + φ 95 + φ 5 2 φ 50 2 φ 95 φ 5

3.3.3. Pore Components Derived from NMR T2 Spectra

The pore components (S1, S2, and S3) can also be obtained by NMR T2 spectral analysis, representing various pore volumes corresponding to micropores, mesopores, and macropores, respectively [42]. The pore components are critical for evaluating micropore structures. The larger the S2 and S3, the better the micropore structure would be. S1, S2, and S3 can be calculated by Equation (8).
S 1 = i = 1 n 1 T 2 i φ i
S 2 = i = n 1 n 2 T 2 i φ i
S 3 = i = n 2 N T 2 i φ i
where n1 and n2 are the category boundaries of pore components.
NMR-derived pore components have strong regional differences and need to be calibrated by MICP data. As shown in Figure A3, the pore types of the Es4 sandstone reservoirs can be classified into micropores, mesopores, and macropores by using the category boundaries of 0.1 μm and 1.0 μm. The category boundaries were selected based on pore throat size distribution of the Es4 reservoirs and regional empirical values proposed by Wu et al. (2019) [39]. The corresponding category boundaries of S1S2 and S2S3 are approximately 27.4 ms and 289.9 ms, respectively (Figure A3).

4. Results

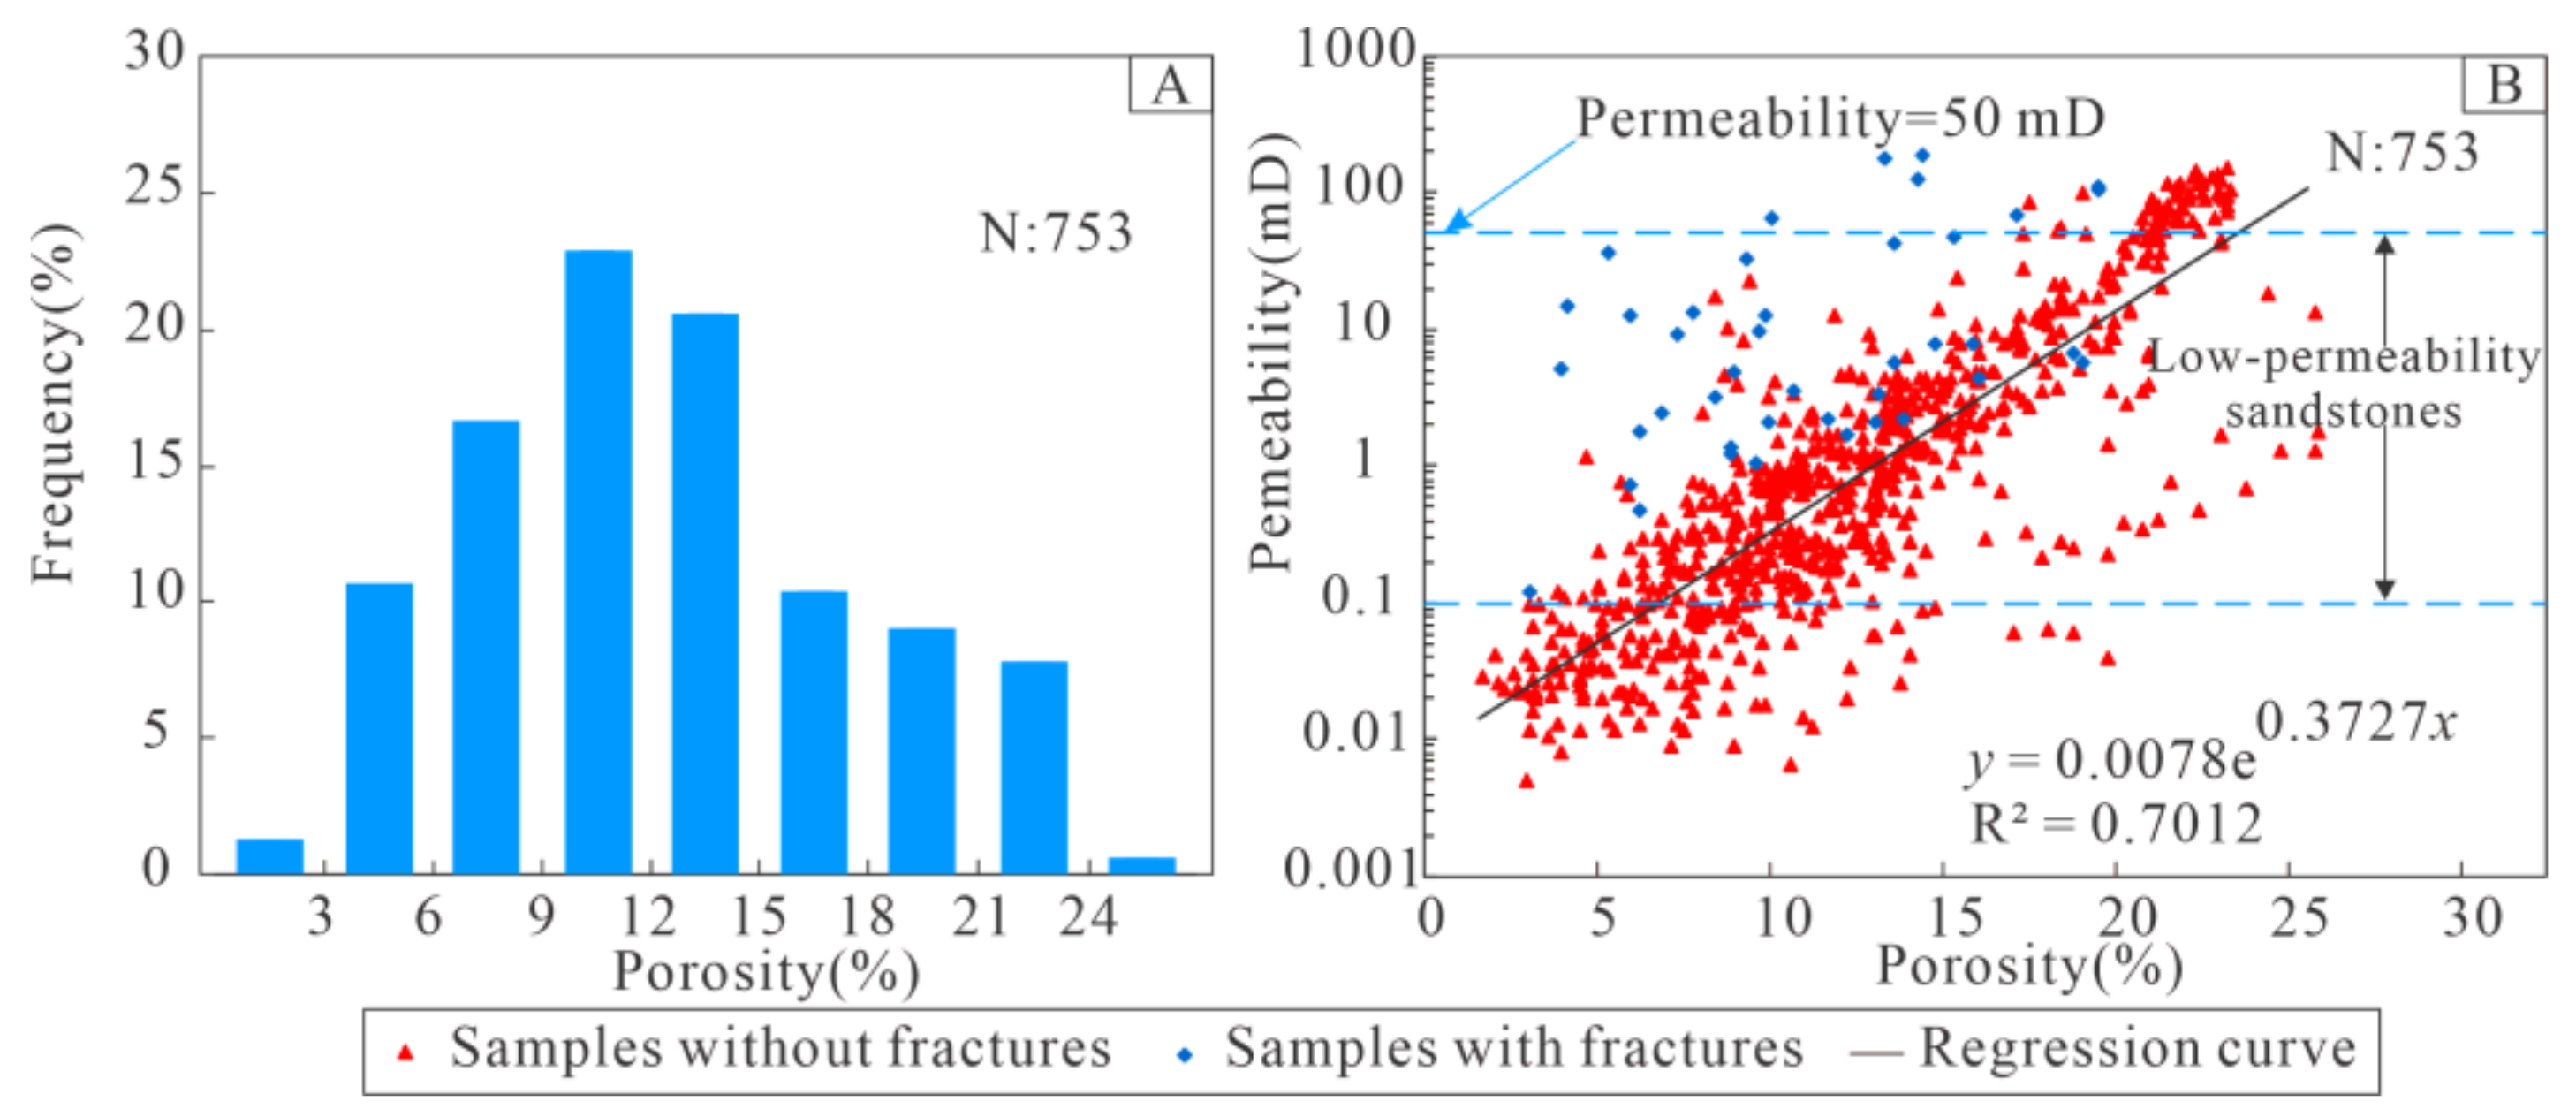
4.1. Petrophysical Properties and Pore Types

The porosity and permeability results of 753 sandstone core samples from the Es4 sandstone reservoirs indicate that the petrophysical properties are generally unfavorable with porosity mainly ranging from 3.0% to 24% (average 12.3%) and permeability ranging from 0.005 to 191.68 mD (averaging 10.75 mD) (Figure 3). The majority of the samples belong to the category of low-permeability sandstones (Figure 3). When excluded samples with micro-fractures, the porosity and permeability show a good correlation (R2 = 0.70) because the presence of micro-fractures can significantly improve the reservoir permeability but has little influence on the porosity. The samples with micro-fractures are generally characterized by high permeability values but highly variable porosities (5–25%) (Figure 3B).
As can be seen from SEM images and casting thin sections, the pore systems are mainly constituted by residual intergranular pores, dissolution pores, micropores, and a minor amount of micro-fractures (Figure 4). The residual intergranular pores are irregular in shapes (Figure 4A,B,H,I,J), which are often associated with carbonate cement (Figure 4A,B). The primary intergranular pores visible under petrographic microscope are generally characterized by larger pore diameter as compared to secondary dissolution pores. The dissolution pores are predominantly in feldspars, lithic fragments, and carbonate cements (Figure 4A,B,H–J). Some of the intergranular pores and dissolution pores are filled by clay minerals, forming intercrystalline pores (Figure 4E,F). There are a large number of intercrystalline pores within kaolinite, chlorite, and mixed layer Illite/smectite, and the pore diameter is less than 1 μm (Figure 4E,F). The micropores formed by authigenic clay minerals and dissolution clastic particles contribute to high porosity but have low permeability [53,54].

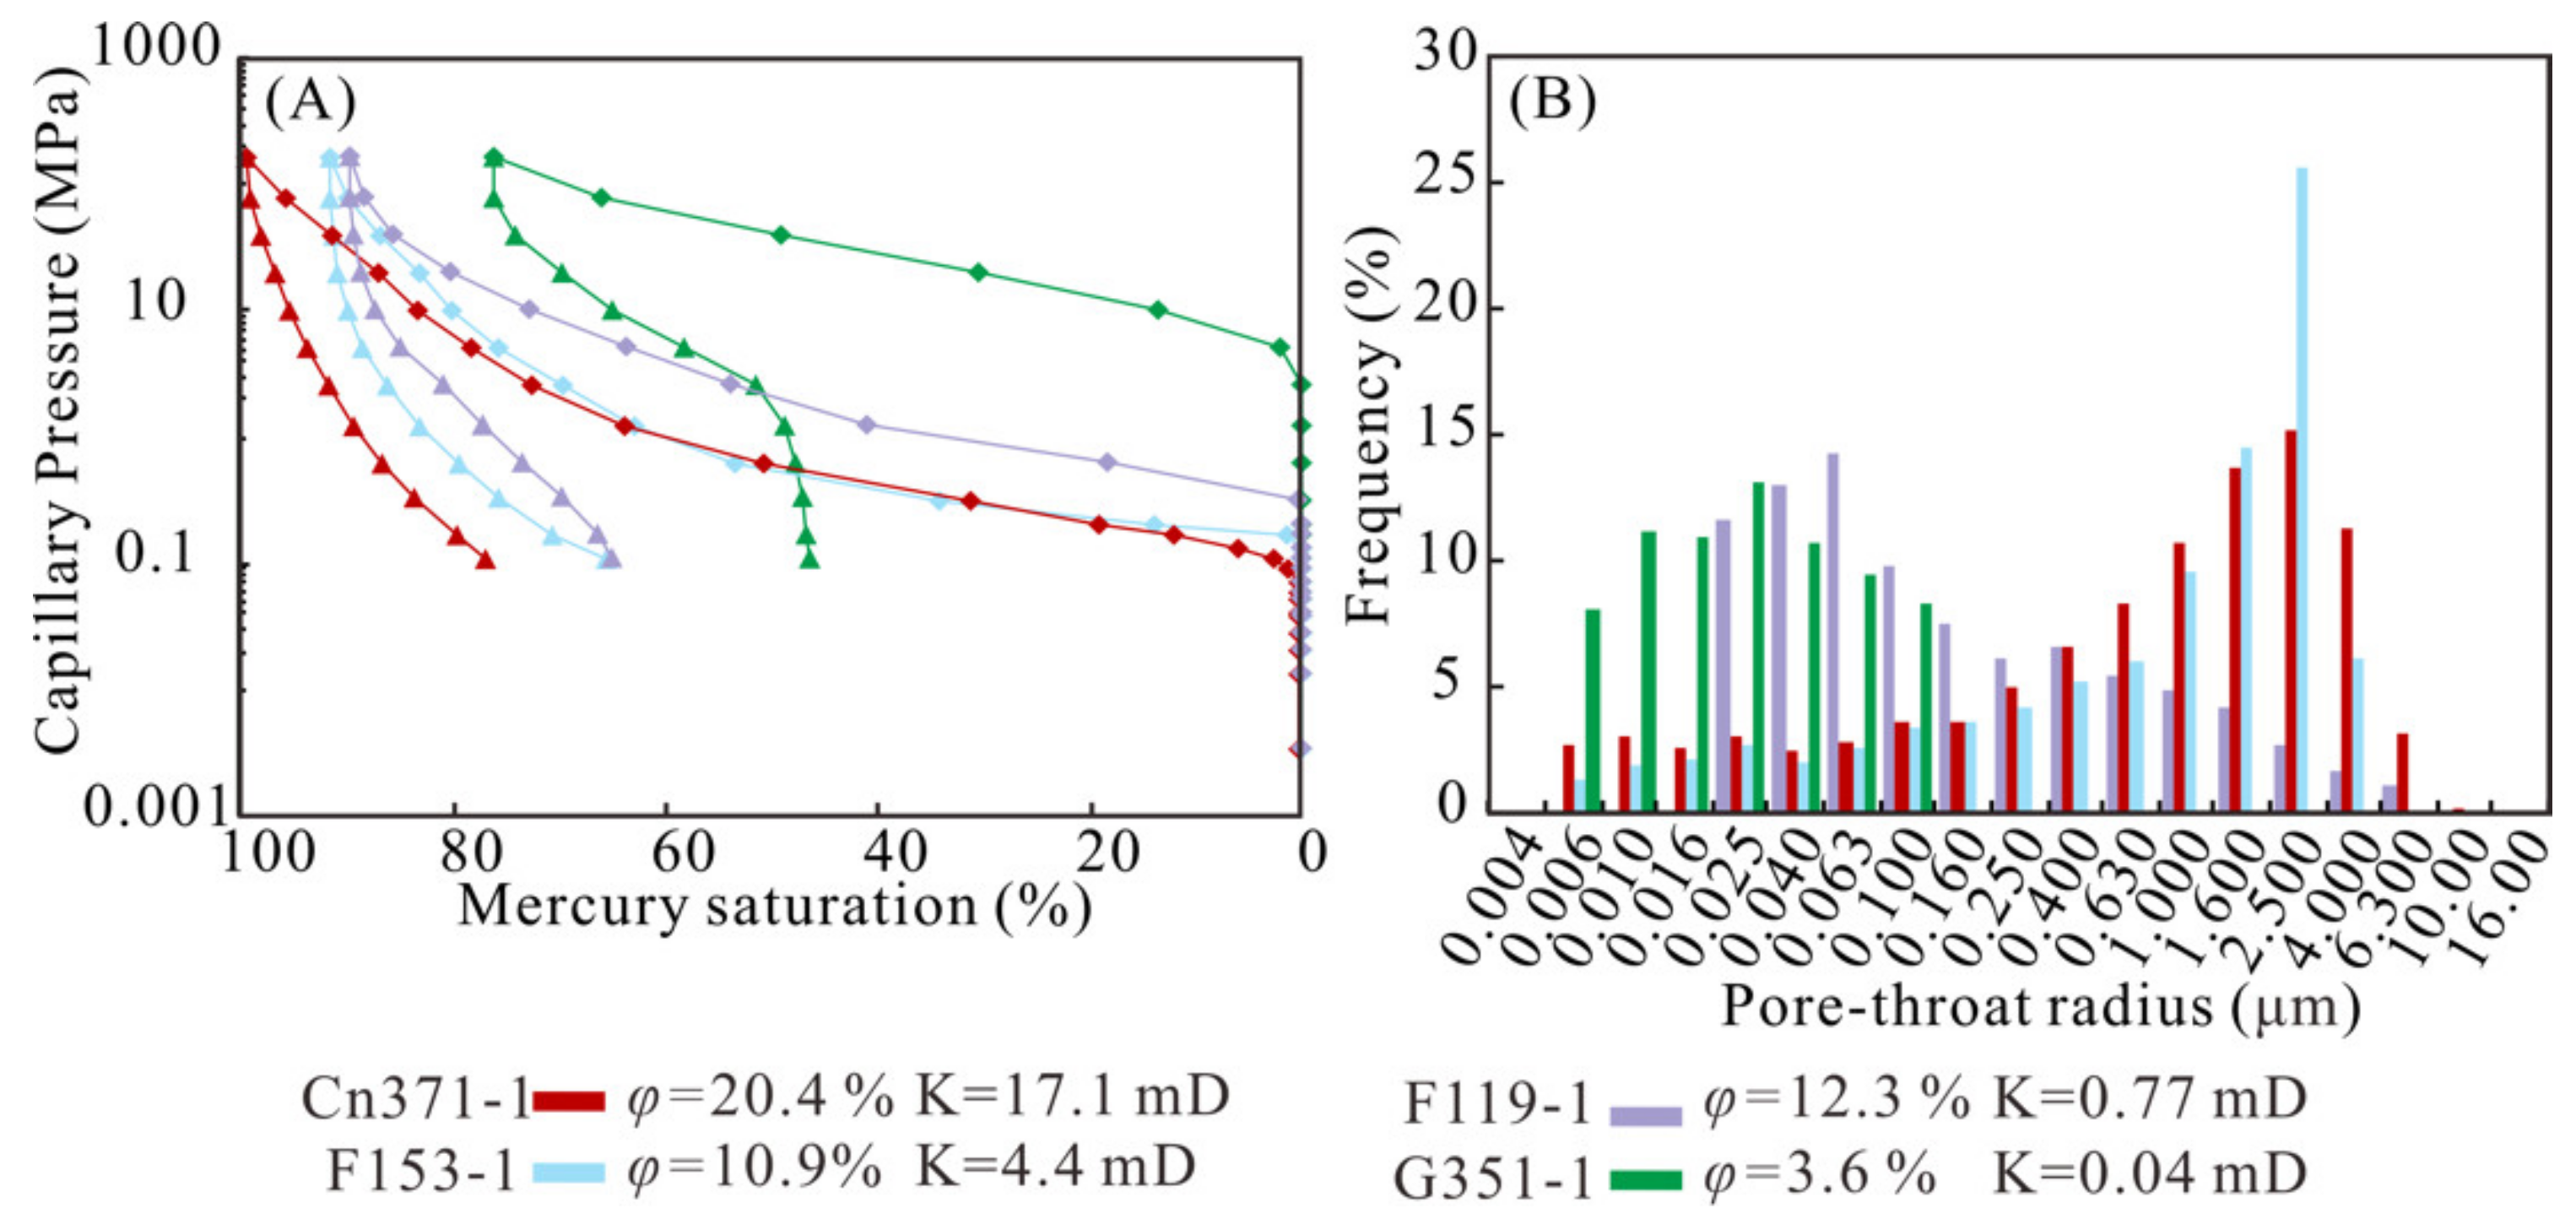
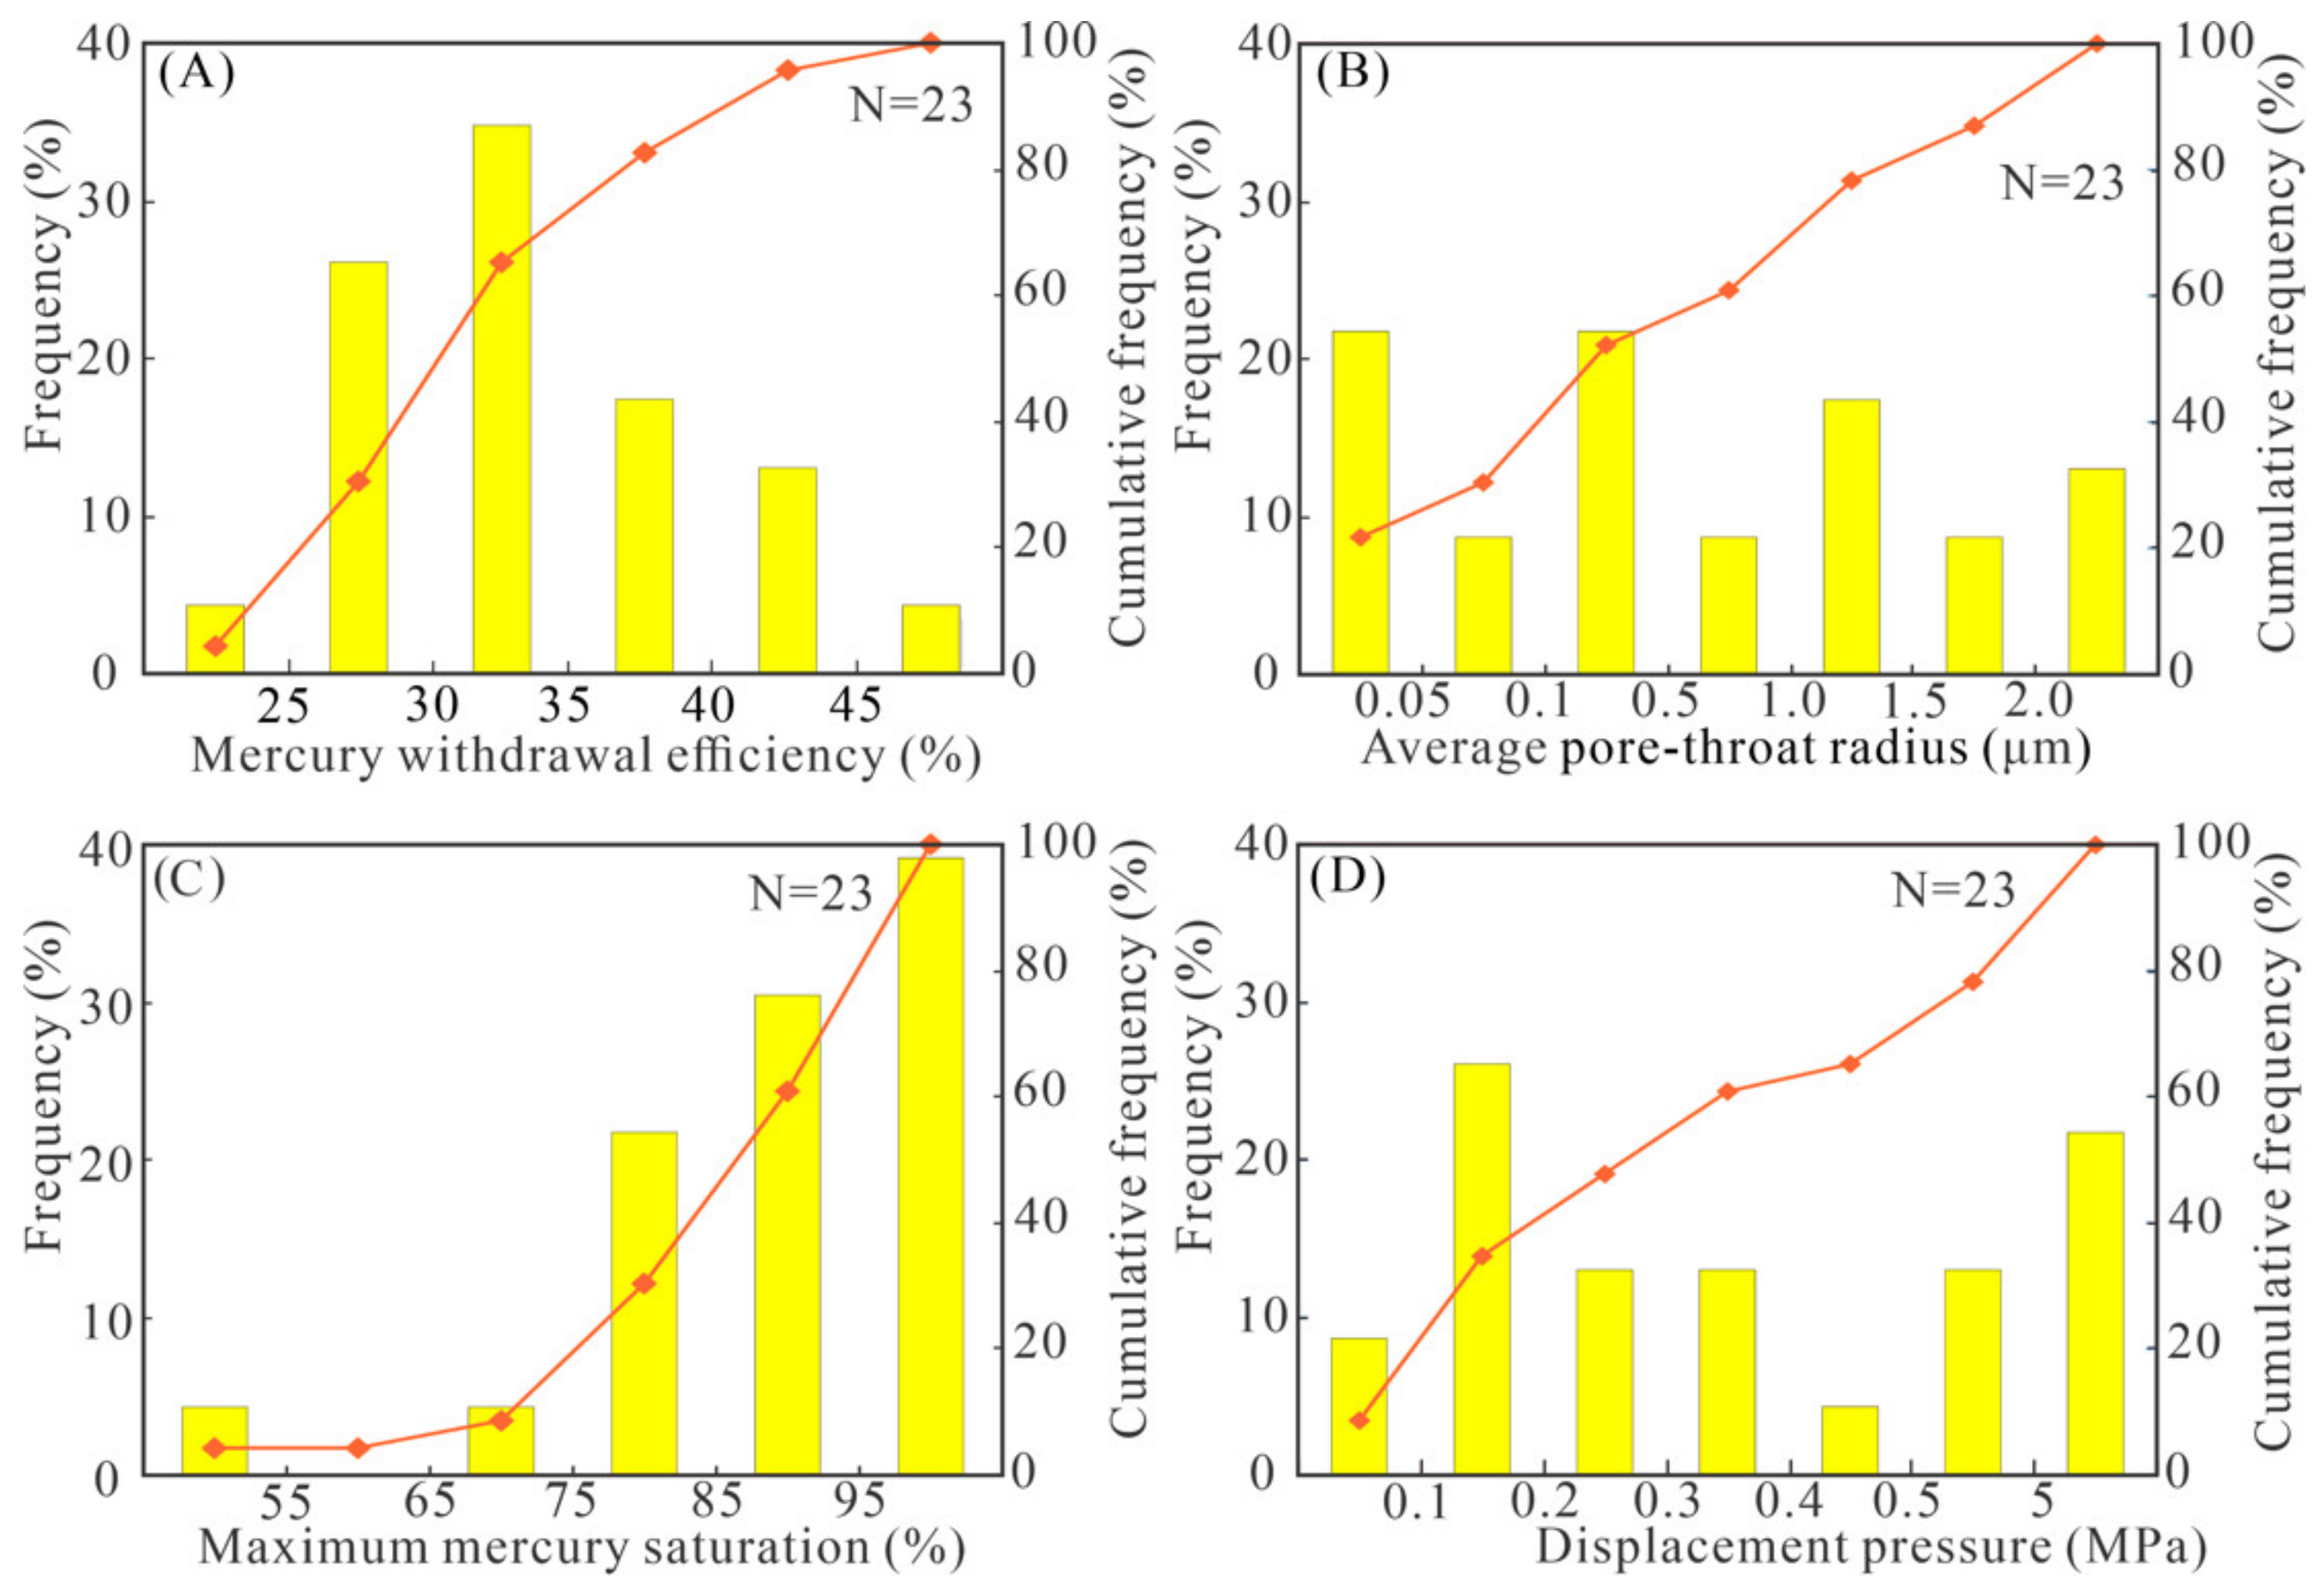
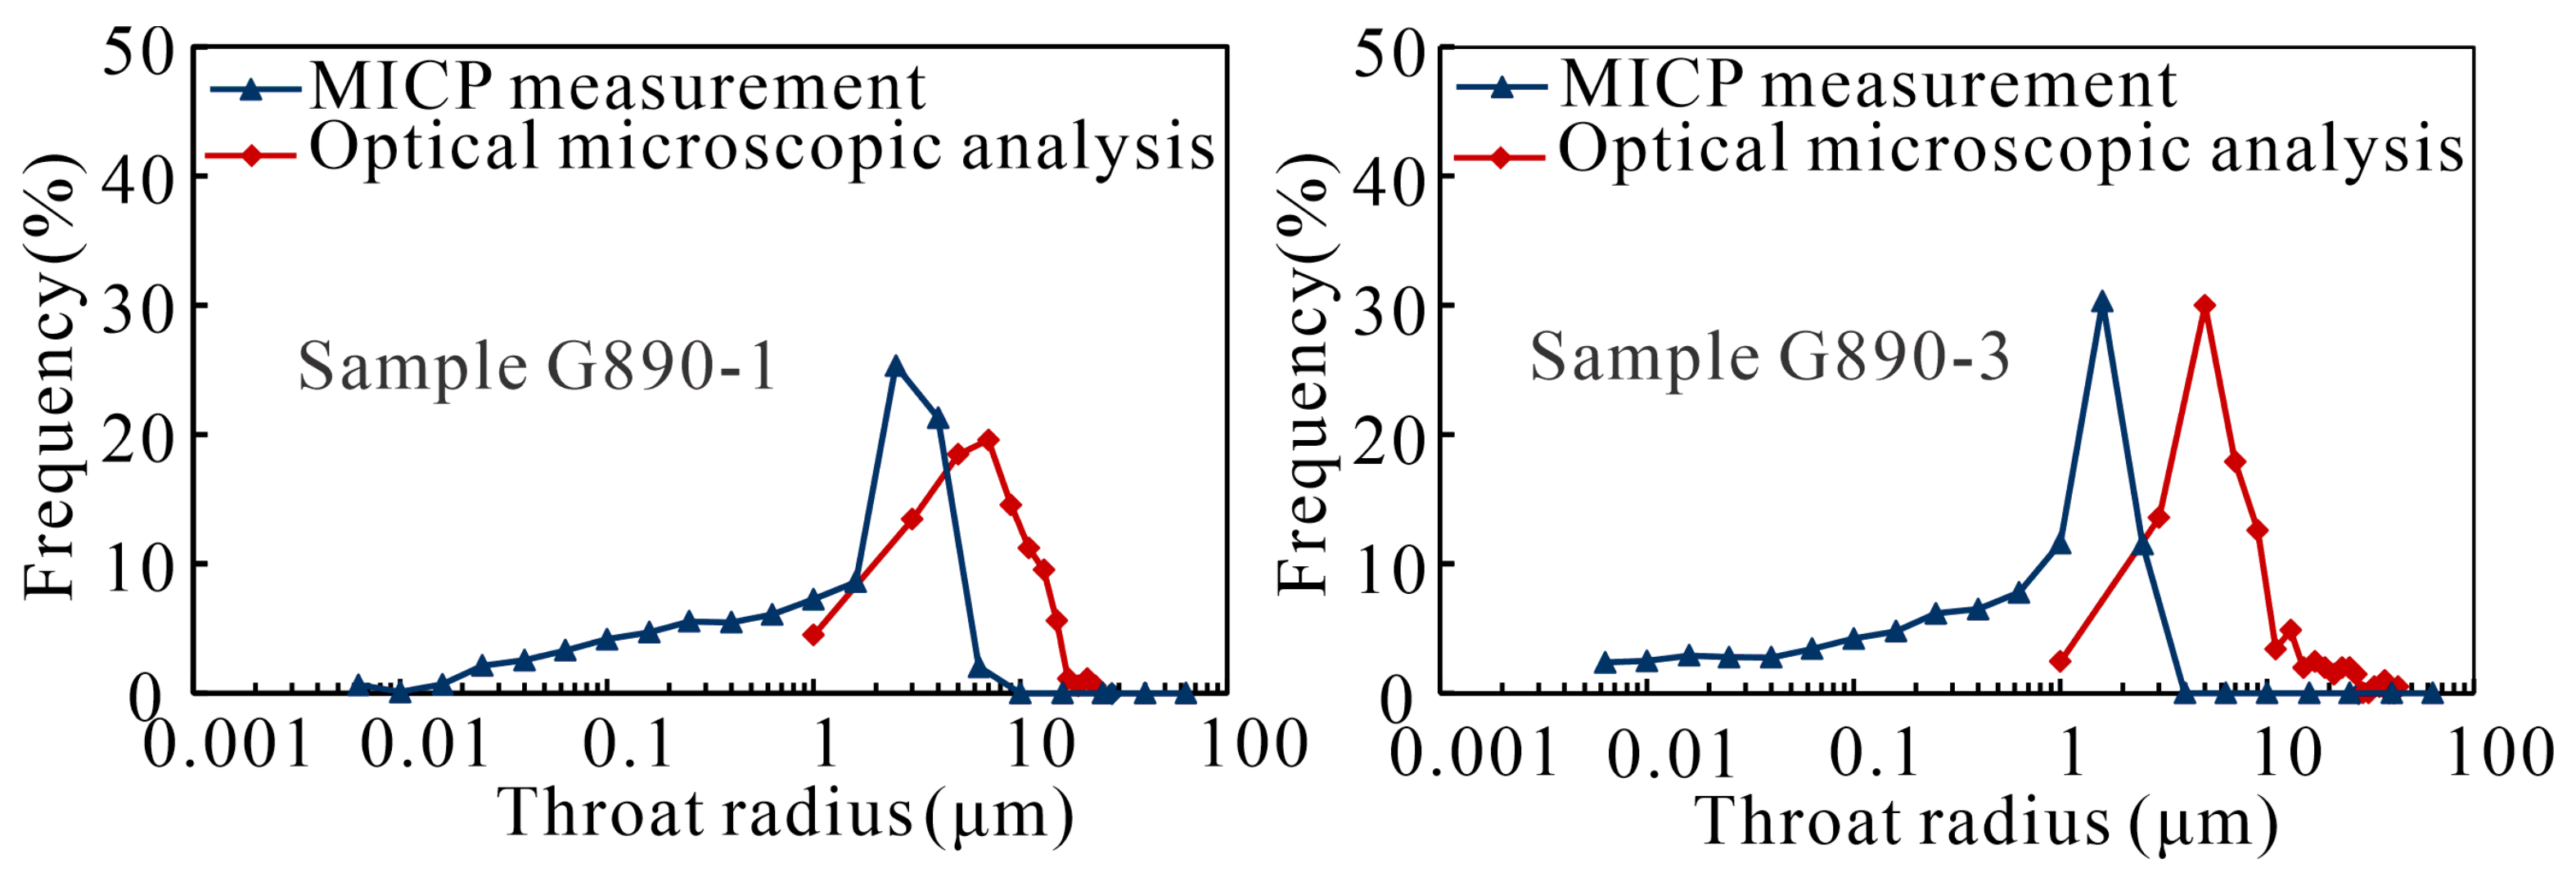
4.2. Pore Throat Size Distribution from MICP Measurements

The MICP results show that the capillary pressure curves of the sandstone samples are different in morphology (Figure 5A), suggesting complex pore structures and microscopic connectivity. The longer the flat segment of the capillary curves, the better the sorting and microscopic connectivity. The capillary pressure curves of samples Cn371-1 and F153-1 exhibit a longer flat segment during the mercury intrusion (Figure 5A), indicating a high proportion of large and connected pore throats and good microscopic connectivity. As shown in Figure 5B, the pore throat radius of samples Cn371-1 and F153-1 are concentrated between 0.5 and 5.0 μm. In contrast, the flat segments of sample F119-1 and Sample G351-1 are short (Figure 5A), suggesting poor sorting and microscopic connectivity of pore throats.
Highly variable pore throat radii are quite apparent from the MICP data with the average pore throat radius being mostly less than 2.0 μm with a non-uniform distribution (Figure 6B). Most of the mercury withdrawal efficiency is in the range of 25–45% (Figure 6A). The maximum mercury saturation has a concentrated distribution from 65% to 95%, with an average value of 89.69% (Figure 6C). Other parameters that can reflect pore structure characteristics, such as porosity (φ), permeability (k), and displacement pressure (Pd) also have a wide range of distribution (Figure 3 and Figure 6D). Overall, the pore structures in the Es4 sandstone reservoirs are characterized by strong reservoir heterogeneities, highly variable pore throat sizes, and poor microscopic connectivity.

4.3. Micro-Fracture Analysis

Micro-fractures are well developed in Es4 reservoirs, which can be observed on core photos, photomicrographs, and MICP analysis (Figure 7). The capillary curves of samples with micro-fractures exhibit an obvious two-segment pattern in the mercury intrusion stage (Figure 7). In the initial stage of mercury intrusion, the mercury saturation increases rapidly, and the capillary pressure curve shows a relatively long flat segment, which is characteristic of fracture systems. With the increasing mercury pressure, mercury saturation increases slowly, and the capillary curve becomes inclined (Figure 7). However, the response of micro-fractures on the NMR T2 spectra is not obvious, implying that the micro-fractures have little effect on the detection of pores. Macroscopically, the development of fractures also has a minor effect on porosity but a significant effect on the permeability (Figure 3B).
The pore structures in the samples investigated are generally characterized by a low displacement pressure (Pd), a large average pore throat radius, and a poor pore throat sorting (Figure 7). The presence of micro-fractures can greatly alter the pore structure and make an excessive contribution to the fluid low in sandstones (Figure 7) [55].

4.4. NMR Experiments and Data Analysis

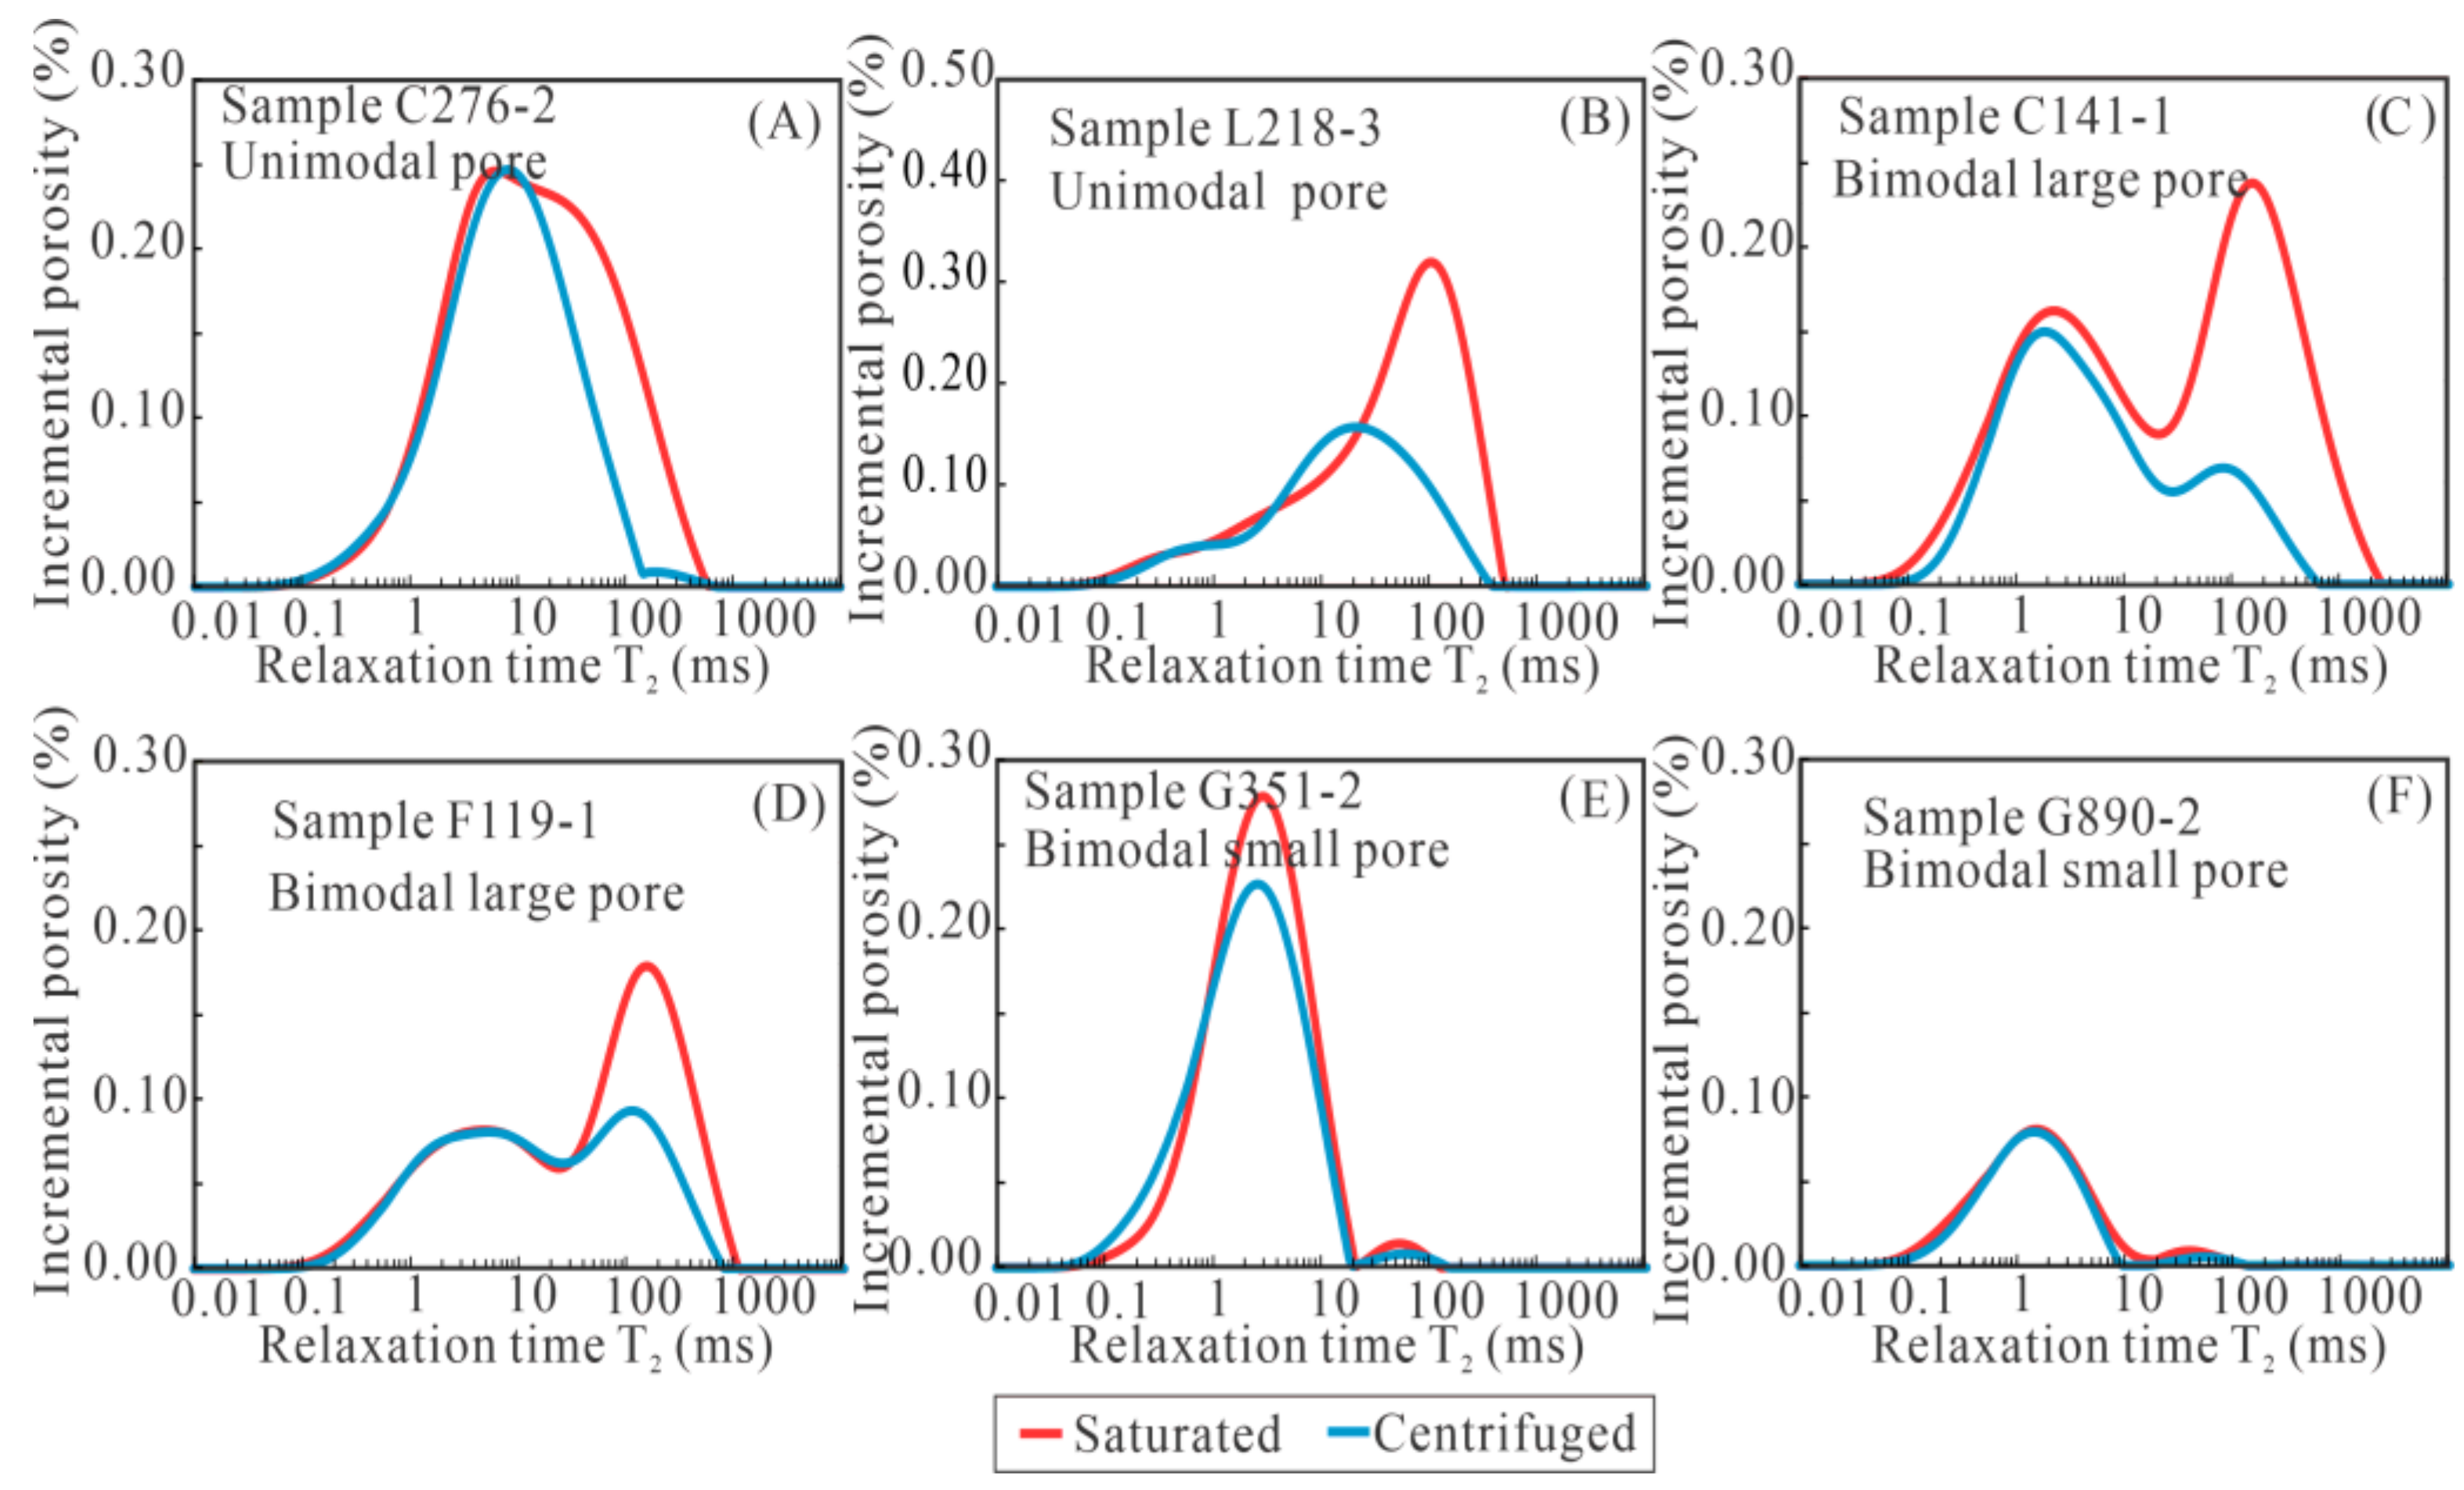
4.4.1. NMR T2 Spectral Analysis

The pore size distribution is closely related to the characteristics of the NMR T2 spectra. For example, the T2 relaxation times with longer values are usually associated with larger pores [48,56]. Hence, NMR T2 spectra can provide crucial information for pore size evaluation. Different from the pore throat size distribution derived from MICP analysis, NMR experiments can provide information of the full-range pore structures [9]. According to the NMR experiments performed on 21 sandstone samples from the Es4 reservoir, the NMR T2 spectra are characterized as both unimodal and bimodal (Figure 8), indicating great differences among various sandstone samples [56]. Some typical NMR T2 spectral distributions are shown in Figure 8A–F.
Samples with unimodal distribution (e.g., samples C276-2 and L218-3) display a continuous pore size distribution, while the T2 relaxation time is mainly between 0.1 ms and 1000 ms (Figure 8A,B). The pore systems are dominated by dissolution pores and residual intergranular pores (Figure 4A,G,H). Samples with bimodal behaviors are shown to have both long and short T2 components (Figure 8C–F), implying a wide range of pore size distribution and strong reservoir heterogeneities. The bimodal behaviors can be further separated into bimodal large pore and bimodal small pore behaviors, considering the morphological features on the NMR T2 spectra. The bimodal large pore samples (e.g., samples C141-1 and F119-1) usually have a wider range of T2 values (mainly in the range of 0.1–3000 ms) compared with these samples with unimodal distributions (Figure 8C,D). The pore systems are dominated by residual intergranular pores and dissolution pores (Figure 4I,J). Very large T2 values (>100 ms) are rare in the sandstone samples with bimodal small pore distributions due to the lack of the large pores (Figure 4K,L). The bimodal small pore distributions are usually characterized by a higher left peak and a lower right peak. The T2 values of the left peak are commonly less than 10 ms, and the amplitude is significantly higher than that of the right peak (Figure 8E,F).

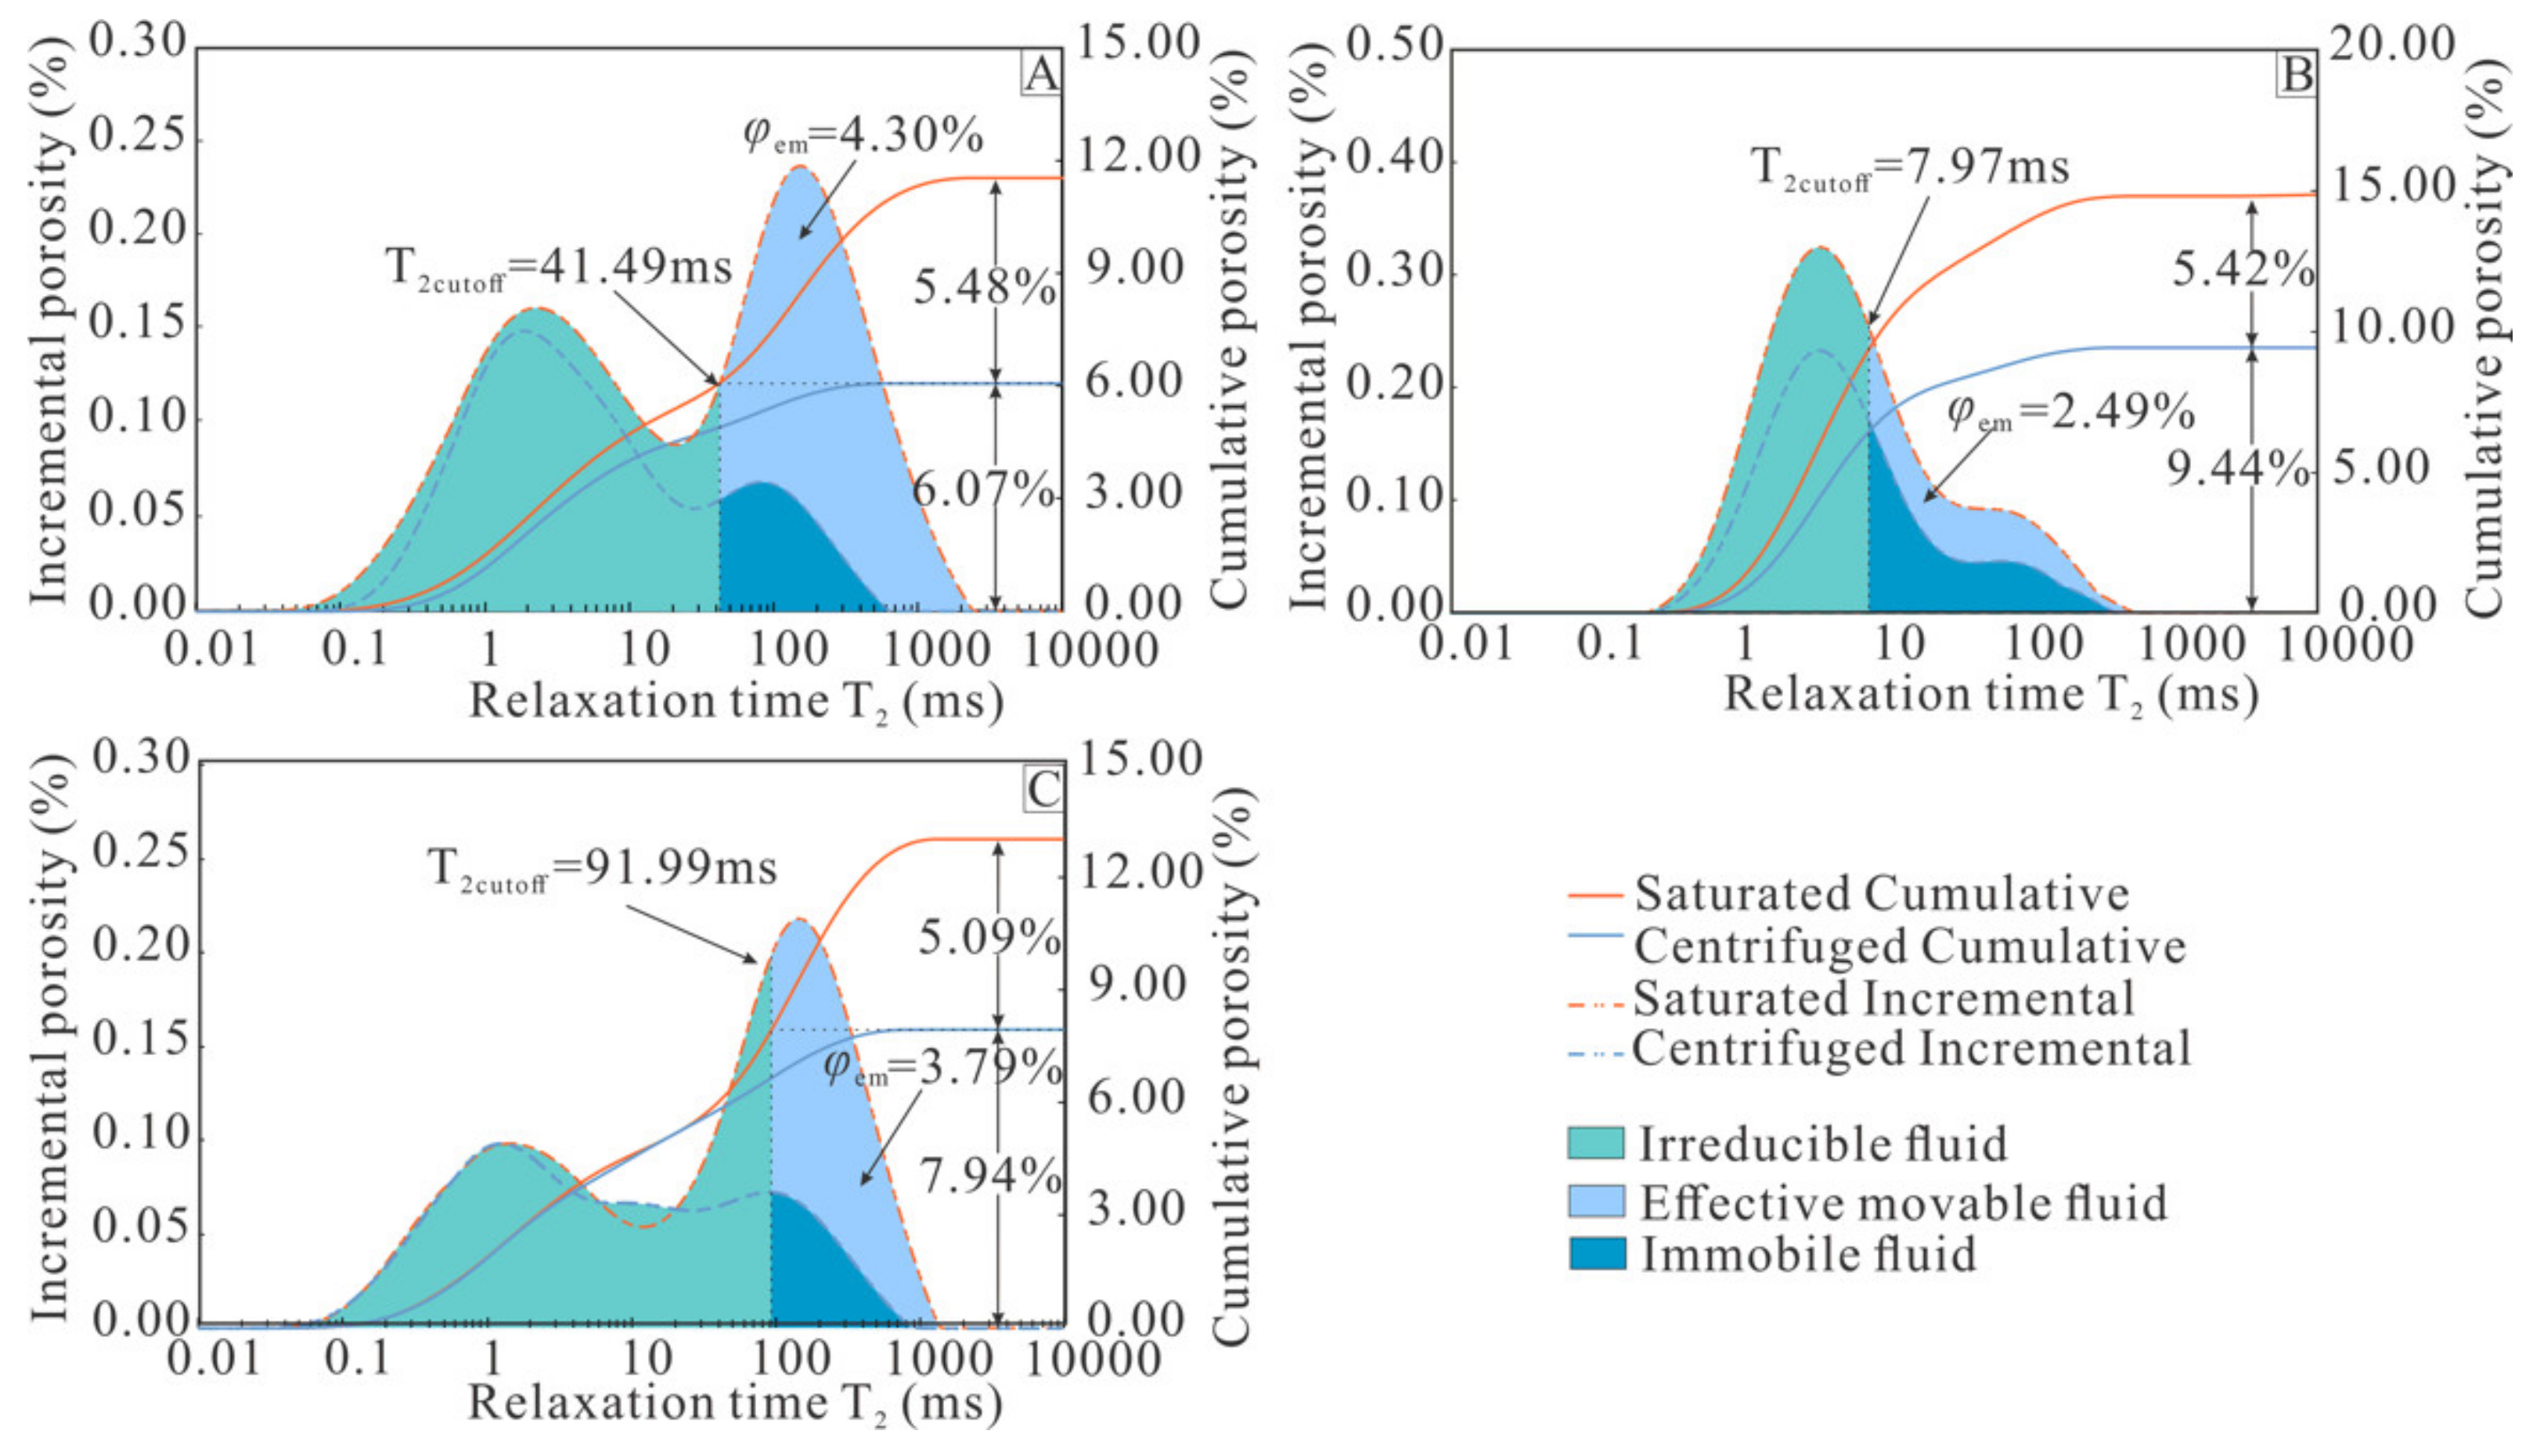
4.4.2. Effective Movable Fluid in Pore Space

The pore fluid in sandstones can be separated into irreducible and movable fluid (including the effective movable fluid and immobile fluid) at the T2cutoff values [29,57,58]. The irreducible fluid is considered to be clay- or capillary-bound water retained in pores [47]. NMR analyses show that the T2cutoff values obtained from 20 sandstone samples have a wide range from 2.83–150.41 ms (averaging 42.29 ms), indicating the complexity of movable fluid distribution in the Es4 sandstone reservoirs (Table 1). Previous studies have shown that the centrifugal component cannot reach zero even when T2 > T2cutoff (Figure 9) [40,41]. There may still be ineffective movable fluid (immobile fluid) presence in the pore throats beyond the T2cutoff values (Figure 9) due to the presence of isolated intergranular pores. The porosity for movable fluids (φm) is not effective in characterizing movable fluid distribution. As shown in Figure 9, the samples with similar φm show different pore size distribution and petrophysical properties. Therefore, a new parameter (porosity for effective movable fluids (φem)) was proposed [40,41], which is the product of the saturation for effective movable fluid and NMR porosity under 100% water-saturated state (Figure 9).
Statistical analysis shows that the φem varies from 0.02% to 5.98% (averaging 2.41%) (Table 1), suggesting a poor connectivity of microspore throats and complex occurrence states of fluids in the micro-pore space. The value of φem exhibits a strong correlation with average pore throat radius (Rave) (R2 = 0.76), implying that φem is closely associated with micro-pore structures (Figure 10). The correlation between φem and permeability was also investigated, and an excellent exponential correlation (R2 = 0.90) was obtained (Figure 11A). However, φem is less strongly correlated with porosity, with a relativity low determination coefficient (R2 = 0.47; Figure 11B). The movable fluid mainly exists in the large intergranular pores connected by effective pore throats, since the micropores and small secondary dissolution pores are isolated or very poorly connected. Therefore, the permeability is mainly contributed by φem rather than porosity. Consequently, φem is more suitable to characterize the reservoir permeability capacity and microspore structures.

5. Discussions

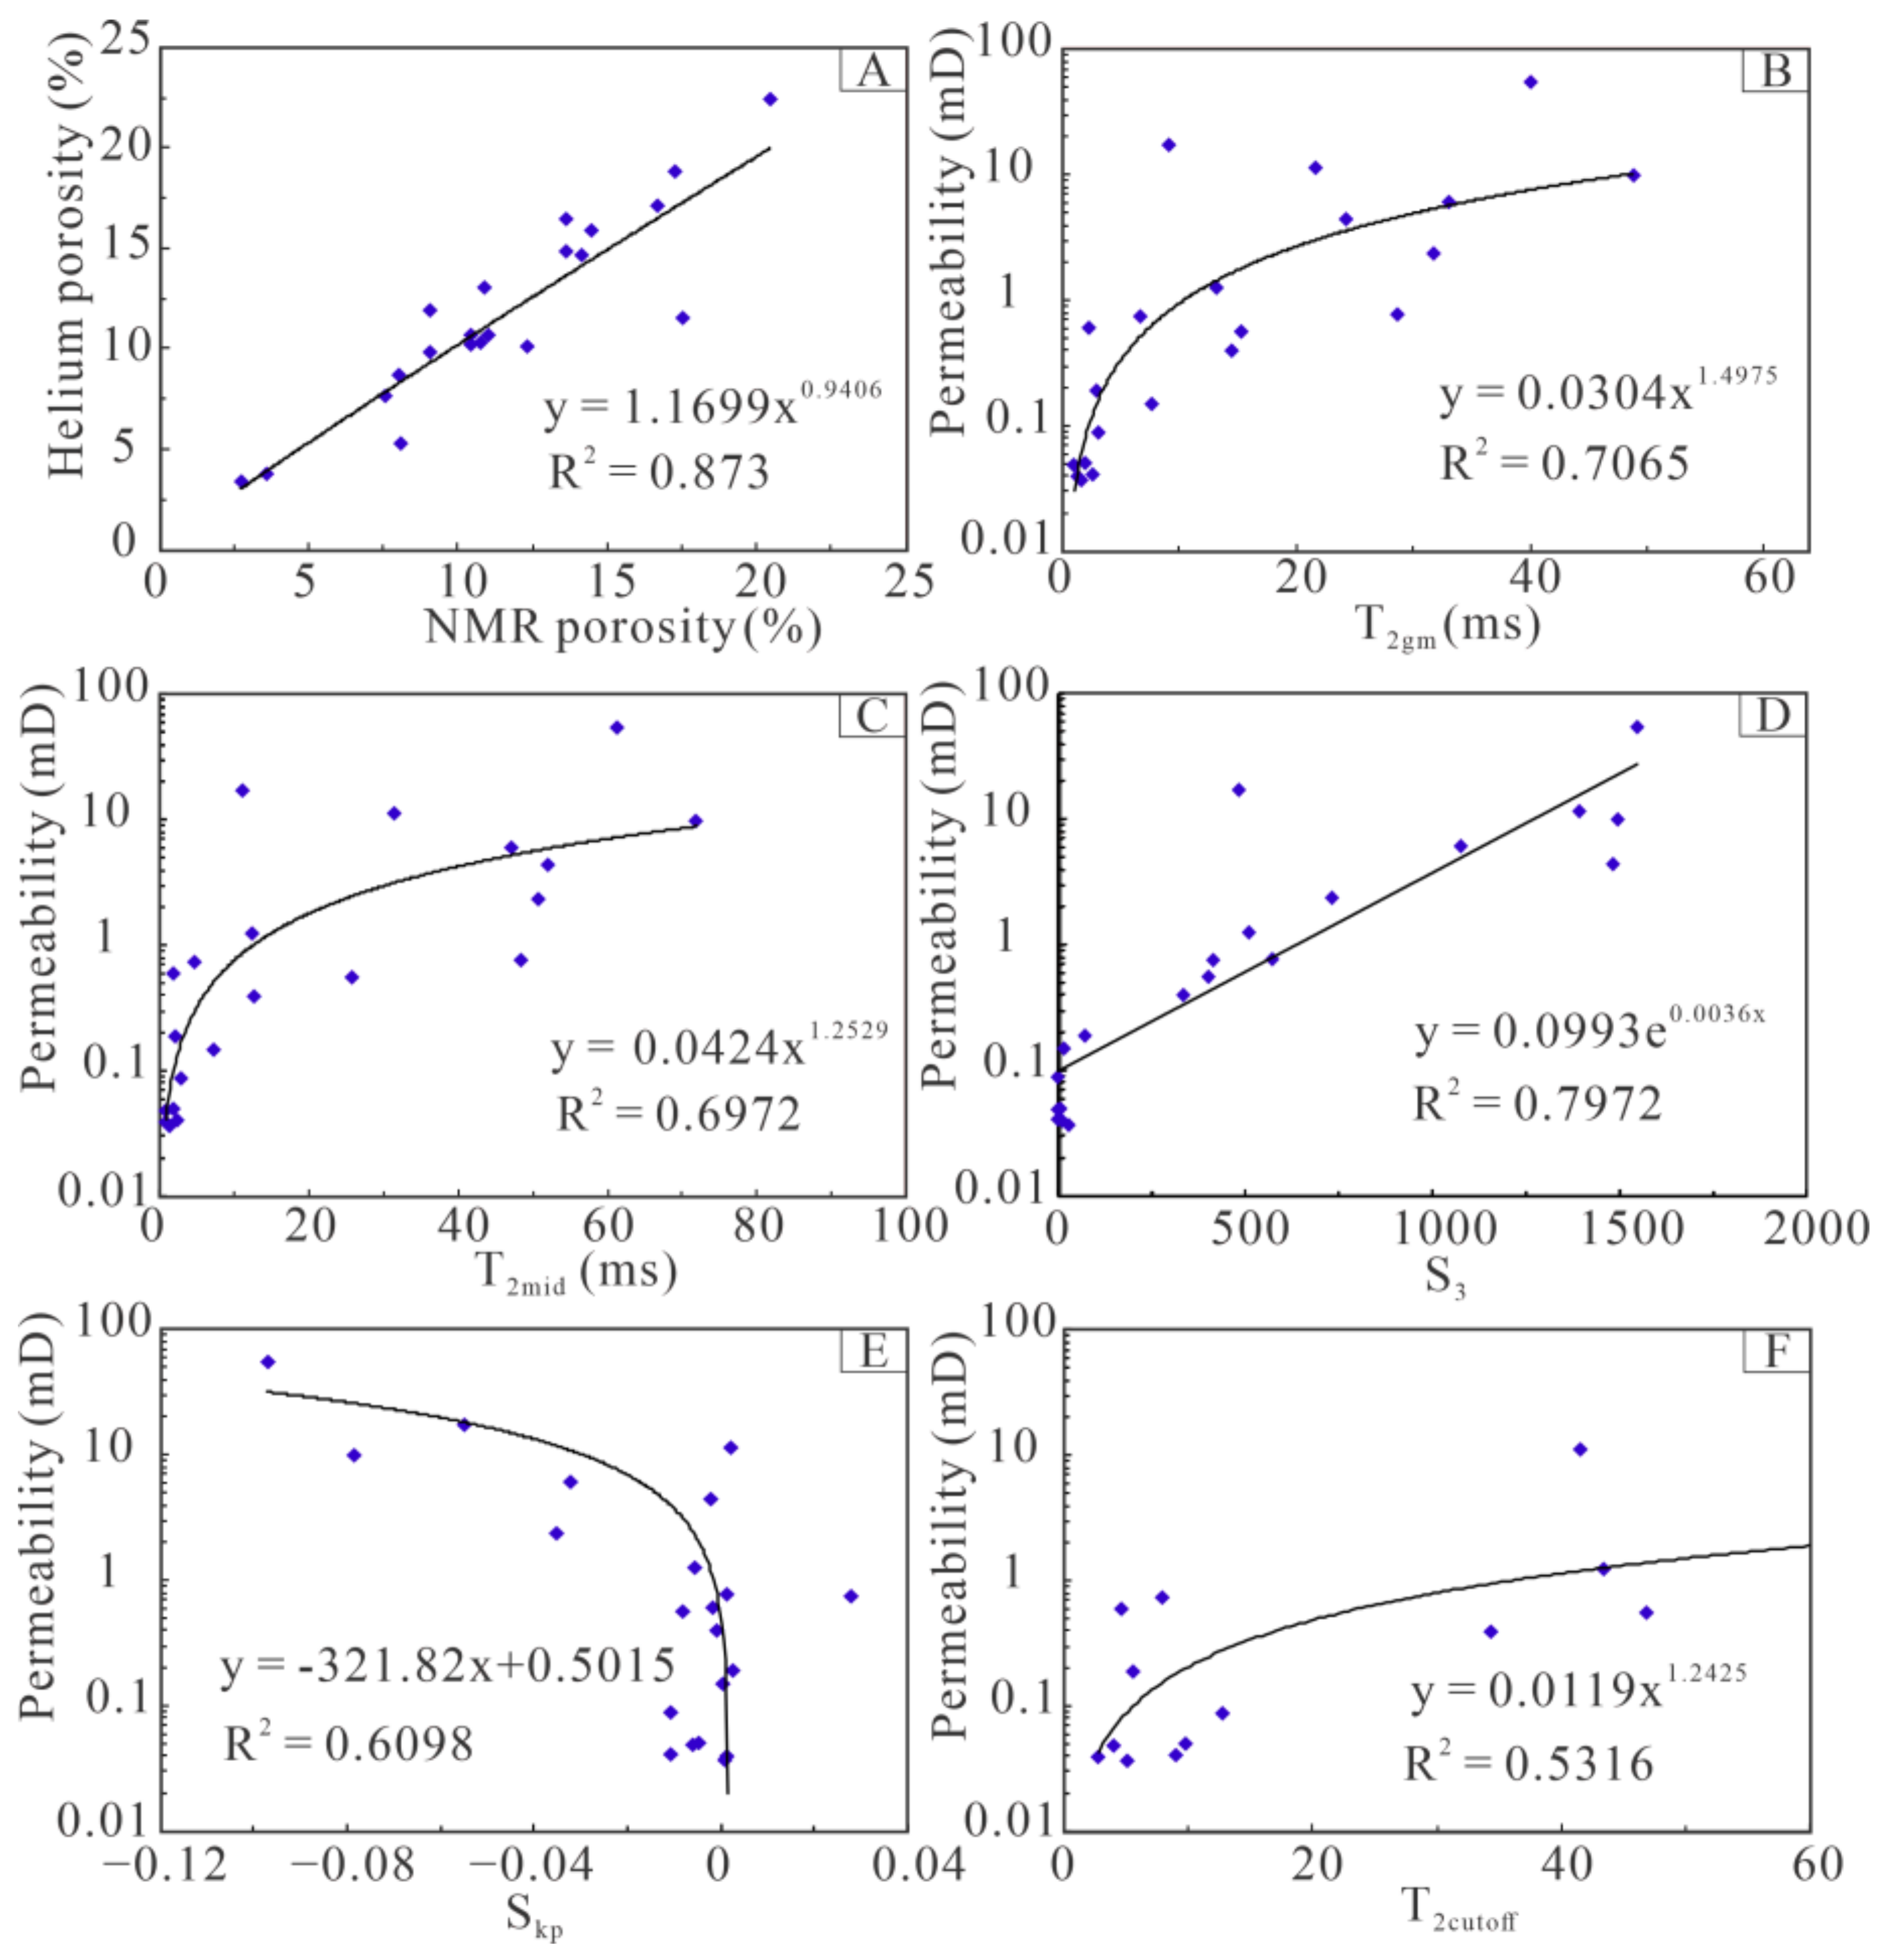
5.1. Relationships between NMR T2 Spectral Parameters and Petrophysical Properties

Petrophysical properties are controlled by the microscopic pore structures of reservoirs [59,60,61]. Based on 21 sandstone samples from the Es4 reservoir in the Dongying Depression, the relationships between the NMR T2 spectral parameters and petrophysical parameters were investigated (Figure 12). The NMR T2 spectral parameters are shown to be intimately correlated to reservoir petrophysical properties, indicating that the T2 spectral parameters can be used to characterize reservoir permeability and microscopic pore structures.
Pore volumes from helium porosity measurement can also be adequately approximated by NMR experiments [28,29]. The NMR porosity exhibits a strong correlation with helium porosity (R2 = 0.87; Figure 12A), suggesting the effectiveness of using the surface relaxation mechanism in reflecting pore systems of low-permeability reservoirs. In addition, a strong exponential correlation between T2gm and permeability is observed for the Es4 reservoirs (R2 = 0.71; Figure 12B), implying that the sandstones with abundant long T2 components are characteristic of good reservoir quality. In contrast, the sandstone with poor reservoir quality is mainly associated with short T2 components, correlating with a lower value of T2gm. The value of T2mid appears to be well correlated with permeability (R2 = 0.70; Figure 12C), indicating that high-quality reservoirs are dominated by large T2mid values. S3 is consistent with the proportions of macropores and shows a strong correlation with permeability (R2 = 0.80; Figure 12D), suggesting that macropores are of great importance for improving reservoir permeability. To further illustrate this point, the correlation between Skp and permeability was investigated. As shown in Figure 12E, Skp has a negative correlation with permeability (R2 = 0.61), indicating that Skp decreases with increasing permeability. This is because reservoirs with low Skp often have high proportions of macropores, and these macropores have profound controls on the overall permeability of the reservoir. Therefore, macropore systems greatly control the pore structures and reservoir quality of low-permeability sandstones. The T2cutoff value is weakly correlated with permeability with a determination coefficient (R2) of 0.53 (Figure 12F). This indicates that the pore radius corresponding to the bound fluids are complex, reflecting the complexity of microscopic pore structures.

5.2. Comparison of NMR T2 Spectral Parameters and MICP Capillary Parameters

In order to verify the reliability of NMR T2 spectral parameters for pore structure characterization, a comparative analysis between T2 spectral parameters and MICP capillary parameters was carried out for parameters with similar petrophysical proxies.
MICP measurement is only effective in measuring pore throat sizes, whereas NMR analysis can better detect the pore sizes. Limited by the maximum mercury injection pressure attainable, some nanopore throats cannot be detected by MICP measurements, but the majority of micro/nano-scale pore throats can be obtained. In addition, influenced by a Haines jump, the mercury cannot enter into tortuous pore networks uniformly, rather in a process of rapid filling [62,63]. The effect of Haines jump is more significant in the initial stage of mercury intrusion, when most pores are unfilled [63]. This results in that a considerable amount of the large throats has not been accounted for. Therefore, the throat size distribution derived from MICP data is apparently narrower compared with the actual distribution (Figure 13 and Figure 14). As shown in Figure 13, the large pore throats do exist in sandstone samples, and they can be detected by 2D image analysis based on the “maximal balls” algorithm [64].
However, the overall trends in pore sizes revealed by optical photomicrograph analysis, MICP, and NMR are the same (Figure 14 and Figure 15A,B). Regression analysis shows that the T2 relaxation times (T2max and T2mid) are consistent with the corresponding pore throat radius derived from MICP data. In general, T2max and T2mid increase with increasing pore throat radius (maximum pore throat radius (Rmax) and median pore throat radius (R50)), with good exponential correlations (Figure 15A,B), confirming the applicability of using NMR T2 relaxation times to calculate pore sizes. Due to the shielding effect of large throats caused by Haines jump, the correlation between the T2max and maximum pore throat radius (Rmax) is relatively weak (R2 = 0.67; Figure 15A).
We also investigated the reliability of using NMR T2 spectral parameters to approximate the pore size distribution by using the sorting coefficient (σ) and skewness (Skp). As shown in Figure 15C, there is a weak to moderate determination correlation (R2 = 0.53) between σ calculated from NMR and MICP data, but there is no apparent correlation between Skp derived from NMR and MICP data (Figure 15D). This may be because MICP is effective in identifying smaller pore throats but is not suitable to detect large pore throats [65], whereas NMR can provide the full-range pore structure information [30]. Thus, the pore size distribution derived from NMR experiments is wider than that from MICP measurements (Figure A3). This leads to some differences in the morphological characteristics and skewness derived from NMR and MICP.
As shown in Figure 15E, φem derived from NMR experiments is consistent with the displacement pressure computed from MICP measurements, showing a negative relationship (R2 = 0.78). In addition, for the Es4 sandstone reservoirs, the movable fluid saturation (Smov) obtained from NMR appears to be correlated with the maximum mercury saturation from MICP (R2 = 0.59; Figure 15F). The results indicate that the NMR T2 spectral parameters are effective in estimating the fluid distribution in pore space and microscopic pore connectivity.
The comparative results demonstrate that the NMR T2 spectral parameters are in good fits with the capillary parameters, suggesting that the pore structures can be evaluated and characterized by NMR analysis. In addition, the NMR T2 spectral parameters can be used to characterize the capillary parameters that can usually not be easily obtained by MICP. If continuous NMR logging data is available, continuous pore structures can be obtained by using the NMR T2 spectral parameters [28].

5.3. Application of NMR T2 Spectral Analysis in Pore Structure Evaluation

NMR T2 spectral analysis can provide quantitative parameters for reservoir classification and evaluation. According to the NMR T2 spectral parameters combined with petrography, MICP, and NMR T2 spectral analysis, four typical pore structures (I, II, III, and IV) of the sandstone reservoir in the Dongying Depression are classified (Figure 16). The results show that the T2 spectral parameters are sensitive to the characteristics of pore structures (Figure 17 and Table 2). From Type I to Type IV pore structures, the values of T2mid, T2max, T2gm, and φem gradually increase, while the value of irreducible water saturation (Swi) decreases (Figure 17 and Table 2). The detailed information of pore structures are as follows.
The capillary pressure cures of the Type I pore structure exhibit a long flat segment in the mercury intrusion stage, and it has the lowest displacement pressure (Figure 16I-A). The NMR T2 spectra are characterized as unimodal with longer relaxation time, implying a high proportion of large pores (Figure 16I-B). The T2 relaxation time ranges between 1 and 300 ms with a concentrated distribution (Figure 16I-B), and the corresponding pore size ranges from 0.6 to 4.0 μm. This is usually typical of micro-fractures or large pore systems. The large pore systems are the combination of residual intergranular pores and dissolution pores (Figure 16I-C). Since the Type I pore structure has a larger pore throat radius and a better microscopic connectivity, it exhibits comparatively higher permeability.
The capillary pressure cures show a relatively low displacement pressure and maximum mercury saturation in the Type II pore structure (Figure 16II-A). The NMR T2 spectra exhibit unimodal or bimodal behaviors with a higher right peak (Figure 16II-B). The T2 relaxation time is mainly between 1 and 200 ms (Figure 16II-B), with pore sizes being concentrated mostly between 0.1 and 1.6 μm. The volume of the pore throat is lower than that in the Type I pore structure. The pore types of the Type II pore structure are composed mainly of intergranular pores and dissolution pores (Figure 16II-C), which show a good petrophysical properties and microscopic connectivity.
Type III capillary pressure curves are characterized by a shorter flat segment and a higher displacement pressure (Figure 16III-A). The NMR T2 spectra are typical of bimodal. The T2 relaxation time has a wide range of distribution, and the proportion of large pore throats is low (Figure 16III-B). The pore types of the Type III pore structure are dominated by isolated dissolution pores with rare residual intergranular pores. Extensively, carbonate cementation is present in the Type III pore structure-dominated sandstones, forming a pore system dominated by small pore throats (Figure 16III-C).
The flat segments of Type IV capillary pressure curves are the shortest compared with all the other types of pore structures, and the microscopic connectivity is the poorest (Figure 16IV-A). The NMR T2 spectra are characterized as unimodal or weak-bimodal with shorter relaxation time, indicating the presence of a high proportion of small pores (Figure 16IV-B). The T2 relaxation time is mainly between 0.3 and 10 ms (Figure 16IV-B), and the corresponding pore sizes are in the range of 0.004–0.1 μm. Except for a small amount of isolated dissolution pores, micropores dominate the pore space of the Type IV pore structure. The Type IV pore structure-dominated sandstones are characterized by strong compaction and extensive carbonate cementation with no visible pores in thin sections (Figure 16IV-C). In some cases, abundant clay-dominated micropores are present in Type IV pore structure-dominated sandstones, exhibiting high porosity but low permeability.

6. Conclusions

The petrophysical properties, pore structures, and effective movable fluid in pore space were analyzed by integrated optical and SEM petrographic and petrophysical analyses including poroperm, MICP, and NMR measurements. Various quantitative T2 spectral parameters derived from NMR experiments were employed to characterize and evaluate the pore structures of the Eocene sandstone reservoirs in the Dongying Depression, Bohai Bay Basin, China. Some key findings are as follows:
(1)
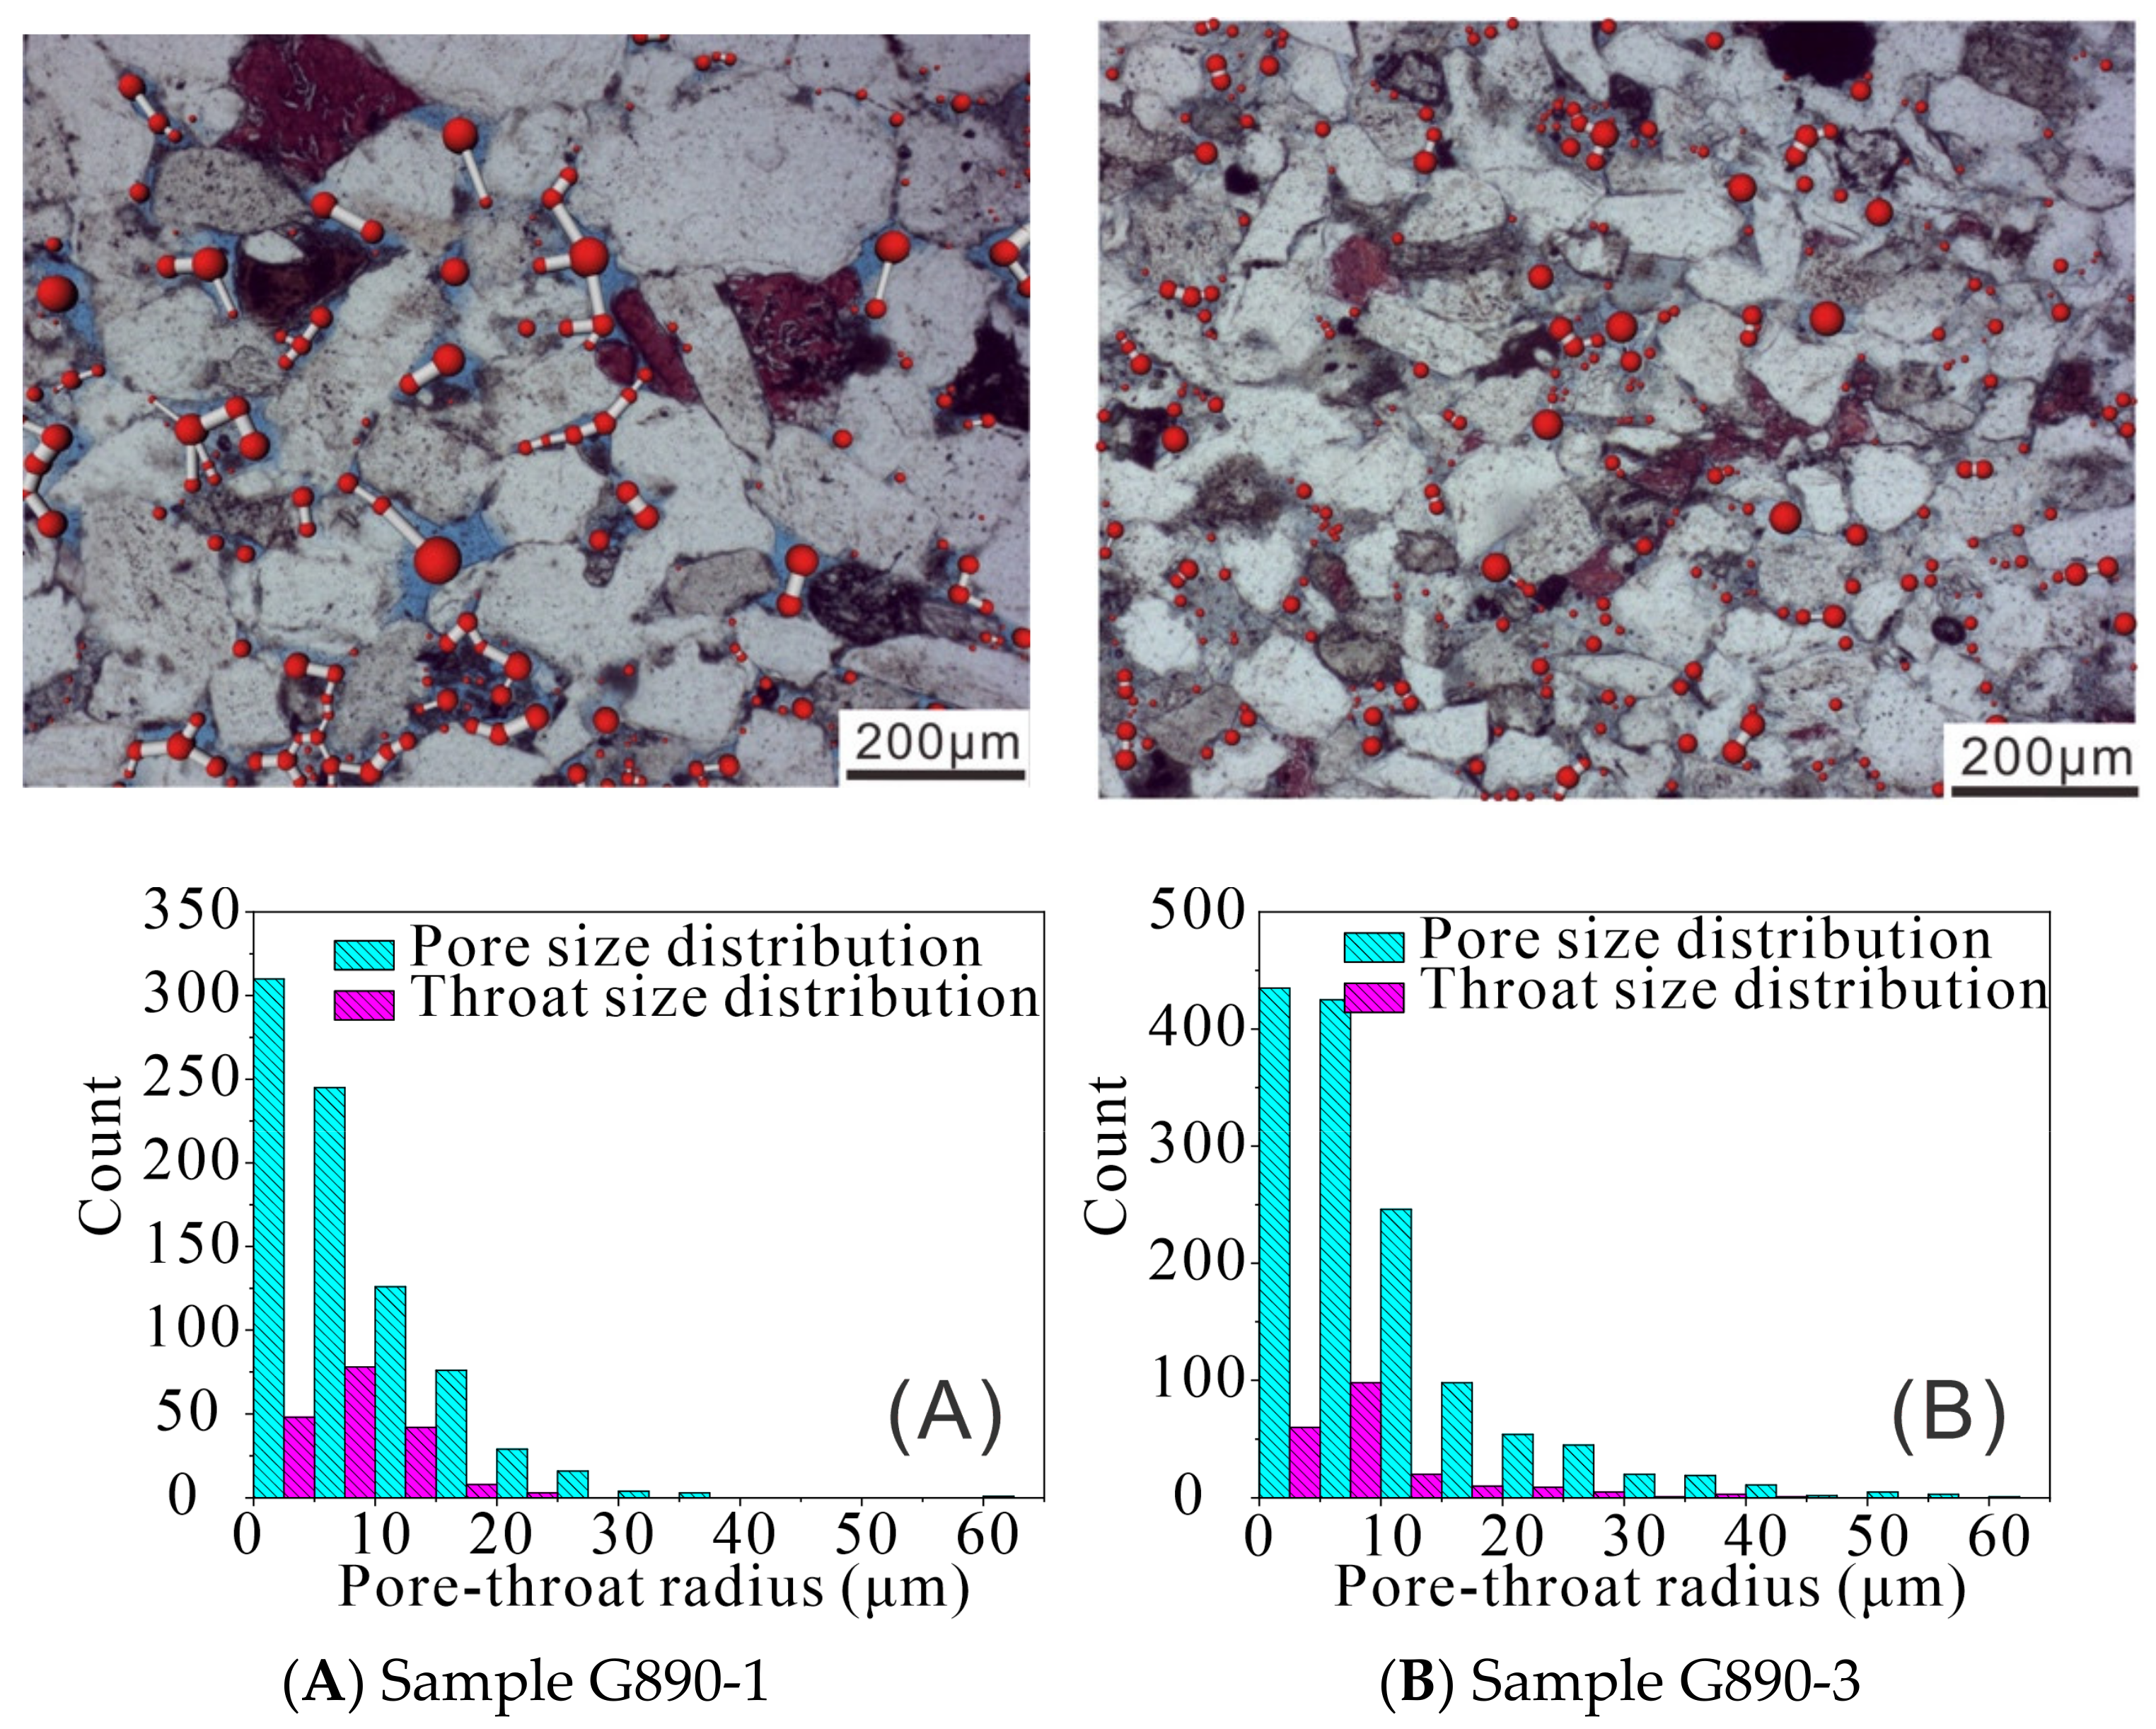
Petrographic analysis reveals that the pore systems in the Eocene sandstone are composed mainly of residual intergranular pores, dissolution pores, micropores, and a minor amount of micro-fractures.
(2)
The T2gm, T2mid, S3, and φem parameters have positive relationships with permeability, suggesting that the proportion of large and effective pores has a profound control on the overall permeability of the sandstones. Thus, the permeability of the Eocene sandstone is mainly dominated by large pore systems.
(3)
The NMR T2 spectral parameters exhibit excellent correlations with MICP capillary parameters, indicating that the NMR T2 spectral parameters also contain rich information on pore structures and movable fluids. Thus, pore structures, pore fluid distribution, and reservoir permeability can be effectively evaluated by using NMR T2 spectral parameters.
(4)
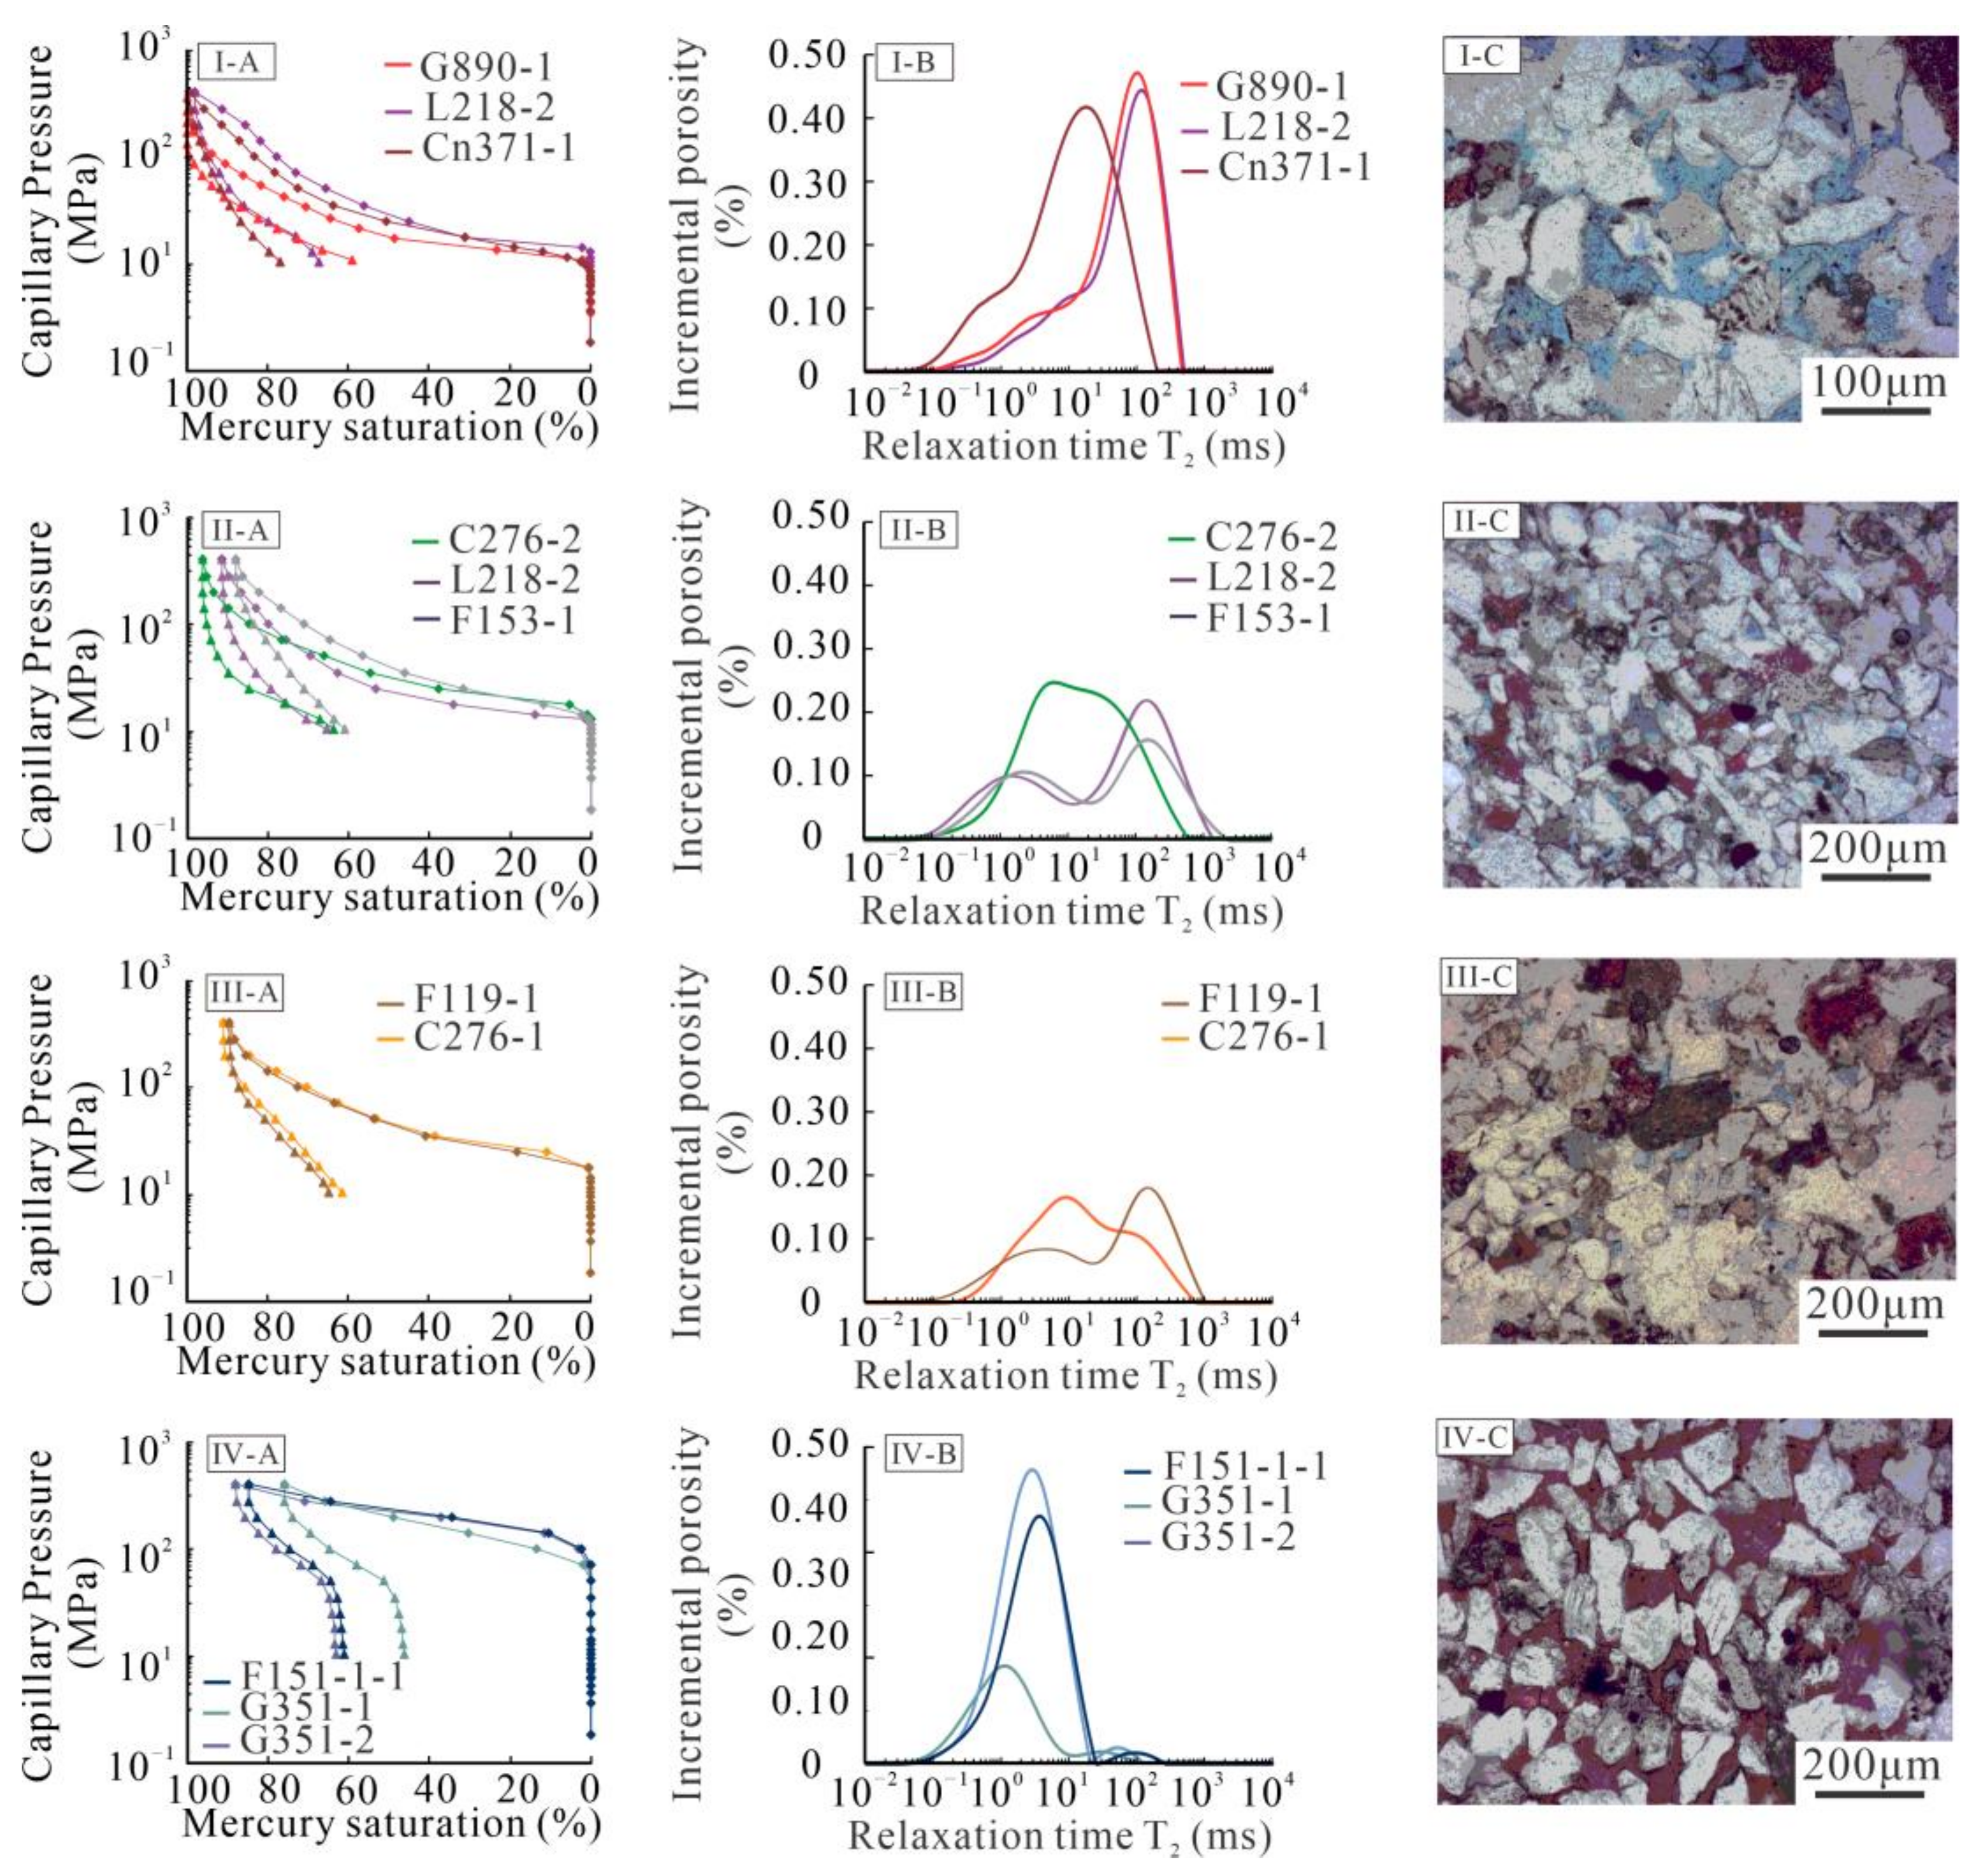
A comprehensive classification scheme of the Eocene sandstones is established based on NMR T2 spectral parameters while considering the petrophysical properties and macroscopic behaviors. The Es4 sandstone reservoirs are classified into four types of pore structures (I, II, III, and IV). Type I and II pore structures exhibit good petrophysical properties and microscopic connectivity. Our study demonstrates the effectiveness and applicability of the NMR technique in characterizing low-permeability sandstone reservoirs and provides a basis for further improving reservoir quality evaluation in the Bohai Bay Basin, China. However, limited by the quantity of NMR experimental data, continuous evaluation of pore structure throughout entire reservoir intervals would not be feasible. The combination of NMR experimental data and NMR logging or conventional logging data would be crucial for further extending these research findings.

Author Contributions

Conceptualization, Y.L. and K.L.; methodology, Y.L., K.L. and Y.W.; validation, Y.L. and Y.W.; formal analysis, Y.L.; investigation, Y.L., K.L. and Y.W.; resources, Y.L. and Y.W.; data curation, Y.L.; writing—original draft preparation, Y.L.; writing—review and editing, Y.L., K.L. and Y.W.; visualization, Y.L.; supervision, K.L.; project administration, K.L.; funding acquisition, K.L. All authors have read and agreed to the published version of the manuscript.

Funding

This research was funded by the National Natural Science Foundation of China (Grant No. 41821002), the Strategic Priority Research Program of the Chinese Academy of Sciences (No. XDA14010401) and the National Science & Technology Major Project of China (No. 2017ZX05009001).

Institutional Review Board Statement

Not applicable.

Informed Consent Statement

Not applicable.

Data Availability Statement

The data presented in this study are available on request from the corresponding author.

Conflicts of Interest

The authors declare no conflict of interest.

Appendix A

Figure A1. Schematic Tertiary stratigraphy and tectonic evolution in the Dongying Depression.
Applsci 11 08027 g0a1
Figure A2. NMR T2 spectral parameters and their locations in a NMR T2 spectra.
Applsci 11 08027 g0a2
Figure A3. Pore throat sizes and pore components derived from NMR and MICP experiments.
Applsci 11 08027 g0a3

References

  1. Yuan, G.; Gluyas, J.; Cao, Y.; Oxtoby, N.H.; Jia, Z.; Wang, Y.; Li, X. Diagenesis and reservoir quality evolution of the Eocene sandstones in the northern Dongying Sag, Bohai Bay Basin, East China. Mar. Pet. Geol. 2015, 62, 77–89. [Google Scholar] [CrossRef]
  2. Zahid, M.A.; Chunmei, D.; Lin, C.; Gluyas, J.; Jones, S.; Zhang, X.; Munawar, M.J.; Ma, C. Sequence stratigraphy, sedimentary facies and reservoir quality of Es4s, southern slope of Dongying Depression, Bohai Bay Basin, East China. Mar. Petrol. Geol. 2016, 77, 448–470. [Google Scholar] [CrossRef]
  3. Lu, Y.; Liu, K. Pore structure characterization of Eocene low-permeability sandstones via fractal analysis and machine learning: An example from the Dongying Depression, Bohai Bay Basin, China. ACS Omega 2021, 6, 11693–11710. [Google Scholar] [CrossRef] [PubMed]
  4. Ajdukiewicz, J.M.; Lander, R.H. Sandstone reservoir quality prediction: The state of the art. AAPG Bull. 2010, 94, 1083–1091. [Google Scholar] [CrossRef]
  5. Blunt, M.J.; Bijeljic, B.; Dong, H.; Gharbi, O.; Iglauer, S.; Mostaghimi, P.; Paluszny, A.; Pentland, C. Pore-scale imaging and modelling. Adv. Water Resour. 2013, 51, 197–216. [Google Scholar] [CrossRef] [Green Version]
  6. Medina, C.; Mastalerz, M.; Rupp, J. Characterization of porosity and pore-size distribution using multiple analytical tools: Implications for carbonate reservoir characterization in geologic storage of CO2. Environ. Geosci. 2017, 24, 51–72. [Google Scholar] [CrossRef]
  7. Jiu, B.; Huang, W.; He, M.; Lv, C.; Liang, F. Quantitative analysis of micron-scale and nano-scale pore throat characteristics of tight sandstone using matlab. Appl. Sci. 2018, 8, 1272. [Google Scholar] [CrossRef] [Green Version]
  8. Weger, R.J.; Eberli, G.P.; Baechle, G.T.; Massaferro, J.L.; Sun, Y.F. Quantification of pore structure and its effect on sonic velocity and permeability in carbonates. AAPG Bull. 2009, 93, 1297–1317. [Google Scholar] [CrossRef]
  9. Rezaee, R.; Saeedi, A.; Clennell, B. Tight gas sands permeability estimation from mercury injection capillary pressure and nuclear magnetic resonance data. J. Pet. Sci. Eng. 2012, 88–89, 92–99. [Google Scholar] [CrossRef] [Green Version]
  10. Song, W.; Wang, D.; Yao, J.; Li, Y.; Sun, H.; Yang, Y.; Zhang, L. Multiscale image-based fractal characteristic of shale pore structure with implication to accurate prediction of gas permeability. Fuel 2019, 241, 522–532. [Google Scholar] [CrossRef]
  11. Mozley, P.S.; Heath, J.E.; Dewers, T.A.; Bauer, S.J. Origin and heterogeneity of pore sizes in the Mount Simon sandstone and Eau Claire formation: Implications for multiphase fluid flow. Geosphere 2016, 12, 1341–1361. [Google Scholar] [CrossRef]
  12. Mehrabi, H.; Esrafili-Dizaji, B.; Hajikazemi, E.; Noori, B. Reservoir characterization of the Burgan Formation in northwestern Persian Gulf. J. Pet. Sci. Eng. 2019, 174, 328–350. [Google Scholar] [CrossRef]
  13. Nelson, P. Pore-throat sizes in sandstones, tight sandstones, and shales. AAPG Bull. 2009, 93, 329–340. [Google Scholar] [CrossRef]
  14. Anovitz, L.M.; Cole, D.R. Characterization and analysis of porosity and pore structures. Rev. Mineral. Geochem. 2015, 80, 61–164. [Google Scholar] [CrossRef] [Green Version]
  15. Tsakiroglou, C.D.; Payatakes, A.C. Characterization of the pore structure of reservoir rocks with the aid of serial sectioning analysis, mercury porosimetry and network simulation. Adv. Water Resour. 2000, 23, 773–789. [Google Scholar] [CrossRef]
  16. Hollis, C.; Vahrenkamp, V.; Tull, S.; Mookerjee, A.; Taberner, C.; Huang, Y. Pore system characterization in heterogeneous carbonates: An alternative approach to widely-used rock-typing methodologies. Mar. Pet. Geol. 2010, 27, 772–793. [Google Scholar] [CrossRef]
  17. Kassab, M.A.; Hashish, M.F.A.; Nabawy, B.S.; Elnaggar, O.M. Effect of kaolinite as a key factor controlling the petrophysical properties of the Nubia sandstone in central Eastern desert. Egypt. J. Afr. Earth Sci. 2017, 125, 103–117. [Google Scholar] [CrossRef]
  18. Bera, B.; Mitra, S.K.; Vick, D. Understanding the micro structure of Berea sandstone by the simultaneous use of micro-computed tomography (micro-CT) and focused ion beam-scanning electron microscopy (FIB-SEM). Micron 2011, 42, 412–418. [Google Scholar] [CrossRef] [PubMed]
  19. Chalmers, G.R.L.; Bustin, R.M.; Power, I.M. Characterization of gas shale pore systems by porosimetry, pycnometry, surface area, and field emission scanning electron microscopy/transmission electron microscopy image analyses: Examples from the Barnett, Woodford, Haynesville, Marcellus, and Doig units. AAPG Bull. 2012, 96, 1099–1119. [Google Scholar] [CrossRef]
  20. Nooruddin, H.A.; Hossain, M.E.; Al-Yousef, H.; Okasha, T. Comparison of permeability models using mercury injection capillary pressure data on carbonate rock samples. J. Pet. Sci. Eng. 2014, 121, 9–22. [Google Scholar] [CrossRef]
  21. Lai, J.; Wang, G. Fractal analysis of tight gas sandstones using high-pressure mercury intrusion techniques. J. Nat. Gas Sci. Eng. 2015, 24, 185–196. [Google Scholar] [CrossRef]
  22. Fang, X.; Cai, Y.; Liu, D.; Zhou, Y. A mercury intrusion porosimetry method for methane diffusivity and permeability evaluation in coals: A comparative analysis. Appl. Sci. 2018, 8, 860. [Google Scholar] [CrossRef] [Green Version]
  23. Al-Raoush, R.I.; Willson, C.S. Extraction of physically realistic pore network properties from three-dimensional synchrotron X-ray microtomography images of unconsolidated porous media systems. J. Hydrol. 2005, 300, 44–64. [Google Scholar] [CrossRef]
  24. Bultreys, T.; de Boever, W.; Cnudde, V. Imaging and image-based fluid transport modeling at the pore scale in geological materials: A practical introduction to the current state-of-the-art. Earth Sci. Rev. 2016, 155, 93–128. [Google Scholar] [CrossRef]
  25. Fang, H.H.; Sang, S.X.; Liu, S.Q. Three-dimensional spatial structure of the macro-pores and flow simulation in anthracite coal based on X-ray μ-CT scanning data. Petrol Sci. 2020, 17, 1221–1236. [Google Scholar] [CrossRef]
  26. Clarkson, C.R.; Freeman, M.; He, L.; Agamalian, M.; Melnichenko, Y.B.; Mastalerz, M.; Radlinski, A.P.; Blach, T.P. Characterization of tight gas reservoir pore structure using usans/sans and gas adsorption analysis. Fuel 2012, 95, 371–385. [Google Scholar] [CrossRef]
  27. Tripathy, A.; Kumar, A.; Srinivasan, V.; Singh, K.H.; Singh, T.N. Fractal analysis and spatial disposition of porosity in major indian gas shales using low-pressure nitrogen adsorption and advanced image segmentation. J. Nat. Gas Sci. Eng. 2019, 72, 103009. [Google Scholar] [CrossRef]
  28. Doveton, J.; Watney, L. Textural and pore size analysis of carbonates from integrated core and nuclear magnetic resonance logging: An Arbuckle study. Interpretation 2014, 3, SA77–SA89. [Google Scholar] [CrossRef]
  29. Dunn, K.J.; Bergman, D.J.; Latorraca, G.A. Nuclear Magnetic Resonance Petrophysical and Logging Application; Elsevier Science Ltd.: Kidlington, OX, UK, 2002. [Google Scholar]
  30. Daigle, H.; Thomas, B.; Rowe, H.; Nieto, M. Nuclear magnetic resonance characterization of shallow marine sediments from the Nankai trough, integrated ocean drilling program expedition 333. J. Geophys. Res. Soild Earth. 2014, 119, 2631–2650. [Google Scholar] [CrossRef]
  31. Sigal, R.F. Pore-size distributions for organic-shale-reservoir rocks from nuclear-magnetic- resonance spectra combined with adsorption measurements. SPE J. 2015, 20, 824–830. [Google Scholar] [CrossRef]
  32. Li, Z.; Wu, S.; Xia, D.; He, S.; Zhang, X. An investigation into pore structure and petrophysical property in tight sandstones: A case of the Yanchang Formation in the southern Ordos Basin, China. Mar. Pet. Geol. 2018, 97, 390–406. [Google Scholar] [CrossRef]
  33. Deng, H.; Tian, G.; Yu, S.; Jiang, Z.; Zhong, Z.; Zhang, Y. Research on strength prediction model of sand-like material based on nuclear magnetic resonance and fractal theory. Appl. Sci. 2020, 10, 6601. [Google Scholar] [CrossRef]
  34. Yu, S.; Deng, H.; Tian, G.; Deng, J. Microscopic Characteristic Analysis on Sandstone under Coupling Effect of Freeze–Thaw and Acidic Treatment: From Nuclear Magnetic Resonance Perspective. Appl. Sci. 2020, 10, 5699. [Google Scholar] [CrossRef]
  35. Xu, L.; Li, Q.; Myers, M.; Chen, Q.; Li, X. Application of nuclear magnetic resonance technology to carbon capture, utilization and storage: A review. J. Rock Mech. Geotech. Eng. 2019, 11, 892–908. [Google Scholar] [CrossRef]
  36. Thanh, H.V.; Sugai, Y.; Nguele, R.; Sasaki, K. Integrated workflow in 3D geological model construction for evaluation of CO2 storage capacity of a fractured basement reservoir in Cuu Long Basin, Vietnam. J. Greenh. Gas Control. 2019, 90, 102826. [Google Scholar] [CrossRef]
  37. Sun, W.; Zuo, Y.; Wu, Z.; Liu, H.; Xi, S.; Shui, Y.; Wang, J.; Liu, R.; Lin, J. Fractal analysis of pores and the pore structure of the Lower Cambrian Niutitang shale in northern Guizhou Province: Investigations using NMR, SEM and image analyses. Mar. Pet. Geol. 2019, 99, 416–428. [Google Scholar] [CrossRef]
  38. Zhang, Z.; Weller, A. Fractal dimension of pore-space geometry of an Eocene sandstone formation. Geophysics 2014, 79, D377–D387. [Google Scholar] [CrossRef]
  39. Wu, Y.; Tahmasebi, P.; Lin, C.; Zahid, M.A.; Dong, C.; Golab, N.A.; Ren, L. A comprehensive study on geometric, topological and fractal characterizations of pore systems in low-permeability reservoirs based on SEM, MICP, NMR, and X-ray CT experiments. Mar. Pet. Geol. 2019, 103, 12–28. [Google Scholar] [CrossRef]
  40. Dai, Q.; Luo, Q.; Zhang, C.; Lu, C.; Zhang, Y.; Lu, S.; Zhao, Y. Pore structure characteristics of tight-oil sandstone reservoir based on a new parameter measured by NMR experiment: A case study of seventh Member in Yanchang Formation, Ordos Basin. Acta Pet. Sin. 2016, 37, 887–897. (In Chinese) [Google Scholar] [CrossRef]
  41. Lai, J.; Wang, G.; Cao, J.; Xiao, C.; Wang, S.; Pang, X.; Dai, Q.; He, Z.; Fan, X.; Liu, Y.; et al. Investigation of pore structure and petrophysical property in tight sandstones. Mar. Pet. Geol. 2018, 91, 179–189. [Google Scholar] [CrossRef]
  42. Zhang, S.; Yan, J.; Hu, Q.; Wang, J.; Tian, T.; Chao, J.; Wang, M. Integrated NMR and FE-SEM methods for pore structure characterization of Shahejie shale from the Dongying Depression, Bohai Bay Basin. Mar. Pet. Geol. 2019, 100, 85–94. [Google Scholar] [CrossRef]
  43. Yan, J.; He, X.; Zhang, S.; Feng, C.; Wang, J.; Hu, Q.; Cai, J.; Wang, M. Sensitive parameters of NMR T2 spectrum and their application to pore structure characterization and evaluation in logging profile: A case study from Chang 7 in the Yanchang Formation, Heshui area, Ordos Basin, NW China. Mar. Pet. Geol. 2020, 111, 230–239. [Google Scholar] [CrossRef]
  44. Lampe, C.; Song, G.; Cong, L.; Mu, X. Fault control on hydrocarbon migration and accumulation in the Tertiary Dongying depression, Bohai Basin, China. AAPG Bull. 2012, 96, 983–1000. [Google Scholar] [CrossRef]
  45. Lu, Y.; Liu, K.; Xu, S.; Wang, Y.; Zhang, Q. Identifying flow units by FA-assisted SSOM—An example from the Eocene basin-floor-fan turbidite reservoirs in the Daluhu Oilfield, Dongying Depression, Bohai Bay Basin, China. J. Pet. Sci. Eng. 2020, 186, 106695. [Google Scholar] [CrossRef]
  46. Washburn, E.W. Note on a method of determining the distribution of pore sizes in a porous material. Proc. Natl. Acad. Sci. USA 1921, 7, 115–116. [Google Scholar] [CrossRef] [Green Version]
  47. Coates, G.R.; Xiao, L.Z.; Prammer, M.G. NMR Logging Principles and Applications; Gulf Publishing Company: Houston, TX, USA, 1999. [Google Scholar]
  48. Rosenbrand, E.; Fabricius, I.L.; Fisher, Q.; Grattoni, C. Permeability in Rotliegend gas sandstones to gas and brine as predicted from NMR, mercury injection and image analysis. Mar. Pet. Geol. 2015, 64, 189–202. [Google Scholar] [CrossRef]
  49. Saidian, M.; Prasad, M. Effect of mineralogy on nuclear magnetic resonance surface relaxivity: A case study of middle bakken and three forks formations. Fuel 2015, 161, 197–206. [Google Scholar] [CrossRef]
  50. Kleinberg, R.L. Utility of NMR T2 distributions, connection with capillary pressure, clay effect, and determination of the surface relaxivity parameter rho2. Magn. Reson. Imaging. 1996, 14, 761–767. [Google Scholar] [CrossRef]
  51. Daigle, H.; Johnson, A. Combining mercury intrusion and nuclear magnetic resonance measurements using percolation theory. Transp. Porous Med. 2016, 111, 669–679. [Google Scholar] [CrossRef]
  52. Yuri, A.; Patricia, R. Neural networks models for estimation of fluid properties. In Proceedings of the SPE Latin American and Caribbean Petroleum Engineering Conference, Buenos Aires, Argentina, 25–28 March 2001. [Google Scholar]
  53. Lander, R.H.; Walderhaug, O. Predicting porosity through simulating sandstone compaction and quartz cementation. AAPG Bull. 1999, 83, 433–449. [Google Scholar] [CrossRef]
  54. Algive, L.; Békri, S.; Nader, F.H.; Lerat, O.; Vizika, O. Impact of diagenetic alterations on the petrophysical and multiphase flow properties of carbonate rocks using a reactive pore network modeling approach. Oil Gas Sci. Technol. 2012, 67, 147–160. [Google Scholar] [CrossRef] [Green Version]
  55. Lai, J.; Wang, G.; Fan, Z.; Chen, J.; Wang, S.; Zhou, Z.; Fan, X. Insight into the pore structure of tight sandstones using NMR and HPMI measurements. Energy Fuels 2016, 30, 10200–10214. [Google Scholar] [CrossRef]
  56. Lai, J.; Wang, G.; Wang, Z.; Chen, J.; Pang, X.; Wang, S.; Zhou, Z.; He, Z.; Qin, Z.; Fan, X. A review on pore structure characterization in tight sandstones. Earth Sci. Rev. 2018, 177, 436–457. [Google Scholar] [CrossRef]
  57. Staley, C.; Matteson, A.; Feng, S.; Schwartz, L.M.; Banavar, J.R. Magnetic resonance, digital image analysis, and permeability of porous media. Appl. Phys. Lett. 1987, 51, 1146–1148. [Google Scholar] [CrossRef]
  58. Testamanti, M.N.; Rezaee, R. Determination of NMR T2cut-off for clay bound water in shales: A case study of Carynginia Formation, Perth Basin, Western Australia. J. Pet. Sci. Eng. 2017, 149, 497–503. [Google Scholar] [CrossRef] [Green Version]
  59. Clarkson, C.R.; Jensen, J.L.; Pedersen, P.K.; Freeman, M. Innovative methods for flow-unit and pore-structure analyses in a tight siltstone and shale gas reservoir. AAPG Bull. 2012, 96, 355–374. [Google Scholar] [CrossRef]
  60. Sakhaee-Pour, A.; Bryant, S.L. Effect of pore structure on the producibility of tight-gas sandstones. AAPG Bull. 2014, 98, 663–694. [Google Scholar] [CrossRef]
  61. Shanley, K.W.; Cluff, R.M. The evolution of pore-scale fluid-saturation in low-permeability sandstone reservoirs. AAPG Bull. 2015, 99, 1957–1990. [Google Scholar] [CrossRef]
  62. Haines, W.B. Studies in the physical properties of soil. V. The hysteresis effect in capillary properties, and the modes of moisture distribution associated therewith. J. Agric. Sci. 1930, 20, 97–116. [Google Scholar] [CrossRef]
  63. Blunt, M.J. Multiphase Flow in Permeable Media: A Pore-Scale Perspective; Cambridge University Press: Cambridge, UK, 2017. [Google Scholar] [CrossRef]
  64. Silin, D.; Patzek, T. Pore space morphology analysis using maximal inscribed spheres. Phys. A Stat. Mech. Appl. 2006, 371, 336–360. [Google Scholar] [CrossRef]
  65. Kaufmann, J.; Loser, R.; Leemann, A. Analysis of cement-bonded materials by multi-cycle mercury intrusion and nitrogen sorption. J. Colloid Interface Sci. 2009, 336, 730–737. [Google Scholar] [CrossRef] [PubMed]
Figure 1. (AC) Geological location of the study area in the Dongying Depression, Bohai Bay Basin, China.
Applsci 11 08027 g001
Figure 2. Workflow used for pore structure evaluation.
Applsci 11 08027 g002
Figure 3. Reservoir porosity histogram (A) and porosity–permeability cross-plot (B) of the Es4 sandstone reservoirs in the Dongying Depression.
Applsci 11 08027 g003
Figure 4. Microscopic characteristics of pore systems in the Es4 sandstone reservoirs. (A,B) Intergranular pores and dissolution pores; (C,D) Micro-fractures; (E,F) Intercrystalline pores; (G) Dissolution pores; (H,I) Intergranular pores and dissolution pores; (J) Residual intergranular pores and dissolution pores; (K,L) Extensive carbonate cementation.
Applsci 11 08027 g004
Figure 5. Pore structure characteristics of the Es4 sandstone reservoirs obtained from MICP data. Capillary pressure cures (A) and pore throat characteristics (B) for four typical samples.
Applsci 11 08027 g005
Figure 6. Distribution of mercury withdrawal efficiency (A), average pore throat radius (B), maximum mercury saturation (C), and displacement pressure (D) for 23 sandstone samples.
Applsci 11 08027 g006
Figure 7. Characteristics of micro-fractures of cores, photomicrographs, MICP, and NMR plots (samples Cn371-2 and G890-1).
Applsci 11 08027 g007
Figure 8. Typical NMR T2 spectral distributions (A,B) showing unimodal behaviors in samples C276-2 and L218-3; (C,D) showing bimodal large pores in samples C141-1 and F119-1; (E,F) showing bimodal small pores in samples G351-2 and G890-2.
Applsci 11 08027 g008
Figure 9. NMR T2 spectra and effective movable fluid distribution obtained from sandstone samples in the Es4 reservoirs. (A) Sample C141-1, φ = 17.5%, K = 11.61 mD; (B) Sample C406-1, φ = 13.6%, K = 0.76 mD; (C) Sample F153-1, φ = 10.9%, K = 4.40 mD.
Applsci 11 08027 g009
Figure 10. Relationship between porosity for effective movable fluids and average pore throat radius.
Applsci 11 08027 g010
Figure 11. Relationships between porosity for effective movable fluids and petrophysical parameters. (A) Effective movable fluids versus permeability; (B) Effective movable fluids versus porosity.
Applsci 11 08027 g011
Figure 12. Relationships between NMR T2 spectral parameters and petrophysical properties. (A) NMR porosity versus helium porosity; (B) T2gm versus permeability; (C) T2mid versus permeability; (D) S3 versus permeability; (E) Skp versus permeability; (F) T2cutoff versus permeability.
Applsci 11 08027 g012
Figure 13. Two-dimensional (2D) pore network model and pore throat size distribution derived from photomicrograph analysis.
Applsci 11 08027 g013
Figure 14. Comparison of throat size distribution derived from MICP and photomicrograph analysis.
Applsci 11 08027 g014
Figure 15. Comparative analysis of NMR T2 spectral parameters and MICP capillary parameters. (A) T2max versus Rmax; (B) T2mid versus R50; (C) σNMR versus σMICP; (D) NMR Skp versus MICP Skp; (E) φem versus displacement pressure; (F) Smov in NMR experiment and maximum mercury saturation from MICP measurements.
Applsci 11 08027 g015
Figure 16. (I-AIV-C) Classification and evaluation of various types of pore structures in the Es4 sandstone reservoirs, showing the microscopic pore types and pore throat characteristics for different types of pore structures.
Applsci 11 08027 g016
Figure 17. NMR T2 spectral parameters of four types of pore structures: (A) φem versus Swi; (B) T2mid versus T2max; (C) T2gm versus T2ave; (D) φi-max versus S3.
Applsci 11 08027 g017
Table 1. NMR T2 spectral parameters of 21 sandstone samples obtained by 100% water-saturated and centrifugal T2 spectra. Sample Cn371-1 is not well consolidated, falling apart during the centrifugation experiment; thus, there is no centrifugation data for the sample.
Sample No.Core DataNMR Data
φ
(%)
K
(mD)
φem
(%)
T2max
(ms)
T2mid
(ms)
T2cutoff
(ms)
T2gm (ms)T2ave
(ms)
T2-peak
(ms)
φi-max
(%)
Swi
(%)
Skp
F119-112.300.771.681084.3748.32150.4128.62118.11155.220.1872.730.0013
F119-28.050.050.02135.100.993.951.002.691.200.1797.52−0.0062
F143-110.970.562.60310.7925.8546.9315.3145.9962.950.2164.85−0.0080
F151-1-18.000.090.11270.503.0712.823.006.663.650.2393.44−0.0108
F153-110.854.403.791431.4652.0291.9924.18126.32144.810.2260.94−0.0020
G351-13.600.040.47117.581.072.831.236.651.120.0980.240.0014
G351-210.740.040.29126.042.548.962.564.792.970.2890.48−0.0108
G890-117.2554.305.20541.5961.3084.0239.9687.91102.340.4760.71−0.0970
G890-22.720.040.23144.811.385.091.5111.961.590.0886.940.0010
C141-117.511.614.302327.2031.5041.4921.63142.49155.220.1652.550.0020
C141-29.060.613.01666.992.084.722.276.661.380.2168.48−0.0018
C276-110.420.402.36821.4312.6734.3614.4050.949.010.1768.53−0.0009
C276-213.601.262.97880.4912.5643.4513.0840.606.370.2574.79−0.0056
C406-113.610.762.49580.524.837.976.5644.953.650.3263.530.0280
Cn371-120.4417.13/943.7911.23/9.0723.2418.040.42/−0.0548
L218-116.6510.015.98505.2671.8085.6148.7499.95117.580.4456.01−0.0785
L218-214.476.125.15505.2647.1164.8833.0079.25102.340.3358.41−0.0322
L218-314.112.374.32505.2650.6676.9831.6381.90102.340.3261.78−0.0353
L752-110.430.150.87289.947.4963.977.5730.4354.790.1483.630.0003
L752-29.070.192.35541.732.255.532.9514.341.700.1868.440.0025
L752-37.570.050.08191.161.919.881.984.372.100.2296.57−0.0046
Table 2. Statistics of the NMR T2 spectral parameters for four types of pore structures in the Es4 sandstone reservoirs.
TypeT2mid (ms)T2max (ms)T2ave (ms)T2gm (ms)φi-max (%)S3Swi (%)φem (%)
I11.23~71.80/43.96505.26~2327.20/1079.4623.24~142.49/88.409.07~48.74/29.850.16~0.47/0.37483.80~1547.59/1229.9252.55~60.71/56.424.3~5.98/5.16
II12.56~52.02/40.59505.26~1431.46/830.6240.60~126.32/82.0213.08~33.0/25.470.22~0.33/0.28510.09~1482.50/950.2158.41~74.79/63.892.97~5.15/4.06
III2.08~48.32/14.78289.94~1084.37/613.686.66~118.11/44.492.27~28.62/11.100.14~0.32/0.2016.29~572.47/302.3363.53~83.63/70.030.87~3.01/2.19
0.99~3.07/1.83117.58~270.50/
164.20
2.69~11.96/6.191.0~3.0/1.880.08~0.28/0.180~33.23/8.6280.24~97.52/90.870.02~0.47/0.20
Publisher’s Note: MDPI stays neutral with regard to jurisdictional claims in published maps and institutional affiliations.

