Abstract
In the present study, an inexpensive and practical way to detect phenolic compounds in wastewater was investigated. By using a simple one compartment three-electrode cell and performing cyclic voltammetry measurements, it was possible to quantitatively determine the presence of gallic and vanillic acid in acidic aqueous solutions due to their electrooxidation upon potential scanning. In the case of gallic acid, two oxidation peaks were observed whereas the vanillic acid cyclic voltammograms consisted of two oxidation and one reduction peaks. Correlation of the observed electrooxidation current density value with the concentration of each phenolic compound led to a linear relationship. Following the above methodology for a 1:1 mixture of these phenols, it was found that only a qualitative analysis was possible rather than a quantitative one.
1. Introduction
The last decades have seen an increased interest in the development of new sensors for a variety of applications [1,2,3]. Chemical sensors are analyzers that respond to particular analytes in a selective and reversible manner and transform input chemical information into an electrical signal [4,5]. Electrochemical sensors are a class of chemical sensors in which an electrode is used as a transducer element in the presence of an analyte. Such sensors often offer chemical specificity and are capable of converting electrochemical information (i.e., voltage) into a measurable quantity (i.e., fluid percentage). An electrochemical sensor consists of a receptor where analyte molecules interact resulting in a stimulus that is received by the transducer, which in turn produces an output signal that allows the determination of the analyte concentration. A major advantage of sensors is their high sensitivity to the measured property without influencing it. Today, sensor applications range from temperature [6], pressure, radiation, flame, and humidity sensing to electrical [7], gas, chemical [8], and electrochemical [9] sensing. Biosensors are also gaining interest from the medical field [10], preventing the spread of a disease or even treating patients with that disease. Independently of the sensor type and use, the sensing and detecting principles are similar.
Focusing on electrochemical sensors, they are typically simple, handy, and low cost providing fast and accurate determination of a compound as compared to chromatographic methods such as HPLC. In addition, electrochemical detection methods display huge potential for miniaturization, competitive price, and portability rather than chromatographic ones [11]. However, further studies are needed in order to achieve sufficient accuracy and precision to meet the standards of HPLC analysis. In the case of electrochemical analysis, a small portion of the sample is initially tested via electrochemical means providing a rapid estimation of its composition, avoiding the long-lasting and unfriendly pretreatment of HPLC analysis [12]. In addition, as phenolic compounds are hazardous to humans, it is crucial to be able to quickly detect the level of their presence in wastewater in order to make a timely decision about their toxicity, before their discharge into inland surface waters. A typical electrochemical sensor consists of three electrodes, the working electrode (where redox reactions take place), the counter, and the reference electrodes [9]. The counter electrode serves as the electron collector, while the cell potential is recorded at the working reference circuit. The use of electrochemical sensors for the detection of pollutants in atmospheric, terrestrial, and aquatic environments is gaining increased research interest [13]. Among the known water pollutants, phenolic compounds exhibit substantial toxicity for both humans and the natural environment and are an impending threat to the food chain [14]. Electroanalytical methods using sensors fabricated from carbon and other materials are commonly utilized for the determination of phenolic compounds. Specifically, the electrochemical reaction (i.e., the electrooxidation of a phenolic compound) takes place on the surface of the sensor material upon potential application. In other words, there is a specific potential where each phenol can be electrooxidized resulting in a current peak.
Due to its exceptional electrocatalytic behavior, pure Pt and various Pt alloys are commonly utilized as working electrodes for phenol electrooxidation [15,16,17]. Although noble metal-based electrodes are sufficiently active with high corrosion resistance, they are expensive and rare. Hence, alternative and more practical materials, such as carbon-based electrodes have become attractive in the research community for sensing phenolic compounds [18]. The electronic properties in combination with the high chemical stability of carbon materials appears to be suitable for these electrochemical systems. In addition, they display notable advantages such as commercial availability, minimization of phenol polymerization and electrode corrosion, and high overpotential for oxygen production [19]. However, modification of their surface is often reported in the literature, preventing electrode fouling and enhancing process efficiency and sensitivity [20]. Mathiyarasu et al. [21] studied the electrochemical oxidation of hydroxybenzene on glassy carbon (GC) electrodes using cyclic voltammetry and differential pulse voltammetry varying the pH of the solution from 7 to 12. According to the authors, a linear relationship between the oxidation peak and phenol concentration was observed, whereas a pH increase resulted in a shift of the oxidation peak potential to lower values. The deactivation of GC was also discussed due to electrode blocking by the polymeric byproducts formed after the second cycle. In a more recent study, Govindhan et al. [22] designed a single-walled carbon nanotube (SWCNT) modified GC electrode for the electrocatalytic oxidation of various phenolic compounds (catechol, para-cresol, ortho-cresol, meta-aminophenol, ortho-chlorophenol, meta-nitrophenol, ortho-nitrophenol, etc.). The composite electrode exhibited high sensitivity and stability, suggesting that it can act as an ideal sensor for the simultaneous detection of multiple phenolic compounds. Along the same line, Chen et al. [23] fabricated a GC electrode coated with a graphene/polymer film for rapid determination of phenols (such as hydroquinone and para-chlorophenol) in aqueous solutions. Activated carbon cloth (ACC) electrodes were investigated for the removal of phenolic compounds (i.e., hydroxybenzene) from aqueous solutions [24]. According to the authors, under acidic conditions the catalytic conversion of H2O2 into hydroxyl radicals was enhanced thus increasing the phenol removal from 16% to 55% by its electrooxidation on the surface of ACC. In addition, a variety of studies on bare or modified glassy carbon electrodes in electrochemical sensors for copper(II) ions detection was reported in the recent literature [25,26,27].
The main disadvantage of the electrochemical detection of phenols present in wastewater is the fast deactivation of the electrode by the adsorption of undesirable byproducts. The formation of an inactive film on the electrode surface hinders the electron transfer process resulting in lower current density values and poor sensitivity to the phenol content of the solution. Therefore, increased research effort is necessary to modify and activate materials by the addition of functionalized groups, tune their electrochemical properties, and increase their stability and sensitivity.
In this work, a bare glassy-carbon electrode was studied as an electrochemical sensor for the detection and quantification of gallic and vanillic acid in acidic aqueous solutions individually or as a mixture. These acids are mainly contained in olive and wine wastewater and considered as environmental pollutants with high ecological impact. The typical value of total phenolic content in olive wastewaters is in the range of 1.6 to 10.7 g of gallic acid per L and 0.001 to 0.1 g of vanillic acid per L [28]. According to the international regulatory body, wastewater has to be treated before discharge, with a permissible limit of phenols at 1 mg∙L−1 [29]. Since, both phenolic compounds have antioxidant and anti-inflammatory properties with beneficial effect on human health, their recovery from wastewater is an intriguing process for the production of high-added-value products [11]. The aim of the study was to find an easy, rapid, and handy way to identify the above phenolic compounds in model wastewaters.
2. Experiments
The electrochemical experiments were carried out at 25 °C and atmospheric pressure in a one-compartment electrochemical cell using a three-electrode setup. A bare glassy carbon electrode (with a geometrical surface of 0.76 cm2) was used as the working electrode located at the bottom of the cell. Prior to any experiment the working electrode was polished with alumina paste. The counter electrode was a platinum spiral (0.5 mm in diameter) and the reference electrode was a mercury/mercury sulfate electrode (Hg/Hg2SO4) connected to the working electrode via a Luggin capillary. The solution of each phenol (i.e., gallic or vanillic acid) was stirred with 3D water at room temperature for 30 min, while the resulting aqueous solution was stored in the fridge until the analysis. The cell was then filled with 50 mL of aqueous KNO3 (i.e., electrolyte)-phenol solution, and prior to any experiment a purging with He was performed. All the electrochemical measurements were carried out with an AUTOLAB potentiostat/galvanostat (PGSTAT302N) using the three-electrode system described above. The concentration of each solution ranged from 20 to 200 mg∙L−1, while the pH value was measured prior to each experiment and without any extra adjustment between three and four (increasing slightly in the lower phenol concentration values). The pH value remained almost constant during the course of the experiments. This behavior was expected since the concentration of the phenol did not significantly change after the run of two cycles. Cyclic voltammetry (CV) measurements were performed in a potential window from −0.8 V to +1 V in two scan rates of 25 and 50 mV∙s−1 using the above potentiostat/galvanostat system. Experiments were also carried out at higher scan rates, however, they resulted in nonseparable oxidation peaks. All the experiments were repeated at least twice with a deviation of less than 5%.
3. Results and Discussion
Cyclic voltammetry was performed to study the redox behavior of the phenolic compounds (i.e., gallic and vanillic acid). For stabilization purposes, the second scan of cyclic voltammograms is presented. Figure 1 displays the electrooxidation of gallic acid upon potential variation under two different scan rates (i.e., 25 and 50 mV∙s−1).
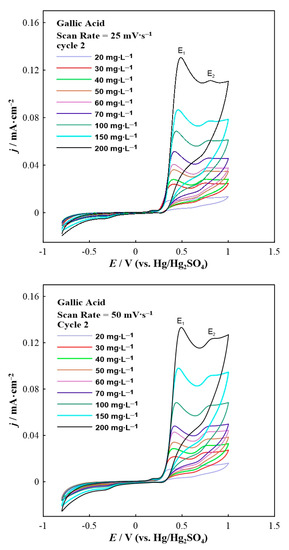
Figure 1.
Second scan of the cyclic voltammograms for gallic acid in various concentrations at a constant scan rate of 25 (top) and 50 (bottom) mV∙s−1.
The cyclic voltammetry results (Figure 1) displayed the presence of two oxidation peaks upon anodic polarization at around +0.5 V (labeled as E1) and +0.8 V (labeled as E2), respectively. Nevertheless, a small shift of both oxidation peaks to higher potentials was observed by increasing the concentration of gallic acid in the reaction solution. According to the literature [30], the electrooxidation mechanism of gallic acid in an acidic environment can be described in four steps. The first peak represents the electrooxidation of gallic acid to the semiquinone radical cation. Then this radical cation loses a proton to form the semiquinone radical. The second oxidation peak is associated with further oxidation of semiquinone radical to the quinone cation. Finally, deprotonation of the quinone cation completes the overall two-electron process to form the final quinone [30]. It is worth noting that pure KNO3 electrolyte (blank experiment) showed negligible oxidation current densities (up to 7 × 10⁻³ mA∙cm−2). It is clear from Figure 1 that higher concentrations of gallic acid in the aqueous solution led to higher anodic current density values. Note that due to the presence of multiple curves (Figure 1 and Figure 2), the corresponding cyclic voltammogram without acid is not shown in both figures.
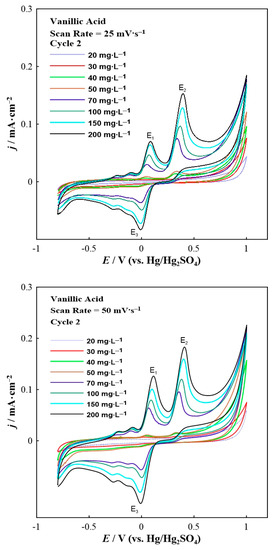
Figure 2.
Second scan of the cyclic voltammograms for vanillic acid in various concentrations at a constant scan rate of 25 (top) and 50 (bottom) mV∙s−1.
Analogous electrochemical experiments were carried out also for vanillic acid. Figure 2 demonstrates the second scan of the cyclic voltammetry results for various concentrations of vanillic acid.
The cyclic voltammograms of vanillic acid (Figure 2) show three distinct peaks: two oxidation peaks (labeled as E1 and E2) and one reduction peak (labeled as E3). Various smaller peaks (wave-like features) can also be seen prior to the oxidation and reduction peaks. The E1 and E2 anodic peaks are localized at around +0.1 V and +0.4 V, respectively, whereas the E3 cathodic peak appeared at approximately 0 V. A small reduction wave feature was observed at around +0.25 V during the cathodic scan. It is important to mention that the first cycle (not shown here) was different than the following one (presented in Figure 2) since it consisted of only one anodic peak (E2) and a small cathodic peak (E3). The presence of the new (E1) anodic peak in the second scan can be attributed to the OCH3 groups present in vanillic acid that are oxidized in parallel with OH groups in the initial scan sweep of the electrode [31]. Thus, new compounds were formed that can be subsequently reduced to new catechol-containing polyphenols. This behavior may also indicate the formation of a thin polymeric film on the glassy carbon electrode [31]. Furthermore, the E2 oxidation peak corresponds to the oxidation of the hydroxyl groups on the B-ring of vanillic acid [32]. The appearance of the reduction peak is due to the reduction of multiple oxidation products, some of which could remain adsorbed on the working electrode surface as a carbonaceous film [33]. Similar to the case of gallic acid, increasing the vanillic acid concentration results in a remarkable potential shift to higher values. According to the literature [30] a two-electron oxidation mechanism can describe the vanillic acid results, as the gallic acid ones.
Figure 3 presents a bar chart plot of the intensity of the anodic peak as a function of the gallic acid concentration at a fixed potential (E1 = +0.49 V or E2 = +0.81 V) and at the peak potential E1,peak or E2,peak (taking into account the small shift of the two peaks). The values of E1,peak and E2,peak were taken from Figure 1. The results from the first peak (E1 and E1,peak) can be described by the same equation, j (mA∙cm−2) = 6.4 × 10⁻⁴ c (mg∙L−1). A similar equation with a slightly different slope and an intercept value can be applied in the case of the second oxidation peak, j (mA∙cm−2) = 5.1 × 10⁻⁴ c (mg∙L−1) + 7 × 10⁻³. This non-zero intercept (7 × 10⁻³ mA∙cm−2) is the value of the current density observed in the CV taken without acid (i.e., blank experiment).
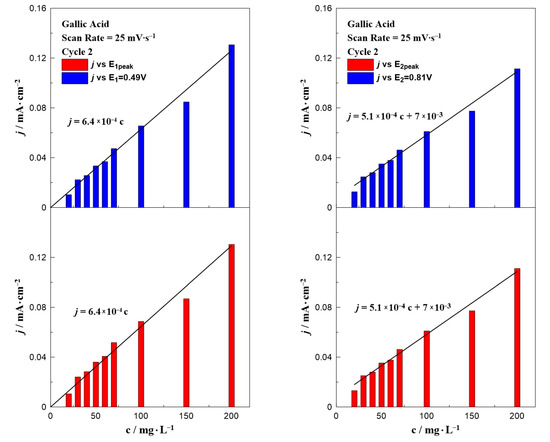
Figure 3.
Effect of gallic acid concentration on the current density value at E1 and E1,peak (left) and E2 and E2,peak (right) at a constant scan rate of 25 mV∙s−1.
Similar bar chart plots have also been constructed for the case of vanillic acid which are presented in Figure 4. In contrast to gallic acid (Figure 3), where all the results can be described by only one equation, the data for vanillic acid could be separated into two concentration ranges. Regardless of the oxidation potential (E1 or E2), the results could be divided into two regions: in a low (0–50 mg∙L−1) and a high (70–200 mg∙L−1) concentration range. According to the fitting, each concentration range resulted in a different dependence on the observed oxidation current, indicated by the change of the line’s slope. A possible explanation for this behavior is the obvious potential shift to higher applied potentials by increasing the concentration of vanillic acid in the aqueous solution (as shown in Figure 2).
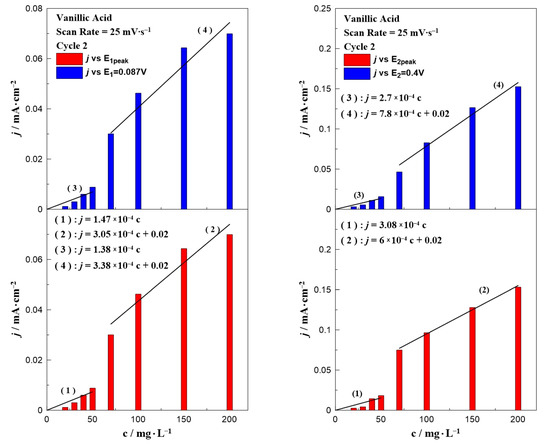
Figure 4.
Effect of vanillic acid concentration on the current density value at E1 and E1,peak (left) and E2 and E2,peak (right) at a constant scan rate of 25 mV∙s−1.
Figure 5 and Figure 6 present the effect of the scan rate on the relationship between the phenol concentration and oxidation peak. In the case of gallic acid (Figure 5), there was not any special change of the interpretation of the data. Similar to Figure 3, a linear relationship between the intensity of the anodic peak and gallic acid concentration was also observed, with a minor change on the slope. On the contrary, the scan rate seemed to significantly affect the calibration curves of vanillic acid (Figure 6) and more specifically caused an increase in the slope as the scan rate value increased. The peak potential in Figure 1 and Figure 2 together with the equations written in Figure 3, Figure 4, Figure 5 and Figure 6 can be utilized to qualitatively and quantitatively determine the presence of gallic and vanillic acid in an aqueous solution. Our results can be rationalized with those reported in the literature. Mathiyarasu et al. [21] using CV on a bare glassy carbon electrode found that the oxidation peak current was proportional to the phenol concentration up to 5 μM. Another study of Wang et al. [34] over a bare glassy carbon electrode revealed the need for an alkaline environment (pH > 7), where more active ·OH radicals were produced to oxidize phenol to intermediates, enhancing the overall efficiency of the process. Furthermore, using carbon paste electrodes, Apetrei et al. [33] illustrated that the obtained calibration curve of vanillic acid could be separated into two regions, as in low concentration values the slope of the intensity of anodic peak versus the vanillic acid concentration is changed, similar to our results. A possible explanation is attributed to the potential shift upon varying the vanillic acid concentration, as well as the observed low current density values at concentrations below 70 mg∙L−1, suggesting a decrease in the electrode’s sensitivity.
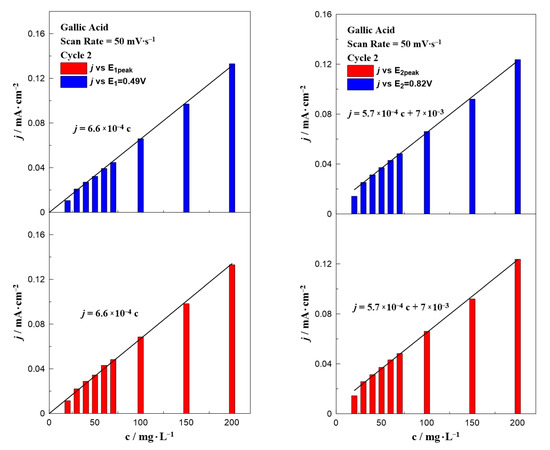
Figure 5.
Effect of gallic acid concentration on the current density value at E1 and E1,peak (left) and E2 and E2,peak (right) at a constant scan rate of 50 mV∙s−1.
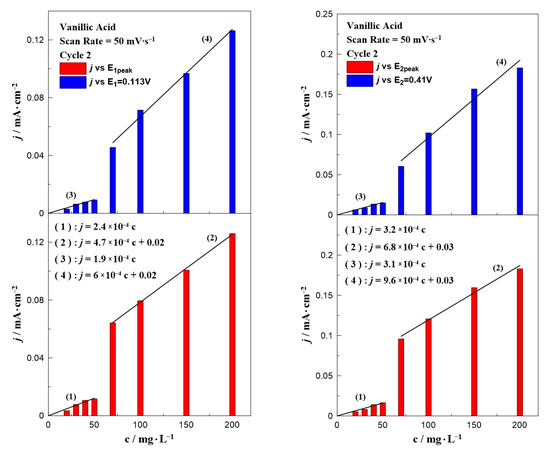
Figure 6.
The effect of vanillic acid concentration on the current density value at E1 and E1,peak (left) and E2 and E2,peak (right) at a constant scan rate of 50 mV∙s−1.
In an attempt to simulate a real solution, a mixture of the above probe phenolic compounds was prepared. A 1:1 model mixture of gallic and vanillic acid was prepared and studied using cyclic voltammetry. In Figure 7, the cyclic voltammograms of pure gallic and vanillic acid are compared with the corresponding CV of their 1:1 mixture. The cyclic voltammogram of the mixture consisted of three oxidation and two small reduction peaks. Hence, the first two oxidation peaks were not distinguished due to the similar oxidation potentials of pure gallic and vanillic acids. Concerning the reduction peaks, these were attributed only to the vanillic acid presence because gallic acid does not contribute to any peak in the cathodic branch. However, these peaks were shifted towards more positive values, as compared to the pure vanillic acid CV. This fact can possibly be explained by the interactions between gallic and vanillic acid under the specific electrooxidation environment. This result is correlated with the observed shift of both oxidation peaks of the mixture that does not match the corresponding anodic peaks of pure vanillic acid. Thus, gallic acid seemed to affect the reaction mechanism of vanillic acid electrooxidation over the working electrode, shifting it to higher potential values. Therefore, the electrooxidation of vanillic acid in the phenol mixture requires extra power as compared to the case when gallic acid is absent. Although further experiments are needed to optimize the studied electrodes under solutions with various phenolic compounds, the current density results support the conclusion that in the case of monophenolic solution (either with gallic or vanillic acid) a glassy carbon electrode can be used as an electrochemical sensor for the reliable detection and quantification of the organic compound. However, in the case of multi-phenolic solutions it seems that only qualitative rather than quantitative results can be extracted using the above methodology.
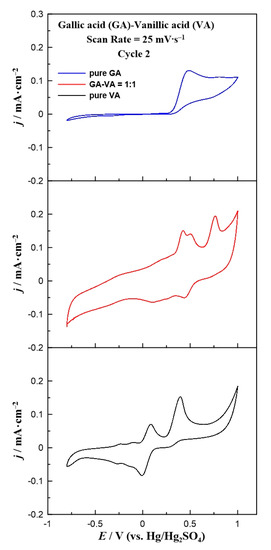
Figure 7.
Comparison of the cyclic voltammograms for pure gallic acid, pure vanillic acid, and a 1:1 mixture of them at a constant scan rate of 25 mV∙s−1.
4. Conclusions
Cyclic voltammetry emerges as a costless, portable, and instant tool for the determination of phenolic compounds in wastewater. A bare glassy carbon electrode was effectively used for the determination of gallic and vanillic acid in monophenolic solutions with a detection limit at 20 mg∙L−1. The observed oxidation and reduction peaks can be interpreted through the standard reaction mechanisms described in the literature. Our results demonstrate that both gallic and vanillic acid concentrations have a linear relationship with the detected oxidation current. In the case of vanillic acid, the calibration curve can be divided into two clearly defined concentration ranges. Cyclic voltammetry can be also applied in multiphenolic solutions, however only for qualitative analysis. Therefore, this technique is an ideal tool for the rapid and noninvasive determination of phenolic compounds using the obtained calibration curves. In addition, electrochemical detection has the notable potential to scale up, balancing the total costs and the overall process efficiency.
Author Contributions
The experimental work was carried out by C.I. and D.Z. Data analysis and interpretation was performed by D.Z., C.I., G.K. and A.K. The paper was written by D.Z., G.K. and A.K. All authors have read and agreed to the published version of the manuscript.
Funding
This research was funded by the project “INVALOR: Research Infrastructure for Waste Valorization and Sustainable Management” (MIS 5002495), which is implemented under the Action “Reinforcement of the Research and Innovation Infra-structure”, funded by the Operational Programme “Competitiveness, Entrepreneurship and In-novation” (NSRF 2014-2020) and co-financed by Greece and the European Union (European Regional Development Fund).
Institutional Review Board Statement
Not applicable.
Informed Consent Statement
Not applicable.
Data Availability Statement
The data that support the findings of this study are available from the corresponding authors D. Zagoraios and A. Katsaounis, upon reasonable request.
Acknowledgments
D. Zagoraios and A. Katsaounis acknowledge funding from the project “INVALOR: Research Infrastructure for Waste Valorization and Sustainable Management” (MIS 5002495), which is implemented un-der the Action “Reinforcement of the Research and Innovation Infrastructure”, funded by the Operational Programme “Competitiveness, Entrepreneurship and Innovation” (NSRF 2014-2020) and co-financed by Greece and the European Union (European Regional Development Fund).
Conflicts of Interest
The authors declare no conflict of interest.
References
- Nazemi, H.; Joseph, A.; Park, J.; Emadi, A. Advanced micro-and nano-gas sensor technology: A review. Sensors 2019, 19, 1285. [Google Scholar] [CrossRef]
- Khan, M.A.H.; Rao, M.V.; Li, Q. Recent advances in electrochemical sensors for detecting toxic gases: NO2, SO2 and H2S. Sensors 2019, 19, 905. [Google Scholar] [CrossRef] [PubMed]
- Nasiri, N.; Clarke, C. Nanostructured chemiresistive gas sensors for medical applications. Sensors 2019, 19, 462. [Google Scholar] [CrossRef]
- Janata, J. Introduction: Modern topics in chemical sensing. Chem. Rev. 2008, 108, 327–328. [Google Scholar] [CrossRef] [PubMed][Green Version]
- Catterall, R. Chemical Sensors; Oxford University Press: Oxford, UK, 1997; pp. 4–30. [Google Scholar] [CrossRef]
- Monea, B.F.; Ionete, E.I.; Spiridon, S.I.; Ion-Ebrasu, D.; Petre, E. Carbon nanotubes and carbon nanotube structures used for temperature measurement. Sensors 2019, 19, 2464. [Google Scholar] [CrossRef]
- Tundis, A.; Faizan, A.; Mühlhäuser, M. A feature-based model for the identification of electrical devices in smart environments. Sensors 2019, 19, 2611. [Google Scholar] [CrossRef] [PubMed]
- Peixoto, A.C.; Silva, A.F. Smart Devices: Micro- and Nanosensors; Elsevier Ltd.: Amsterdam, The Netherlands, 2017; ISBN 9780081007464. [Google Scholar]
- Simões, F.R.; Xavier, M.G. Electrochemical Sensors; Elsevier Inc.: Amsterdam, The Netherlands, 2017; ISBN 9780323497800. [Google Scholar]
- Mehrotra, P. Biosensors and their applications—A review. J. Oral Biol. Craniofacial Res. 2016, 6, 153–159. [Google Scholar] [CrossRef]
- Chiorcea-Paquim, A.M.; Enache, T.A.; De Souza Gil, E.; Oliveira-Brett, A.M. Natural phenolic antioxidants electrochemistry: Towards a new food science methodology. Compr. Rev. Food Sci. Food Saf. 2020, 19, 1680–1726. [Google Scholar] [CrossRef]
- Napolitano-Tabares, P.I.; Negrín-Santamaría, I.; Gutiérrez-Serpa, A.; Pino, V. Recent efforts to increase greenness in chromatography. Curr. Opin. Green Sustain. Chem. 2021, 32, 100536–100547. [Google Scholar] [CrossRef]
- Hanrahan, G.; Patil, D.G.; Wang, J. Electrochemical sensors for environmental monitoring: Design, development and applications. J. Environ. Monit. 2004, 6, 657–664. [Google Scholar] [CrossRef]
- Pelle, F.D.; Compagnone, D. Nanomaterial-based sensing and biosensing of phenolic compounds and related antioxidant capacity in food. Sensors 2018, 18, 462. [Google Scholar] [CrossRef]
- Comninellis, C.; Pulgarin, C. Anodic oxidation of phenol for waste water treatment. J. Appl. Electrochem. 1991, 21, 703–708. [Google Scholar] [CrossRef]
- Iotov, P.I.; Kalcheva, S.V. Mechanistic approach to the oxidation of phenol at a platinum/gold electrode in an acid medium. J. Electroanal. Chem. 1998, 442, 19–26. [Google Scholar] [CrossRef]
- Pierozynski, B.; Mikolajczyk, T.; Piotrowska, G. Electrooxidation of phenol on PtRh and PtRu alloys in 0.1 M NaOH solution. Int. J. Electrochem. Sci. 2015, 10, 2432–2438. [Google Scholar]
- Hart, J.P.; Crew, A.; Crouch, E.; Honeychurch, K.C.; Pemberton, R.M. Some Recent Designs and Developments of Screen-Printed Carbon Electrochemical Sensors/Biosensors for Biomedical, Environmental, and Industrial Analyses. Anal. Lett. 2004, 37, 789–830. [Google Scholar] [CrossRef]
- Gattrell, M.; Kirk, D.W. The Electrochemical Oxidation of Aqueous Phenol Carbon Electrode. Can. J. Chem. Eng. 1990, 68, 997–1003. [Google Scholar] [CrossRef]
- Hanssen, B.L.; Siraj, S.; Wong, D.K.Y. Recent strategies to minimise fouling in electrochemical detection systems. Rev. Anal. Chem. 2016, 35, 1–28. [Google Scholar] [CrossRef]
- Mathiyarasu, J.; Joseph, J.; Phani, K.L.N.; Yegnaraman, V. Electrochemical detection of phenol in aqueous solutions. Indian J. Chem. Technol. 2004, 11, 797–803. [Google Scholar]
- Govindhan, M.; Lafleur, T.; Adhikari, B.R.; Chen, A. Electrochemical Sensor Based on Carbon Nanotubes for the Simultaneous Detection of Phenolic Pollutants. Electroanalysis 2015, 27, 902–909. [Google Scholar] [CrossRef]
- Chen, K.; Zhang, Z.L.; Liang, Y.M.; Liu, W. A graphene-based electrochemical sensor for rapid determination of phenols in water. Sensors 2013, 13, 6204. [Google Scholar] [CrossRef]
- Chand, R.; Molina, R.; Johnson, I.; Hans, A.; Bremner, D.H. Activated carbon cloth: A potential adsorbing/oxidizing catalyst for phenolic wastewater. Water Sci. Technol. 2010, 61, 2817–2823. [Google Scholar] [CrossRef]
- Dedelaite, L.; Kizilkaya, S.; Incebay, H.; Ciftci, H.; Ersoz, M.; Yazicigil, Z.; Oztekin, Y.; Ramanaviciene, A.; Ramanavicius, A. Electrochemical determination of Cu(II) ions using glassy carbon electrode modified by some nanomaterials and 3-nitroaniline. Colloids Surf. A Physicochem. Eng. Asp. 2015, 483, 279–284. [Google Scholar] [CrossRef]
- Oztekin, Y.; Yazicigil, Z.; Ramanaviciene, A.; Ramanavicius, A. Polyphenol-modified glassy carbon electrodes for copper detection. Sens. Actuators B Chem. 2011, 152, 37–48. [Google Scholar] [CrossRef]
- Oztekin, Y.; Yazicigil, Z.; Solak, A.O.; Ustundag, Z.; Okumus, A.; Kilic, Z.; Ramanaviciene, A.; Ramanavicius, A. Phenanthroline derivatives electrochemically grafted to glassy carbon for Cu(II) ion detection. Sens. Actuators B Chem. 2012, 166–167, 117–127. [Google Scholar] [CrossRef]
- Tundis, R.; Conidi, C.; Loizzo, M.R.; Sicari, V.; Romeo, R.; Cassano, A. Concentration of bioactive phenolic compounds in olive mill wastewater by direct contact membrane distillation. Molecules 2021, 26, 1808. [Google Scholar] [CrossRef]
- Hussain, A.; Dubey, S.K.; Kumar, V. Kinetic study for aerobic treatment of phenolic wastewater. Water Resour. Ind. 2015, 11, 81–90. [Google Scholar] [CrossRef]
- Abdel-Hamid, R.; Newair, E.F. Electrochemical behavior of antioxidants: I. Mechanistic study on electrochemical oxidation of gallic acid in aqueous solutions at glassy-carbon electrode. J. Electroanal. Chem. 2011, 657, 107–112. [Google Scholar] [CrossRef]
- Makhotkina, O.; Kilmartin, P.A. The use of cyclic voltammetry for wine analysis: Determination of polyphenols and free sulfur dioxide. Anal. Chim. Acta 2010, 668, 155–165. [Google Scholar] [CrossRef]
- Kilmartin, P.A.; Zou, H.; Waterhouse, A.L. A cyclic voltammetry method suitable for characterizing antioxidant properties of wine and wine phenolics. J. Agric. Food Chem. 2001, 49, 1957–1965. [Google Scholar] [CrossRef]
- Apetrei, C.; Apetrei, I.M.; de Saja, J.A.; Rodriguez-Mendez, M.L. Carbon paste electrodes made from different carbonaceous materials: Application in the study of antioxidants. Sensors 2011, 11, 1328–1344. [Google Scholar] [CrossRef]
- Wang, Y.; Zuo, S.; Zhu, H. Investigation on the electrochemical behaviors of phenol oxidation on GCE (Glassy Carbon Electrode). Adv. Mater. Res. 2013, 652–654, 1684–1687. [Google Scholar] [CrossRef]


Publisher’s Note: MDPI stays neutral with regard to jurisdictional claims in published maps and institutional affiliations All authors have read and agreed to the published version of the manuscript.. |
© 2021 by the authors. Licensee MDPI, Basel, Switzerland. This article is an open access article distributed under the terms and conditions of the Creative Commons Attribution (CC BY) license (https://creativecommons.org/licenses/by/4.0/).