1. Introduction
A cerebral or intracranial aneurysm occurs due to the weakness in the walls of the cerebral artery, which causes abnormal focal dilation of the vessel. As the artery wall becomes thinner over time, the aneurysm is likely to rupture, causing blood to flow into the space in the brain. The rupture of an intracranial aneurysm produces a subarachnoid hemorrhage (SAH) and leads to high mortality and morbidity rates [
1]. In order to diagnose the aneurysms, noninvasive angiographic imaging techniques such as computed tomography angiography (CTA), magnetic resonance angiography (MRA), and digital subtraction angiography (DSA) have been commonly used [
2]. After detection of an aneurysm, various methods may be used to avoid its rupture, including (open surgery) clipping and endovascular therapy (coils or stents, flow diversion devices). These treatments are based on the exclusion of aneurysms from the blood circulation [
3].
A number of devices have been developed over the last decade to treat cerebral aneurysms. Among them, the flow-diverting (FD) stent—a self-expandable, strut-braided, mesh device—shows considerable promise by promoting thrombosis within the aneurysm cavity by diverting the blood flow away from the aneurysm [
4]. Despite encouraging results with FD stents, post-treatment complications such as failure of occlusion and subarachnoid hemorrhaging have been reported, so clinicians need to consider some vital issues, for example, discriminating between ruptured and unruptured aneurysms to make a decision on the treatment process, and assessing the performance of selected devices [
5,
6]. Computational fluid dynamics (CFD) is a promising, yet economic, means to tackle these problems [
6,
7]. High-resolution images of the brain can be acquired to create detailed 3D models of aneurysm geometry. Governing equations on blood flow have been solved using CFD methods to calculate vascular flow patterns in the aneurysm [
6,
7,
8]. The computational simulations can be performed before and after treatment to analyze the hemodynamic alterations due to the implantation of the devices [
3]. The post-treatment hemodynamic parameters, including time-averaged inflow rate, aneurysm-averaged velocity, wall shear stress, total absolute circulation, and turnover time (the aneurysm sac volume divided by the inflow rate at the neck plane), are provided using computational fluid dynamics analysis [
9]. The flow-related parameters are used to anticipate the flow diverter performance in aneurysm occlusion, and this information helps clinicians to select the optimal devices before treatment [
10].
CFD studies have been conducted on aneurysm treatment using flow diverting stents. Most studies aim to identify the effects of flow-diverter placements by comparing the distribution of hemodynamic parameters in patient-specific or idealized models of cerebral aneurysms before and after treatment. The distribution of velocity, pressure, and wall shear stress has been presented to assess the potential risk of aneurysm rupture [
11], evaluate the accuracy of computational fluid dynamics methods by comparing with clinical imaging results [
12], or consider the effect of mechanical properties of the stent, as well as its hemodynamic performance [
4]. Previous studies have illustrated that detailed knowledge of hemodynamics can be affected by stent placement, thus being critical to the prediction of treatment outcome. Some studies have focused on the simulation of the mechanical deployment of flow-diverter stents using finite element analysis to capture the clinically realistic FD deployment processes [
3,
13]. Some researchers have conducted stent deployment and CFD simulations simultaneously to investigate the influence of different stent deployment approaches and the location of stents on the hemodynamics of aneurysms by comparing untreated and stented vessels [
9,
14,
15]. It is noted that the specifications of FD stents such as stent type, mesh porosity, and mesh pore density are other determining factors in the greater device efficacy, which have been considered by researchers using CFD simulations [
6,
8,
16]. In addition to the appropriate selection of pore size and density, the device positioning against the parent artery wall remains vital. The dependency of aneurysm occlusion on the space or gap between the flow diverter and the parent artery has been considered using CFD investigations, and the results demonstrate that even a small gap causes the aneurysm to be blocked incomplete and remain permeable longer because of the jet-like blood flow through the gap into the aneurysm sac [
10,
16,
17].
All aforementioned studies have indicated that CFD simulations can help to design better devices, and also offer clinicians insight about decision-making, personalize the treatment methods, and provide valuable information to plan stent deployment for the treatment of cerebral aneurysms. CFD is able to produce spatiotemporal results for the millions of elements of the model during an entire cardiac cycle, which are usually viewed at a single time point or time-averaged on standard 2D displays. In addition, people who did not perform the CFD analysis, for example, clinicians who would like to use the CFD data, may not intend to utilize the CFD data while there are other available visualization tools [
18]. The simulation data need to be visualized in an appropriate environment to provide direct and intuitive knowledge and insight into the FD-stent treatment and its outcome. Visualization in virtual reality (VR) may be an ideal solution. Using a head-mounted display (headset), in combination with a computer system, a user is able to experience and naturally interact with a digital simulated three-dimensional (3D) digital environment, complete with images, sounds, and other sensations. The user (wearing the headset) is able to see and manipulate (move, rotate, and/or scale) objects of interest in the virtual environment. Stereoscopic 3D visualization in VR has been illustrated as a powerful, low-cost, noninvasive method for visualizing complex biological systems [
19]. The CFD analysis data can be displayed in the VR environment to allow physicians to understand the complex flow patterns of blood within cerebral arteries while “taking a walk” inside the aneurysm and observing the velocity, pressure, and stress fields [
7]. This is not only a useful means for neurosurgeons to assess the risk of stent treatment but is also a stimulating way for the active training of medical students and preparation of patients before their stent treatment (through education to reduce their anxiety). There are a few studies that have presented a workflow to postprocess the CFD results in a VR environment with biomedical applications. For example, an improved replacement heart valve was designed using CFD simulation to overcome time and financial constraints. The output of the simulations displayed in a virtual reality environment also included innovative 3D interfaces for interacting with the data [
20]. Additionally, some workflows were developed to display biomedical CFD analysis results in the virtual environment and were tested for blood flow in arteries [
21,
22], congenital cardiovascular disease, the Circle of Willis with respect to cerebral aneurysms, the airway for surgical treatment planning [
18], and percutaneous coronary intervention [
23]. The results from all these studies suggest that VR immersion significantly improves the accuracy of the placement of the simulated medical devices in complex arterial geometries, relative to traditional display methods with no immersion.
Considering the extensive applications of CFD for biomedical purposes, the number of CFD-VR studies, especially related to stented aneurysms, is limited. Additionally, most previous CFD-VR studies have presented complicated workflows and relied on the use of the CAVE (Cave Automatic Virtual Environment), a multi-walled immersive environment that can be financially burdensome to construct. Finally, commercial software has been developed that allows the visualization of simulated data in a VR environment such as Simcenter STAR-CCM+ Virtual Reality [
24]; however, this type of software may require an enterprise license for its use. Therefore, a straightforward method to visualize CFD data in a VR environment with high resolution and low cost could prove to be a valuable tool for biomedical research.
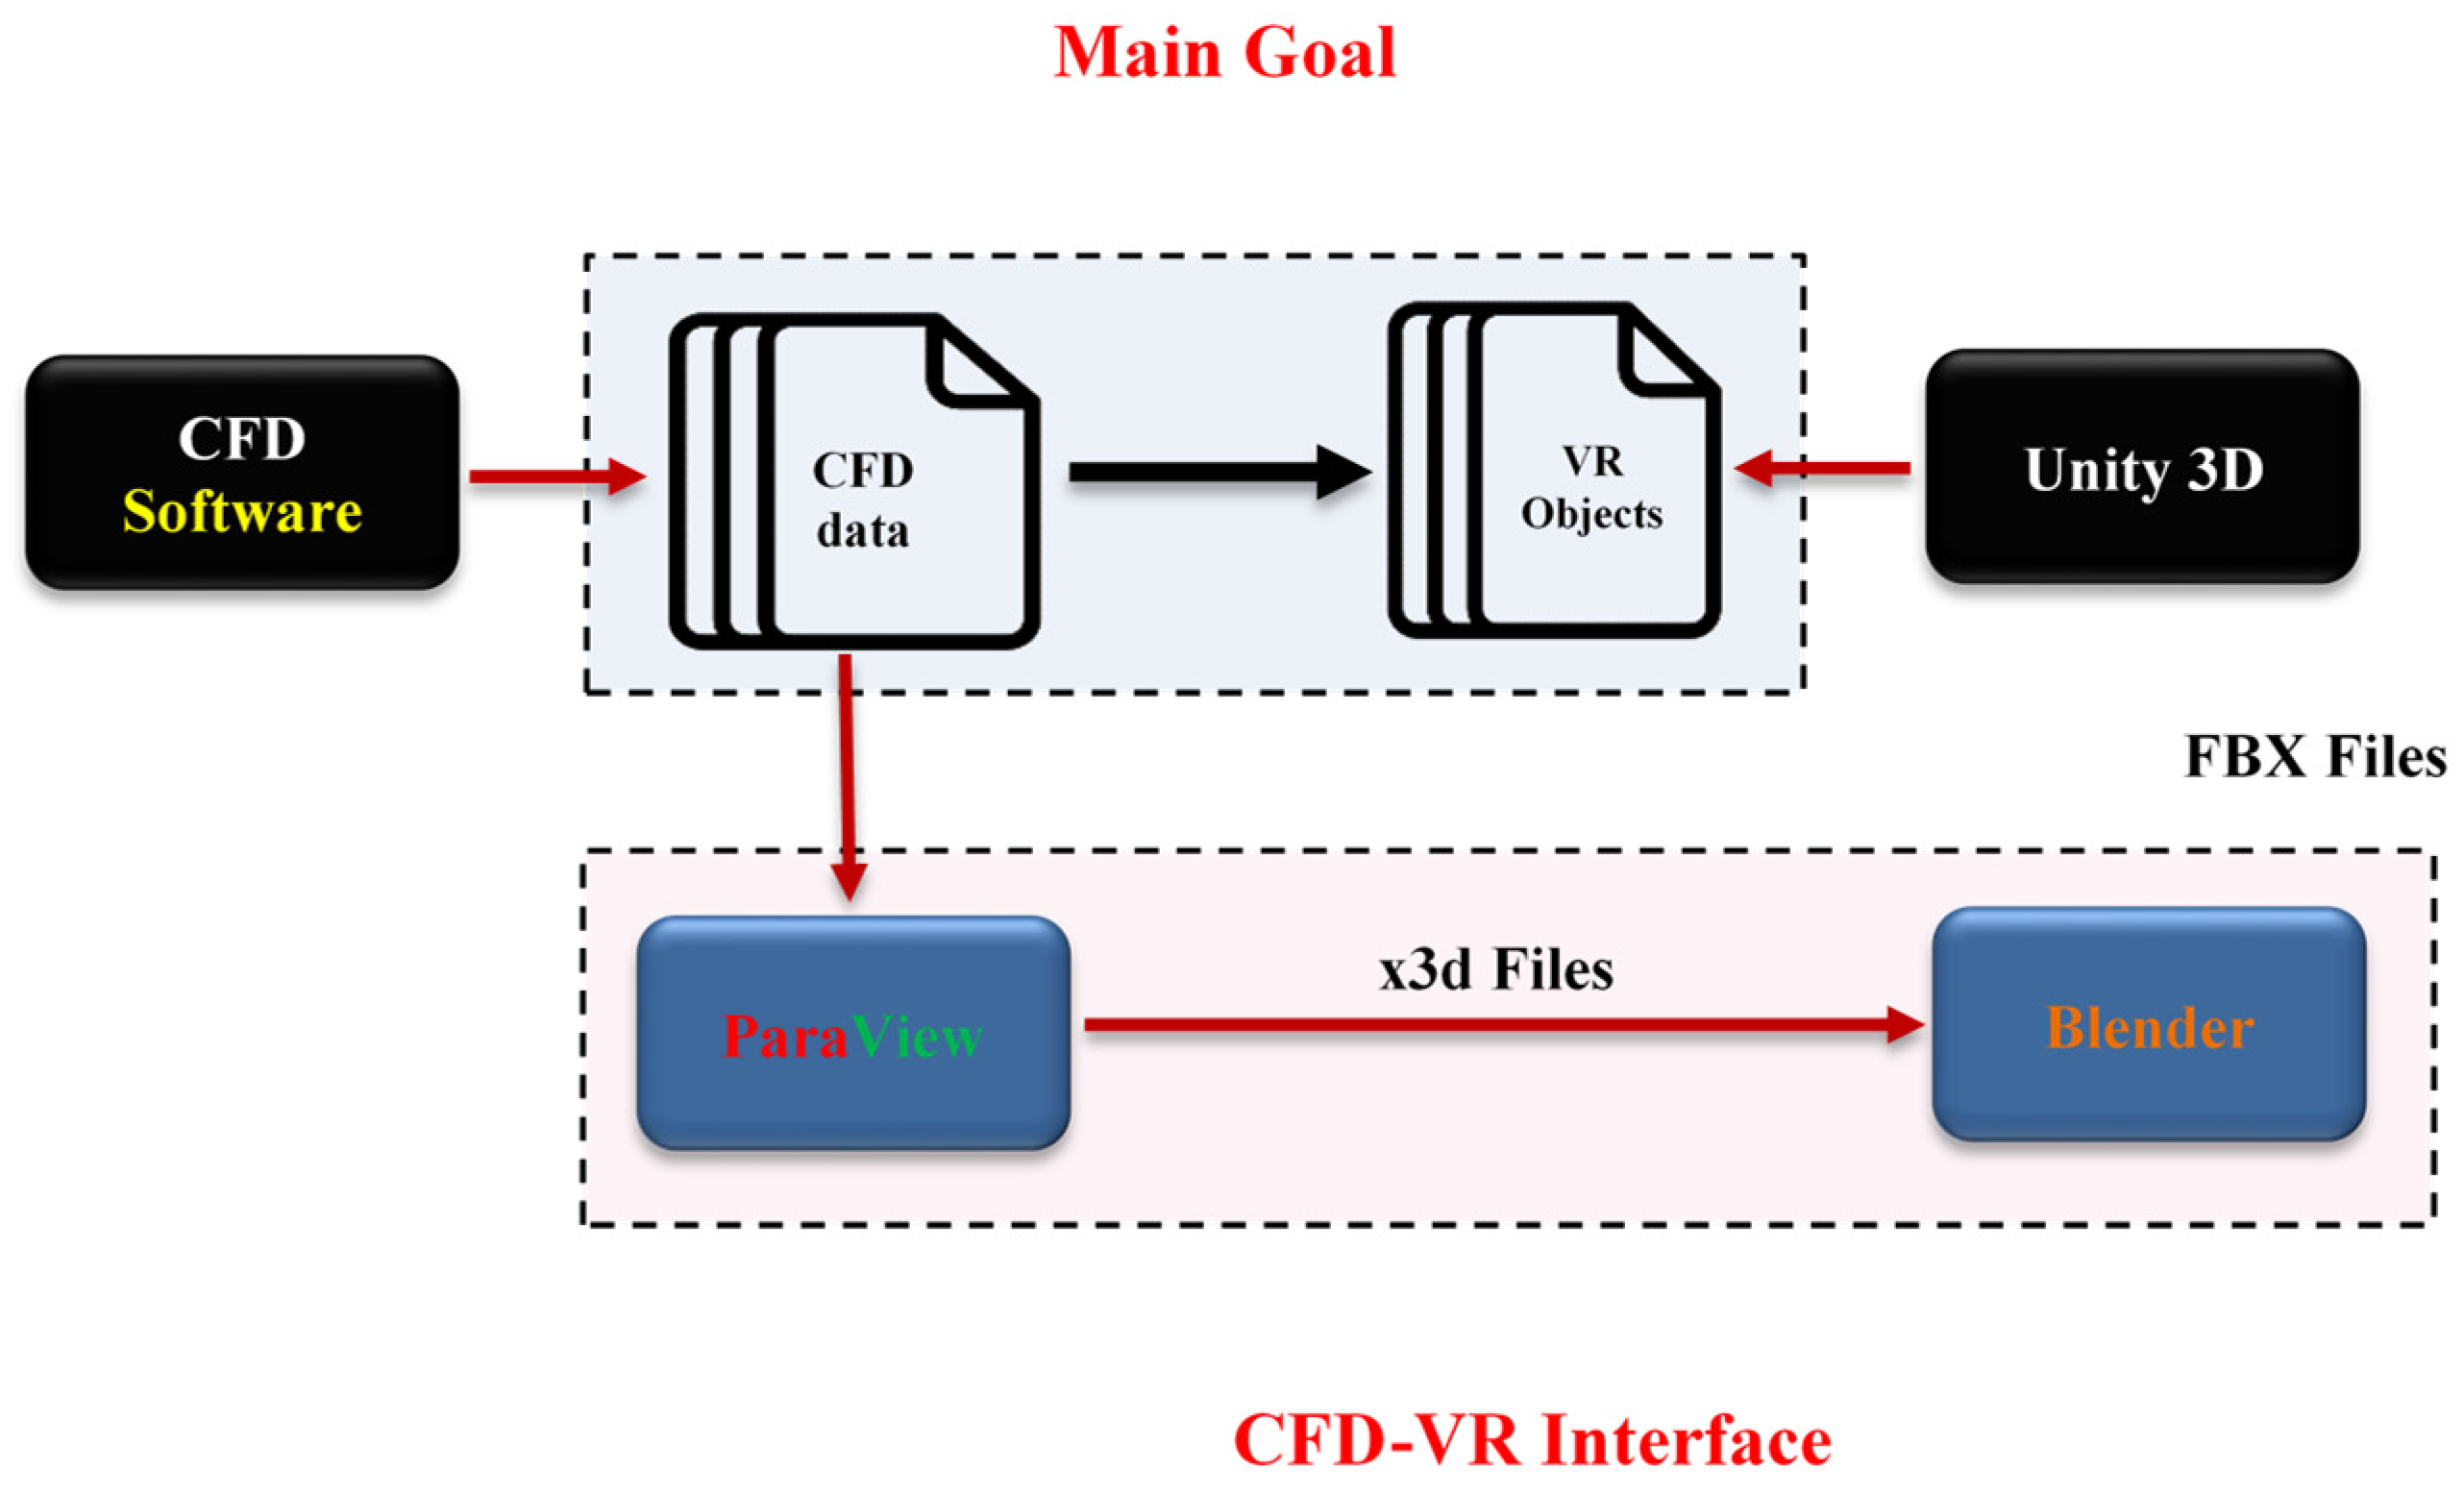
In this regard, the current research aimed to first present a complete CFD-VR workflow that is able to obtain the output files of both licensed and open-source CFD software and use the open-source visualization software to render the objects and create animations in a VR environment. Only a low-cost VR headset and a desktop computer with a VR-capable graphics card are required. Second, the flow behavior in a sidewall-type saccular aneurysm was simulated numerically for pre/past stenting and the results were displayed in a VR environment using the presented workflow as screenshots and animations.
3. Results and Discussion
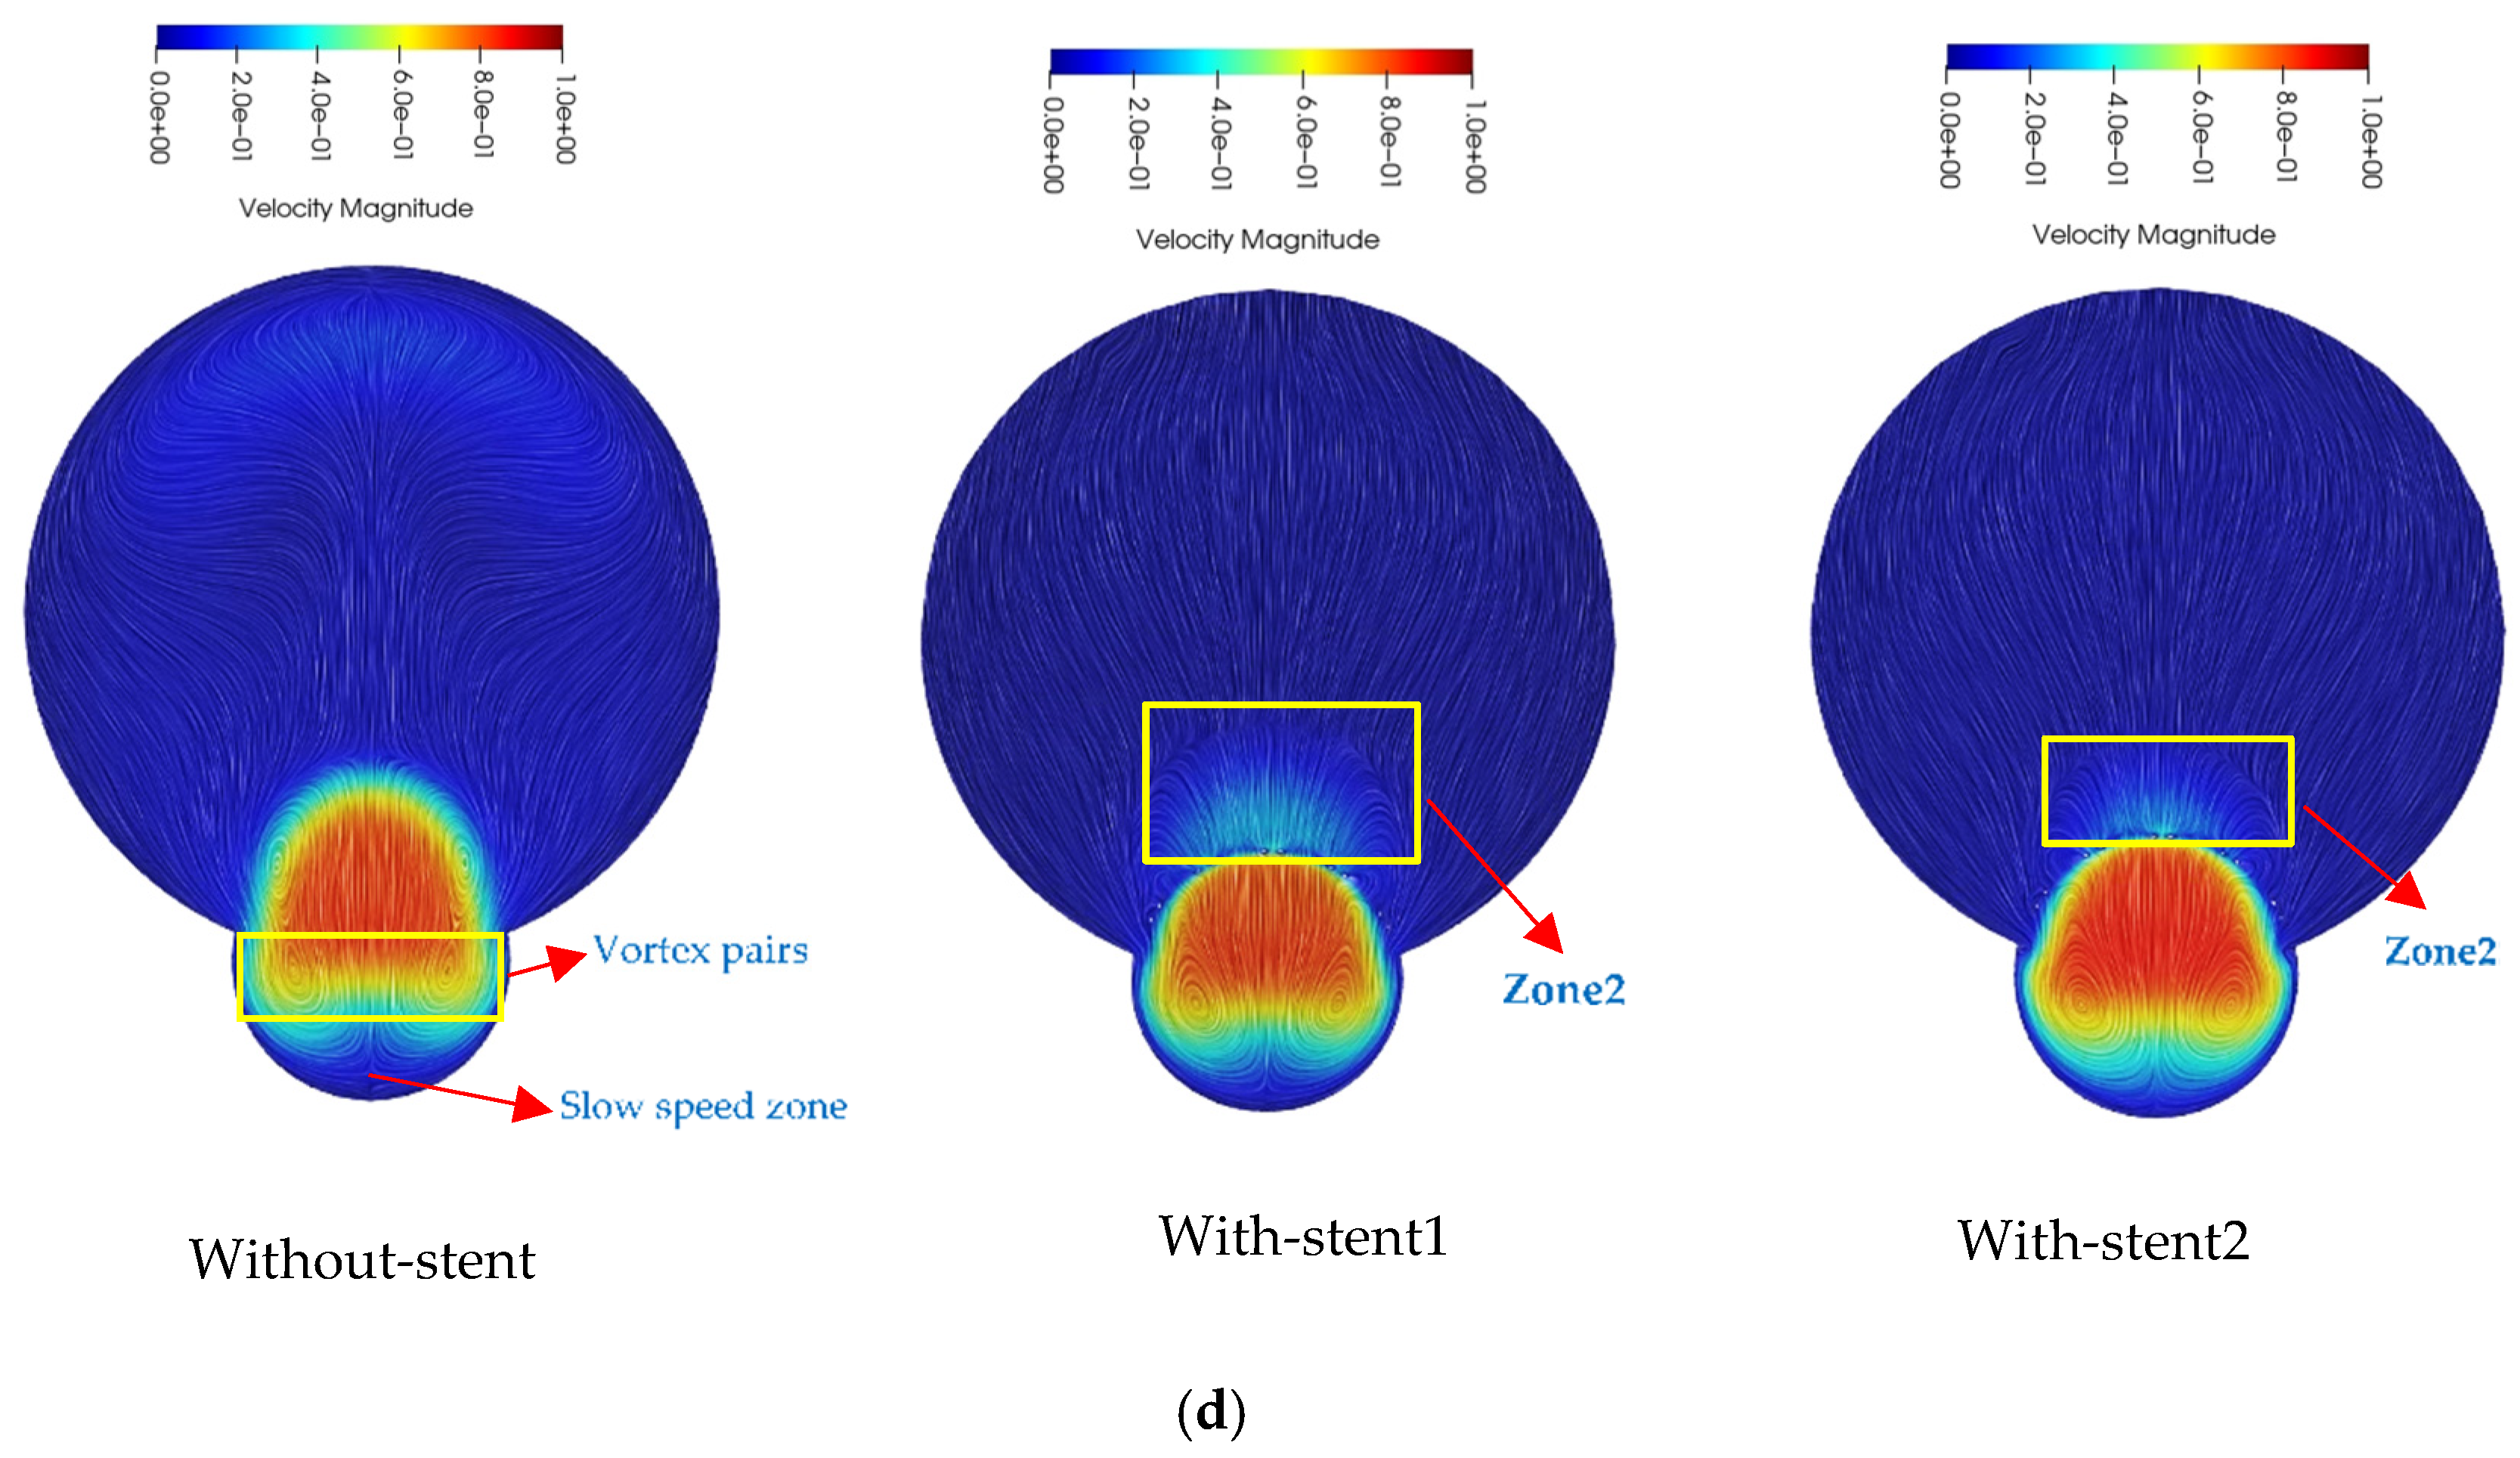
Results are presented in both the traditional post-processing and virtual reality environment to show the interactive accessibility of VR visualization in this section. The velocity magnitude contours with streaking patterns (that follow vector field tangents) are illustrated in
Figure 14 on Slice 1 at
t = t
2, the peak of systolic flow, for the cases of Without-stent, With-stent1, and With-sent2.
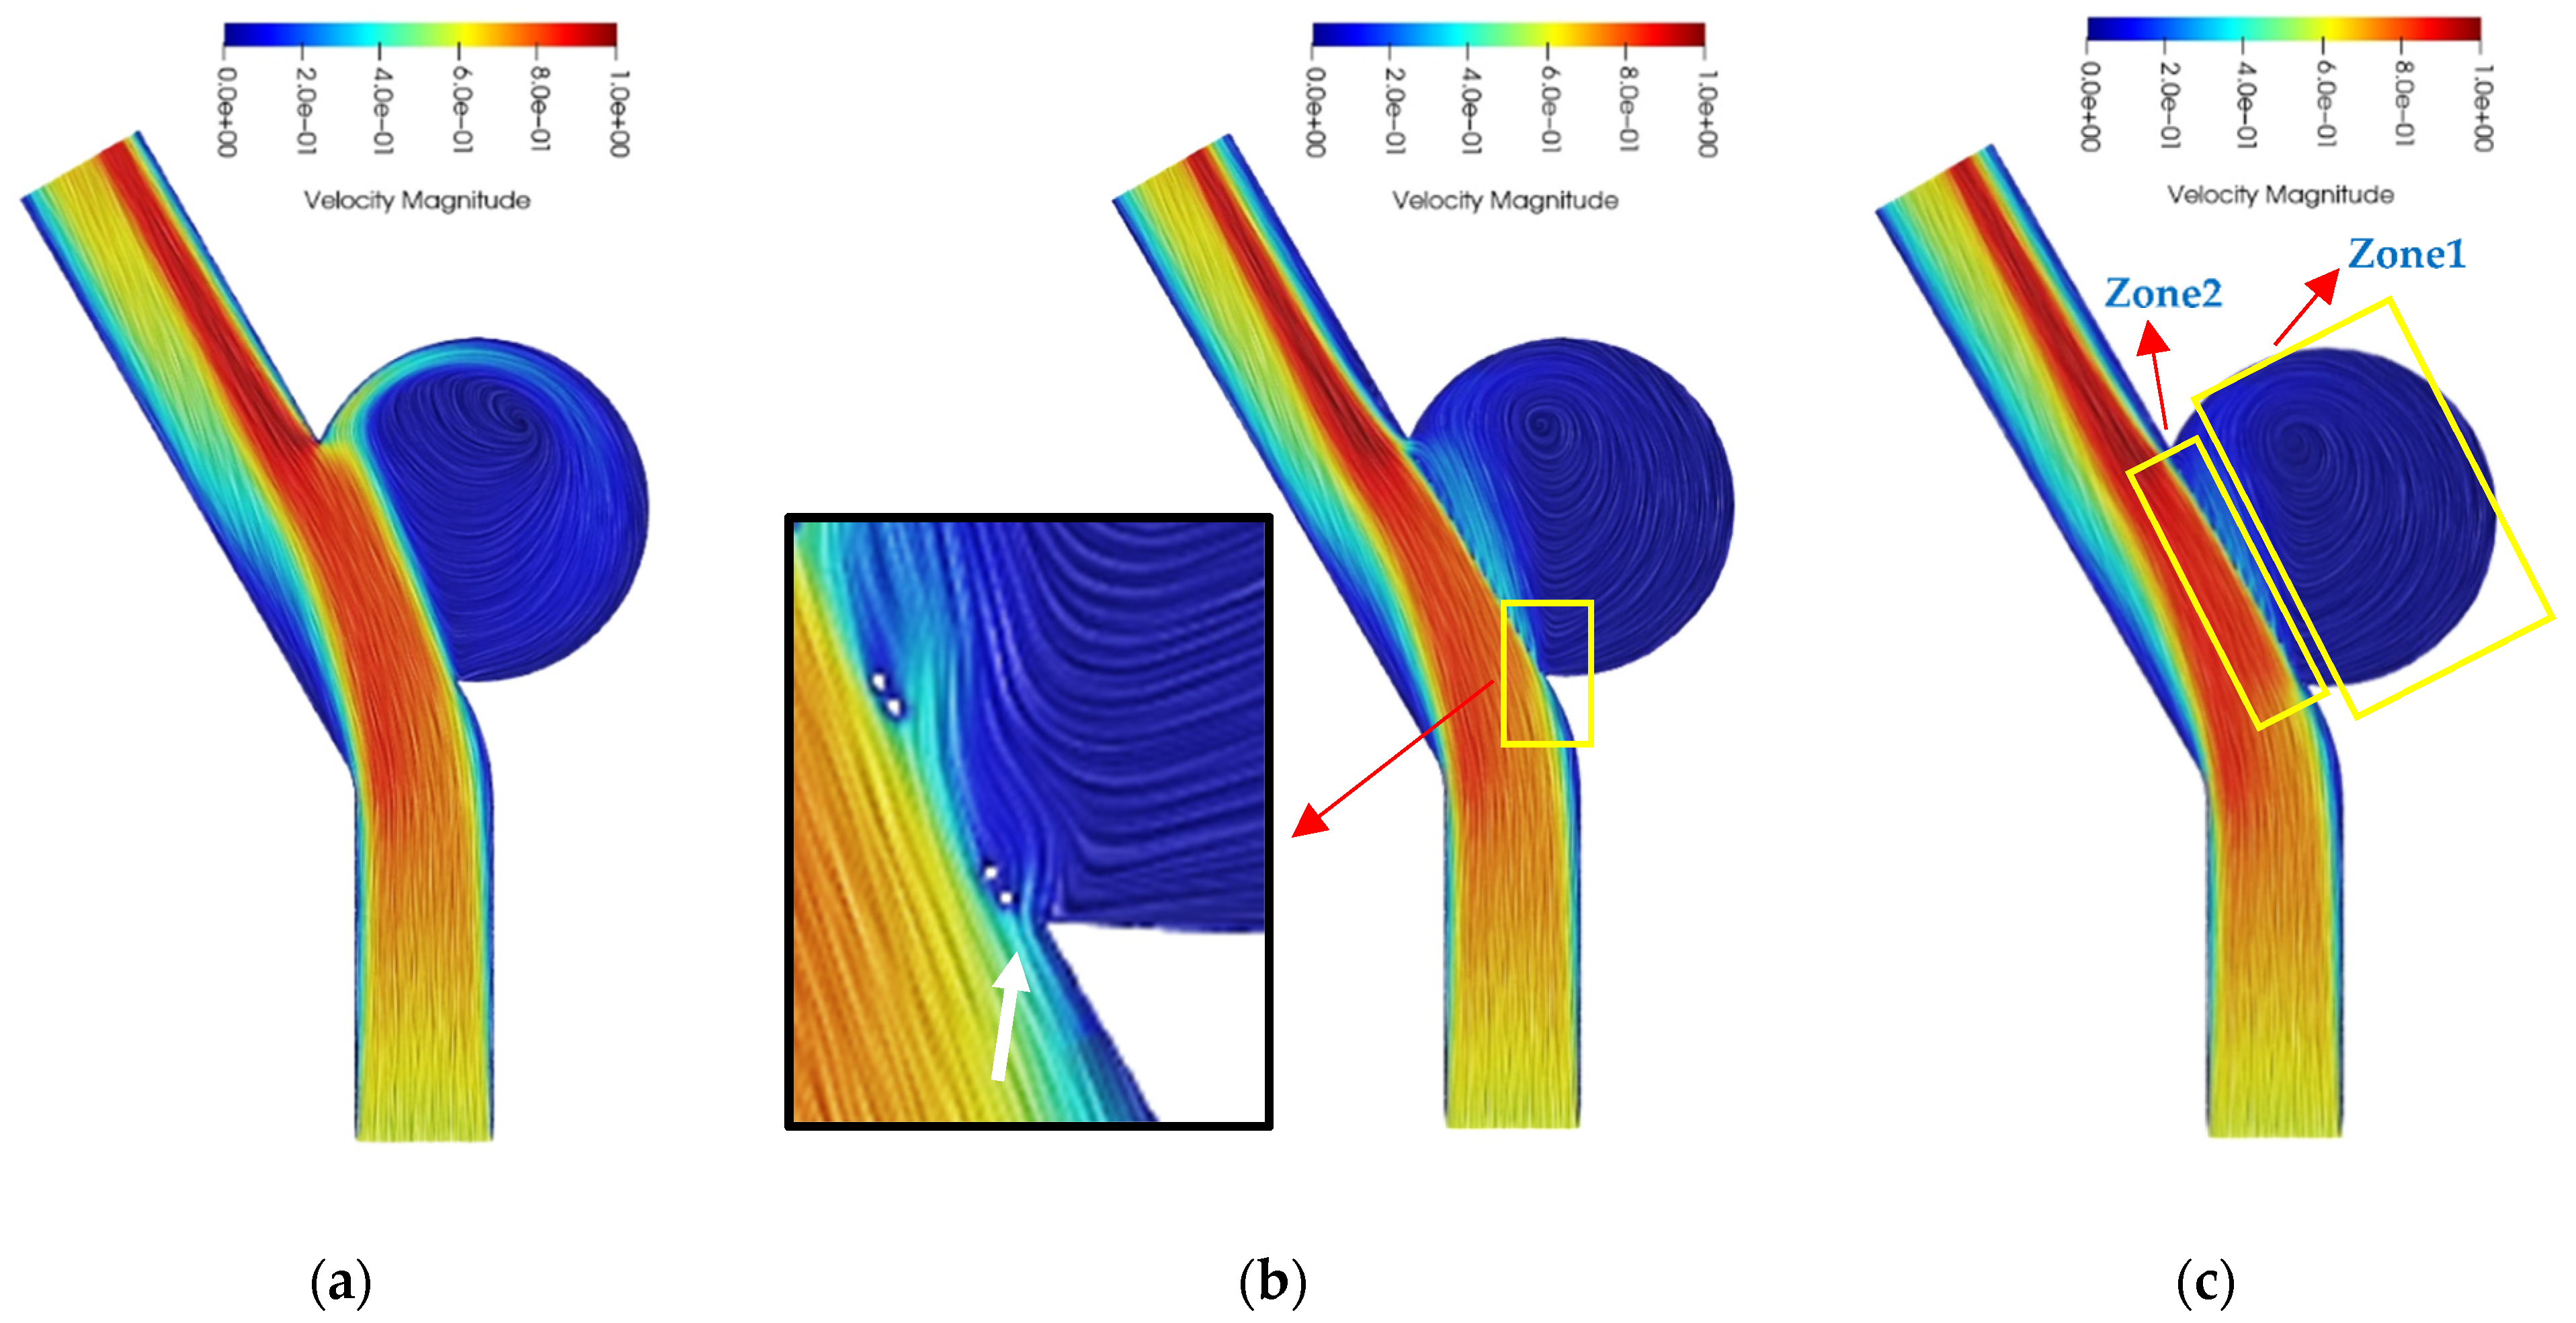
The flow pattern for the untreated aneurysm shows that the flow starts to enter the sac after the proximal edge of the neck and continues toward the distal edge. The inflow impinges to the sac wall close to the distal neck, rotates inside the sac, and exits the aneurysm at the proximal neck; therefore, a single large vortex is created within the sac (
Figure 14a). Due to the placement of the stent across the aneurysm neck, the whole inlet flow enters from the proximal neck for stented cases and then the flow breaks up to the flow swirling around the sac (
Figure 14c, Zone1), and the flow is restricted to the neck region and leaves the sac from the distal neck region directly (
Figure 14c, Zone2). The size of Zone2 is smaller for the With-stent2 case because of the lower inflow rate into the aneurysm.
Figure 14b shows the effect of a small gap between the stent and the artery wall. An inflow jet in the proximal neck edge is created due to the presence of the gap, so this aneurysm feeding increases the flow into the sac and slows down the thrombosis process.
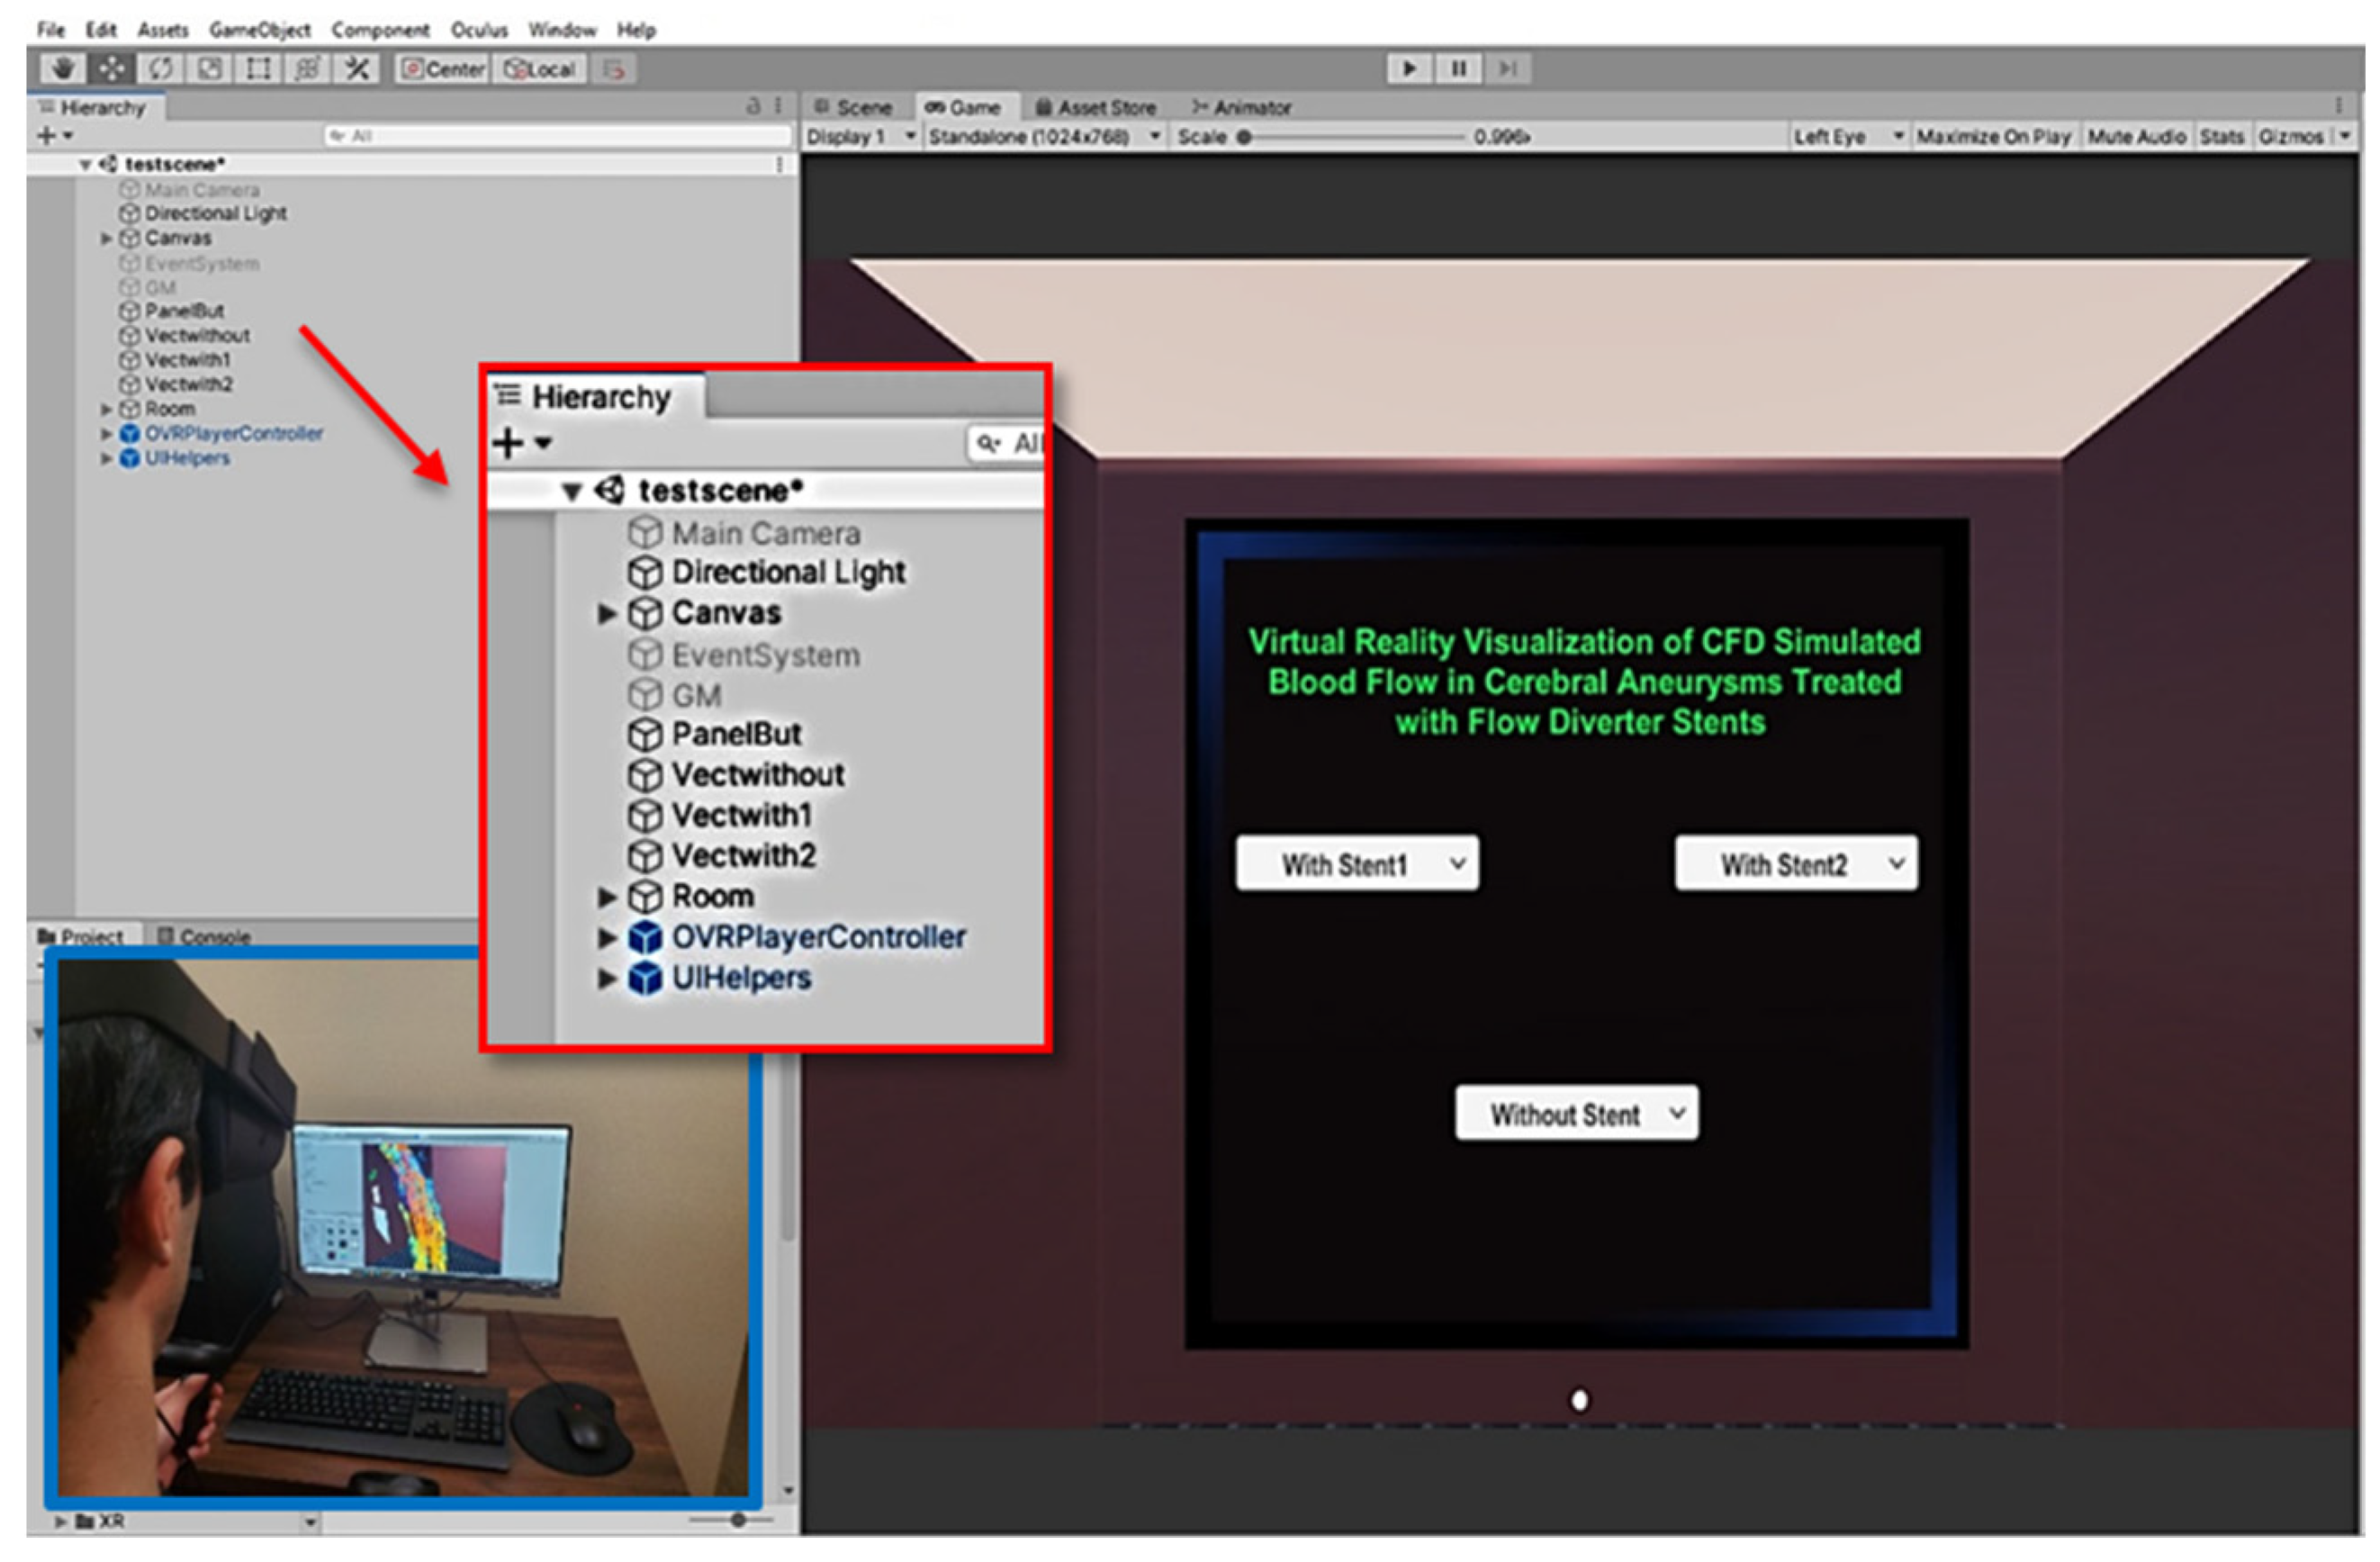
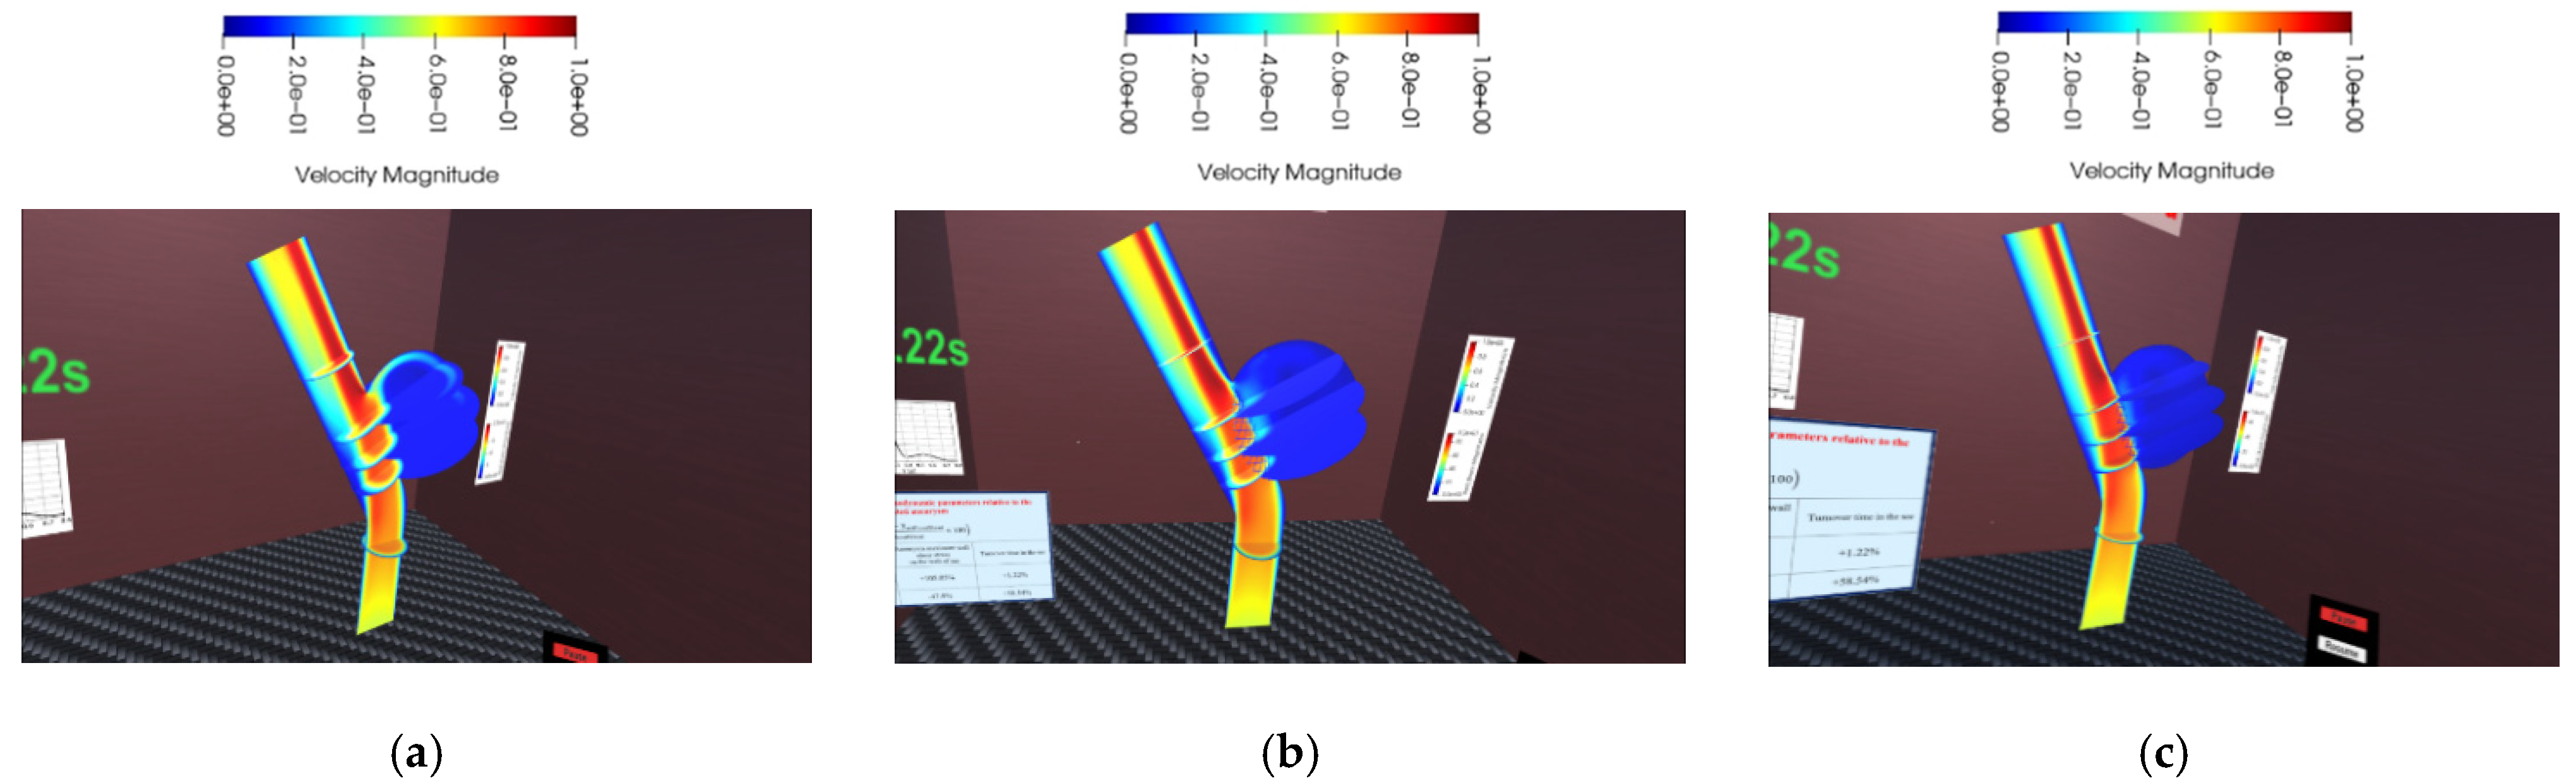
The effects of inflow/outflow locations into/out of the aneurysm, and the wall–stent gap can be observed in more detail in the 3D space of the VR environment. If the user selects one of the flow elements using the menu, illustrated in
Figure 13, the animation of the associated element starts playing.
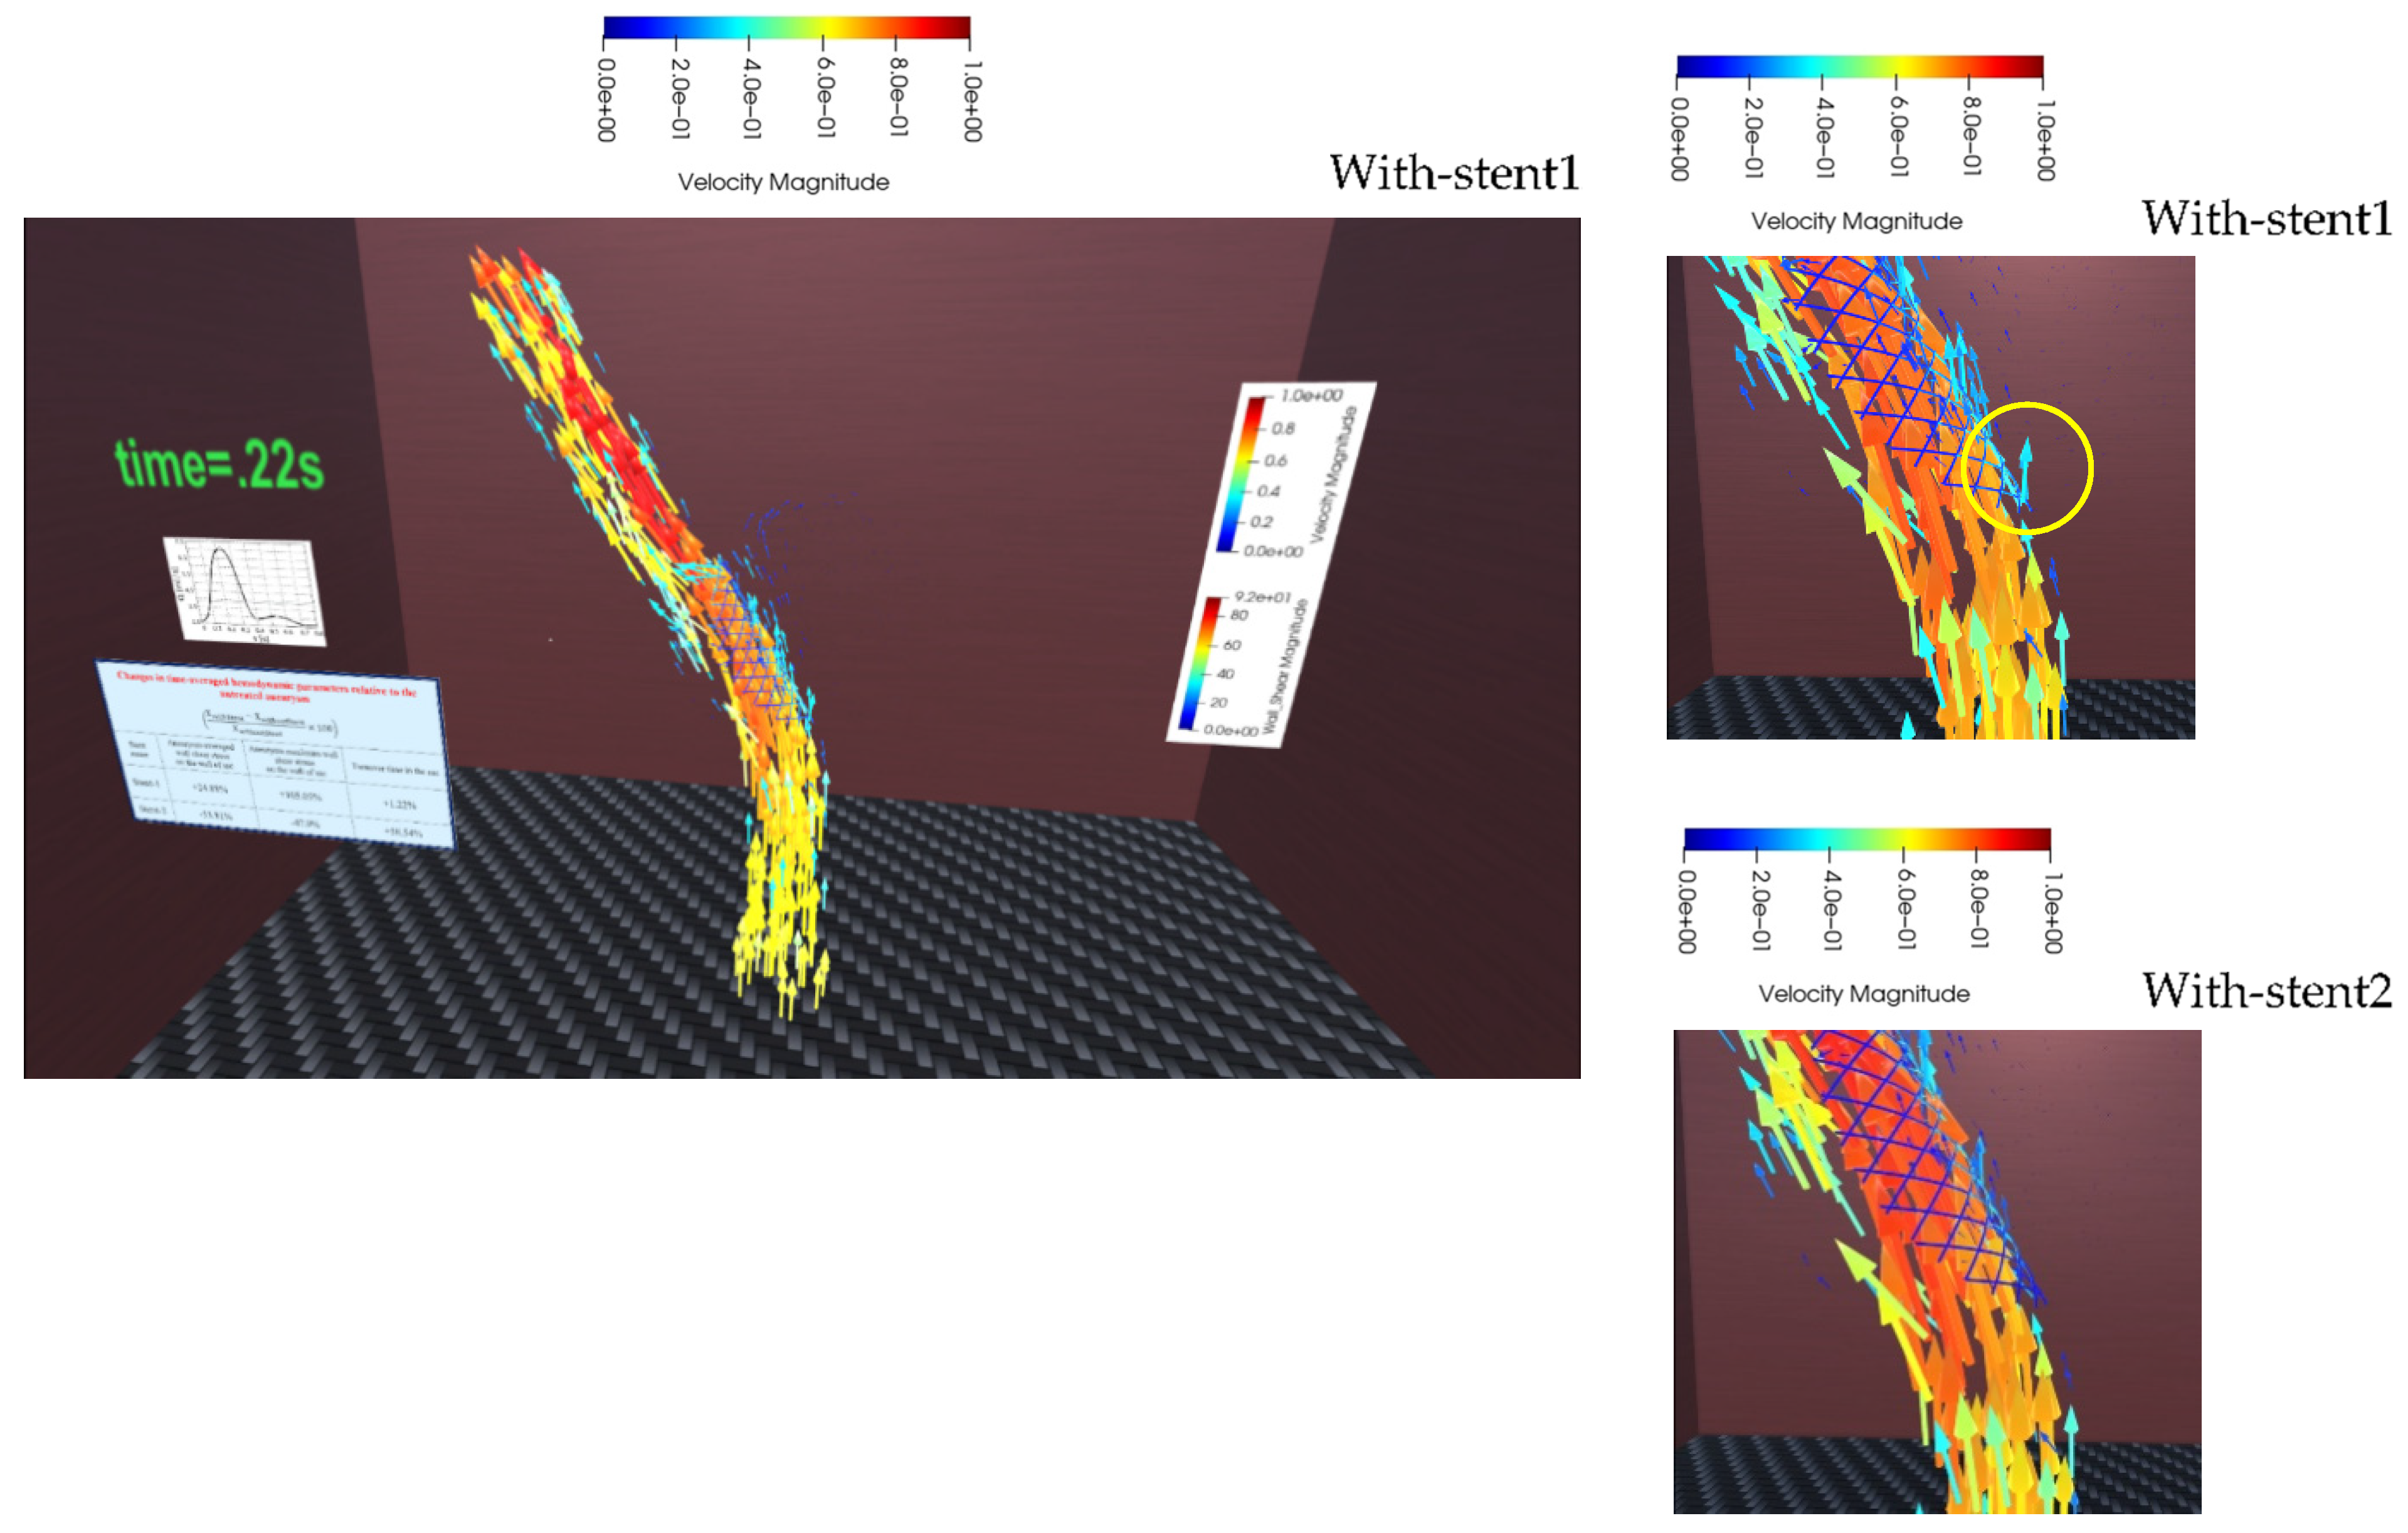
Figure 15 shows a screenshot of the velocity vector animation at
t = t2. The vessel wall has been deactivated here to show the vectors more clearly. In addition to the vectors, the legend, hemodynamic parameters table, and the associated time of the cardiac cycle are displayed. The user is free to walk inside the fluid domain, zoom, grab, or move the domain to explore the flow behavior while the animation is playing or paused. A distinguishing feature of VR visualization can be explored if the user zooms in to the wall–stent gap for the With-stent1 case and find out the high-speed jet flow into the sac through the gap, as displayed in
Figure 15-right. In addition, the time variation in the jet flow velocity is traceable via the velocity vectors animation in the VR environment.
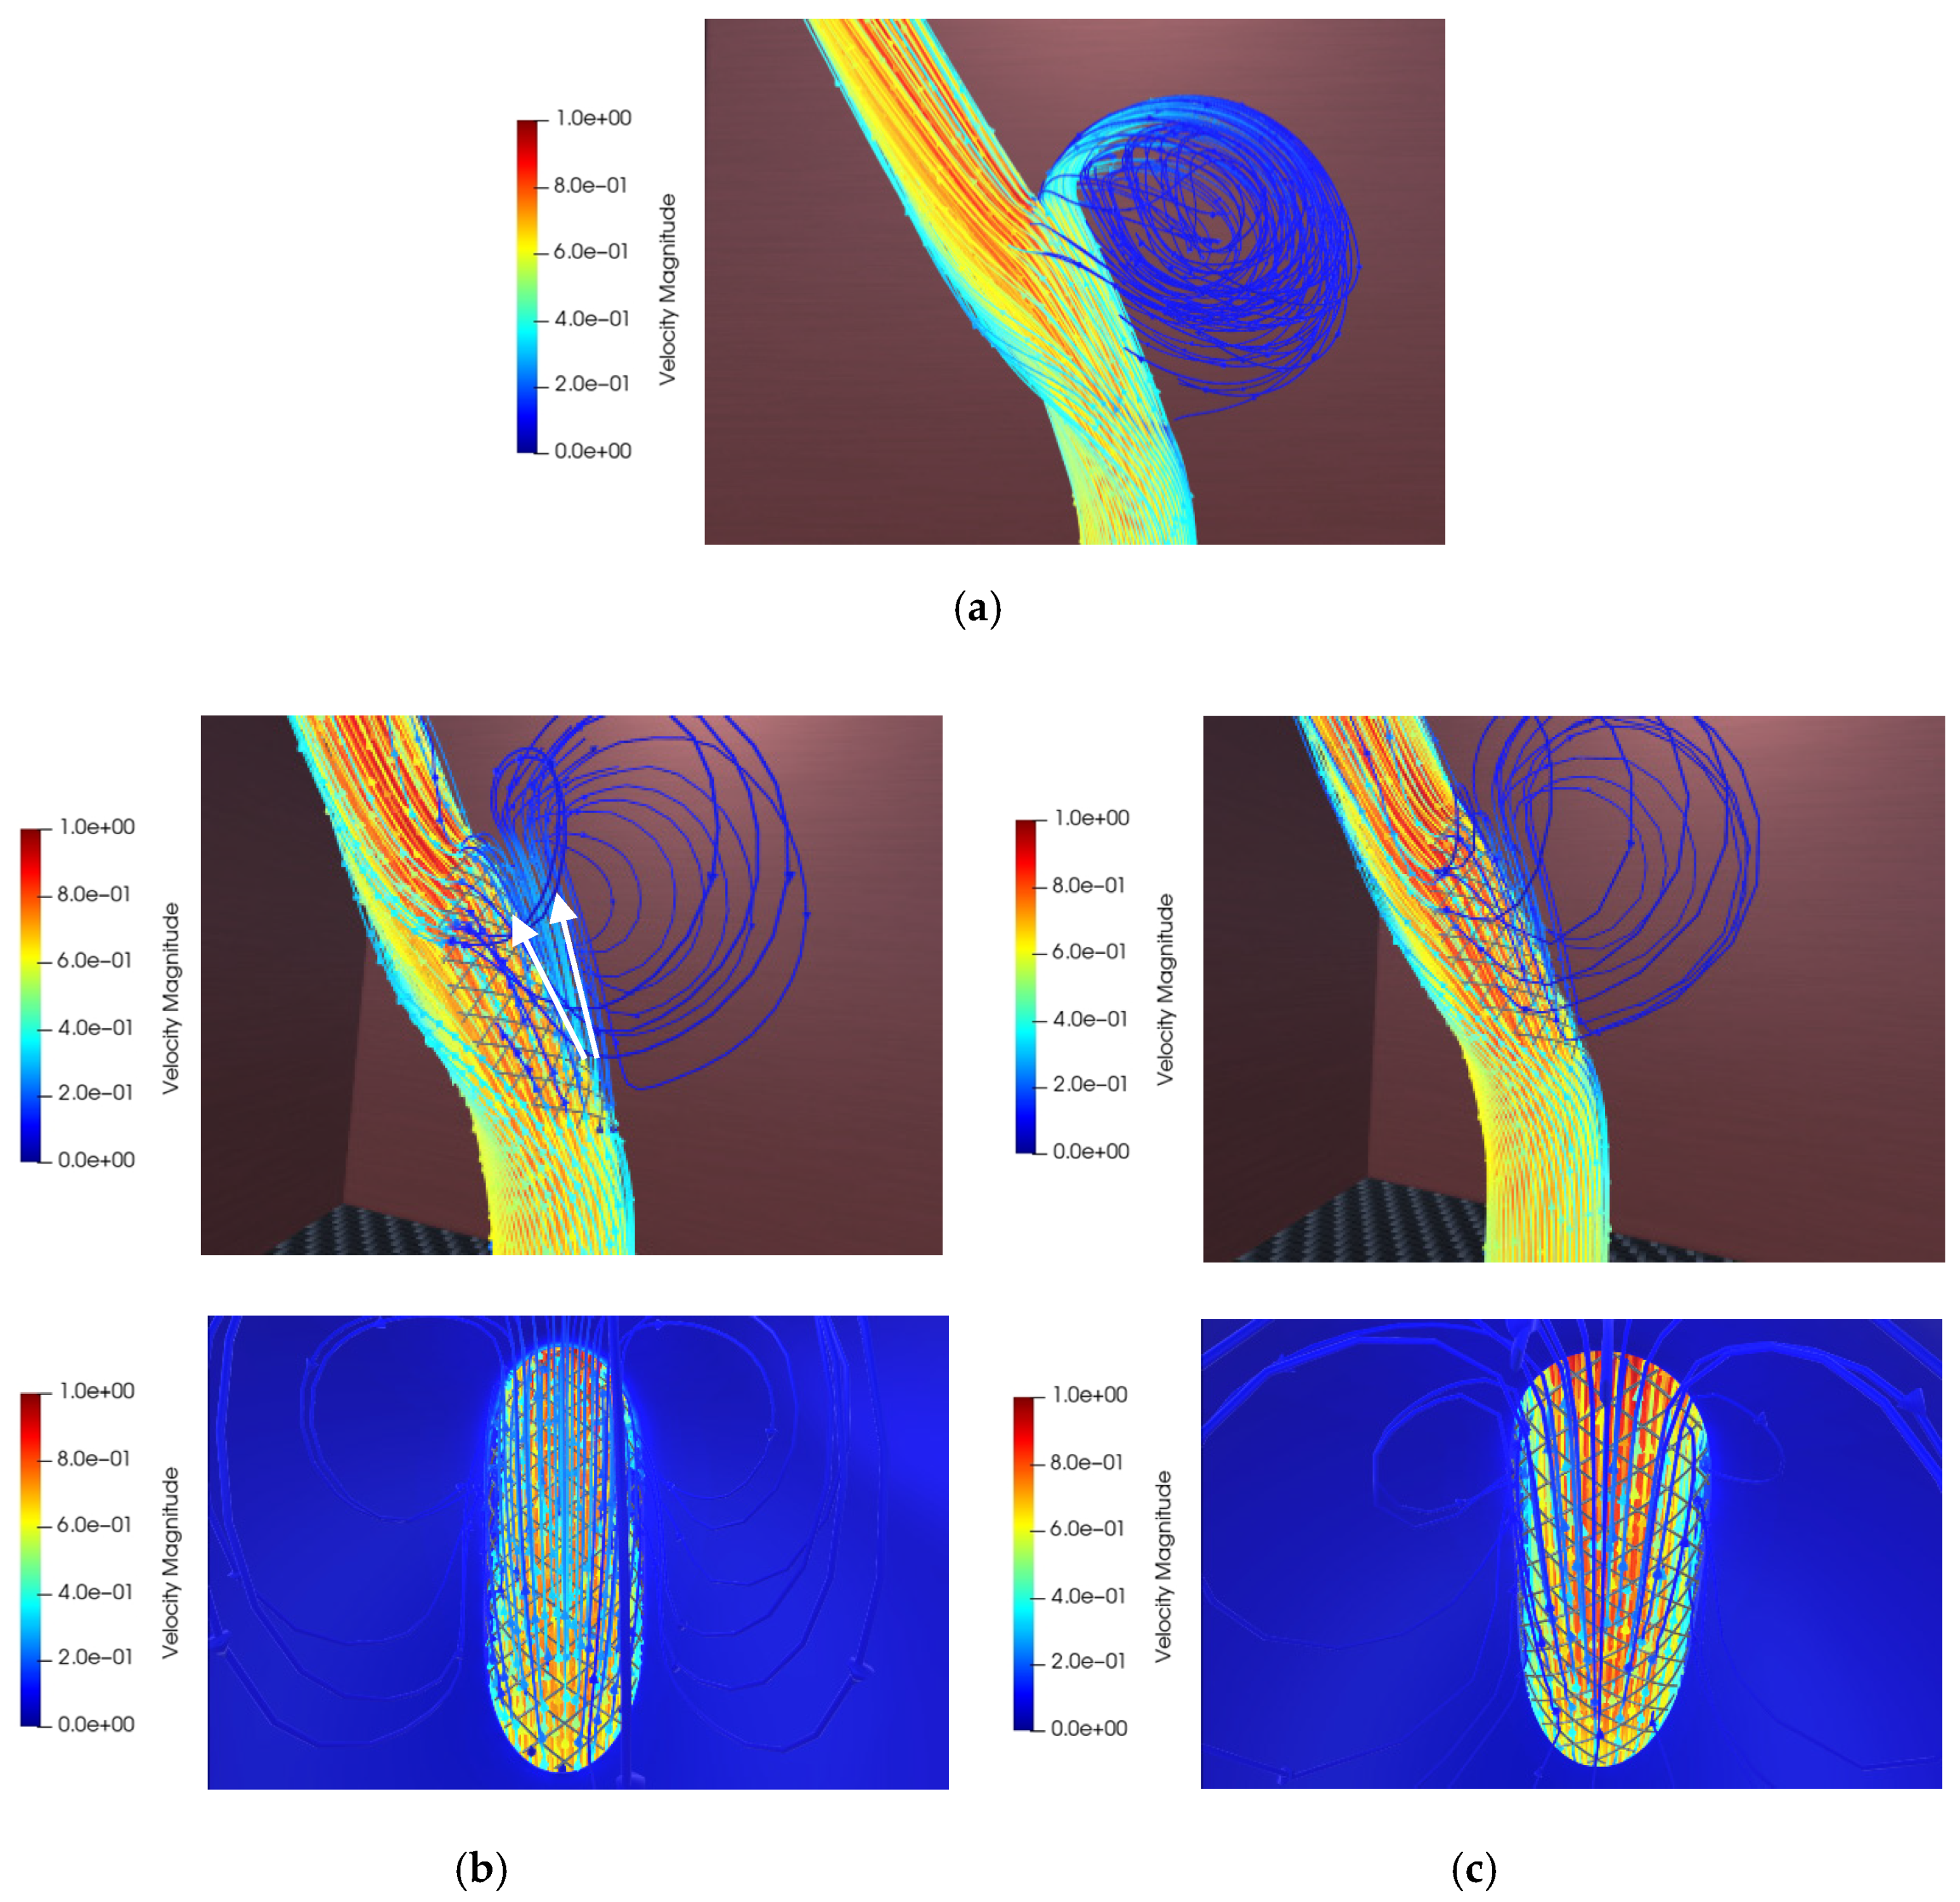
Three-dimensional streamlines provide the viewer with the advantages of simultaneously displaying all recirculating zones that are considerably different for treated and untreated aneurysms. The interactive accessibility of blood flow behavior in the vessel would be experienced by exploring the streamlines, as shown in the screenshots of
Figure 16. Zone1 and Zone 2 can be seen in
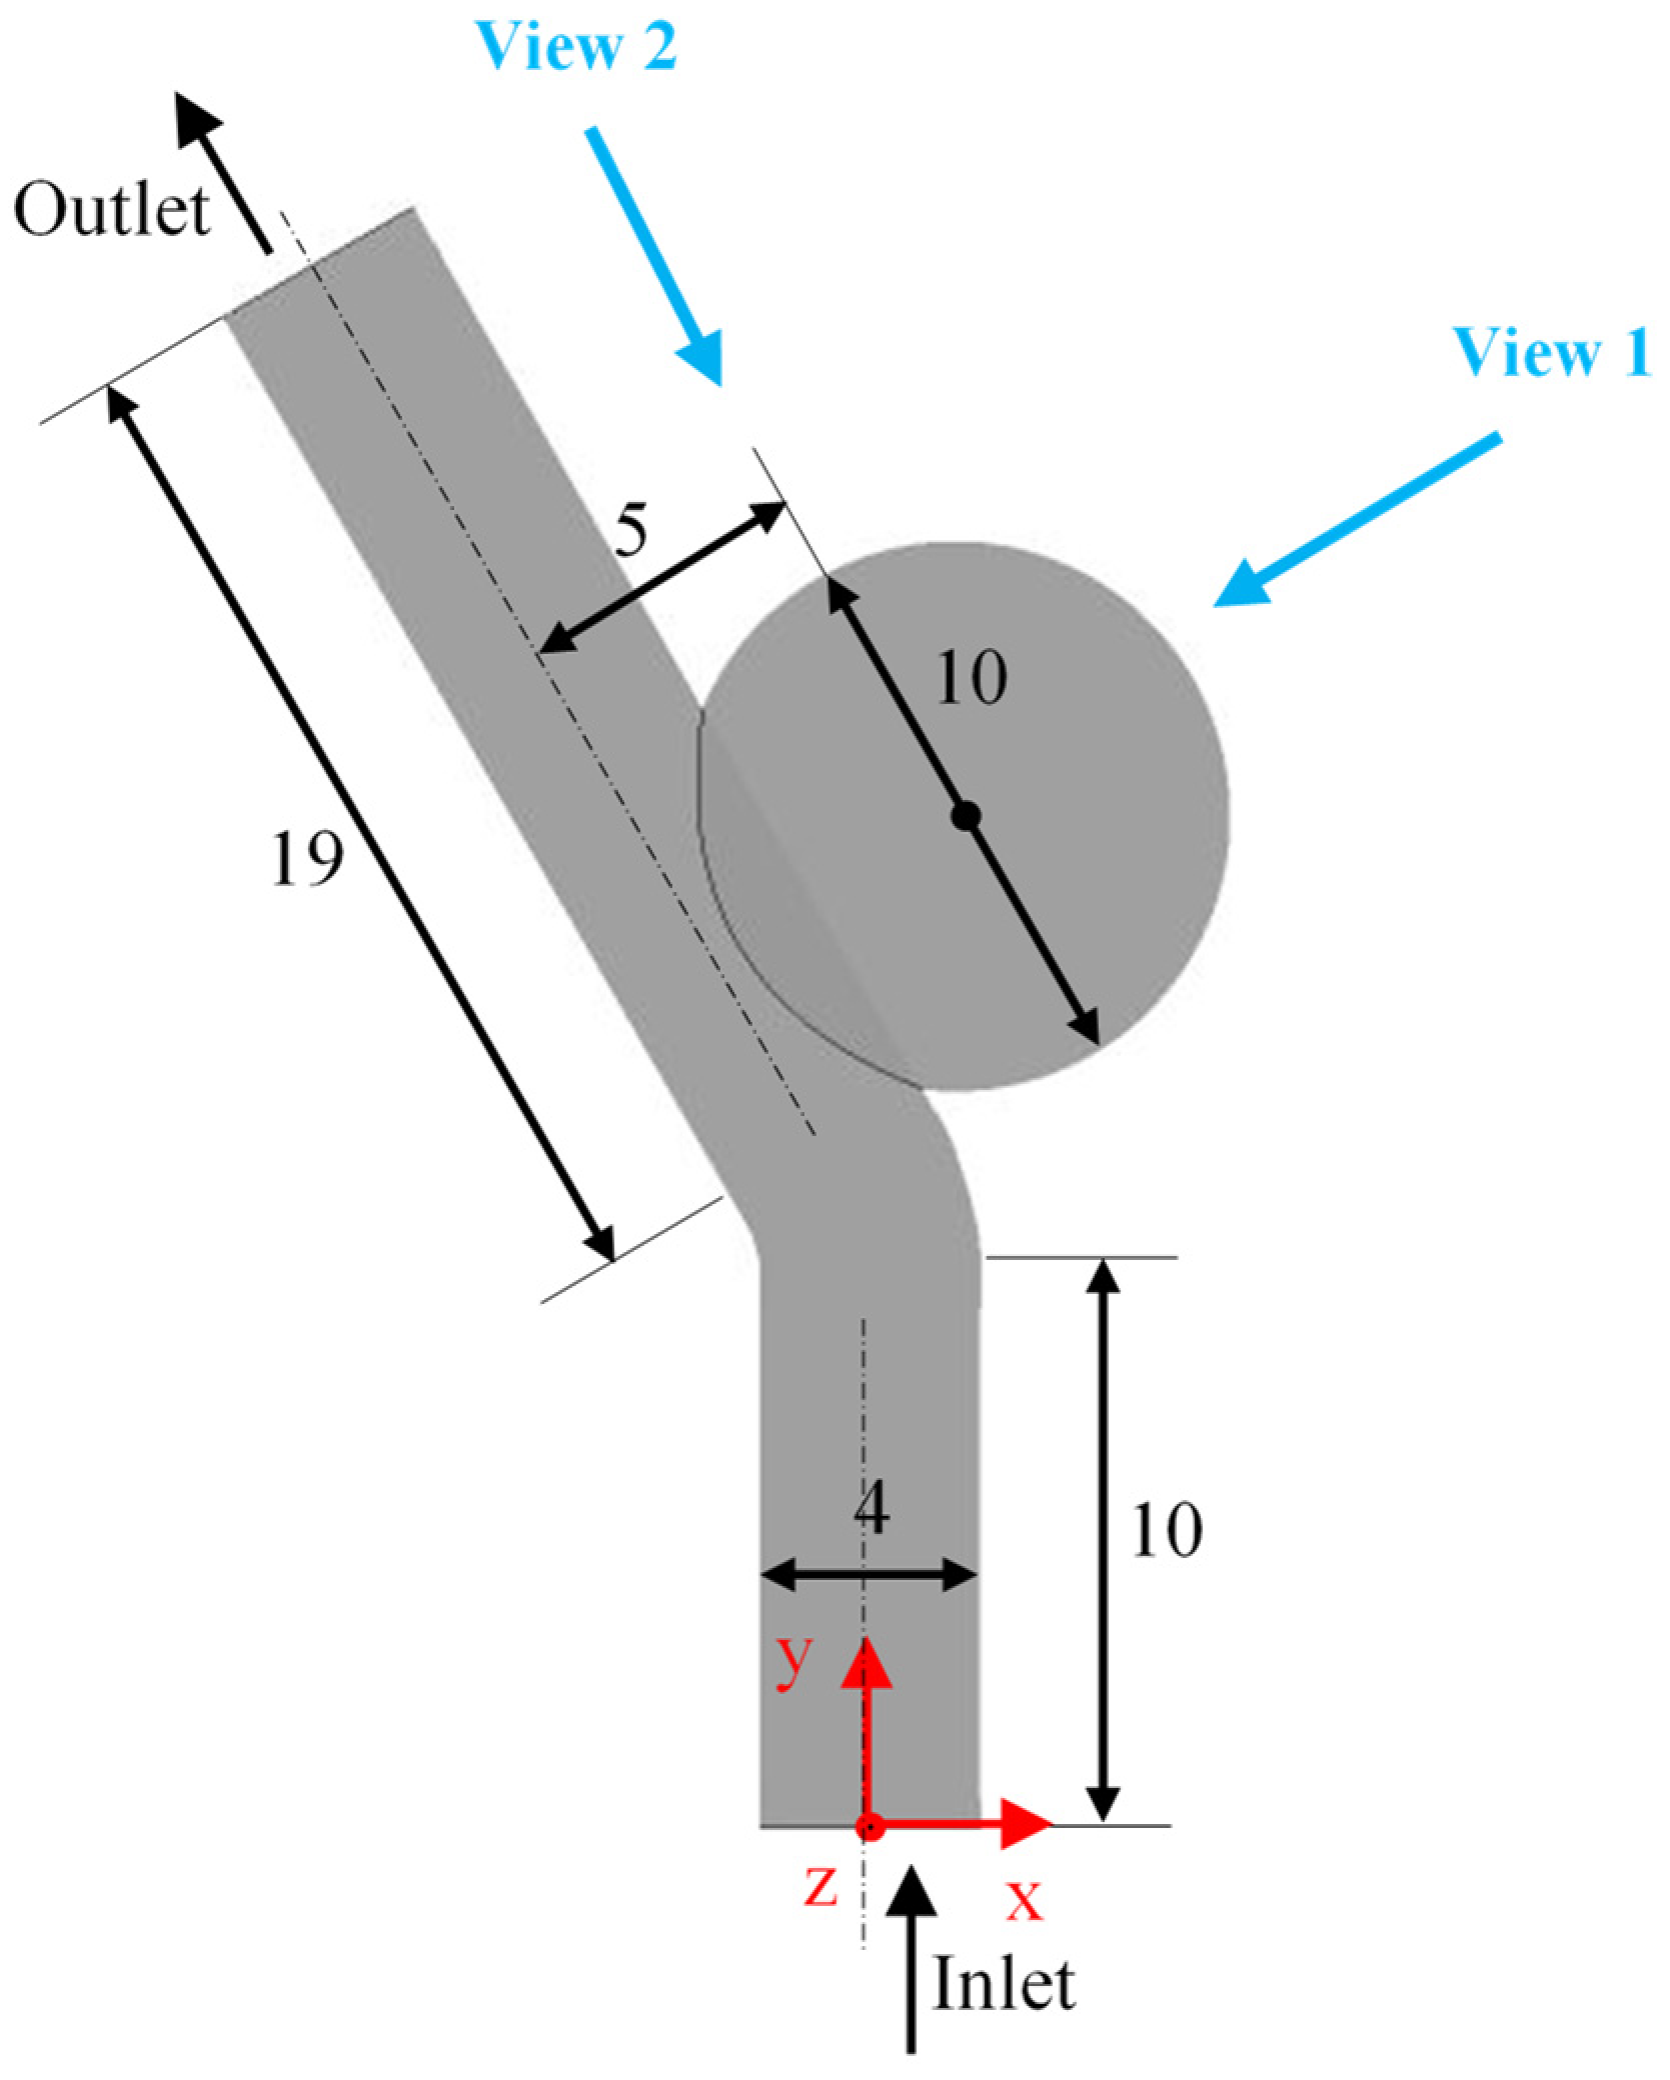
Figure 16b-top,16c-top, respectively. Two white arrows demonstrate the different paths of flow after entering the sac through the proximal neck edge. In addition, vortex flows from View 1 (shown in
Figure 2) are accessible to be explored, as shown in
Figure 16b-bottom and 16c-bottom.
The particle tracer is another proper method to follow the fluid path through the vessel. The
Videos S1 and S2 in Supplementary Materials show the animation of streamlines (Without-stent) and particle tracers (With-stent2), respectively. In these animations, the viewer is mostly located on View 1 and View 2 viewpoints.
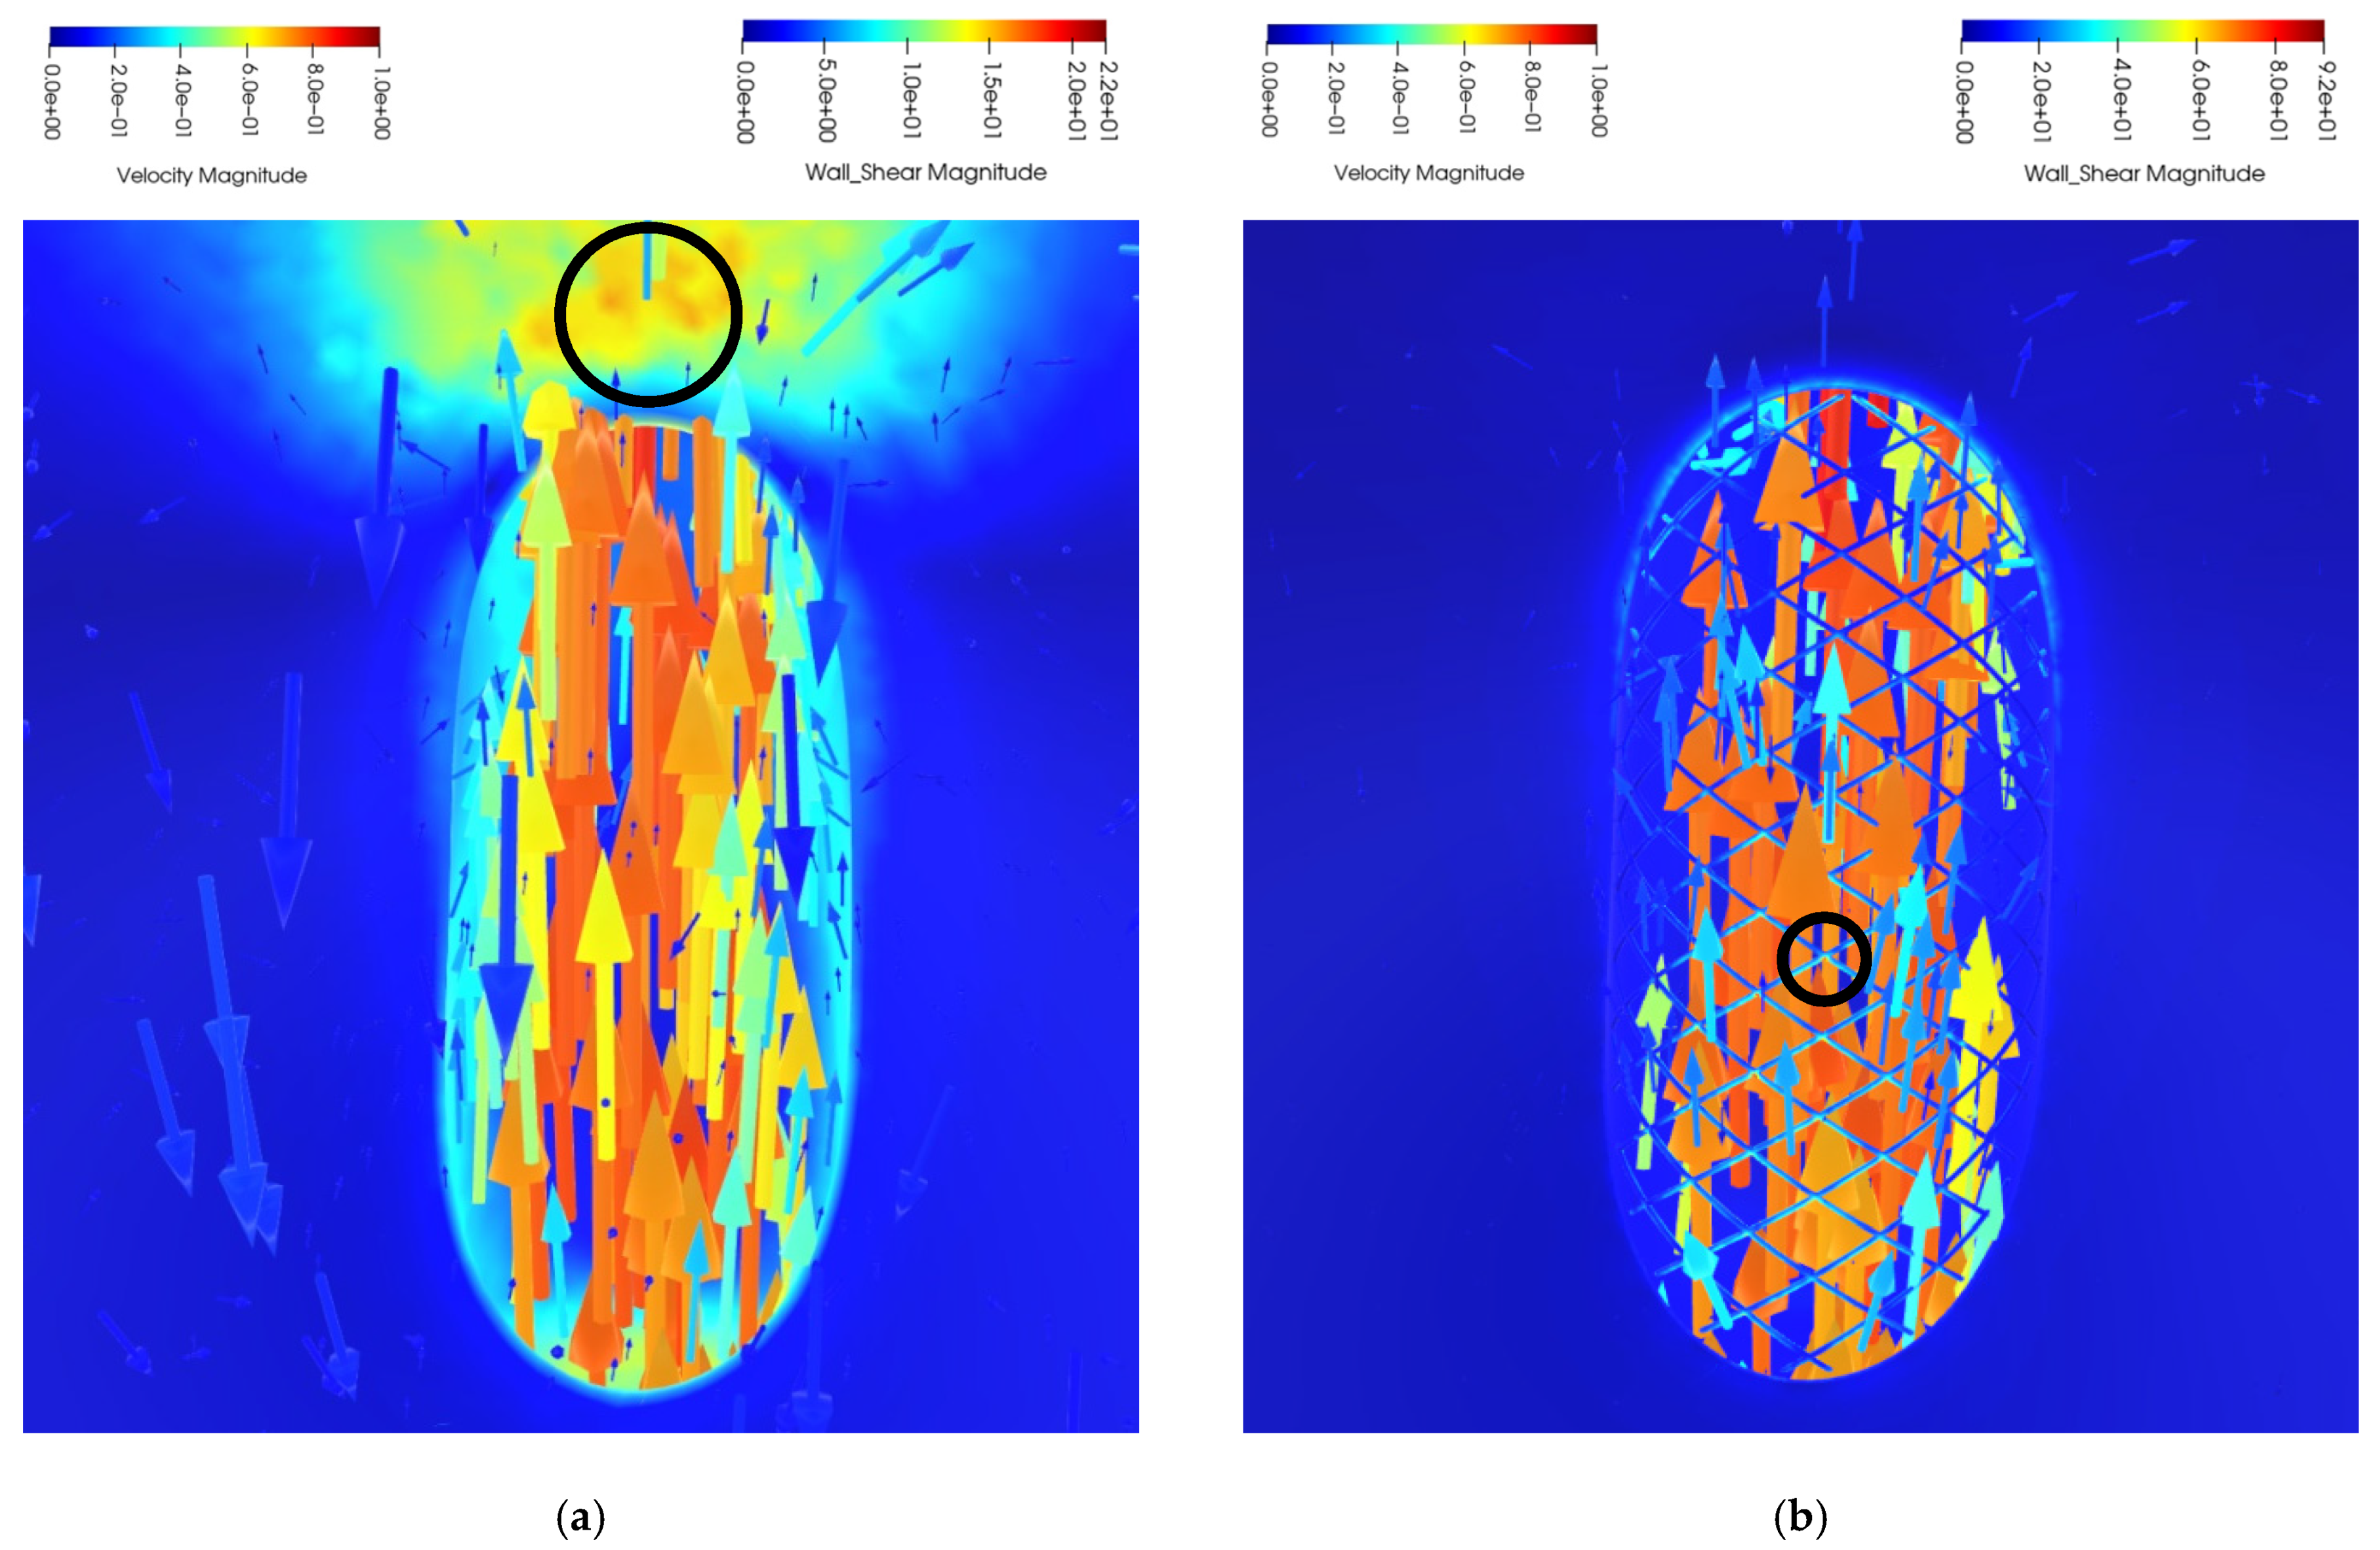
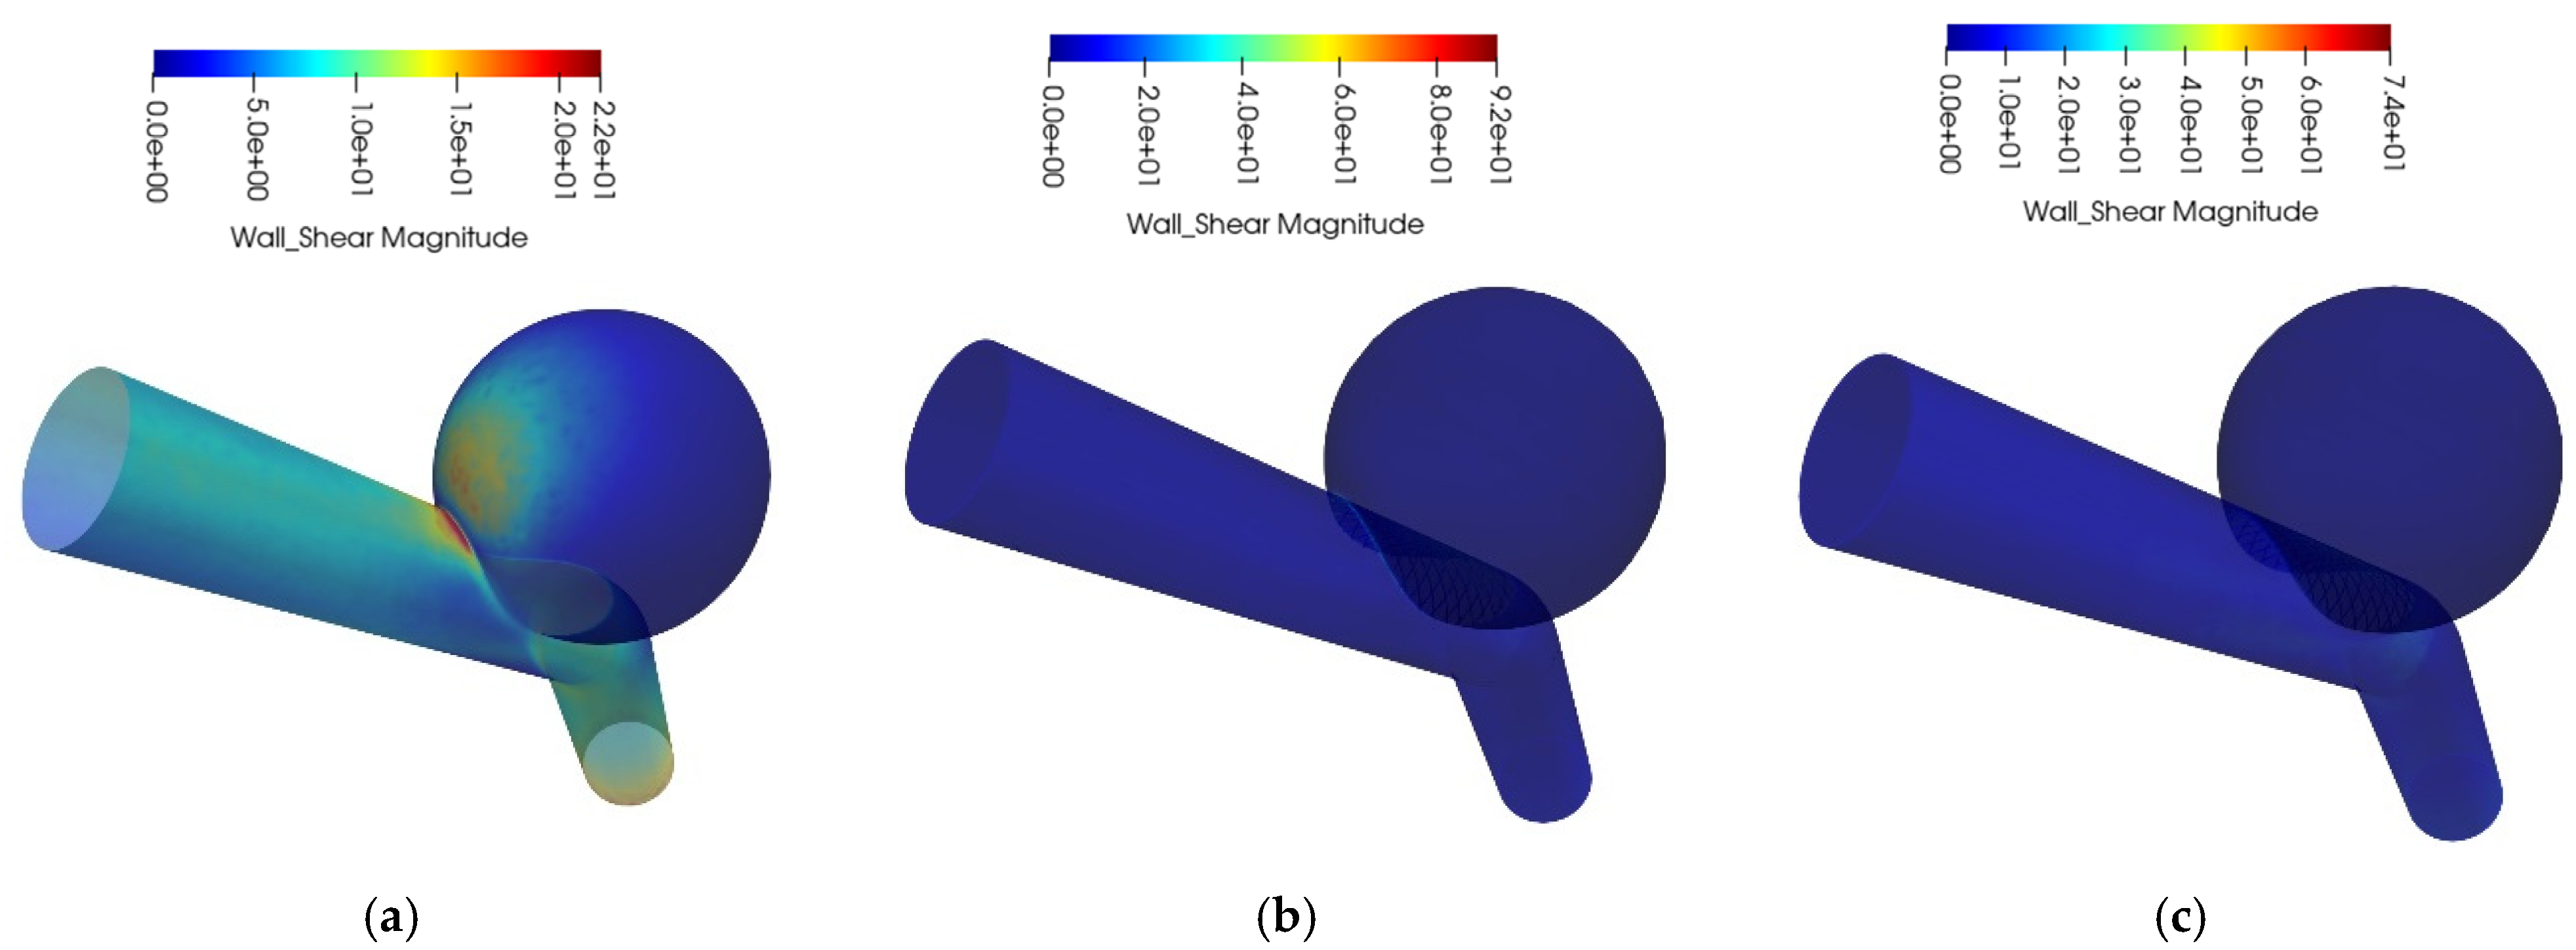
The contours of wall shear stress magnitude at time t2 are shown in
Figure 17 and it can be found out that the locations of high wall shear stress have changed due to stenting. In addition, for the Without-stent case, the distal neck edges on the parent artery wall and aneurysm distal wall have high wall shear stress values, while for the stented cases, the peak WSS occurs on the stent wall, which is safer in terms of aneurysm rupture reduction risk [
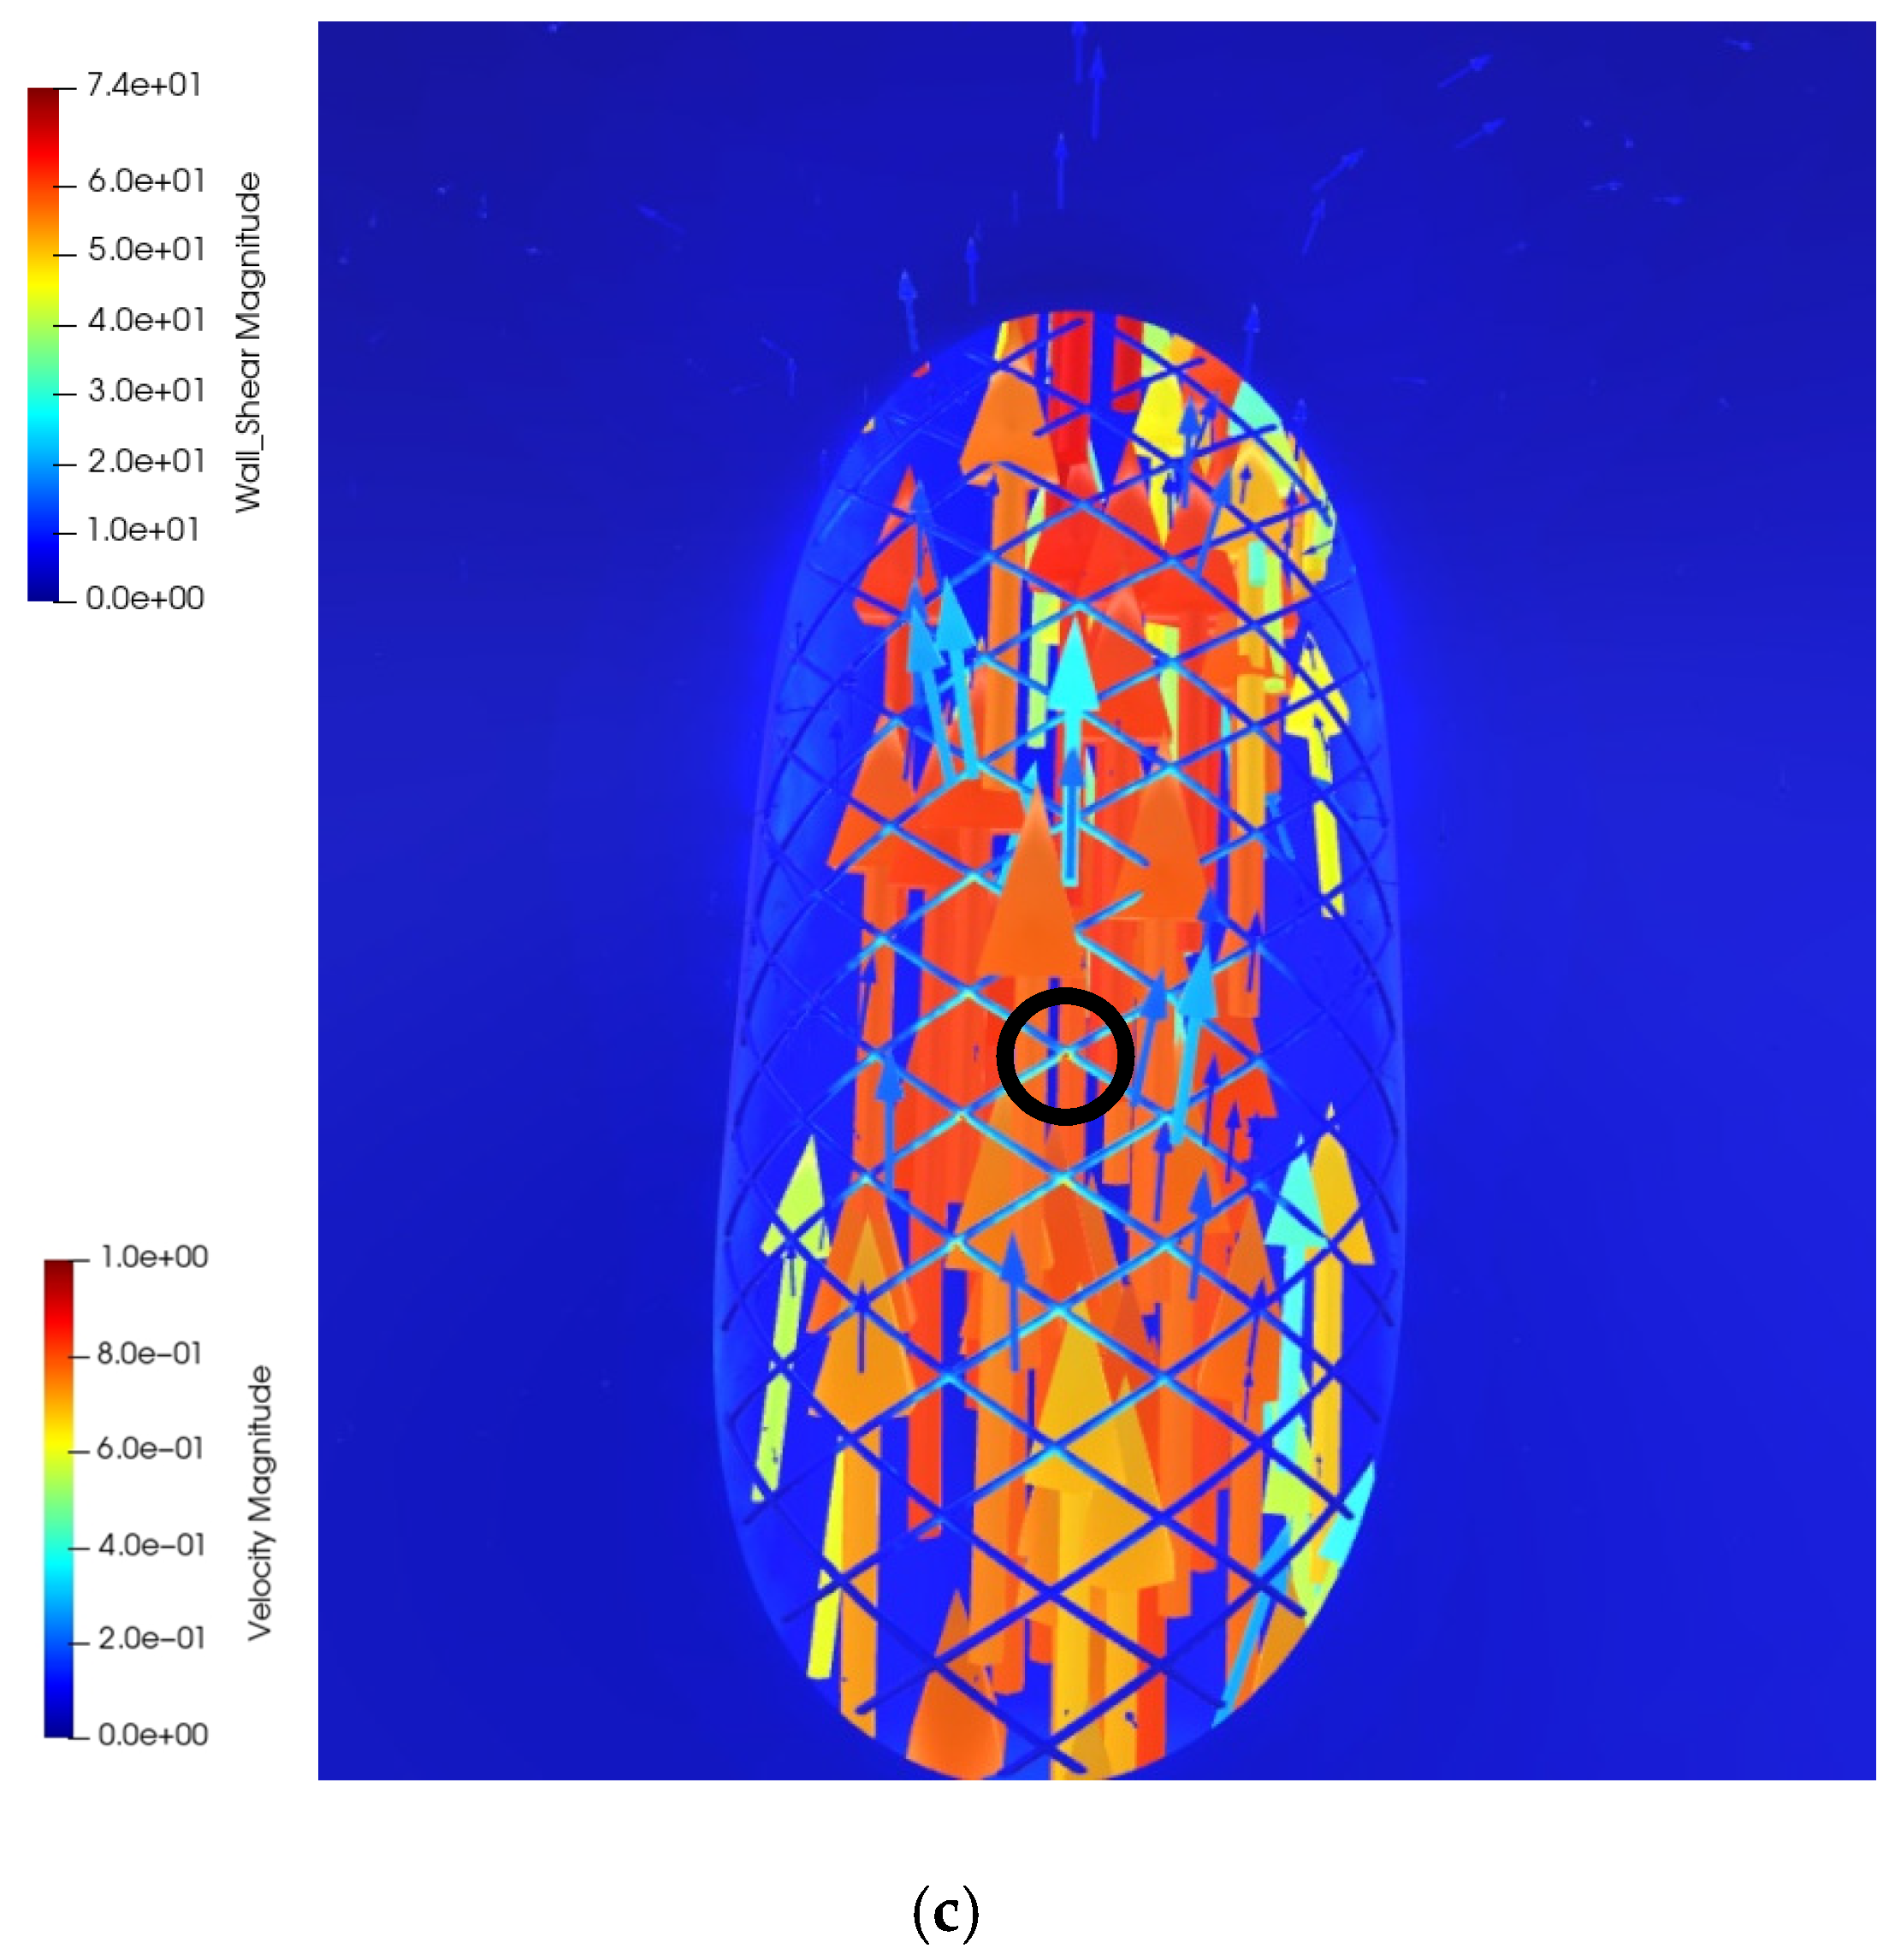
32].The exact regions of high wall shear stress are evident by navigation in the 3D virtual space and by observing the inside space of the sac from viewpoint 1. It is obvious from screenshots of
Figure 18 that the regions of high WSS are located on the stent wires (
Figure 18b,c) contrary to the untreated case for which this location is on the distal sac wall (
Figure 18a). Some locations of high WSS are shown with black circles in
Figure 18. The navigation through viewpoints 1 and 2 can provide extremely informative insight about the flow behavior and WSS distribution inside the aneurysm. The
Videos S3 and S4 in Supplementary Materials show the animation of velocity vectors for Without-stent and With-stent1 with the focus on the wall–stent gap.
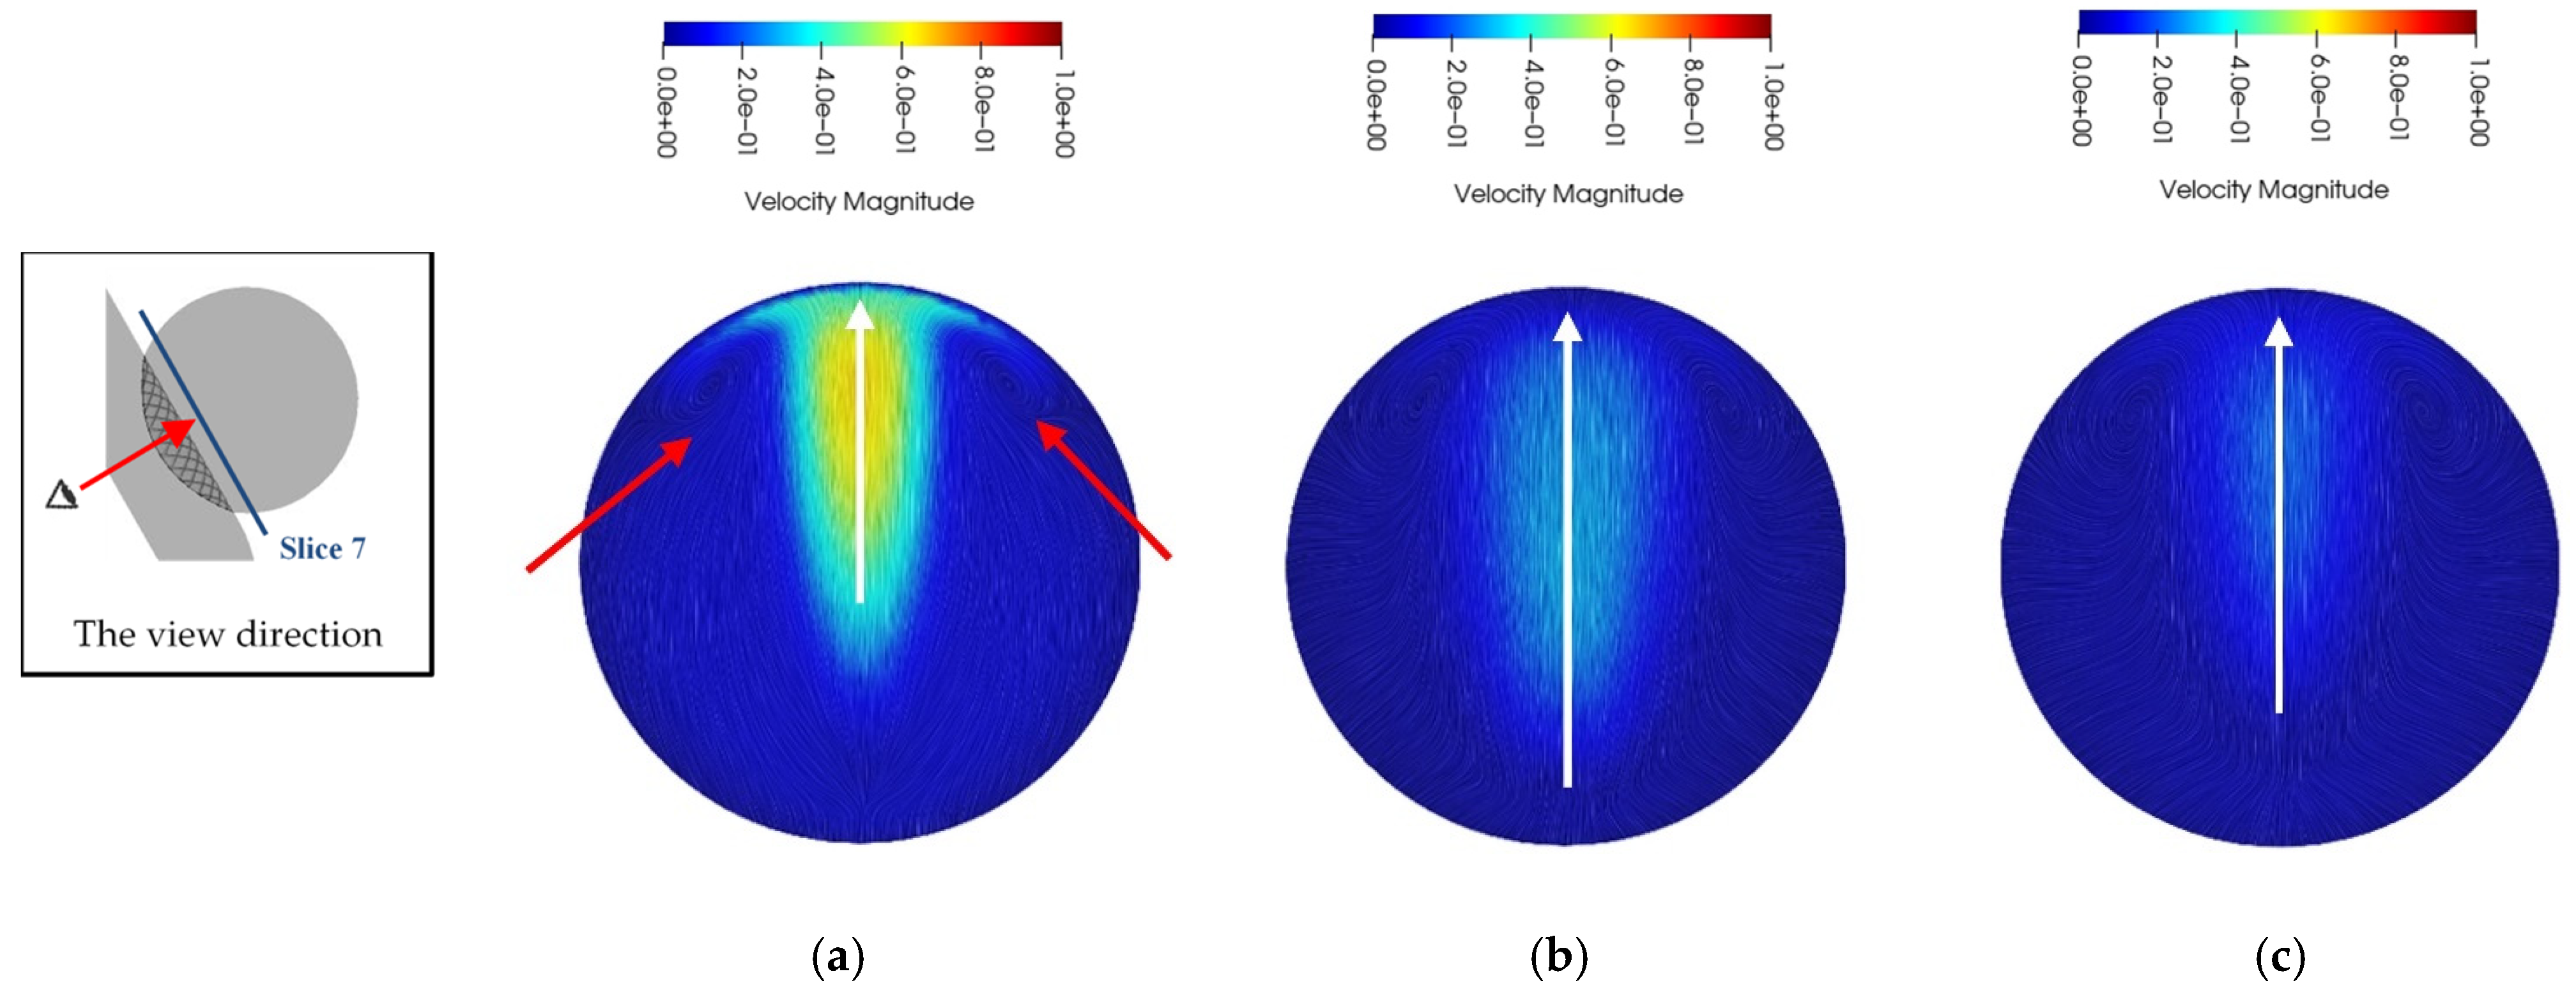
The changes in flow behavior and high WSS regions due to stenting can be explained by displaying velocity contours on Slice 7.
Figure 19 shows the velocity magnitude contours and streaking patterns on Slice 7. The streak pattern shows that the flow enters the untreated aneurysm and then impinges on the distal sac wall with high speed (white arrow in
Figure 19) that is the reason behind the higher wall shear stress and pressure values in this region. The inflow flows in both upward and lateral directions and leads to the creation of two small recirculating zones around the impingement point (red arrows
Figure 19). In addition, this figure shows the higher flow rate into the sac for the untreated aneurysm, in comparison to the stented cases, and the With-stent2 case has the lowest inflow. It is obvious that the presence of the wall–stent gap influences the inflow rate into the aneurysm.
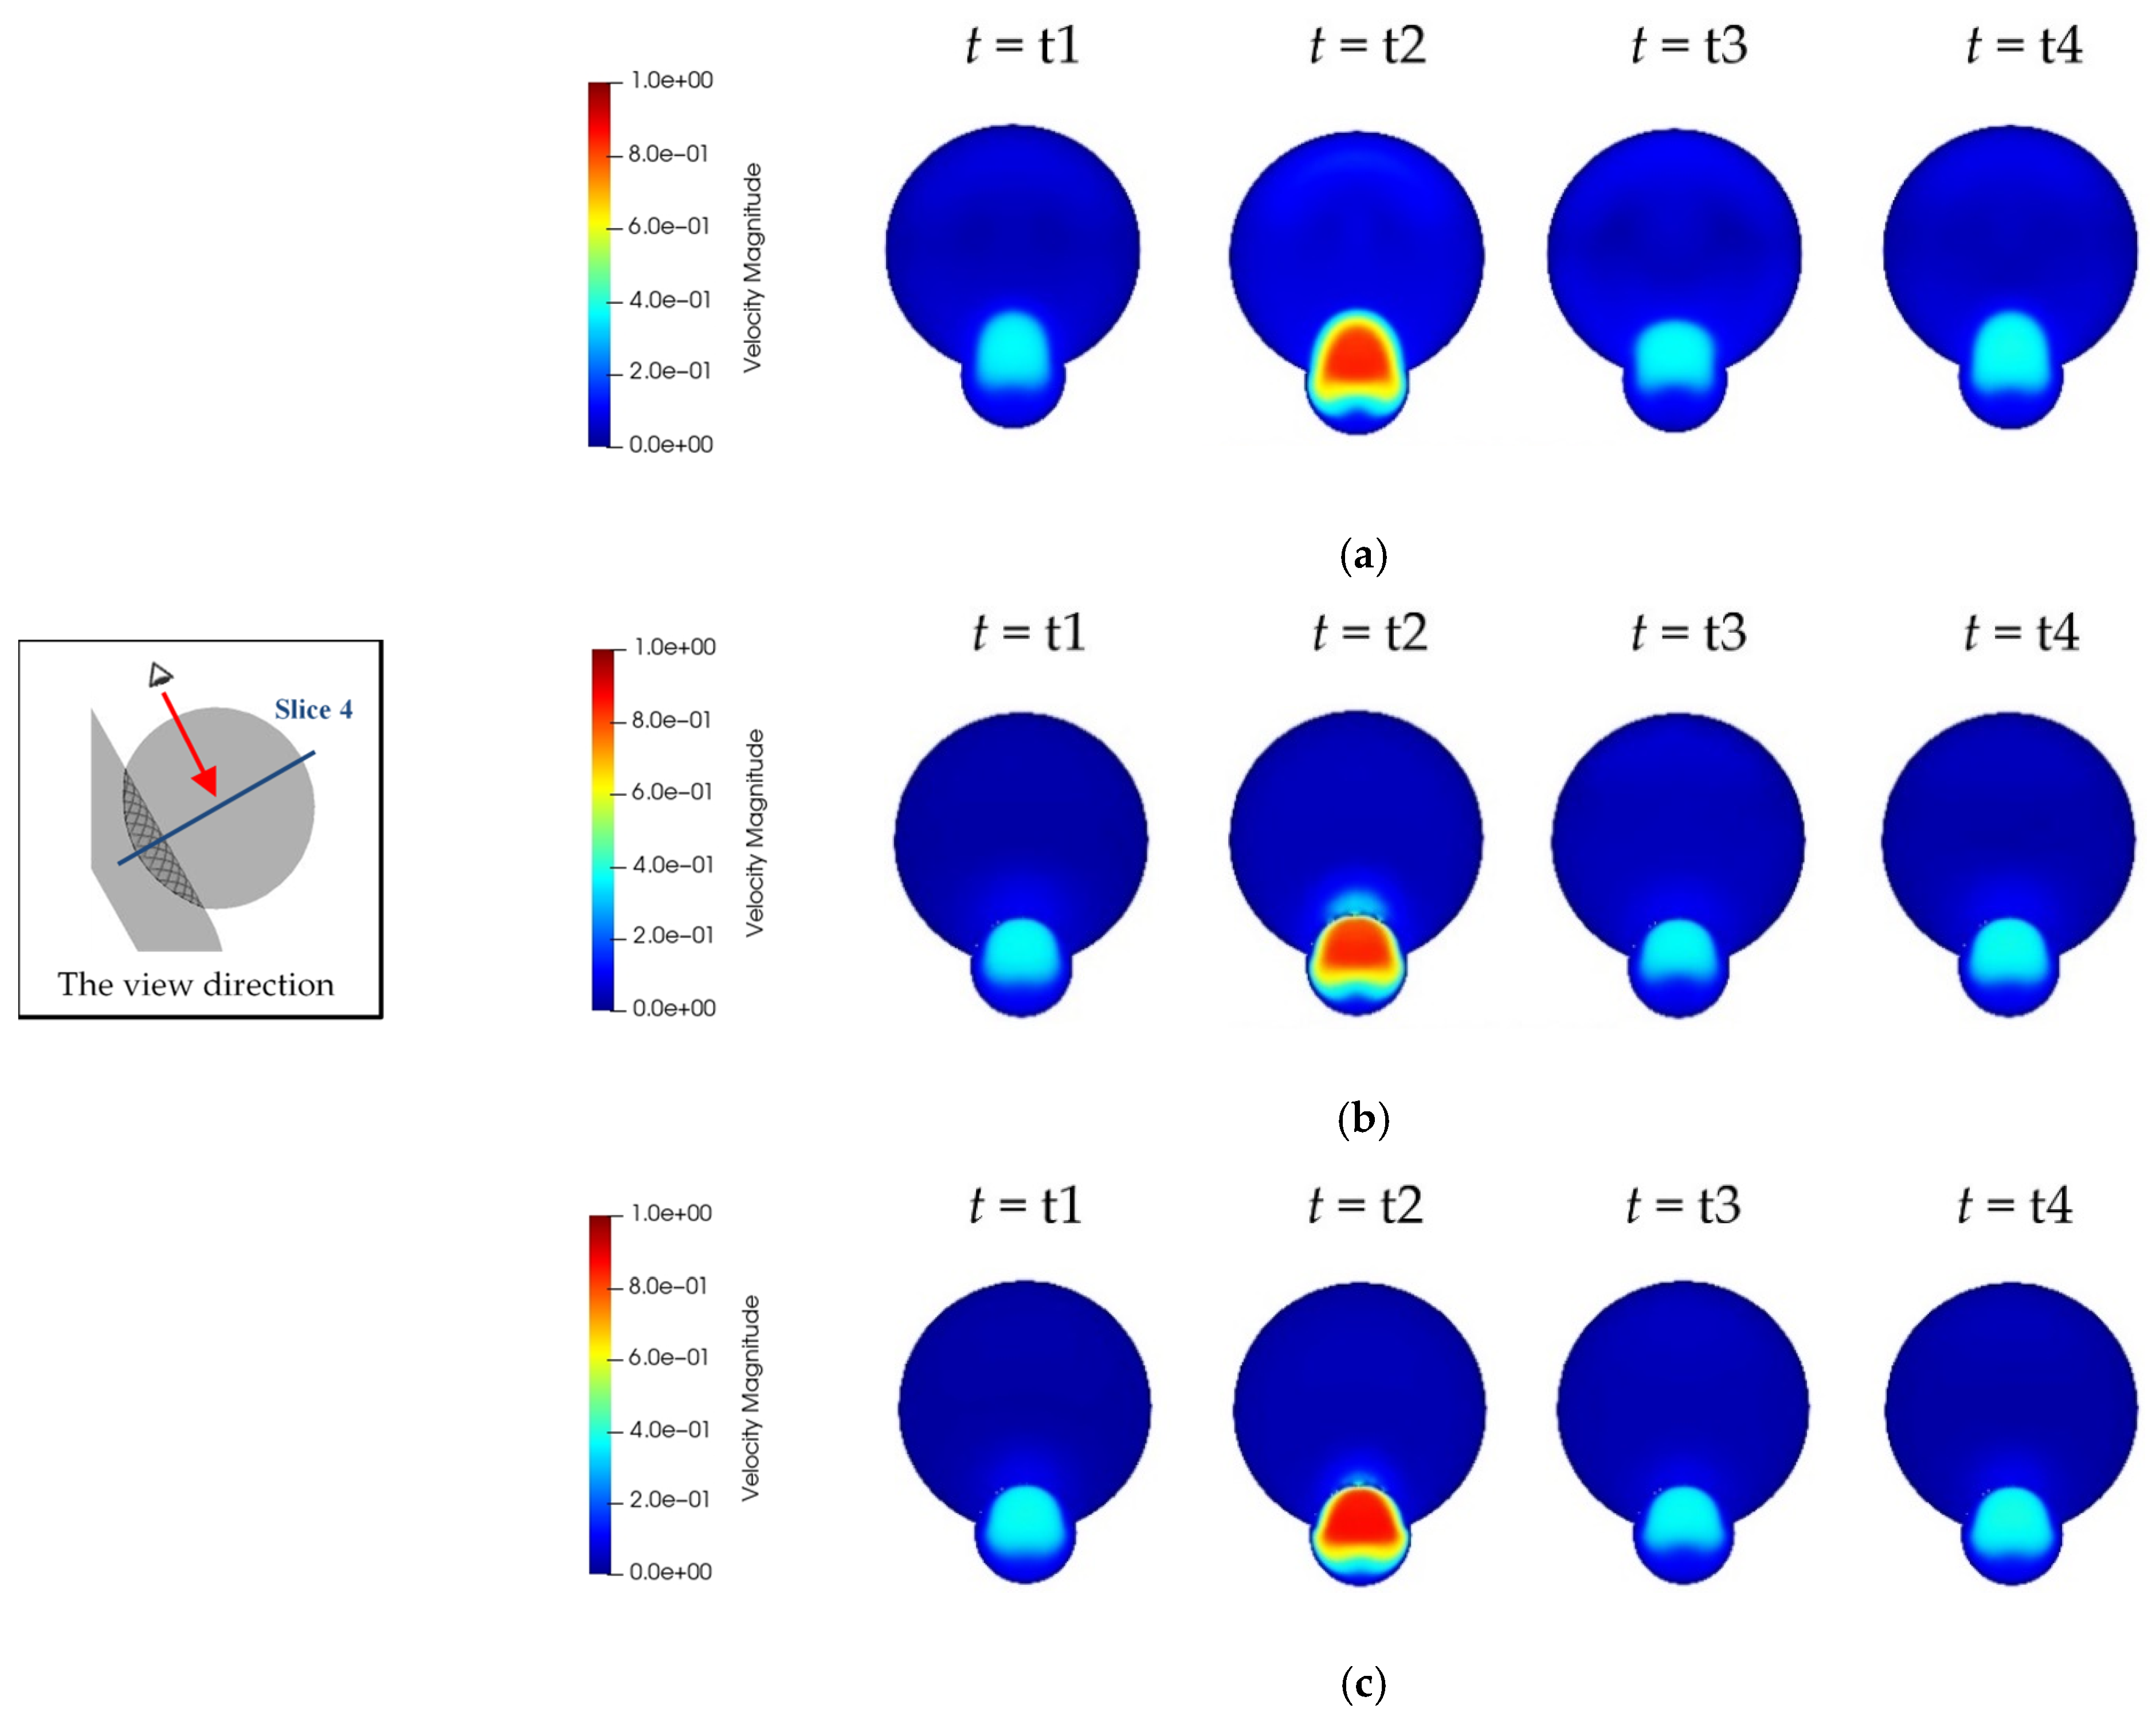
To show the time variation of parameters, it is required to use several slices in routine postprocessing methods. An example is presented in
Figure 20 that shows the velocity magnitude contours and streak patterns on Slice 4 at four points in time. It is evident that the highest inflow rate into the aneurysm is associated with the Without-stent case at all times. For stented cases, the high velocity is limited to the near neck regions, especially for Stent2. As the flow enters the aneurysm sac, a slow speed zone adjacent to the parent artery opposite to the neck is generated and results in the creation of a vortex pair at the entrance. Similar behaviors can be seen in the inflow region of stented cases. The lower the flow rate into the aneurysm, the smaller the slow-speed zone, and the larger the vortex pair size. The streak patterns in
Figure 20d illustrate this flow behavior. Furthermore, Zone 2, introduced in
Figure 14, can be seen in
Figure 20d for both stented cases, while that of With-stent2 is smaller due to the lower inflow rate. More detailed spatial CFD results and their changes versus time are represented by VR visualization, as shown in
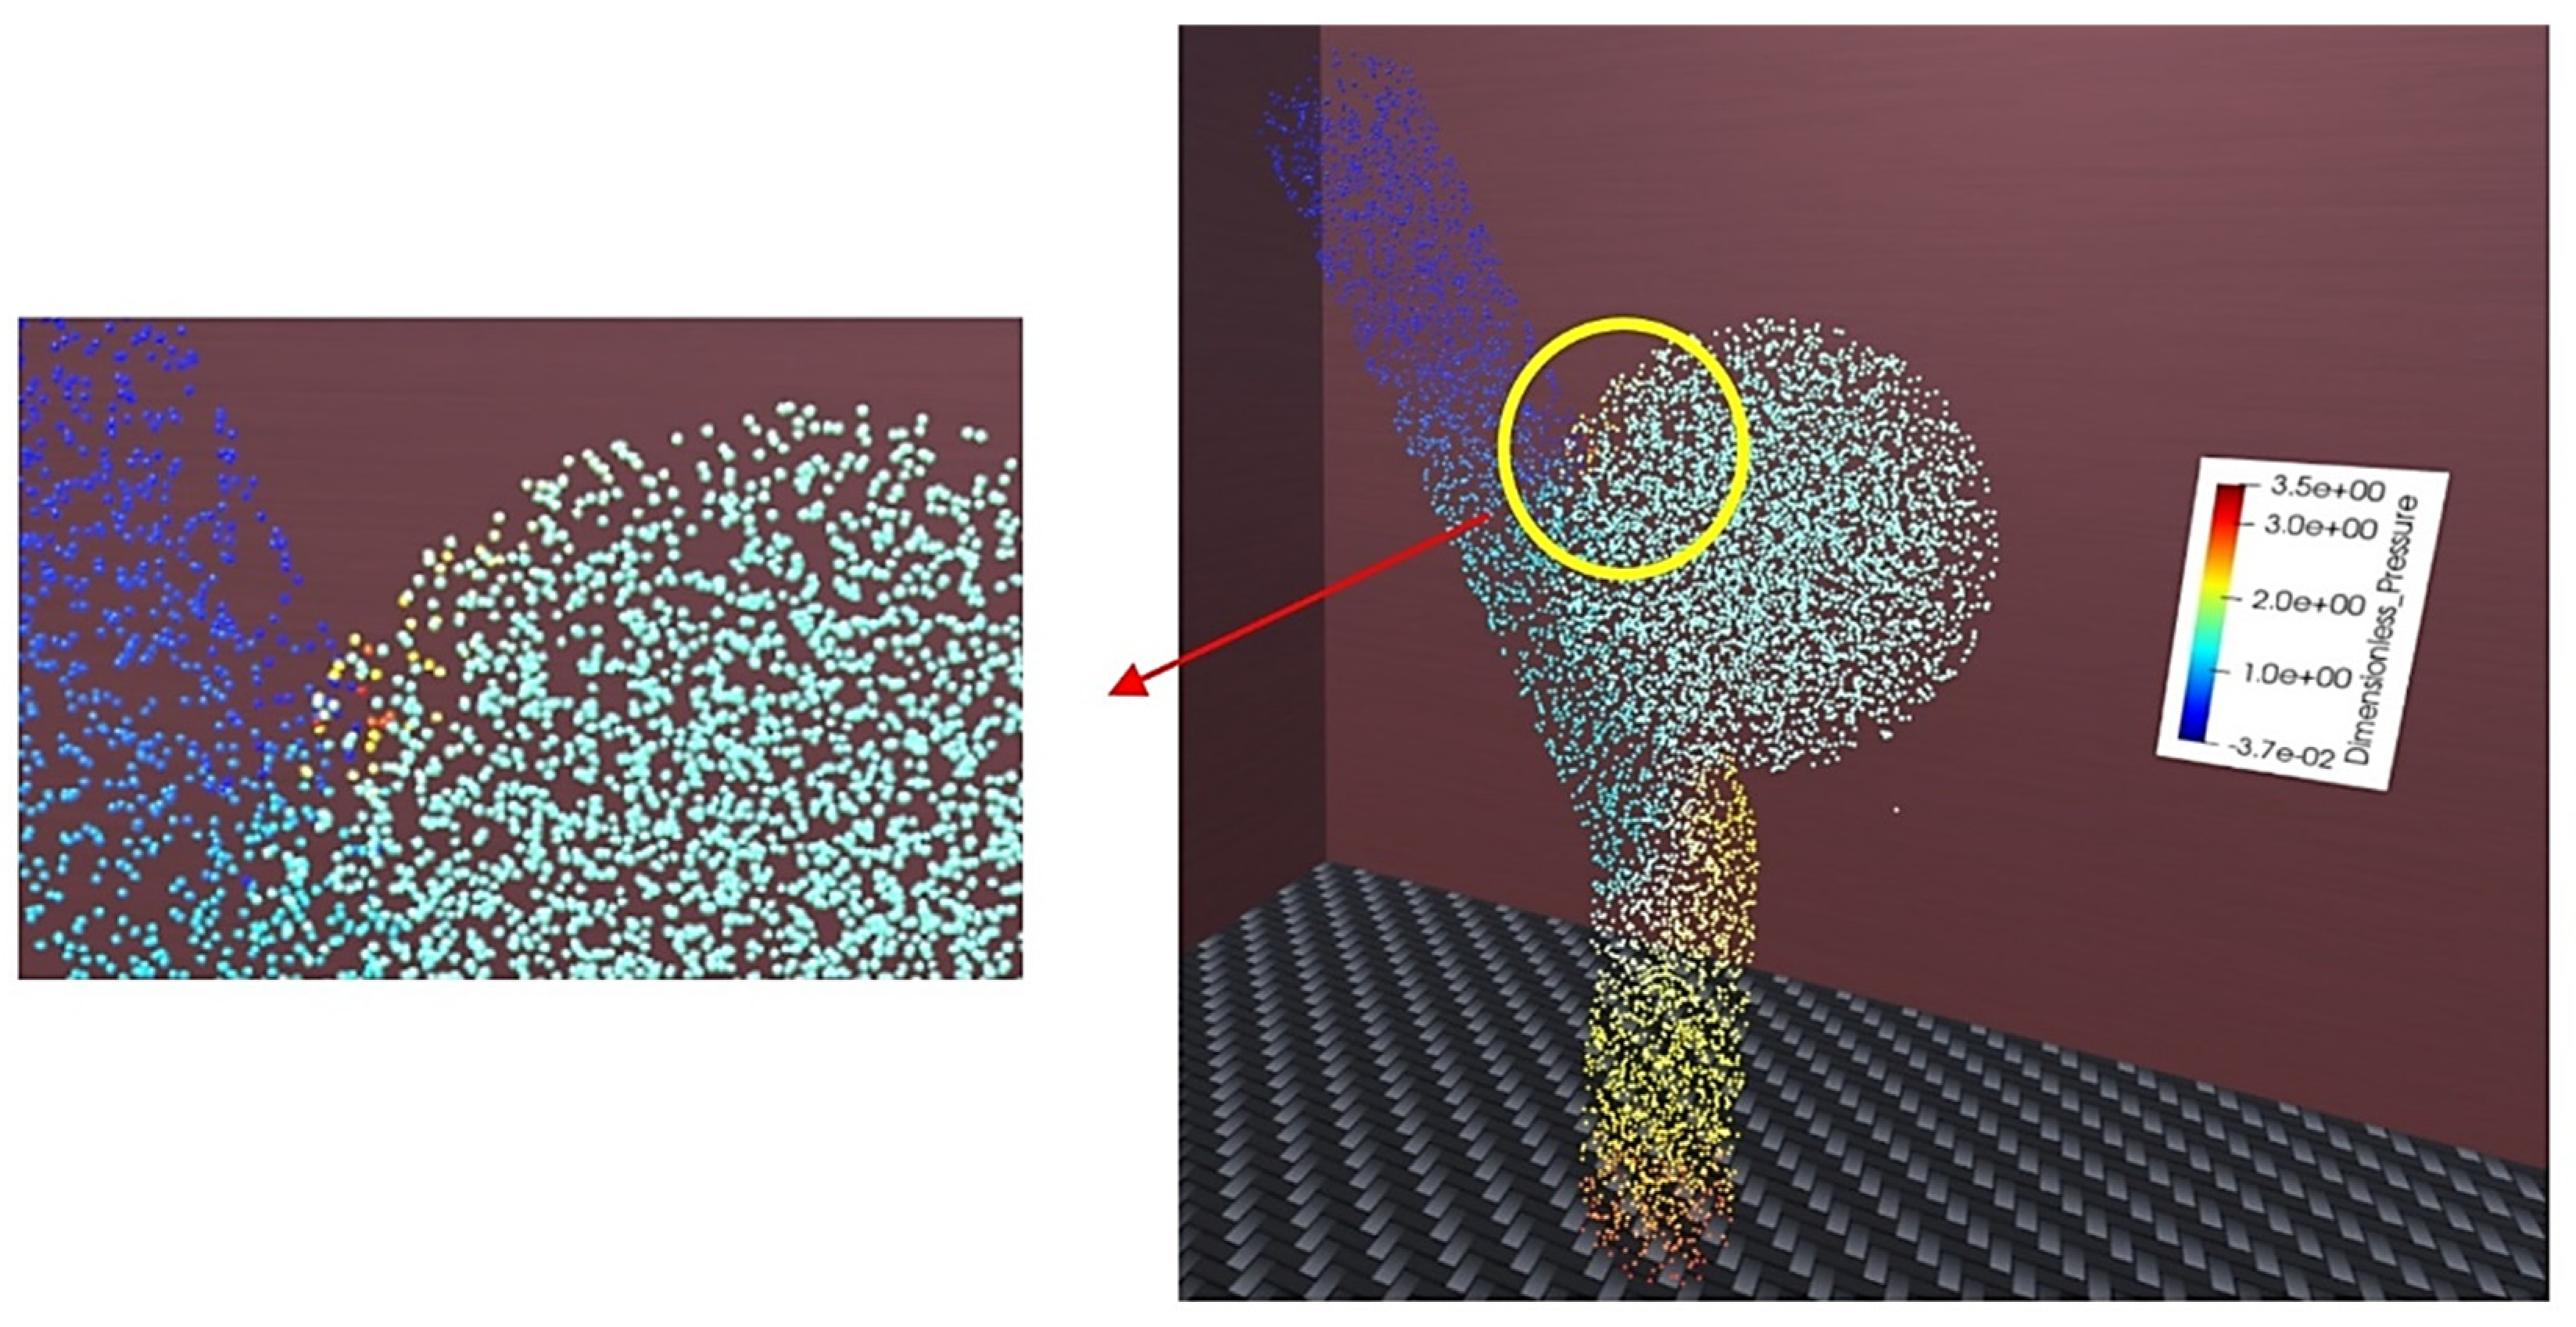
Figure 21. This figure shows some screenshots of velocity magnitude contours on Slices 1 to 6.The disadvantages of traditional postprocessing methods are obvious from previous section figures. In a 2D environment, flow behavior is explained using several slices. Even traditional animations made of unsteady CFD simulation data are observed with a limited fixed viewing angle. The more interactive VR environment and six degrees of freedom overcome these issues using 3D vectors and streamlines or a point cloud field. For example, to develop insight into 3D variations in scalar variables, the visualization of point clouds colored by scalar variables may be an ideal method. The variation in point color represents the high-risk regions that need identifying and consideration in the treatment with FD devices. The blood pressure at the inlet boundary was extracted from the CFD simulation results, and the time-averaged pressure during the second cardiac cycle was calculated to produce the dimensionless pressure.
An example of a point cloud colored by dimensionless pressure for the Without-stent case in the VR environment is given in
Figure 22. The points with red, orange, and yellow colors adjacent to the distal sac area are the locations of high pressure due to the direct impingement of the inflow on the sac wall, which can be easily found by navigation in the pressure field.
The main purpose of using FD stents is the creation of aneurysmal flow stagnation and the facilitation of thrombosis. Long turnover times, lower time-averaged kinetic energy, and lower wall shear stress magnitudes actively promote the occurrence of thrombosis. These hemodynamic parameters are compared for treated and untreated cases in
Table 1. The jet flow through the wall–stent gap increased the inflow rate into the aneurysm, and as a result, the average wall shear stress and the kinetic energy for the With-stent1 case increased. Turnover time is the time the flow takes to enter the sac, circulate there, and return to the parent artery [
33]. The longer the turnover time, the more expedited the thrombosis process. By using the stent2, the turnover time increased 58%, while there was a 41% reduction in the aneurysm-averaged kinetic energy, relative to the untreated case. It is clear that With-stent2 has the desired performance as a treatment device.
4. Applications and Limitations
VR has been used in neurosurgery to simulate the operating room experience so that surgical residents can rehearse cases before operating on live patients to promote their surgical skills and reduce patient risk [
34]. Furthermore, VR has been used to provide preoperative plans for invasive treatment strategies and improve surgical outcomes [
35]. The current CFD-VR method is a more suitable use for the latter purpose. The main difference between VR simulators and CFD-VR visualization in cerebral endovascular neurosurgery is that the first one is more focused on the implementation of the intervention, while the second one illustrates the consequences of the proposed method and conditions after treatment. Notably, the other important aspect of the current CFD-VR method is its applicability to design a unique patient-specific treatment method for every patient. The neurosurgeon could use computed tomography (CT) and/or magnetic resonance imaging (MRI) to build each patient’s 3D aneurysm model (8). Then, the model could be transferred to computer-aided design (CAD) software and, using the generated model, the computational fluid dynamics simulation can be carried out for the cases where flow diverter devices with various geometries are used and deployed with varying positioning. The VR-visualized results would indicate the effect of various FD devices on blood flow and important hemodynamic parameters and produce significant insight for the neurosurgeon when selecting and positioning these kinds of tools. This could lead to a reduction in technical errors and greater treatment efficiency.
Although the benefits are evident, the application of VR in neurosurgery faces several limitations. The first practical challenge is the usability of VR systems that need to be adopted into the surgical environment and require a minimum technical proficiency [
35]. The development of robust VR software can be challenging and can require high-end computer systems with advanced graphics cards, high-resolution displays, and accurate tracking systems [
36,
37]. In addition, professionals from various fields need to cooperate when designing VR software for application in clinical settings. These factors may increase the costs and influence the economic feasibility of the widespread use of virtual reality technology in neurosurgery [
36]. Furthermore, neurosurgeons may be hesitant to adopt the proposed VR methodology because VR applications lack comprehensive technical standards [
34,
35]. Furthermore, this type of technology may cause the gradual shift in decision making in surgery from human surgeons to computers, which could create ethical issues related to the use of this technology [
34].
The above issues concerning VR surgery simulators are not as critical in relation to the current CFD-VR visualization method. On the one hand, due to the accelerating technology advances, low-cost and low-weight head-mounted displays and more powerful computer and graphics processors are available for rendering CFD three-dimensional images and animations. On the other hand, only CFD experts can work on CFD-VR visualization, so the costs of the current technology are reasonable. Additionally, the reliability of CFD-VR visualized data is completely dependent on the accuracy of CFD simulations, and there are several standard methods to prove the validity of the numerical simulations to neurosurgeons. Furthermore, while the real-time CFD simulation capability during the changing of geometry and flow conditions made by the surgeon has not been developed extensively, the final decision about the selection of devices and methods is made by the operating surgeon, not the computer. While the rendering of CFD data in a VR environment is not very time-consuming, the computation time of CFD simulations for some complicated cases is significant, but it can be reduced considerably (from several days to even some minutes) by high-performance computing.
5. Conclusions
CFD has been used as a powerful tool to study the effects of flow-diverters on aneurysm treatment and blood flow behavior in aneurysms before and after treatment. Because of the complicated nature of the intra-aneurysmal flow, the visualization of CFD data in the VR environment would be an efficient method to explore the performance of treatment devices and their positioning strategies. Therefore, we developed a straightforward method to visualize the CFD results in the VR environment. The blood flow in cerebral aneurysms without and with flow diverter stents was simulated numerically and visualized in the virtual reality environment using the proposed method. Several flow elements, including velocity vectors, contours, streamlines, particle tracers, and point clouds, were rendered and animated in the VR environment colored by node values. It was found from the CFD results that the flow diverters are thoroughly efficient devices to redirect the flow from aneurysms, but their efficiency completely depends on the placement of the stent. Additionally, the inflow and outflow locations and flow patterns changed due to stenting. The high-speed inflow jet impinging on the sac wall causes the untreated aneurysm to have high wall shear stresses on the distal neck and wall. The results also indicated that a small gap between the artery wall and stent can reduce the stent efficiency and even lead to higher kinetic energy inside the stented aneurysm in comparison to the untreated one.
All CFD results need to be visualized on several slices through the parent artery and aneurysm from different viewpoints; however, the animated CFD data in the VR environment reduce the high volume of data as needed to be displayed in traditional postprocessing methods because of the high degree of freedom of VR headsets. The VR-visualized results showed that, fully immersed in the 3D flow elements field, a viewer without any specific CFD knowledge is able to recognize the high-risk regions inside the vessel and evaluate the performance of FD stents in flow stagnation, as a consequence, facilitating thrombosis.
The findings of this research would provide surgeons with new insights into the applicability of treatment methods and also the proper placement of flow-diverter stents to obtain maximum efficacy.
In conclusion, the visualization in the VR environment offers nonexperts in CFD a fully immersive environment to interact with three-dimensional computer-generated objects productively without the issues of traditional postprocessing methods. Additionally considering the VR benefits and limitations, the advantages of using the proposed visualization method outweigh the disadvantages.


