Abstract
In this work, an experimental investigation of the nanomechanical properties of flame-formed carbonaceous particle layers has been performed for the first time by means of Atomic Force Microscopy (AFM). To this aim, carbon nanoparticles with different properties and nanostructures were produced in ethylene/air laminar premixed flames at different residence times. Particles were collected on mica substrates by means of a thermophoretic sampling system and then analyzed by AFM. An experimental procedure based on the combination between semi-contact AFM topography imaging, contact AFM topography imaging and AFM force spectroscopy has been implemented. More specifically, a preliminary topological characterization of the samples was first performed operating AFM in semi-contact mode and then tip-sample interaction forces were measured in contact spectroscopy mode. Finally, semi-contact mode was used to image the indented surface of the samples and to retrieve the projected area of indents. The hardness of investigated samples was obtained from the force–distance curves measured in spectroscopy mode and the images of intends acquired in semi-contact mode. Moreover, the Young’s modulus was measured by fitting the linear part of the retraction force curves using a model based on the Hertz theory. The extreme force sensitivity of this technique (down to nNewton) in addition to the small size of the probe makes it extremely suitable for performing investigation of mechanical properties of materials at the nanoscale. The experimental procedure was successfully tested on reference materials characterized by different plastic behavior, e.g., polyethylene naphthalate and highly oriented pyrolytic graphite. Both hardness and Young’s modulus values obtained from AFM measurements for different soot particle films were discussed.
1. Introduction
The modelling and experimental activities performed in the last decades to study the formation process of soot particles in combustion systems has led to substantial progresses [1,2]. Flame-generated particulate matter is rightly considered an environmental issue. Several studies have pointed out that ultra-fine combustion-formed particles are responsible for different adverse effects on human health [3,4]. Furthermore, soot particle emissions can lead to severe affection of the climate system [5]. On the other hand, a flame can be also seen as a reactor for the synthesis of engineered novel carbonaceous nanomaterials [2,6,7]. In light of the above, a deep understanding of the chemistry and the morphology of flame-formed carbon nanoparticles is required to control the synthesis of soot particles in flames for both the aforementioned objectives. Some of the properties that characterize soot particles and soot particle films have been already studied and analyzed, including particle size, morphology, carbon and nanostructure [8,9,10,11], optical and electronical features [6,12,13,14,15,16,17], surface properties and interaction forces [18,19,20]. However, very little is known about the mechanical properties, such as hardness and elastic modulus. Some theoretical and experimental works have been published [21,22,23], showing that the mechanical properties of different singlet carbon particles can provide an indication for the crosslinking and the carbonization degree [22,23]. The mechanical behavior and the physical nanostructure of soot particles also proved to be useful in understanding tribological effects, such as the enhanced wear of mating surfaces covered with soot particles [24]. This mechanism is particularly relevant in internal combustion engines which use soot-contaminated oil and lubricants [25] and it could be applied also for designing diesel particulate filters and their regeneration processes. Recently, the fabrication of coatings using flame-formed carbon nanoparticles has become very attractive as a novel approach for the synthesis of surfaces with enhanced properties. Nanostructured thin films of carbon nanoparticles from different flame synthesis reactor configurations are produced as water-repellent, superhydrophobic surfaces [26,27,28], electrode materials for supercapacitors [29] and hole extractor for perovskite solar cells [30]. The characterization of the mechanical properties provides novel information to tune and modify the synthesis process for realizing more robust, durable and stable soot particle films, as required for the aforementioned applications. Consequently, an experimental investigation of the mechanical properties of flame-formed soot nanoparticles collected as nanostructured films could be a useful addition to the literature, as well as a piece of work of great relevance from a material science point of view.
Several well-established techniques exist on the macro-scale and on the micro-scale to characterize the mechanical behavior of a given material. Particularly, the indentation technique allows measuring the mechanical properties by indenting the material, i.e., by pressing a probe at a defined force on the sample surface in order to deform it. Techniques with nanometric resolution are required to characterize and test nanosized and nanostructured materials [31]. To this aim, nanoindentation characterizations based on Atomic Force Microscopy (AFM) are becoming increasingly attractive. The most important advantages of AFM nanoindentation are the measurement of mechanical properties simultaneously with surface topography, the unique force sensitivity of the technique (down to nNewton) and the probe size in the order of nanometers, which are essential to perform indentation and molecular pulling experiments at the nanoscale [32,33,34].
In this paper, an experimental investigation of nanomechanical properties of flame-formed carbonaceous particles has been performed for the first time by means of AFM nanoindentation. The technique and the experimental protocol were first fine-tuned and implemented by analyzing the different plastic behavior of reference materials, e.g., polyethylene naphthalate and highly oriented pyrolytic graphite. Two different classes of soot particles were produced and thermophoretically collected from ethylene-air laminar premixed flames and preliminary characterized in terms of hardness, H, and Young’s modulus, E. This work represents a first attempt to overcome a lack of experimental information about the mechanical properties of soot layers and to furnish direct experimental measurements of hardness and elastic modulus of nanostructured films of flame-formed carbon particles.
2. Materials and Methods
Two different laminar premixed flames of ethylene and air operated at atmospheric pressure were used to produce films of carbon nanoparticles. The selected flame conditions and the sampling position are reported in Table 1. The flames were stabilized on a water-cooled McKenna burner, and the flame equivalence ratio Φ was changed in order to produce particles with different dimension, nanostructure and graphitization degree.

Table 1.
Investigated flame reactor parameters.
Particles were collected at a fixed sampling position, equal to 14 mm from the burner surface, using a thermophoretic sampling system. The system is made of a double-acting pneumatic cylinder equipped with a substrate holder mounted over a mobile extension. Particles were collected by thermophoresis, due to the temperature gradient generated between the hot gases and the cold substrate. The residence time of the substrate in flame was optimized and kept constant at 100 ms, while the number of insertions was varied according to the different soot concentration in the flames, and to provide enough material for the nanoindentation analysis.
The AFM instrument used in this study was a Scanning Probe Microscope NTEGRA Prima from NT-MDT operated at room temperature and 35% relative humidity. Etalon HA_HR_DCP diamond-coated probes were used, characterized by a 93 μm long diamond-coated cantilever with a nominal spring force constant Kc = 85 N/m and a nominal resonant frequency of 580 kHz.
Polyethylene naphthalate films (PEN, thickness 0.15 mm, Sigma Aldrich) and highly oriented pyrolytic graphite substrates (HOPG, thickness 2 mm, Sigma Aldrich) were used as reference materials.
3. Experimental Approach
The AFM was operated in force spectroscopy mode to perform the nanoindentation measurements. In AFM force measurements, the sample is mounted on a holder attached to the piezoelectric element of the instrument. By applying a voltage to the piezoelectric translator, the sample is moved up and down, and the resulting cantilever deflection is measured by the optical lever method as an electrical signal called DFL and recorded as a function of the piezo displacement [35]. The cantilever deflection, δc, can be then obtained dividing the DFL signal by the photodetector sensitivity, which is derived from the slope of the curve in the hard repulsive contact region obtained using cleaved muscovite mica as a hard material [36]. Knowing the cantilever spring constant Kc, the interaction force F acting between the probe and the sample can be simply obtained from Hooke’s law as:
Considering that the deflection of the cantilever is always very small, it can be considered as an ideal spring. The cantilever spring constant was calculated from the geometrical beam theory by measuring the resonant frequency and neglecting the diamond coating [37,38]. For the tips used in this study, Kc was measured to be equal to 95 ± 5 N/m.
The force–distance curves are the source of information related to the mechanical characteristics of the sample [31,39]. A typical interactive force–distance curve measured on a PEN film is reported in Figure 1. The curve is divided into an approach and a retraction part. Initially, the distance between tip and surface is large enough to have no measurable interaction, the cantilever is not deflected and only the physical separation changes as the probe is moved (point A in Figure 1). As the sample approaches the tip, an instability called “Jump-to-contact” occurs and the cantilever undergoes a rapid deflection when the force gradient exceeds the spring constant (point B in Figure 1). The straight line after this point is referred to as the contact line. If the cantilever stiffness exceeds the sample stiffness, as the translator moves further the tip acts as an indenter and causes a deformation (point C in Figure 1). Hence, information about the mechanical properties of the sample can be deduced. Subsequently, the sample surface is retracted from the probe (point D in Figure 1), the adhesive forces hold the probe to the sample until the spring constant overcomes the force gradient, and the “Pull-off” instability occurs (point E in Figure 1). The adhesive force, Fadh, can be measured from the cantilever deflection at the “Pull-off” as shown in Figure 1.
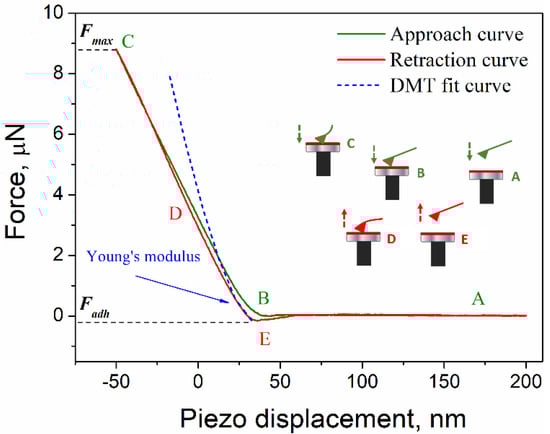
Figure 1.
A typical force–distance curve measured on PEN during approach (green line) and retract (red line) of AFM probe to and from the sample surface.
The hardness of the sample was calculated from the maximum applied load Fmax, derived from the force–distance curve, and the projected area of the intend AP, derived from AFM topographic images, according to Equation (2):
A continuum elastic theory can then be used to further derive mechanical properties of the sample. The most popular models are based on the Hertz theory, which assumes the tip to be a sphere or a paraboloid indenting a semi-infinite plane and neglects adhesion forces [40,41]. In this study, the Derjaguin–Müller–Toporov (DMT) model has been used to fit the elastic part of the contact line in the retraction force curves [42,43]. The DMT model is a variation of the Hertz model that also takes into account adhesion forces [44], according to Equation (3):
where F is the applied force, R is the tip radius, d0 is the initial probe–surface contact point, (d − d0) is the deformation value at a given force, Fadh the maximum adhesion force and E* is the effective elastic modulus. R was set as the curvature radius of the probe, estimated from calibration measurements performed using a calibration grating TGT1 from NT-MDT. The effective elastic modulus E* is defined as:
Esample, υsample and Etip, υtip being the Young’s modulus and the Poisson ratio of the sample and the tip, respectively. For the diamond-coated probes used in this study, constant values Etip = 1140 GPa and υtip= 0.07 have been used [45]. The Young’s modulus of the sample Esample is derived from the fitting analysis performed at low loading force stages of the retraction curve (see Figure 1), that correspond to the elastic regime. The DMT model assumes a full elastic response from the sample as well as any Hertz theory-based model [38,42,43,44].
The following experimental procedure was set up to perform the nanoindentation measurements. First, the sample surface was scanned in AFM contact mode to acquire topographic images over an area of 5 × 5 μm2. To avoid damages and alteration of the investigated surface during the scanning, a set-point value for the approach of the probe to the sample was chosen to have a low magnitude of interaction between the tip and the surface. Thereafter, four different force–distance curves were recorded in force spectroscopy mode over a 2 × 2 grid of points whose center corresponds to the center of a preselected 1 × 1 μm2 area inside the 5 × 5 μm2 area scanned in contact mode. Finally, the same area was scanned in AFM semi-contact mode to locate the exact position of the four indents, which are then imaged over 1 × 1 μm2 areas to acquire images with the highest resolution. The value of projected area AP for any of the intends is calculated from the semi-contact AFM images using the indentation analysis function of the free SPM data analysis software Gwyddion [38,46]. The procedure was then repeated in different areas of the sample, to obtain at least 20 different force–distance curves and intends, and hence at least 20 values of hardness and Young’s modulus for any sample.
4. Results and Discussion
The implemented experimental procedure was preliminary tested by measuring the mechanical properties of reference materials. PEN substates were chosen as a medium soft material. Figure 2a shows a semi-contact AFM image of an indent caused during indentation measurements by the tip on the PEN surface. Figure 2b shows the same image cropped and analyzed with the Gwyddion software, where the indent was overlaid with a red mask used to calculate the projected area. The mean value of projected area of the intend resulted AP ≈ 14,000 ± 500 nm2.
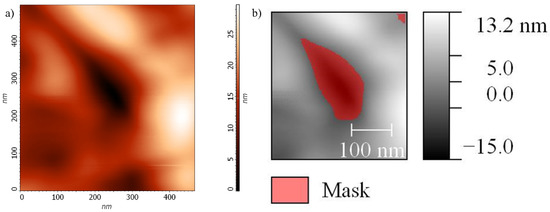
Figure 2.
Semi-contact AFM image of an indent on PEN surface (a); same image as in the upper panel after cropping and analysis with the software Gwyddion (b).
From several force–distance curves acquired on different locations of the sample and using a Poisson ratio υsample = 0.3 [47], the mean mechanical properties of PEN were measured to be equal to H = 0.70 ± 0.05 GPa and E = 3.8 ± 0.3 GPa, in quite good agreement with values reported in the literature [48].
HOPG is a high purity graphitic structure and can be considered as a reference in the analysis of the properties of soot particles. Figure 3 shows a semi-contact AFM image of an indent on the HOPG surface (Figure 3a) and the same image cropped and analyzed with the Gwyddion software (Figure 3b). The hardness measured on HOPG samples by AFM from the mean projected area, AP ≈ 18,000 ± 700 nm2, was found H = 2.40 ± 0.10 GPa. This value is in good agreement with previously reported measurements performed on HOPG [21,44,49]. Instead, the analysis of the retraction curves with the DMT model using a Poisson ratio υsample = 0.2 [44] resulted in an underestimation of the Young’s modulus. The mean measured by Young’s modulus was E = 7.5 ± 0.3 GPa, significantly lower than the reported values E = 15–20 GPa [44,50]. This difference is possibly due to the experimental set-up. The tip used in this study is characterized by a spring constant which has proved to be suitable for measuring the elastic modulus, as well as the hardness, on medium-soft samples (E < 10 GPa). On the other hand, the spring constant of the cantilever is likely too low to properly perform an elastic deformation at small indentation depths on a medium-hard sample such as HOPG (E > 10 GPa), thus affecting the accuracy of the calculation of the Young’s modulus from the retraction force–distance curve using the DMT model. This deviation could likely be corrected by using a cantilever with a higher spring constant (Kc > 100 N/m) on such a hard sample.
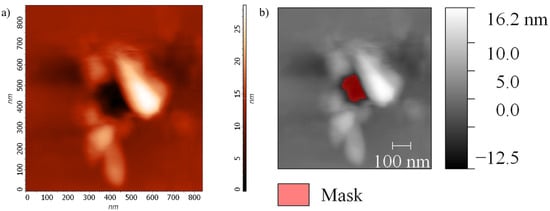
Figure 3.
Semi-contact AFM image of an indent on HOPG surface (a); same image as in the upper panel after cropping and analysis with the software Gwyddion (b).
We now shift our attention to flame-formed carbon nanoparticle samples. Sample #1 films were produced in flame conditions characterized by a bimodal particle size distribution with a first particle mode of 2–4 nm and a second mode of 12–15 nm [51]. Sample #2 films were produced in flame conditions in which >10 nm soot particles and aggregates are mainly produced and characterized by a higher graphitization degree compared to Sample #1 particles [6,18]. The two samples for indentation measurements were collected by thermophoretic sampling inserting the substrate in the flame 100 times (Sample #1) and 25 times (Sample #2), with a fixed residence time of 100 min. The thermophoretic sampling procedure was already used to synthesize nanostructured films of carbon nanoparticles in similar flame reactors [6,52]. The thicknesses of the two samples were estimated using a model for the calculation of the particle film growth rate based on the thermophoretic velocity previously developed [52,53] and found to be 100 ± 25 nm for Sample #1 and 200 ± 25 nm for Sample #2.
In this study, the procedure and the total sampling times were chosen to produce thick nanoparticle films covering the whole substrate, so avoiding any interaction between the AFM tip and the mica muscovite substrate that may affect the nanoindentation measurement of the samples. Moreover, for PEN, HOPG and soot particle films the area indented by an indenter of 50–100 nm radius may be considered as a semi-infinite space and so the hardness and Young’s modulus values may be assumed to be correct. On the other hand, this is not possible for a single particle with a dimension in the same order of magnitude of the tip radius, or even lower [21]. Moreover, the imaging of a nano-indent performed on a single nanoparticle is quite hard to perform. It is worth underlining that nanoindentation measurements on single soot particles have been performed and reported, but for the reasons listed above they could not be taken with full confidence on an absolute scale [21].
Figure 4 reports typical force–distance curves measured on Sample #1 and on Sample #2. It is possible to observe that at a given deformation the maximum load applied to Sample #2 is higher than that of Sample #1. The adhesion forces measured for both samples are in the order of 0.2 ± 0.01 μN.
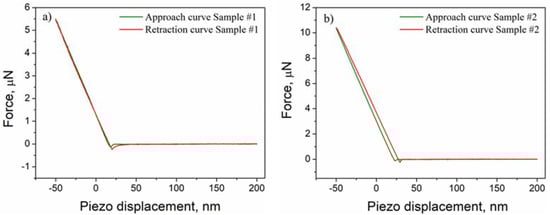
Figure 4.
Force–distance curves measured during approach (green line) and retract (red line) on Sample #1 (a) and on Sample #2 (b).
Figure 5 and Figure 6 show semi-contact AFM images of an indent on Sample #1 surface (Figure 5a) and Sample #2 surface (Figure 6a), as well as the same images analyzed with the Gwyddion software and marked with a red mask used to calculate the projected area (Figure 5b and Figure 6b). The projected areas of the intend resulted in AP ≈ 10,000 ± 500 nm2 for Sample #1 and AP ≈ 11,000 ± 500 nm2 for Sample #2.
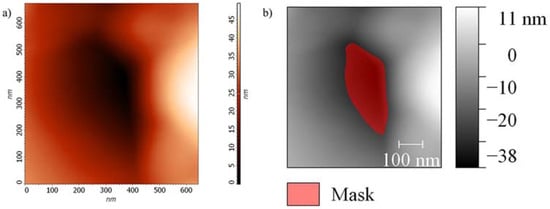
Figure 5.
Semi-contact AFM image of an indent on Sample #1 surface (a); same image as in the upper panel after cropping and analysis with the software Gwyddion (b).
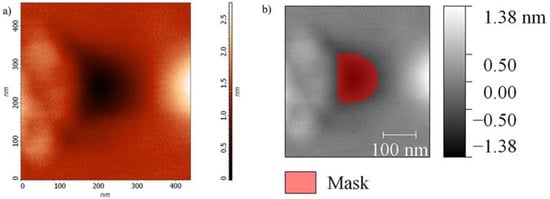
Figure 6.
Semi-contact AFM image of an indent on Sample #2 surface (a); same image as in the upper panel after cropping and analysis with the software Gwyddion (b).
The results of nanoindentation measurements are reported in Table 2. The mean values of hardness measured from the maximum load and the intend area were H = 0.75 ± 0.05 GPa for Sample #1 and H = 0.9 ± 0.05 GPa for Sample #2. The analysis of the retraction curves with the DMT fit model reported a mean Young’s modulus E = 4.2 ± 0.3 GPa for Sample #1 and E = 7.2 ± 0.4 GPa for Sample #2. The same Poisson ratio υsample = 0.3 as for HOPG was used.
Table 2.
Hardness and Young’s modulus measured by AFM nanoindentation on Sample #1 and Sample #2 and compared to PEN and HOPG. Errors are reported as the mean standard deviation from >20 independent measurements.
Both Sample #1 and Sample #2 films showed lower hardness and Young’s modulus compared to HOPG. This could be explained looking at the structure of particle films. Soot nanostructured films are composed by nanoscale grains which can be considered as the basic units of the film and they are packed together in a porous structure with a void fraction in the order of 80% [52]. So, the deformation of particle films measured by indentation is likely governed by inter-grain mechanisms, such as the motion and the slippage of particles and grains between them or on the substrate, rather than intra-grain slippage and motion along the basal plane of the graphitic nano crystallites that compose soot particles. The difference in hardness and Young’s modulus measured between the two samples can be related to the different properties of the nanograins that compose the two films in terms of internal nanostructure, dimension and aggregation degree of pristine particle, as well as agglomeration of particles in the nanograins during the deposition process.
5. Conclusions
The nanomechanical properties of nanostructured films made of flame-formed carbonaceous particles have been investigated for the first time by means of Atomic Force Microscopy nanoindentation. More specifically, the hardness H was obtained from the force–distance curves measured in spectroscopy modes and the images of intends acquired in semi-contact mode, while the Young’s modulus E was measured by fitting the linear part of the retraction force curves using a DMT model based on Hertz theory. The experimental procedure was tested on PEN films, a medium soft material, and HOPG, a medium hard material used as a reference in the analysis of soot particle properties. Two different samples of soot particle layers were analyzed: Sample #1 films, produced in flame conditions characterized by a bimodal particle size distribution with a first particle mode of 2–4 nm and a second mode of 12–15 nm; Sample #2 films, produced in flame conditions in which >10 nm soot particles and aggregates are mainly produced and characterized by a higher graphitization degree compared to Sample #1 particles. Both Sample #1 and Sample #2 films showed lower hardness and Young’s modulus compared to HOPG, suggesting that the deformation of particle films measured by indentation is likely governed by inter-grain mechanisms. Sample #2 is characterized by a higher hardness and a higher Young’s modulus and the differences can be related to the different properties of the nanograins that composes the two films and to the agglomeration of particles in the nanograins during the deposition process. Future works will be devoted to improving the experimental technique with the aim to investigate the nanomechanical properties of nanostructured films made of different soot particles, as well as to understand whether the technique could be applied also to singlet soot particles.
Author Contributions
Conceptualization, G.D.F., M.C., P.M. and A.D.; methodology, G.D.F. and F.C.; investigation, G.D.F. and F.C.; writing—original draft preparation, G.D.F.; writing—review and editing, G.D.F., M.C., P.M. and A.D.; project administration, G.D.F., M.C., P.M. and A.D. All authors have read and agreed to the published version of the manuscript.
Funding
This research was funded by “Ministero dell’Istruzione, dell’Università e della Ricerca”, grant number: PRIN project 2017PJ5XXX “MAGIC DUST”.
Institutional Review Board Statement
Not applicable.
Informed Consent Statement
Not applicable.
Data Availability Statement
The data presented in this study are available on request from the corresponding author.
Conflicts of Interest
The authors declare no conflict of interest.
References
- D’Anna, A. Combustion-formed nanoparticles. Proc. Combust. Inst. 2009, 32, 593–613. [Google Scholar] [CrossRef]
- Wang, H. Formation of nascent soot and other condensed-phase materials in flames. Proc. Combust. Inst. 2011, 33, 41–67. [Google Scholar] [CrossRef]
- Davidson, C.I.; Phalen, R.F.; Solomon, P.A. Airborne particulate matter and human health: A review. Aerosol. Sci. Technol. 2005, 39, 737–749. [Google Scholar] [CrossRef]
- Colarusso, C.; De Falco, G.; Terlizzi, M.; Roviezzo, F.; Cerqua, I.; Sirignano, M.; Cirino, G.; Aquino, R.P.; Pinto, A.; D’Anna, A.; et al. The Inhibition of Caspase-1- Does Not Revert Particulate Matter (PM)-Induced Lung Immunesuppression in Mice. Front. Immunol. 2019, 10, 1329. [Google Scholar] [CrossRef] [Green Version]
- Bond, T.C.; Doherty, S.J.; Fahey, D.W.; Forster, P.M.; Berntsen, T.; DeAngelo, B.J.; Flanner, M.G.; Ghan, S.; Karcher, B.; Koch, D.; et al. Bounding the role of black carbon in the climate system: A scientific assessment. J. Geophys. Res. Atmos. 2013, 118, 5380–5552. [Google Scholar] [CrossRef]
- De Falco, G.; Commodo, M.; Bonavolontà, C.; Pepe, G.P.; Minutolo, P.; D’Anna, A. Optical and electrical characterization of carbon nanoparticles produced in laminar premixed flames. Combust. Flame 2014, 161, 3201–3210. [Google Scholar] [CrossRef]
- Li, S.; Rena, Y.; Biswas, P.; Tse, S.D. Flame aerosol synthesis of nanostructured materials and functional devices: Processing, modeling, and diagnostics. Prog. Energy Combust. Sci. 2016, 55, 1–59. [Google Scholar] [CrossRef] [Green Version]
- Vander Wal, R.L.; Tomasek, A.J. Soot nanostructure: Dependence upon synthesis conditions. Combust. Flame 2004, 136, 129–140. [Google Scholar] [CrossRef]
- Kholghy, M.; Saffaripour, M.; Yip, C.; Thomson, M.J. The evolution of soot morphology in a laminar coflow diffusion flame of a surrogate for Jet A-1. Combust. Flame 2013, 160, 2119–2130. [Google Scholar] [CrossRef]
- Schenk, M.; Lieb, S.; Vieker, H.; Beyer, A.; Gölzhäuser, A.; Wang, H.; Kohse-Höinghaus, K. Morphology of nascent soot in ethylene flames. Proc. Combust. Inst. 2015, 35, 1879–1886. [Google Scholar] [CrossRef]
- Commodo, M.; Kaiser, K.; De Falco, G.; Minutolo, P.; Schulz, F.; D’Anna, A.; Gross, L. On the early stages of soot formation: Molecular structure elucidation by high-resolution atomic force microscopy. Combust. Flame 2019, 205, 154–164. [Google Scholar] [CrossRef]
- Minutolo, P.; Gambi, G.; D’Alessio, A. The optical band gap model in the interpretation of the UV-visible absorption spectra of rich premixed flames. Symp. (Int.) Combust. 1996, 26, 951–957. [Google Scholar] [CrossRef]
- Miller, J.H.; Herdman, J.D.; Green, C.D.O.; Webster, E.M. Experimental and computational determinations of optical band gaps for PAH and soot in a N2-diluted, ethylene/air non-premixed flame. Proc. Combust. Inst. 2013, 34, 3669–3675. [Google Scholar] [CrossRef]
- Desgroux, P.; Mercier, X.; Thomson, K.A. Study of the formation of soot and its precursors in flames using optical diagnostics. Proc. Combust. Inst. 2013, 34, 1713–1738. [Google Scholar] [CrossRef]
- Liu, C.; Singh, A.V.; Saggese, C.; Tang, Q.; Chen, D.; Wan, K.; Vinciguerra, M.; Commodo, M.; De Falco, G.; Minutolo, P.; et al. Flame-formed carbon nanoparticles exhibit quantum dot behaviors. Proc. Natl. Acad. Sci. USA 2019, 116, 12692–12697. [Google Scholar] [CrossRef] [Green Version]
- De Falco, G.; Mattielo, G.; Commodo, M.; Minutolo, P.; Shi, X.; D’Anna, A.; Wang, H. Electronic band gap of flame-formed carbon nanoparticles by scanning tunneling spectroscopy. Proc. Combust. Inst. 2021, 38, 1805–1812. [Google Scholar] [CrossRef]
- Liu, Y.; Song, C.; Lv, G.; Zhang, W.; Chen, H. Evaluation of the oxidative reactivity and electrical properties of soot particles. Carbon 2021, 178, 37–47. [Google Scholar] [CrossRef]
- De Falco, G.; Commodo, M.; Minutolo, P.; D’Anna, A. Flame-formed carbon nanoparticles: Morphology, interaction forces, and hamaker constant from AFM. Aerosol Sci. Technol. 2015, 49, 281–289. [Google Scholar] [CrossRef] [Green Version]
- Commodo, M.; De Falco, G.; Larciprete, R.; D’Anna, A.; Minutolo, P. On the hydrophilic/hydrophobic character of carbonaceous nanoparticles formed in laminar premixed flames. Exp. Therm. Fluid Sci. 2016, 73, 56–63. [Google Scholar] [CrossRef]
- Bowal, K.; Pascazio, L.; Wang, H.; Chen, D.; Kraft, M. Surface properties of heterogeneous polycyclic aromatic hydrocarbon clusters. Proc. Combust. Inst. 2021, 38, 1115–1123. [Google Scholar] [CrossRef]
- Bhowmick, H.; Biswas, S.K. Relationship between physical structure and tribology of single soot particles generated by burning ethylene. Tribol. Lett. 2011, 44, 139–149. [Google Scholar] [CrossRef]
- Pascazio, L.; Martin, J.W.; Bowal, K.; Akroyd, J.; Kraft, M. Exploring the internal structure of soot particles using nanoindentation: A reactive molecular dynamics study. Combust. Flame 2020, 219, 45–56. [Google Scholar] [CrossRef]
- Pascazio, L.; Martin, J.W.; Botero, M.L.; Sirignano, M.; D’Anna, A.; Kraft, M. Mechanical Properties of Soot Particles: The Impact of Crosslinked Polycyclic Aromatic Hydrocarbons. Combust. Sci. Technol. 2021, 193, 643–663. [Google Scholar] [CrossRef] [Green Version]
- Antusch, S.; Dienwiebel, M.; Nold, E.; Albers, P.; Spicher, U.; Scherge, M. On the tribochemical action of engine soot. Wear 2010, 269, 1–12. [Google Scholar] [CrossRef]
- Green, D.A.; Lewis, R.; Dwyer-Joyce, R.S. Wear effects and mechanisms of soot-contaminated automotive lubricants. Proc. Inst. Mech. Eng. J. 2006, 220, 159–169. [Google Scholar] [CrossRef] [Green Version]
- Naha, S.; Sen, S.; Puri, I.K. Flame synthesis of superhydrophobic amorphous carbon surfaces. Carbon 2007, 45, 1696–1716. [Google Scholar] [CrossRef]
- Esmeryana, K.D.; Castano, C.E.; Bressler, A.H.; Abolghasemibizaki, M.; Mohammadi, R. Rapid synthesis of inherently robust and stable superhydrophobic carbon soot coatings. Appl. Surf. Sci. 2016, 369, 341–347. [Google Scholar] [CrossRef]
- Li, X.; Shi, H.; Wang, Y.; Wang, H.; Huang, J.; Duan, M. Liquid marbles from soot films. Soft Matter 2020, 16, 4512–4519. [Google Scholar] [CrossRef] [PubMed]
- Zhang, B.; Wang, D.; Yu, B.; Zhou, F.; Liu, W. Candle soot as a supercapacitor electrode material. RSC Adv. 2014, 4, 2586–2589. [Google Scholar] [CrossRef]
- Wei, Z.; Yan, K.; Chen, H.; Yi, Y.; Zhang, T.; Long, X.; Li, J.; Zhang, L.; Wang, J.; Yang, S. Cost efficient clamping solar cells using candle soot for hole extraction from ambipolar perovskites. Energy Environ. Sci. 2014, 7, 3326–3333. [Google Scholar] [CrossRef]
- Griepentrog, M.; Krämer, G.; Cappella, B. Comparison of nanoindentation and AFM methods for the determination of mechanical properties of polymers. Polym. Test. 2013, 32, 455–460. [Google Scholar] [CrossRef]
- Burnham, N.A.; Colton, R.J. Measuring the nanomechanical properties and surface forces of materials using an atomic force microscope. J. Vac. Sci. Technol. 1989, 7, 2906. [Google Scholar] [CrossRef]
- Bhushan, B.; Koinkar, V.N. Nanoindentation hardness measurements using atomic force microscopy. Appl. Phys. Lett. 1994, 64, 1653. [Google Scholar] [CrossRef]
- Rabe, U.; Amelio, S.; Hirsekorn, M.K.-M.S.; Kempf, M.; Göken, M.; Arnold, W. Imaging and measurement of local mechanical material properties by atomic force acoustic microscopy. Surf. Interface Anal. 2002, 33, 65–70. [Google Scholar] [CrossRef]
- Butt, H.J.; Cappella, B.; Kappl, M. Force measurements with the atomic force microscope: Technique, interpretation and applications. Surf. Sci. Rep. 2005, 59, 1–152. [Google Scholar] [CrossRef] [Green Version]
- Touhami, A.; Nysten, B.; Dufre, Y.F. Nanoscale Mapping of the Elasticity of Microbial Cells by Atomic Force Microscopy. Langmuir 2003, 19, 4539–4543. [Google Scholar] [CrossRef]
- Poggi, M.A.; McFarland, A.W.; Colton, J.S.; Bottomley, L.A. A method for calculating the spring constant of atomic force microscopy cantilevers with a nonrectangular cross section. Anal. Chem. 2005, 77, 1192–1195. [Google Scholar] [CrossRef] [PubMed]
- Caron, A. Quantitative hardness measurement by instrumented AFM-indentation. J. Vis. Exp. 2016, 117, e54706. [Google Scholar] [CrossRef] [PubMed]
- Ovchinnikov, I.S.; Vishnevskiy, A.S.; Seregin, D.S.; Rezvanov, A.A.; Schneider, D.; Sigov, A.S.; Vorotilov, K.A.; Baklanov, M.R. Evaluation of mechanical properties of porous OSG films by PFQNM AFM and benchmarking with traditional instrumentation. Langmuir 2020, 36, 9377–9387. [Google Scholar] [CrossRef]
- Dimitriadis, E.K.; Horkay, F.; Maresca, J.; Kachar, B.; Chadwick, R.S. Determination of elastic moduli of thin layers of soft material using the atomic force microscope. Biophys. J. 2002, 82, 2798–2810. [Google Scholar] [CrossRef] [Green Version]
- Wang, L.G.; Li, Z.; Zhang, L.; Zhou, R.; Chen, X. On the measurement of particle contact curvature and Young’s modulus using X-ray μCT. Appl. Sci. 2021, 11, 1752. [Google Scholar] [CrossRef]
- Morales-Rivas, L.; González-Orive, A.; Garcia-Mateo, C.; Hernández-Creus, A.; Caballero, F.G.; Vázquez, L. Nanomechanical characterization of nanostructured bainitic steel: Peak force microscopy and nanoindentation with AFM. Sci. Rep. 2015, 5, 17164. [Google Scholar] [CrossRef] [Green Version]
- Liu, Y.; Sokolov, I.; Dokukin, M.E.; Xiong, Y.; Peng, P. Can AFM be used to measure absolute values of Young’s modulus of nanocomposite materials down to the nanoscale? Nanoscale 2020, 12, 12432–12443. [Google Scholar] [CrossRef]
- Zeng, G.; Dirscherl, K.; Garnæs, J. Toward accurate quantitative elasticity mapping of rigid nanomaterials by atomic force microscopy: Effect of acquisition frequency, loading force, and tip geometry. Nanomaterials 2018, 8, 616. [Google Scholar] [CrossRef] [PubMed] [Green Version]
- Bhushan, B.; Kulkarni, A.V. Effect of normal load on microscale friction measurements. Thin Solid Film. 1996, 278, 49–56. [Google Scholar] [CrossRef]
- Nečas, D.; Klapetek, P. Gwyddion: An open-source software for SPM data analysis. Cent. Eur. J. Phys. 2012, 10, 181–188. [Google Scholar] [CrossRef]
- Ma, T.; Bhushan, B. A novel technique to measure the poisson’s ratio and submicron lateral dimensional changes of ultrathin polymeric films. Rev. Sci. Instr. 2002, 73, 1813. [Google Scholar] [CrossRef]
- Sierros, K.A.; Cairns, D.R.; Abell, J.S.; Kukureka, S.N. Pulsed laser deposition of indium tin oxide films on flexible polyethylene naphthalate display substrates at room temperature. Thin Solid Film. 2010, 518, 2623–2627. [Google Scholar] [CrossRef]
- Xiao, J.; Zhang, L.; Zhou, K.; Li, J.; Xie, X.; Li, Z. Anisotropic friction behaviour of highly oriented pyrolytic graphite. Carbon 2013, 65, 53–62. [Google Scholar] [CrossRef]
- Oliver, W.C.; Pharr, G.M. An improved technique for determining hardness and elastic modulus using load and displacement sensing indentation experiments. J. Mater. Res. 1992, 7, 1564–1583. [Google Scholar] [CrossRef]
- Vitiello, G.; De Falco, G.; Picca, F.; Commodo, M.; D’Errico, G.; Minutolo, P.; D’Anna, A. Role of radicals in carbon clustering and soot inception: A combined EPR and Raman spectroscopic study. Combust. Flame 2019, 205, 286–294. [Google Scholar] [CrossRef]
- De Falco, G.; Commodo, M.; Barra, M.; Chiarella, F.; D’Errico, G.; D’Anna, A.; Aloisio, A.; Cassinese, A.; Minutolo, P. Electrical characterization of flame-soot nanoparticle thin films. Synt. Met. 2017, 229, 89–99. [Google Scholar] [CrossRef]
- Madler, L.; Roessler, A.; Pratsinis, S.E.; Sahmb, T.; Gurlo, A.; Barsan, N.; Weimar, U. Direct formation of highly porous gas-sensing films by in situ thermophoretic deposition of flame-made Pt/SnO2 nanoparticles. Sens. Actuators B 2006, 114, 283–295. [Google Scholar] [CrossRef]
Publisher’s Note: MDPI stays neutral with regard to jurisdictional claims in published maps and institutional affiliations. |
© 2021 by the authors. Licensee MDPI, Basel, Switzerland. This article is an open access article distributed under the terms and conditions of the Creative Commons Attribution (CC BY) license (https://creativecommons.org/licenses/by/4.0/).