Article

Positive Effects of Highly Graphitized Porous Carbon Loaded with PbO on Cycle Performance of Negative Plates of Lead-Acid Batteries

Collaborative Innovation Center of Sustainable Energy Materials, Guangxi Key Laboratory of Electrochemical Energy Materials, School of Physical Science and Technology, Guangxi University, Nanning 530004, China
*
Author to whom correspondence should be addressed.
Appl. Sci. 2021, 11(18), 8469; https://doi.org/10.3390/app11188469
Submission received: 17 August 2021 / Revised: 3 September 2021 / Accepted: 6 September 2021 / Published: 13 September 2021

Abstract

:
Carbon materials are one of the most important additives used in lead-acid batteries (LABs) to solve irreversible sulfation. Being the next generation additive for LABs, they exhibit more excellent performance. The addition of carbon materials to negative active material (NAM) is used to enhance the performance of batteries. In this paper, the composite of lead oxide and carbon (LC) was prepared by the pyrolysis of a mixture of highly graphitized porous carbon (HPC) and PbCO3. Compared with the control cell, the initial specific discharge capacity was increased by 16.5% when LC material was added to NAM. Finally, a possible mechanism for the improvement of the cycle performance of LC cell was proposed. The adoption of LC material can eliminate the difference in density between Pb and C, and thus make them evenly mixed. The uniformly dispersed HPC can promote electrolyte circulation and effectively limit the overgrowth of irreversible PbSO4. At the same time, the presence of -Pb-COO chemical bond can strengthen the stability of lead-carbon electrodes.

1. Introduction

The urbanization of human society has led to a gradual but consistent rise in global warming [1]. The global temperature is expected to rise by 6.5 °C in 100 years, if mitigating actions are not taken [2]. Consequently, the need for more sustainable and environmentally friendly means of generating electricity via the use of solar energy and wind has become the focus of most researchers, and the society at large. As the generation of renewable energy is intermittent, in order to ensure the sustainability of supply, the application of energy storage batteries is a necessary option [3]. There are many kinds of energy storage cells, but lead-acid batteries (LABs) account for a huge proportion of them [4]. Compared with lithium batteries, nickel-metal hydride batteries, and so on. LABs are expected to gain a larger market share due to their low cost, high recovery rate, and high safety [5,6,7,8]. Compared with iron-based batteries, LABs are better in terms of potential. Table S1 shows the breakdown of the different energy storage cells, such as storage capacity cost, lifetime, and so on [3,9,10]. However, LABs also have non-negligible disadvantages, such as very low actual specific energy and short cycle life, which significantly restricts the applicability of LABs.
PbSO4 particles of the negative plates of the drained-out LABs cannot be converted to Pb particles even being recharged due to the irreversible sulfation, which is the primary failure reason of the LABs [11]. The PbSO4 particles located on the surface of the negative plates are coarser than those inside the negative plates. Therefore, the reaction is considered to occur mainly on the surface of the plates [12]. In this situation, the batteries would drain out at an early stage due to the impeded transfer of electrons and the inadequate utilization of the active materials.
Currently, diverse carbon materials are added to suppress the sulfation of the negative plates, such as carbon black [13,14,15], graphite [16,17], activated carbon [18,19,20], carbon nanotubes [21,22], and graphene [23,24,25], which turns out to be an effective solution. The effect of the addition of carbon materials into LABs was studied by Pavlov et al., indicating that the additive is available to reduce the average pore size of negative active material (NAM). This could inhibit the coarseness of PbSO4 particles [26]. Furthermore, with high conductivity, carbon additives are able to improve the conductivity of the plates [27] and further boost the whole cycle process [28]. The characteristics of large specific surface area, good electrical conductivity, and excellent electrochemical performance, make porous carbon the most special additive with great advantages and potential [29].
However, the biggest disadvantage is that the addition of porous carbon may result in poor contact between the lead particles and the carbon [30]. The advantages of porous carbon could not be given full application due to the undermixing caused by poor adhesion to lead particles. Meanwhile, the addition of carbon materials might also reduce the hydrogen evolution overpotential of the lead-carbon electrodes. This will intensify the hydrogen evolution reaction in the cells [31]. Therefore, no effective improvement of the cycle performance of the batteries is available.
In this paper, a method for the pyrolysis of the mixture of highly graphitized porous carbon (HPC) and PbCO3 was employed to prepare the lead oxide and carbon (LC) material. The method is able to achieve more uniform mixing of HPC in NAM. The LC material cost is about USD 2.4/g. Table S2 shows the estimated price of the reagents needed to prepare the material. X-ray diffraction (XRD), scanning electron microscopy (SEM) and X-ray photoelectron spectroscopy (XPS) analysis were conducted for material characterization. The performance of the manually assembled 2 V lead-carbon batteries was tested at 1 C, and the NAM was studied by using SEM. Based on the results, the LC composite can eliminate the difference in density, make the HPC evenly dispersed in the NAM, and build an excellent conductive network. An excellent conductive network could inhibit the irreversible growth of PbSO4. At the same time, the -Pb-COO chemical bond can make the lead-carbon electrode extremely stable, and thus, improving the performance of the cells.

2. Experimental

2.1. Materials

A unique method invented by our research group was employed for the preparation of HPC. The contents for negative plates additives are shown in Table S3. The commercial cell was classified into the control cell to ensure the reasonability of the experimental design. The carbon material in the negative plate of the commercial cell is carbon black (CB), and its price is USD 0.4/g.

2.2. Preparation of Materials

Preparation of HPC: HCl solution of 500 mL, 3 mol L−1 was used to remove the impurities of acrylic cation exchange resins (CERs). Then, it was soaked in 0.05 mol L−1 nickel acetate solution. The sample was washed and dried. The resulting product was added to the 400 mL ethanol solution that dissolved 40 g KOH. The solid mixture was put into a tubular furnace. The temperature was heightened to 850 °C at N2 atmosphere, and then it was held for 2 h. The pyrolyzed product was stirred in 3 mol L−1 HCl solution. It was finally washed and dried to obtain HPC.
The pyrolysis method for the preparation of LC: In total, 600 mg HPC, 379.3 mg PbC4H6O4·3H2O and 105.9 mg Na2CO3 were added to the 100 mL deionized water. Then 100 mL of 1 g L−1 hexadecyl trimethyl ammonium bromide solution (CTAB) was slowly added to the above solution. It was stirred, vacuum-filtered, washed many times and dried. The resulted product was LC precursor. It was put into a tubular furnace. The temperature was heightened to 500 °C at N2 atmosphere, and then it was cooled down after the temperature was held for 1 h. The schematic illustration of the procedure is shown in Figure S1.
Preparation of PLC: In total, 600 mg HPC and 223.2 mg lead oxide powder were added to the 100 mL deionized water. Then, it was stirred and dried.

2.3. Electrochemical Test

In view of the importance of the electrochemical performance of the batteries, we implemented electrochemical impedance spectroscopy (EIS) measurement to the batteries by using the electrochemical test station with the settings of amplitude voltage of 5 mV and frequency range of 100 kHz~0.1 Hz. This test employs a two-electrode system.
CV and LSV tests were carried out on the formed negative plate with the same instrument, but both tests adopted a three-electrode system. The electrolyte of the three-electrode system is 1.28 g mL−1 (mass fraction 37.4%) diluted sulfuric acid solution. The formed negative plate was used as the working electrode, and the formed positive plate (size: 70 mm × 40 mm × 1.5 mm) was used as the counter electrode. The Hg/Hg2SO4 electrode was used as the reference electrode. The scanning speed of CV is 5 mV s−1, and the testing voltage ranges from −0.3 to −1.5 V. The scanning speed of LSV is 1 mV s−1, and the testing voltage range from −0.3 to −1.5 V.

2.4. Physical Characterization

Transmission electron microscopy (TEM, FEI Company Titan ETEM G2 80-300, Pittsburgh, PA, USA), Scanning electron microscope (SEM, Hitachi SU8200, Tokyo, Japan) and X-ray diffraction (XRD, SMARTLAB3KW, Tokyo, Japan) were employed to analyze the microscopic appearance. XRD with Cu Kα radiation was operated at the scan rate of 10 ° min−1. The LC material and chemical bonds were verified by X-ray photoelectron spectroscopy (XPS, ESCALAB 250XI+, Pittsburgh, PA, USA). The spectra were measured with Al K Alpha radiation with an overall energy resolution of 0.45 eV. The binding energies were calibrated based on the C 1s peak from the LC sample at 284.6 eV.

2.5. Method of Content Analysis

Ethylene Diamine Tetraacetic Acid (EDTA) complexometric titration method was adopted for detection (SI), and the content of Pb was calculated through a formula.

3. Results and Discussion

3.1. Characterization of Materials

Figure 1 illustrates the XRD spectrum of the different materials. It can be found from the comparison of the standard peaks that the prepared LC material shows obvious PbO characteristic peaks. HPC has broad peaks only at around 26° and 44°, which is in line with the previous report [32]. The broad peaks indicate that the structure of HPC material is amorphous. According to the results, PbCO3 can be converted to PbO during the pyrolysis process at 500 °C, and partial PbO was reduced to Pb.
The SEM images of the HPC and LC materials are shown in Figure 2. The microscopic appearance of HPC shows a yarn-like porous structure. It has abundant pores that provide the attachment points for PbO. The ion-buffering reservoirs composed of mesoporous exist on the wall of the HPC, which is beneficial to the circulation of electrolytes [33]. As shown in Figure 2e, the average diameter of PbO was about 100 nm. The interplanar spacing was 0.306 nm (Figure 2f).
Figure 3 shows the element distribution of LC material, in which it can be seen that C, O and Pb were fused together. The ratio of them in LC material was 72.6%, 5.9% and 14.3%, respectively.
The XPS was conducted to identify the relationship between C and Pb elements (Figure 4). The full spectrum indicates the existence of C, O, and Pb elements, which is consistent with the XRD results. C 1s shows the presence of hydrophilic groups of -C-O and -COO which would benefit the dispersal of the LC material in the NAM. A certain number of oxygen-containing functional groups increased the electrode capacity of lead-carbon cells and the lead deposition on the negative electrodes [32,34,35]. Pb-COO chemical bond was proved to be included between Pb and C (Figure 4c) [5].

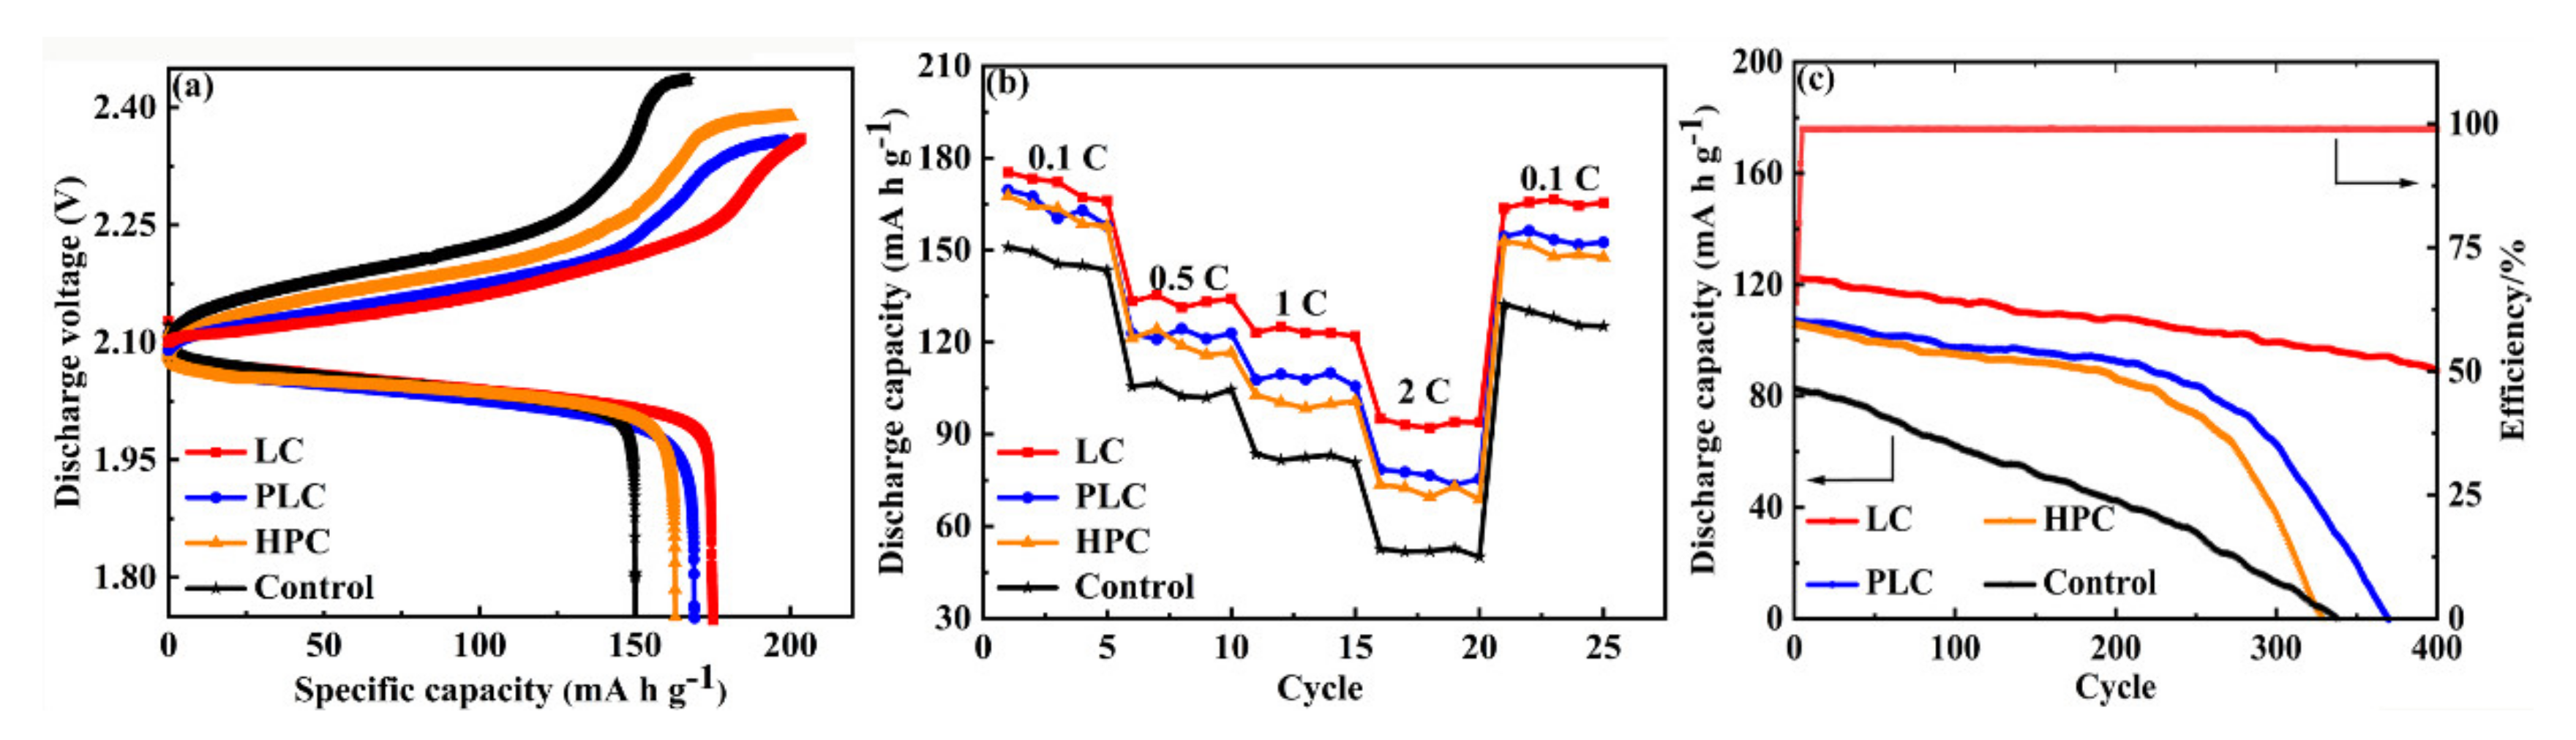
3.2. Electrochemical Performance of Negative Plates

The electrochemical impedance of the negative plates was tested to describe the impact of the additive materials on NAM. The Nyquist plots of impedance consisting of a semicircle and straight-line were analyzed, as shown in Figure 5a. In the plots, the electrolyte impedance of the cells is represented by the intersection point between the semicircle and the real axis, which can also be interpreted as the internal resistance of the batteries [36,37].
Compared with PLC (0.210 Ω) and HPC (0.213 Ω), the internal resistance of the LC cell is smaller, i.e., only 0.187 Ω, which is smaller than that of the control cell. It can be seen that the additive of HPC material works effectively on decreasing the internal resistance of the cells, and the performance of the LC material is better. The diffusion rate of ions in the electrolyte has a direct impact on the quantity of large PbSO4 particles.
Figure 5b illustrates the CV curves of the negative plates with different additives at the scan rate of 5 mV s−1. It can be seen that, compared with the control electrode, the redox peak current of the negative electrode containing HPC material is significantly increased. It shows that the addition of HPC material can accelerate the oxidation-reduction reaction on the negative electrodes. Table 1 shows the current parameters of oxidation peak (Ipa) and reduction peak (Ipc). The ratios of the peak current indicate that a part of the chemical reaction in the negative electrodes is irreversible. An important conclusion can be drawn, that is, PbSO4 crystals on the negative electrodes will inevitably accumulate. Fortunately, the negative electrode with LC has the largest redox current peak ratio. Therefore, the redox process of the cell is the fastest. It also shows that the LC material is able to delay the accumulation of PbSO4 crystals in the negative electrode. In addition, the largest oxidation peak area in LC cell brings more about lead participating in the chemical reaction, indicating that the LC cell has the largest specific discharge capacity.
At the scanning speed of 1 mV s−1, we rely on the LSV curves to study the hydrogen evolution behavior of the four negative electrodes. Under the same potential conditions, the measured LSV curves are shown in Figure 5c. The slowest hydrogen evolution reaction rate is that of the control electrode, which is followed by the LC electrode, and the fastest rate is that of the HPC electrode. Under the same potential condition of −1.5 V, the hydrogen evolution currents of the control electrode, LC electrode, PLC electrode, and HPC electrode are −0.11, −0.15, −0.21, and −0.26 A g−1, respectively. It can be concluded from the data that the hydrogen evolution reaction of LC is much weaker than that of HPC electrode. This indicated that the inclusion of Pb into HPC helped to slow down the hydrogen evolution reaction.
The specific capacity presents another important battery performance indicator, which is directly related to the battery´s capacity. Therefore, all cells should be tested for initial specific discharge capacity at 0.1 C. As shown in Figure 6a, compared with the control cell (150.3 mA h g−1), the initial specific discharge capacity of the cell with HPC additives increased at different levels. The cell doped with LC material shows the largest specific capacity, i.e., 175.1 mA h g−1 with an increase of 16.5%, which is followed by the cell doped with PLC (169.4 mA h g−1), and the cell with HPC (167.6 mA h g−1). The addition of HPC improved the initial specific discharge capacity of cells to a certain extent. Among them, LC performed best, which was consistent with the conclusion of CV.
Figure 6b illustrates the specific capacity curves of the four cells at different discharge rates. Among them, LC cell enjoys the largest specific capacity under different discharge rates. For example, at 0.1 C, the specific capacity of the LC cell is 175.2 mA h g−1, which is higher than that of the control cell (150.8 mA h g−1) by 16.1%. At 2 C, the specific discharge capacity of the control cell is only 52.8 mA h g−1. In contrast, the LC cell is as high as 95.1 mA h g−1, which is higher than that of the control cell by 80.0%. LC cell still has a high capacity under the condition of high current charge and discharge. After 2 C rate, we adjusted all cells’ rates back to 0.1 C and found that the specific capacity of LC cell recovered to 166.5 mA h g−1, about 94.9% of the initial specific discharge capacity. The specific capacity of the control cell is only 132.3 mA h g−1, which is 87.7% of its initial specific discharge capacity. The addition of LC material is available for a significant improvement of the batteries’ stability and high rate discharge performance.
The charge and discharge cycle curves of LABs at 1 C are shown in Figure 6c. The cycle performance of all the cells with HPC material is better than that of the control cell at 100% depth of discharge. It shows that the addition of HPC material is beneficial to the negative plates. The specific capacity of LC cell is always stable at about 100 mA h g−1. PLC and HPC cells can maintain high specific capacity only in the first 200 cycles. The specific capacity of control cell is always low. Figure 6c shows the Coulombic efficiency of the LC cell, which is stable. Combined with the LSV results, the hydrogen evolution reaction may have intensified after about 200 cycles, which caused a rapid drop in the specific capacity of HPC and PLC cells. Even though the HPC material benefits the cycle performance of the cells, the far lower density would cause the undermixing with PbO. The beneficial effect is reduced. The data show that LC material could benefit the cells. LC material is able to eliminate the density difference between lead and carbon. It can disperse HPC uniformly in NAM. The -Pb-COO chemical bond in the LC material can also enhance the stability of the lead-carbon electrode. These characteristics would maximize the benefit of HPC material and improve the cycle performance of cells.

3.3. Analysis of NAM

The NAM after formation and 1 C cycle was studied to discuss and analyze the effects of different materials on the performance of cells.
The microstructures of the formed negative plates are shown in Figure S2. They were all composed of a large amount of lead. The microstructures of NAM with more HPC are slightly different, showing a loose and porous structure. The content of Pb in NAM was obtained by EDTA titration. As shown in Table S4, the content of Pb in the control cell was slightly lower.
The SEM microstructures of the NAM are shown in Figure S3a,c,e,g, which are collected from the negative plates after 1 C cycle. A large amount of coarse PbSO4 particles could be observed in the control plate. On the contrary, PbSO4 particles are small in the LC plate. This indicates that the LC material has a steric hindrance effect. It can limit the formation of large PbSO4 particles [38].
The plates after the 1 C cycle were reassembled before being recharged. The SEM microstructures of the powder samples obtained from the cleaned and dried negative plates are shown in Figure S3b,d,f,h. Through comparison, it can be found that the Pb particles in the LC plate are the most abundant. This is consistent with the results of the EDTA titration (Table S5). As the plates are disassembled after being fully charged, some PbSO4 cannot be converted into Pb in the plates. The Pb content in the LC plate is the highest, which indicates that the LC cell still has a high specific capacity, and it can continue to work. The addition of HPC material has a significant effect on the microstructure of NAM and the diffusion of ions in the negative plates. The lead deposition was seen simultaneously at the C/H2SO4 interface and Pb/H2SO4 interface in negative plates. The charge overpotential of the C/H2SO4 interface was smaller than that of the Pb/H2SO4 interface by 300–400 mV, making it easier for electrons to pass through the former, accelerating the dissolution of PbSO4, promoting the conversion of PbSO4 to Pb2+. This can delay the occurrence of irreversible sulfation [39].

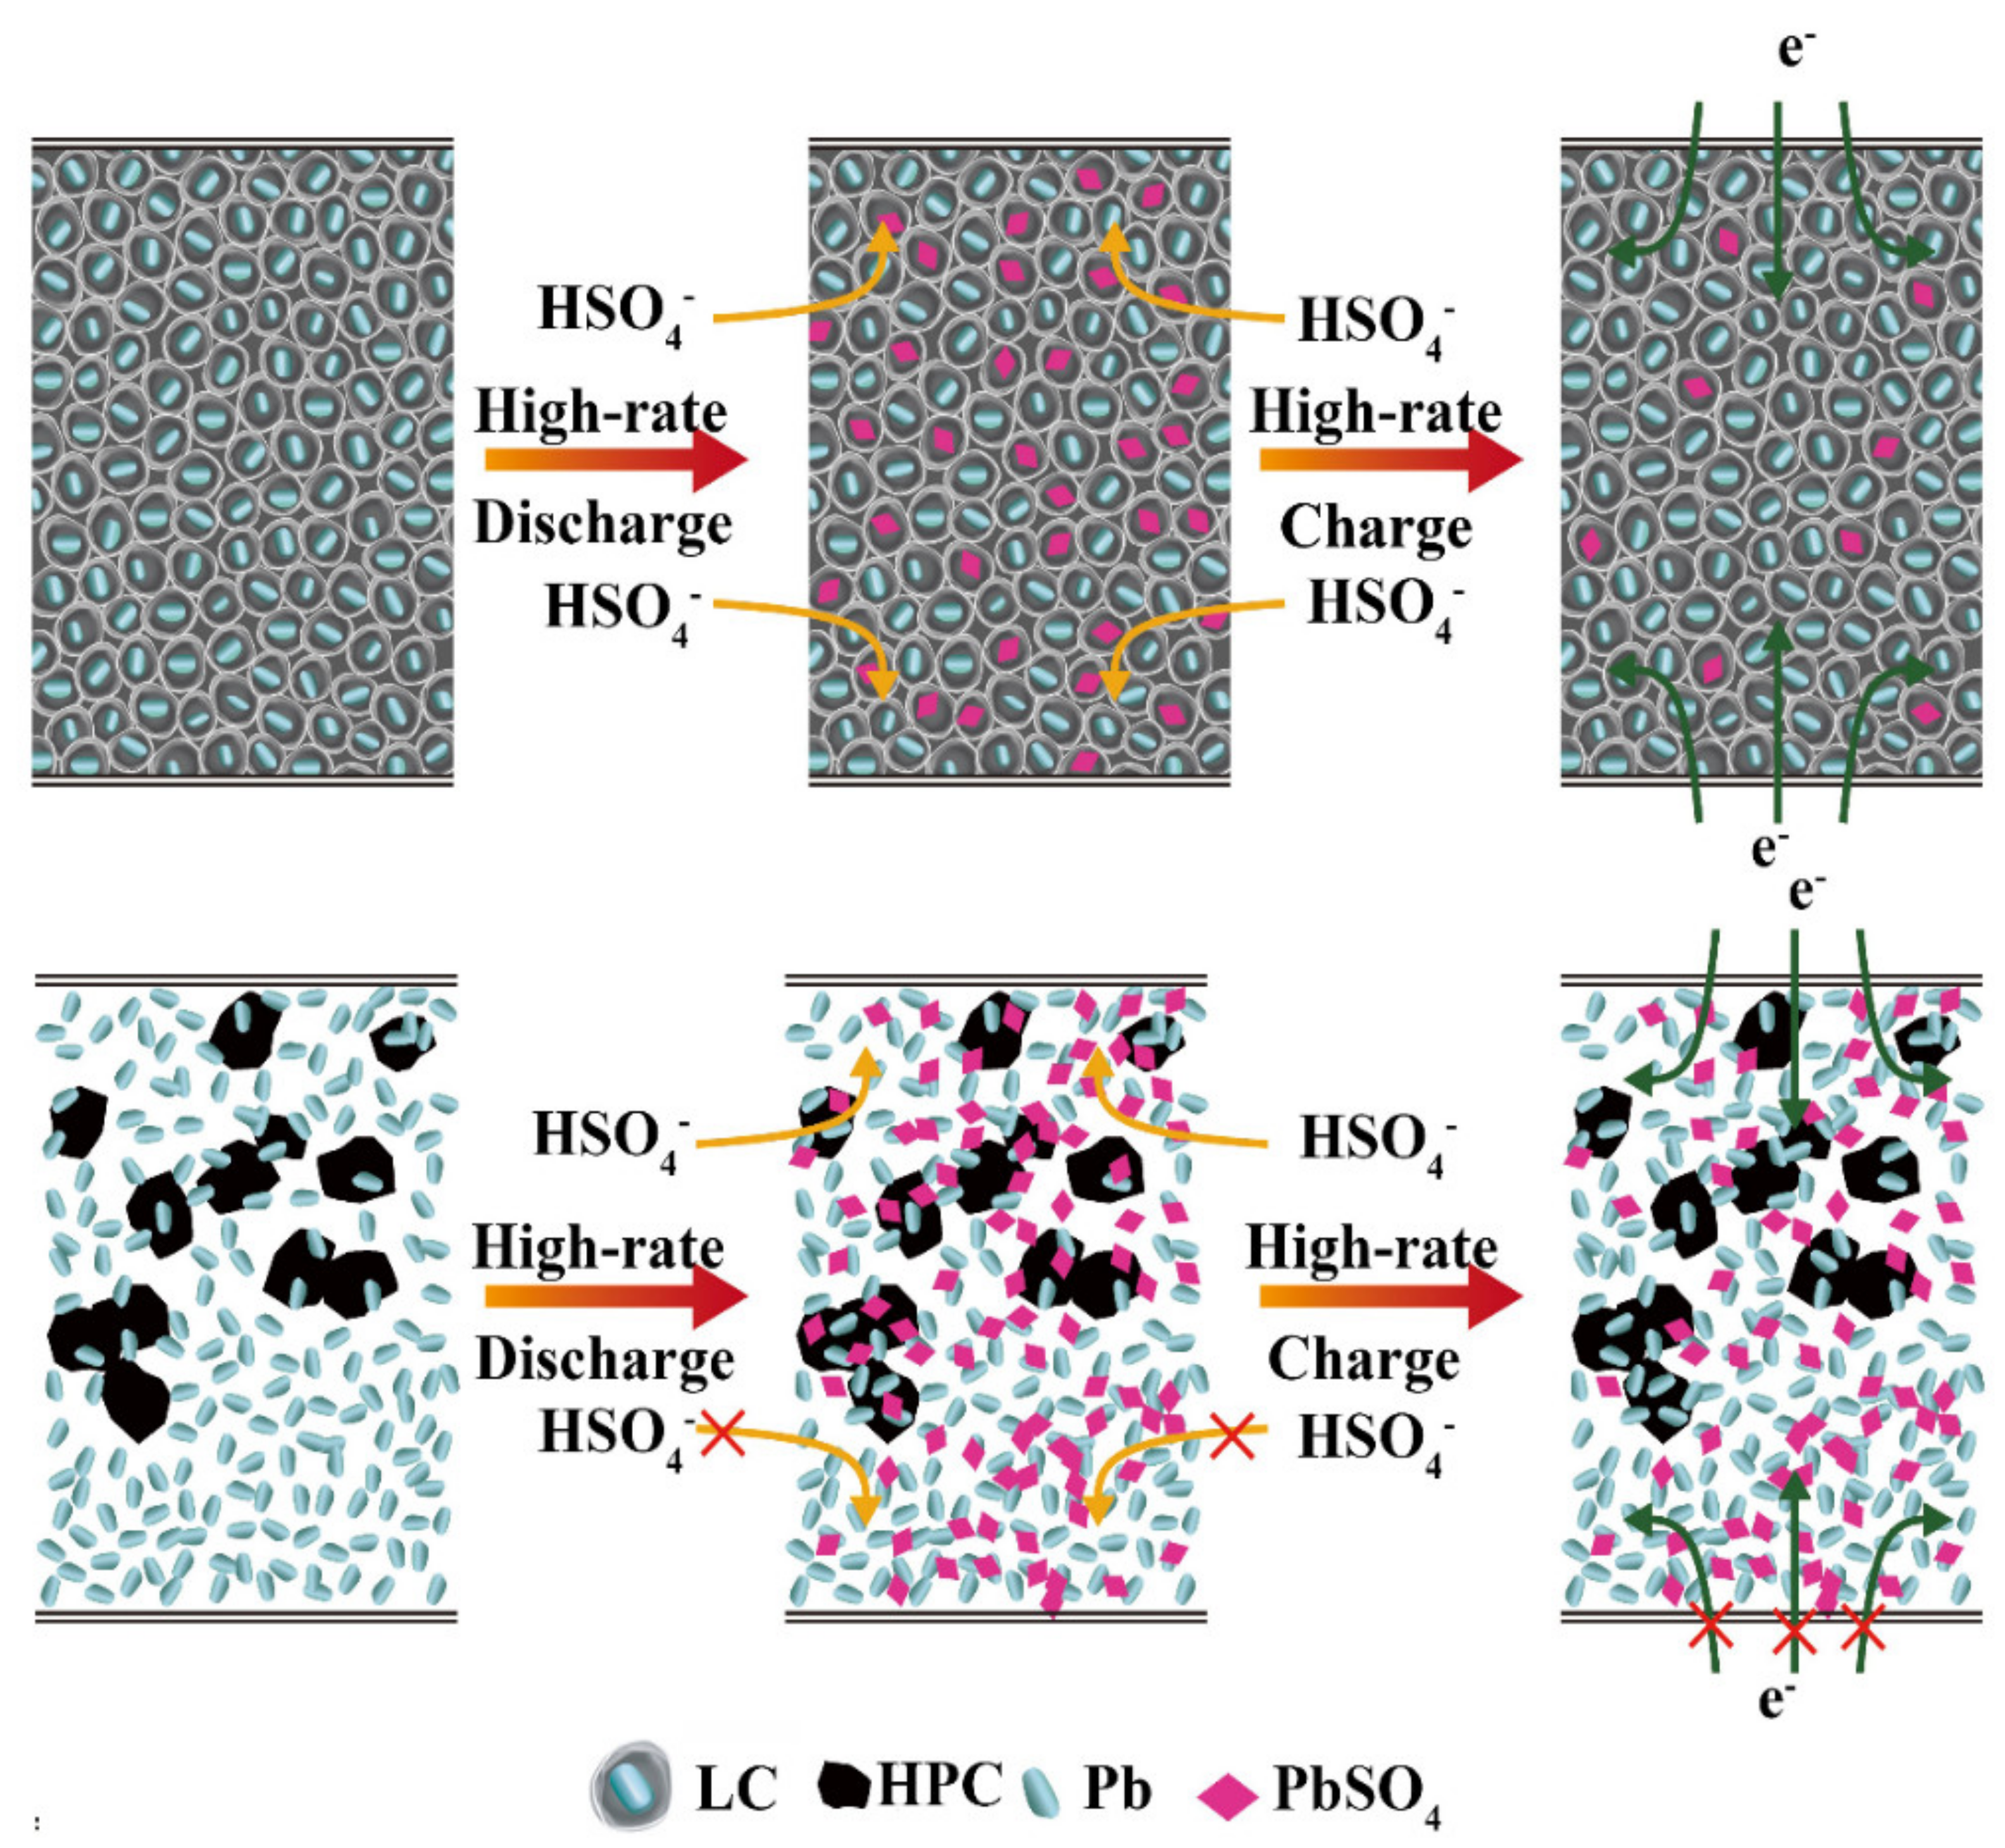
3.4. Possible Action Principle of the LC Material

The process of negative plates during the cycle is briefly shown in Figure 7. The ionic reaction of the negative plates being discharged is as follows.
Pb + HSO4 → PbSO4 + H+ + 2e
The chemical action would be available both on the surface and inside the negative plates due to the unique structure of HPC, thereby well improving the utilization of active materials. HPC played the role of steric hindrance by separating the grown PbSO4. Sponge lead first generated small PbSO4 particles on the carbon surface. The nanopores of carbon materials limit and separate the growth of PbSO4. It avoids the formation of irreversible PbSO4. Meanwhile, the formed porous-conductive network structure in NAM based on the porous structure of HPC material would provide more nucleation sites for the PbSO4 particles to defer the accumulation on the surface of Pb particles and inhibit the formation of irreversible PbSO4 particles. Small PbSO4 particles showed high solubility during charging, which helped to form lead-carbon dendrites. This ensured the stability of the electrodes structure [38].
The ionic reaction in the negative plates when being charged is shown in Equation (2).
PbSO4 + H++ 2e → Pb + HSO4
The electron transfer resistance on the interface between carbon and H2SO4 is less than that between Pb and H2SO4 [40]. Enough electrons are necessary to promote the transformation from PbSO4 to Pb. The HPC could provide more transfer passages for electrons by the formation of the porous-conductive network structure. Therefore, the addition of HPC to the cells is beneficial. It is most important to make HPC evenly dispersed in NAM. When HPC was added to the negative plates, the hybrid energy storage system including the electric double-layer capacitor and Faraday capacitor was formed. The micropores and mesopores of HPC provided electric double-layer capacitor energy storage—an energy storage system with a fast response but low specific energy used for high current density charge and discharge. The Faraday capacitor generated by the Pb⟺ PbSO4 reaction of lead-acid cells provided an energy storage system with a slow charge and discharge speed but high specific energy. The addition of carbon materials with a high specific surface area offset the shortage of LABs. It could improve the high-rate performance of the cells [41].

4. Conclusions

In this paper, the LC material was prepared by pyrolysis with HPC and PbCO3. The material was directly added to the negative pastes of LABs. The entire process was simple and implementable. Pb and C were integrated through chemical bonds. This facilitated the combination of additives and active materials. Meanwhile, the hydrophilic groups -C-O and -COO in LC material also promoted the uniform diffusion of HPC material in the active materials.
Compared with the control cell, the addition of LC material increased the initial specific discharge capacity of the cell by 16.5%, and the subsequent improvement in the utilization of NAM. Furthermore, it improved the cycle performance of the cell at 1 C. The specific capacity of LC cell remained stable at about 100 m Ah g−1, which is significantly higher than that of the control cell. The improvement in performance was attributed to the hydrophilic groups and the -Pb-COO bond compounds in LC. The LC material effectively solved the problem of carbon undermixing in NAM. Based on the unique structure, HPC could promote electrons transfer and the circulation of electrolyte. This could hinder the generation of irreversible PbSO4 and subsequently improve the performance of the cells.

Supplementary Materials

The following are available online at https://www.mdpi.com/article/10.3390/app11188469/s1, Figure S1: Schematic diagram of the synthesis of LC material, Figure S2: The SEM images of NAM after formation (a) LC, (b) PLC, (c) HPC and (d) control, Figure S3: The SEM images of NAM with different carbon after 1 C cycle (a) LC, (c) PLC, (e) HPC, (g) control, and recharge (b) LC, (d) PLC, (f) HPC, (h) control, Table S1: Information on different types of energy storage batteries, Table S2: Estimated cost data of LC material, Table S3: Percentage and ingredient of NAM, Table S4: The ratio of Pb in NAM after formation, Table S5: The ratio of Pb in NAM charged after 1 C cycle.

Author Contributions

Conceptualization, J.X.; methodology, J.X.; software, J.X.; validation, J.X.; formal analysis, J.X.; investigation, Y.H.; resources, Y.H.; data curation, J.X.; writing—original draft preparation, J.X.; writing—review and editing, J.X. and P.S.; supervision, X.W. and A.A.; project administration, P.S.; funding acquisition, P.S. All authors have read and agreed to the published version of the manuscript.

Funding

This research was funded by Guangxi Science and Technology Project (AA17204083, AB16380030) and the link project of National Natural Science Foundation of China and Fujian Province (U1705252).

Institutional Review Board Statement

Not applicable.

Informed Consent Statement

Not applicable.

Data Availability Statement

The data presented in this study are contained within the article and supplementary materials.

Acknowledgments

This research was funded by Guangxi Science and Technology Project (AA17204083, AB16380030) and the link project of National Natural Science Foundation of China and Fujian Province (U1705252).

Conflicts of Interest

The authors declare no conflict of interest.

References

  1. Blanco, H.; Faaij, A. A review at the role of storage in energy systems with a focus on Power to Gas and long-term storage. Renew. Sustain. Energy Rev. 2018, 81, 1049–1086. [Google Scholar] [CrossRef]
  2. Hamelink, M.; Opdenakker, R. How business model innovation affects firm performance in the energy storage market. Renew. Energy 2019, 131, 120–127. [Google Scholar] [CrossRef]
  3. Zhang, H.; Sun, C. Cost-effective iron-based aqueous redox flow batteries for large-scale energy storage application: A review. J. Power Sources 2021, 493, 229445. [Google Scholar] [CrossRef]
  4. Garche, J. Advanced battery systems—The end of the lead–acid battery? Phys. Chem. Chem. Phys. 2001, 3, 356–367. [Google Scholar] [CrossRef]
  5. Hu, Y.; Yang, J.; Hu, J.; Wang, J.; Liang, S.; Hou, H.; Wu, X.; Liu, B.; Yu, W.; He, X.; et al. Synthesis of Nanostructured PbO@C Composite Derived from Spent Lead-Acid Battery for Next-Generation Lead-Carbon Battery. Adv. Funct. Mater. 2018, 28, 1705294. [Google Scholar] [CrossRef]
  6. Yu, J.; Yang, J.; Jiang, Z.; Zhang, H.; Wang, Y. Emergy based sustainability evaluation of spent lead acid batteries recycling. J. Clean. Prod. 2020, 250, 119467. [Google Scholar] [CrossRef]
  7. Xing, P.; Wang, C.; Wang, L.; Ma, B.; Chen, Y. Hydrometallurgical recovery of lead from spent lead-acid battery paste via leaching and electrowinning in chloride solution. Hydrometallurgy 2019, 189, 105134. [Google Scholar] [CrossRef]
  8. Carroquino, J.; Escriche-Martinez, C.; Valino, L.; Dufo-Lopez, R. Comparison of Economic Performance of Lead-Acid and Li-Ion Batteries in Standalone Photovoltaic Energy Systems. Appl. Sci. 2021, 11, 3587. [Google Scholar] [CrossRef]
  9. Dinesh, A.; Olivera, S.; Venkatesh, K.; Santosh, M.S.; Priya, M.G.; Inamuddin; Asiri, A.M.; Muralidhara, H.B. Iron-based flow batteries to store renewable energies. Environ. Chem. Lett. 2018, 16, 683–694. [Google Scholar] [CrossRef]
  10. Kebede, A.A.; Coosemans, T.; Messagie, M.; Jemal, T.; Behabtu, H.A.; Van Mierlo, J.; Berecibar, M. Techno-economic analysis of lithium-ion and lead-acid batteries in stationary energy storage application. J. Energy Storage 2021, 40, 102748. [Google Scholar] [CrossRef]
  11. Lam, L.T.; Haigh, N.P.; Phyland, C.G.; Urban, A.J. Failure mode of valve-regulated lead-acid batteries under high-rate partial-state-of-charge operation. J. Power Sources 2004, 133, 126–134. [Google Scholar] [CrossRef]
  12. Xiang, J.; Ding, P.; Zhang, H.; Wu, X.; Chen, J.; Yang, Y. Beneficial effects of activated carbon additives on the performance of negative lead-acid battery electrode for high-rate partial-state-of-charge operation. J. Power Sources 2013, 241, 150–158. [Google Scholar] [CrossRef]
  13. Pavlov, D.; Nikolov, P.; Rogachev, T. Influence of carbons on the structure of the negative active material of lead-acid batteries and on battery performance. J. Power Sources 2011, 196, 5155–5167. [Google Scholar] [CrossRef]
  14. Zou, X.; Kang, Z.; Shu, D.; Liao, Y.; Gong, Y.; He, C.; Hao, J.; Zhong, Y. Effects of carbon additives on the performance of negative electrode of lead-carbon battery. Electrochim. Acta 2015, 151, 89–98. [Google Scholar] [CrossRef]
  15. Hu, H.-Y.; Xie, N.; Wang, C.; Wu, F.; Pan, M.; Li, H.-F.; Wu, P.; Wang, X.-D.; Zeng, Z.; Deng, S.; et al. Enhancing the Performance of Motive Power Lead-Acid Batteries by High Surface Area Carbon Black Additives. Appl. Sci. 2019, 9, 186. [Google Scholar] [CrossRef] [Green Version]
  16. Fernández, M.; Valenciano, J.; Trinidad, F.; Muñoz, N. The use of activated carbon and graphite for the development of lead-acid batteries for hybrid vehicle applications. J. Power Sources 2010, 195, 4458–4469. [Google Scholar] [CrossRef]
  17. Kumar, S.M.; Ambalavanan, S.; Mayavan, S. Effect of graphene and carbon nanotubes on the negative active materials of lead acid batteries operating under high-rate partial-state-of-charge operation. RSC Adv. 2014, 4, 36517–36521. [Google Scholar] [CrossRef]
  18. Lin, Z.; Zhang, W.; Lin, N.; Lin, H.; Shi, J. Long-Life Lead-Acid Battery for High-Rate Partial-State-of-Charge Operation Enabled by a Rice-Husk-Based Activated Carbon Negative Electrode Additive. ChemistrySelect 2020, 5, 2551–2558. [Google Scholar] [CrossRef]
  19. Sadhasivam, T.; Park, M.-J.; Shim, J.-Y.; Jin, J.-E.; Kim, S.-C.; Kurkuri, M.D.; Roh, S.-H.; Jung, H.-Y. High charge acceptance through interface reaction on carbon coated negative electrode for advanced lead-carbon battery system. Electrochim. Acta 2019, 295, 367–375. [Google Scholar] [CrossRef]
  20. Dhanabalan, K.; Sadhasivam, T.; Kim, S.C.; Eun, J.J.; Shim, J.; Jeon, D.; Roh, S.-H.; Jung, H.-Y. Novel core–shell structure of a lead-activated carbon (Pb@AC) for advanced lead–acid battery systems. J. Mater. Sci. Mater. Electron. 2017, 28, 10349–10356. [Google Scholar] [CrossRef]
  21. Swogger, S.W.; Everill, P.; Dubey, D.P.; Sugumaran, N. Discrete carbon nanotubes increase lead acid battery charge acceptance and performance. J. Power Sources 2014, 261, 55–63. [Google Scholar] [CrossRef] [Green Version]
  22. Sugumaran, N.; Everill, P.; Swogger, S.W.; Dubey, D.P. Lead acid battery performance and cycle life increased through addition of discrete carbon nanotubes to both electrodes. J. Power Sources 2015, 279, 281–293. [Google Scholar] [CrossRef] [Green Version]
  23. Zhu, J.; Hu, G.; Yue, X.; Wang, D. Study of Graphene as a Negative Additive for Valve-Regulated Lead-Acid Batteries Working under High-Rate Partial-StateOf-Charge Conditions. Int. J. Electrochem. Sci. 2016, 11, 700–709. [Google Scholar]
  24. Yeung, K.K.; Zhang, X.; Kwok, S.C.T.; Ciucci, F.; Yuen, M.M.F. Enhanced cycle life of lead-acid battery using graphene as a sulfation suppression additive in negative active material. RSC Adv. 2015, 5, 71314–71321. [Google Scholar] [CrossRef]
  25. Li, X.; Zhang, Y.; Su, Z.; Zhao, Y.; Zhao, X.; Wang, R. Graphene nanosheets as backbones to build a 3D conductive network for negative active materials of lead–acid batteries. J. Appl. Electrochem. 2017, 47, 619–630. [Google Scholar] [CrossRef]
  26. Pavlov, D.; Nikolov, P.; Rogachev, T. Influence of expander components on the processes at the negative plates of lead-acid cells on high-rate partial-state-of-charge cycling. Part II. Effect of carbon additives on the processes of charge and discharge of negative plates. J. Power Sources 2010, 195, 4444–4457. [Google Scholar] [CrossRef]
  27. Long, Q.; Ma, G.; Xu, Q.; Ma, C.; Nan, J.; Li, A.; Chen, H. Improving the cycle life of lead-acid batteries using three-dimensional reduced graphene oxide under the high-rate partial-state-of-charge condition. J. Power Sources 2017, 343, 188–196. [Google Scholar] [CrossRef]
  28. Saravanan, M.; Ganesan, M.; Ambalavanan, S. A Modified Lead-Acid Negative Electrode for High-Rate Partial-State-of-Charge Applications. J. Electrochem. Soc. 2012, 159, A452–A458. [Google Scholar] [CrossRef]
  29. Stoller, M.D.; Park, S.J.; Zhu, Y.W.; An, J.H.; Ruoff, R.S. Graphene-Based Ultracapacitors. Nano Lett. 2008, 8, 3498–3502. [Google Scholar] [CrossRef]
  30. Tong, P.; Zhao, R.; Zhang, R.; Yi, F.; Shi, G.; Li, A.; Chen, H. Characterization of lead (II)-containing activated carbon and its excellent performance of extending lead-acid battery cycle life for high-rate partial-state-of-charge operation. J. Power Sources 2015, 286, 91–102. [Google Scholar] [CrossRef]
  31. Yang, J.; Hu, C.; Wang, H.; Yang, K.; Liu, J.B.; Yan, H. Review on the research of failure modes and mechanism for lead-acid batteries. Int. J. Energy Res. 2017, 41, 336–352. [Google Scholar] [CrossRef]
  32. Li, J.; Hu, Y.; Zhang, Y.; Xie, J.; Shen, P.K. Construction of a novel three-dimensional porous lead-carbon network for improving the reversibility of deep discharge lead-carbon batteries. J. Electroanal. Chem. 2021, 883, 115065. [Google Scholar] [CrossRef]
  33. Li, Y.; Li, Z.; Shen, P.K. Simultaneous Formation of Ultrahigh Surface Area and Three-Dimensional Hierarchical Porous Graphene-Like Networks for Fast and Highly Stable Supercapacitors. Adv. Mater. 2013, 25, 2474–2480. [Google Scholar] [CrossRef]
  34. Pavlov, D.; Nikolov, P. Capacitive carbon and electrochemical lead electrode systems at the negative plates of lead-acid batteries and elementary processes on cycling. J. Power Sources 2013, 242, 380–399. [Google Scholar] [CrossRef]
  35. Moseley, P.T.; Rand, D.A.J.; Peters, K. Enhancing the performance of lead-acid batteries with carbon—In pursuit of an understanding. J. Power Sources 2015, 295, 268–274. [Google Scholar] [CrossRef]
  36. Spanos, C.; Turney, D.E.; Fthenakis, V. Life-cycle analysis of flow-assisted nickel zinc-, manganese dioxide-, and valve-regulated lead-acid batteries designed for demand-charge reduction. Renew. Sustain. Energy Rev. 2015, 43, 478–494. [Google Scholar] [CrossRef]
  37. Probstle, H.; Schmitt, C.; Fricke, J. Button cell supercapacitors with monolithic carbon aerogels. J. Power Sources 2002, 105, 189–194. [Google Scholar] [CrossRef]
  38. Vangapally, N.; Jindal, S.; Gaffoor, S.A.; Martha, S.K. Titanium dioxide-reduced graphene oxide hybrid as negative electrode additive for high performance lead-acid batteries. J. Energy Storage 2018, 20, 204–212. [Google Scholar] [CrossRef]
  39. Zhang, W.-L.; Yin, J.; Lin, Z.-Q.; Shi, J.; Wang, C.; Liu, D.-B.; Wang, Y.; Bao, J.-P.; Lin, H.-B. Lead-carbon electrode designed for renewable energy storage with superior performance in partial state of charge operation. J. Power Sources 2017, 342, 183–191. [Google Scholar] [CrossRef]
  40. Pavlov, D.; Rogachev, T.; Nikolov, P.; Petkova, G. Mechanism of action of electrochemically active carbons on the processes that take place at the negative plates of lead-acid batteries. J. Power Sources 2009, 191, 58–75. [Google Scholar] [CrossRef]
  41. Naresh, V.; Elias, L.; Martha, S.K. Poly(3,4-ethylenedioxythiophene) coated lead negative plates for hybrid energy storage systems. Electrochim. Acta 2019, 301, 183–191. [Google Scholar] [CrossRef]
Figure 1. XRD pattern of different materials.
Applsci 11 08469 g001
Figure 2. SEM images of (a) HPC, (b) LC and (c) PLC. TEM images of (d) HPC and (e) LC. HRTEM image of (f) LC.
Applsci 11 08469 g002
Figure 3. (a) SEM image of LC. EDS mapping images of LC. (b) C element, (c) O element and (d) Pb element.
Applsci 11 08469 g003
Figure 4. XPS pattern of the LC composites (a) total peak, (b) C 1s, (c) O 1s and (d) Pb-4f.
Applsci 11 08469 g004
Figure 5. (a) Electrochemical impedance spectroscopy, (b) CV curves and (c) LSV curves.
Applsci 11 08469 g005
Figure 6. (a) Initial specific discharge capacity at 0.1 C, (b) the cycle stability at different discharge rates, (c) the specific discharge capacity and Coulombic efficiency at 1 C.
Applsci 11 08469 g006
Figure 7. The schematic diagram for the effect of LC and HPC.
Applsci 11 08469 g007
Table 1. Redox peak parameters obtained from Figure 5b.
SampleIpa (A g−1)Ipc (A g−1)Ipc/Ipa
LC0.870.640.73
PLC0.650.430.66
HPC0.640.390.60
Control0.390.200.51
Publisher’s Note: MDPI stays neutral with regard to jurisdictional claims in published maps and institutional affiliations.

