Article

Experimental Characterization of Chemical Properties of Engine Oil Using Localized Surface Plasmon Resonance Sensing

by
José Antonio Heredia-Cancino
1,*,
Roberto Carlos Carrillo-Torres
2,
Francisco Félix-Domínguez
2 and
Mario Enrique Álvarez-Ramos
2
1
P.E. Ingeniería Mecatrónica, Universidad Estatal de Sonora, Av. Ley Federal del Trabajo s/n, Col. Apolo, Hermosillo C.P. 83100, Sonora, Mexico
2
Departamento de Física, Universidad de Sonora, Blvr. Luis Encinas s/n, Col. Centro, Hermosillo C.P. 83000, Sonora, Mexico
*
Author to whom correspondence should be addressed.
Appl. Sci. 2021, 11(18), 8518; https://doi.org/10.3390/app11188518
Submission received: 11 August 2021 / Revised: 2 September 2021 / Accepted: 10 September 2021 / Published: 14 September 2021
(This article belongs to the Special Issue Tribology and Mechanical Transmissions)

Abstract

:
The chemical properties of engine oil are part of the main parameters to evaluate its condition since oxidation starts chemical reactions that alter its operating conditions. In this work, the chemical properties of engine oil were analyzed based on the standard ASTM E2412 by FT-IR spectroscopy to evaluate the lubricating oil condition. Furthermore, a sensor based on the position of the localized surface plasmon resonance (LSPR) band of silver nanoparticles (AgNP), synthesized by the laser-assisted photoreduction method, was developed. This plasmonic sensor can detect changes in the permittivity of the oil, caused by the modification of the chemical properties of the lubricant. The response of the sensor during the study of degraded oil resulted in a notorious displacement to higher wavelengths of the LSPR band as mileage increases. The results of FT-IR analysis were correlated with the measurements of the proposed sensor presenting linear trends with good correlation (R2 > 0.9491).

1. Introduction

Lubricating oil is essential in the automotive industry and it is one of the more important liquids that requires monitoring to guarantee the correct operation of the engine, in order to avoid improper friction between moving surfaces of the different mechanical parts [1]. Automotive manufacturers make conservative time or mileage suggestions to replace it, without knowing the real condition of the lubricant and ignoring the operating conditions of the vehicle, causing an early disposal and an environmental problem [2].
Among the different mechanisms of oil degradation, oxidation is the main reaction to cause the loss of properties of the lubricant, given that its base is composed of long hydrocarbon chains that are susceptible to oxidation when exposed to high temperatures [3]. During this process, free radicals are generated, which are undesirable because they damage the chemical structure of the lubricant [4]. These reactive chemical species trigger a series of complex chemical reactions on the oil base. To avoid early degradation or a delay in this process, some additives, like antioxidants, are added into the composition. However, the oxidation products along with the high temperatures of the medium can react with the sulfur containing species that are present in the lubricant composition, producing sulfated byproducts (SOx), a process known as sulfation [5]. In the same way, the gases produced during the combustion process, filtered through the walls of the cylinders, can react with the oil base producing nitrogenated compounds. Both nitration and sulfation products reduce the effectivity of the different additives and, in the presence of water, they acidify the environment, reducing the lubricant properties of oil, which can produce corrosion or another damage to the engine [6]. Additionally, the oxidation reaction also generates molecules with increased polarity with respect the original ones, which in turn change the polarization of the lubricant causing an increase of the permittivity of the medium, as the lubricant oxidates [7,8].
The chemical properties of the lubricants were widely studied, with Fourier-transform infrared spectroscopy (FT-IR) the main used technique. The American Society for Testing and Materials (ASTM) established a standard practice to monitor oil condition through this technique (ASTM E2412) [9]. However, many investigations have opted to develop sensors to monitor the condition of the engine oil by studying its physical and chemical properties, such as viscosity, refractive index, permittivity, oxidation, sulfation, nitration, wear, water content, insoluble particles, etc. [3,10,11]. However, the development of sensors based on the properties of nanoparticles was on the rise over the last decades, generating great advances in many areas of science. In particular, advances were made in the detection of the interaction between molecules close to the surface of the nanoparticles through changes in the surface plasmon resonance (SPR) or LSPR, due to the high sensitivity to the refractive index of the medium surrounding the nanoparticle [12,13]. These types of sensors have several advantages since they could be used for real-time sensing and the wavelength of the SPR or LSPR can be tuned for different applications, such as detectors for drugs, biomolecular interactions, gases, pH, among others [14,15,16,17,18,19,20,21]. Therefore, they are good candidates to monitor the condition of the lubricant, since its degradation modifies the physicochemical properties, which can be detected by changes in the SPR or LSPR bands. Milanese et al. [22] reported a sensor based on the SPR of different nanoparticles (Ag, Au and Ti), analyzing only two lubricant samples, which corresponded to a new lubricant and another lubricant used during a certain mileage, and the sensor response was a variation of the SPR angle with the used lubricant. Similarly, Aghayan et al. [23] analyzed the evolution of the SPR of artificially contaminated lubricant samples, who observed a tendency for the SPR to shift toward higher angles as the percentage of contamination in the lubricant increases.
The plasmonic sensor developed in this research consists of AgNP deposited on the surface of the inner face of a polystyrene cuvette to measure the change in the LSPR signal position when interacting with engine oil, at different degradation levels. The deposited AgNP were synthesized by a photochemical method using a laser beam to carry out the reaction. This is a versatile approach that involves the direct photoreduction of metal salts in solution and its reaction mechanism was reported previously for our research group [24]. The characteristics of this method allow stopping the reaction at any time, thus controlling the growth of the AgNP and, consequently, the opacity or transparency of the deposited film. Finally, the sensor based on the LSPR of AgNP was used to detect changes in the engine oil condition, and the response of the sensor was correlated with the chemical properties obtained by FT-IR analysis based on the standard practice ASTM E-2412 in order to compare its effectiveness.

2. Materials and Methods

2.1. Oil Samples

The samples used in this study were SAE 15W-40 mineral oil, manufactured by Exxon Mobil Corporation, with a maximum service life of 7500 km or up to 6 months of use according to the manufacturer, from a 1.6 L inline-four engine of a passenger car. This vehicle was selected to degrade the oil under real driving conditions: trips longer than 10 km, hot and dry climate, and maintaining the same engine performance. The volume of the oil samples was 10 mL and the oil was extracted from the crankcase at different driving distances, assuring different degradation levels. Table 1 shows the relationship of the lubricant samples with their respective driving distance.

2.2. Prototype Design

2.2.1. Deposition of AgNP in Polystyrene Cells

The deposition of the silver nanoparticles was carried out on the walls of 3 mL disposable polystyrene cuvettes (Brand GmbH, Wertheim, Germany). First, silver nitrate (Sigma-Aldrich, ≥99%) and sodium citrate dihydrate (Sigma-Aldrich, ≥99%) aqueous solutions were prepared at 15 mM and 9 mM, respectively. Next, 990 μ L of sodium citrate and 10 μ L of silver nitrate solutions were poured into the cuvette, followed by the addition of 500 μ L of ultrapure water with a resistivity of 18.2 MΩ·cm. Once the reaction mixture was prepared, the cuvette was irradiated with a Melles Griot Ar ion laser (λ = 488 nm, 100 mW) for 30 min, resulting in the deposition of AgNP on both surfaces of the polystyrene cuvette where the laser incised. After the deposition procedure, a semi-translucent zone was easily observed with the naked eye on both walls of the cuvette (Figure 1). To carry out the absorbance measurements, just one covered area was selected to analyze the LSPR band of the AgNP (Figure 1b). Although the deposition of AgNP on polystyrene cells influences LSPR band, it is not the subject of study in this work.

2.2.2. Prototype Operation

The rationale for using LSPR to detect changes in lubricant chemical properties is based on the fact that, according to Jesen et al. [25], the wavelength of the LSPR band depends on the permittivity of the medium (lubricant) that surrounds the nanoparticle (Equation (1)).
λ m a x = λ p 2 ε m + 1
where λmax is the wavelength of the LSPR peak, λp is the wavelength corresponding to the plasma frequency of the bulk metal and εm is the permittivity of the medium.
Therefore, the LSPR could detect when the lubricant starts to degrade, given that as the oxidation increases the permittivity of the lubricant modifies [7,8]. For the operation of the prototype, it was necessary to cut the front face of the cuvette to assure just the interaction of the incident light with the lubricant and only a layer of AgNP. A UV-Vis spectrometer was used to measure the absorption spectrum to obtain the LSPR response of the deposited AgNP when interacting with the degraded lubricant samples. The displacement of the LSPR band was then compared and quantified for the different lubricant samples. Figure 2 shows the experimental setup to operate the sensor and a schematic representation of the expected response.

2.3. Measurement Equipment

2.3.1. FT-IR Analysis

The evaluation of the chemical properties of the engine oil was conducted by means of FT-IR spectroscopy based on ASTM E2412 [9]. A Perkin Elmer Spectrum Two FT-IR spectrometer with specific accessories for this end was used (a liquid flow cell with zinc selenide windows and an optical path of 0.1 mm). The three parameters of oil degradation of this study were oxidation, nitration, and sulfation; where analyzed by monitoring the changes in the absorption bands corresponding to carbonyl group (C = O) stretching vibration, as well as the NOx stretching mode and SOx bending, centered at 1718 cm−1, 1600 cm−1, and 1158 cm−1, respectively. Quantitative analysis of the obtained spectra was performed using In-Service Lubricant FT-IR Touch Apps software from Perkin Elmer. Briefly, the software quantifies the changes in the area under specific absorbance bands related to the three parameters under study (Figure 3) and presents a report for every sample according to standard practice ASTM E2412.

2.3.2. Scanning Electron Microscopy and X-ray Energy Dispersive Spectroscopy

The morphology and composition of the AgNP deposited on the surface of the cuvette were analyzed by scanning electron microscopy (SEM) and X-ray energy dispersive spectroscopy (EDS), using a field-emission scanning electron microscope JEOL JSM-7800F equipped with a Bruker XFlash 6|60 EDS spectrometer.

2.3.3. UV-Vis Absorption Spectroscopy

Once the presence of AgNP in the polystyrene cell was confirmed, an Ocean Optics USB 2000+ UV-Vis spectrometer was used to measure the absorption spectrum of the AgNP. To obtain the characteristic spectrum of AgNP, the absorption spectrum of a new (empty) cuvette was chosen as the background, to eliminate the absorption spectrum of the polystyrene. Next, the AgNP-modified cuvette was measured to obtain the reference spectra of the nanostructures (Figure 4).
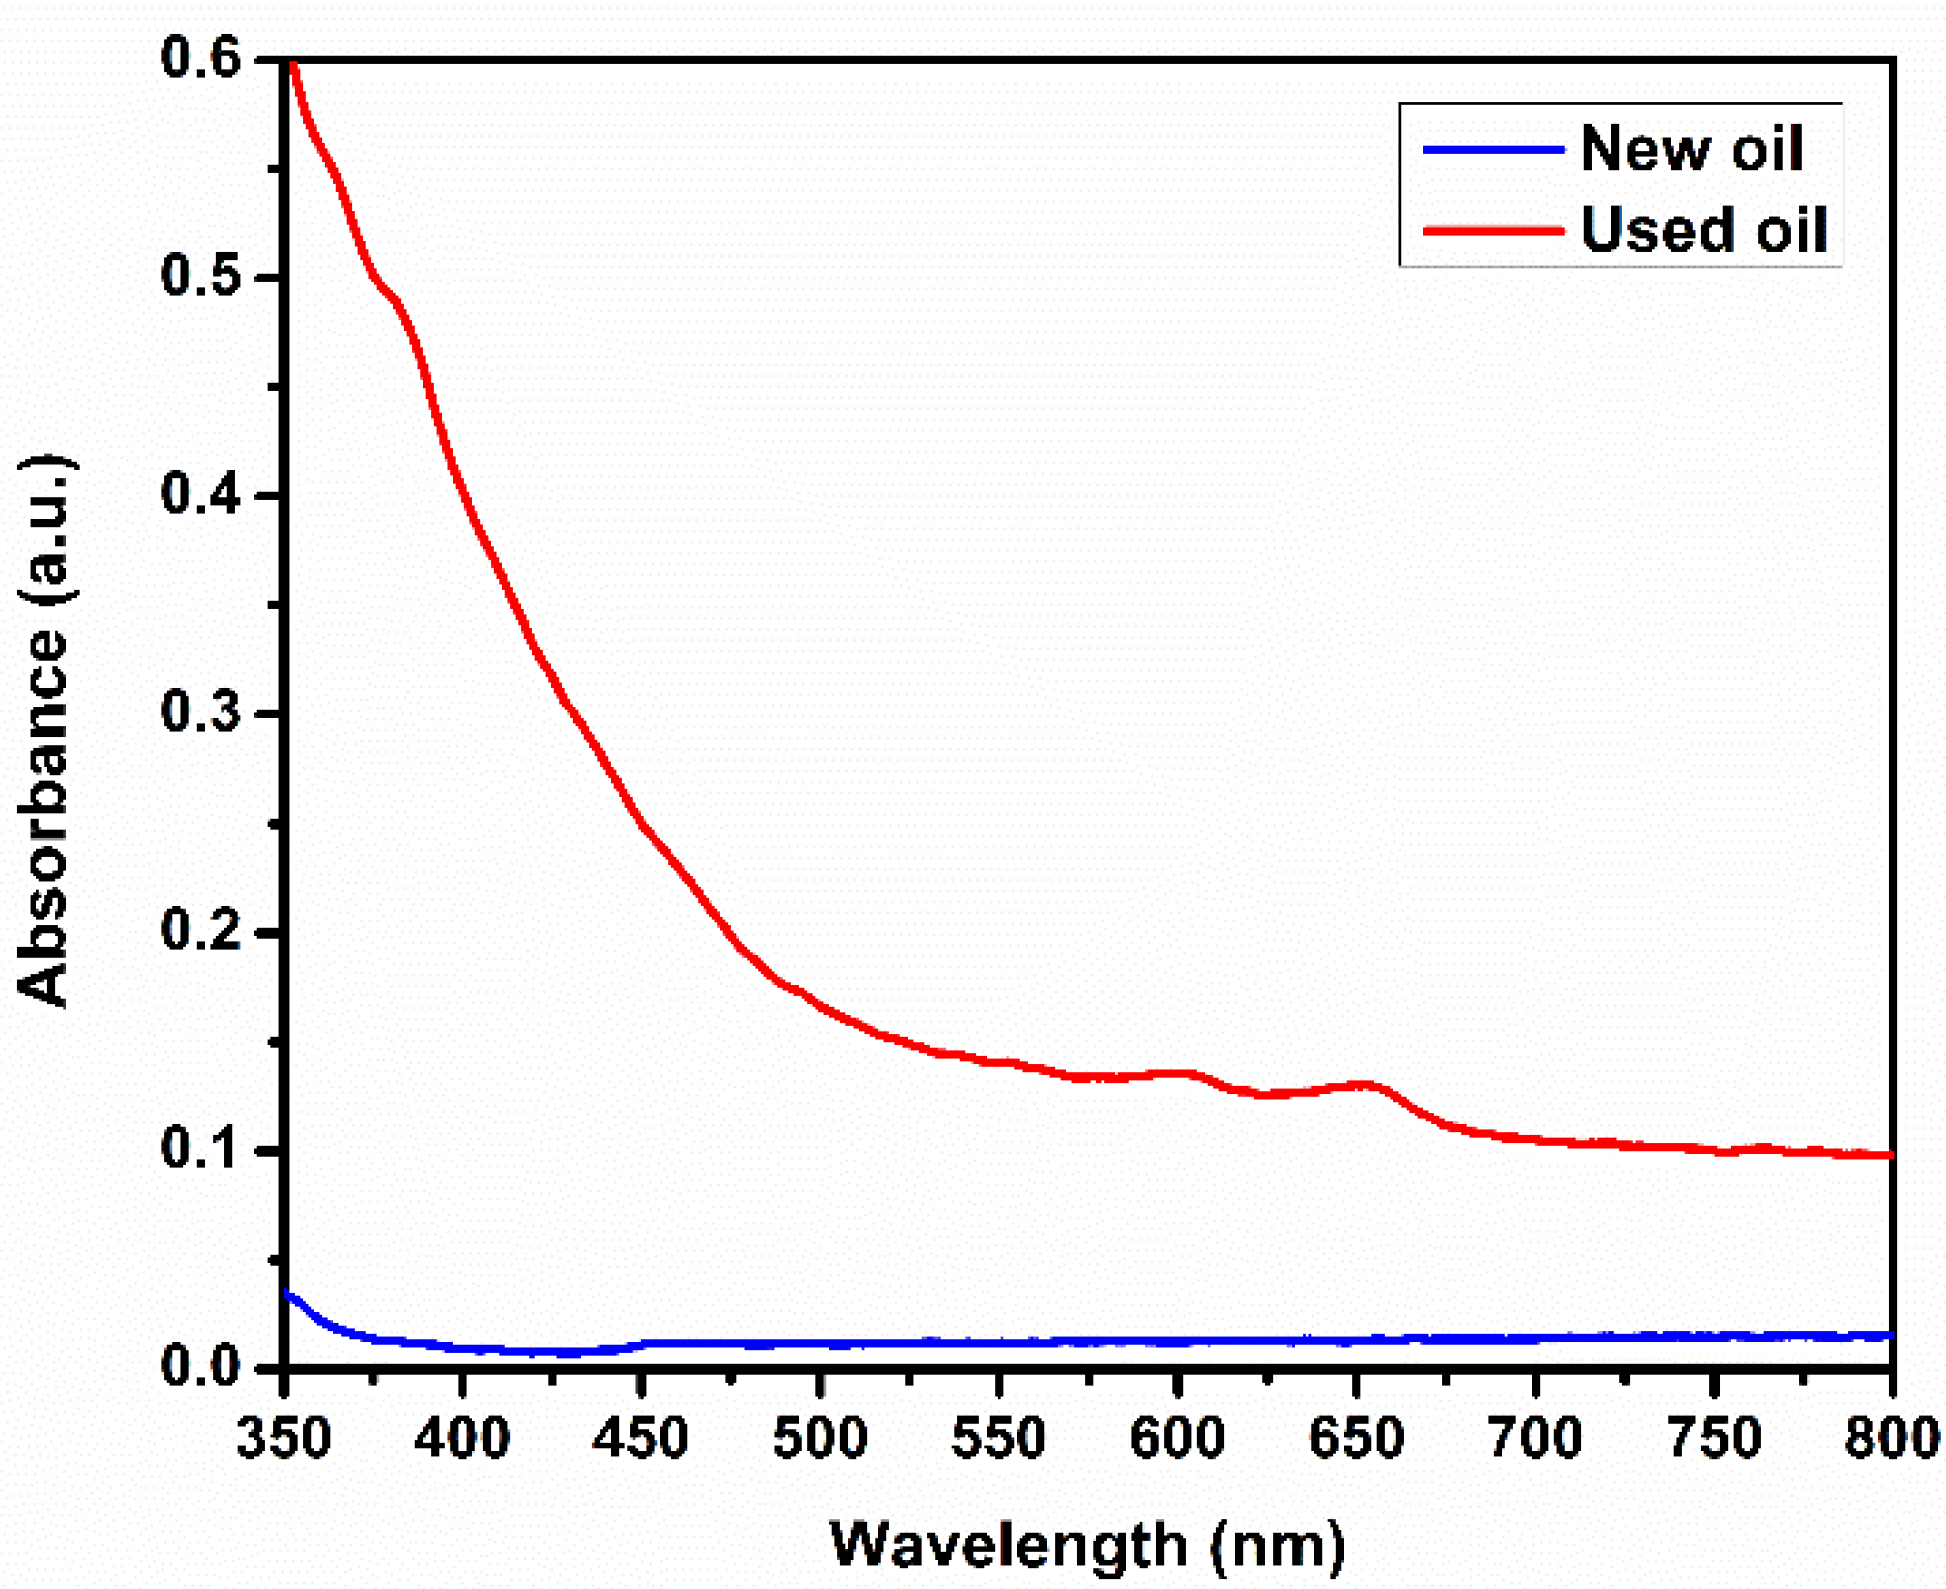
Once the position of the LSPR band of the deposited AgNP was determined, the effect produced by the interaction of the degraded lubricant on the LSPR was analyzed. To carry out the LSPR measurements of degraded oil samples, the background spectrum was taken from one clean face of the polystyrene cuvette covered with its respective oil sample for each measurement. This was so the acquired data would correspond to the LSPR response made by the interaction between the oil sample (dielectric medium) and AgNP (metal). Figure 5 shows the absorbance spectra of new and used oil sample. As can be seen, both spectra show an increased absorbance below 400 nm due to the organic base of the lubricant. Another observed feature is the baseline variation in the used oil spectrum caused by the darkening of the lubricant with use. The spectral subtraction mentioned above was performed to optimize the signal corresponding to AgNP.
After obtaining the background spectrum of the degraded oil sample to analyze, 5 drops of degraded oil were deposited through a syringe onto the AgNP-covered area of the sensing device. The detection sample was allowed to dry for about 1 min and then the absorption spectrum was measured. Before each new measurement, the sensing device was cleaned with heptane until complete removal of waste oil, then rinsed out with ethanol, dried with ultrapure air and, finally, the LSPR of the sensing device was measured again to confirm the same initial conditions for each measurement.

3. Results and Discussion

3.1. FT-IR Analysis

FT-IR evaluation of the three oil degradation parameters are of important interest in the current study given that they are used as a reference and validation method for the measurements obtained with the proposed sensor. Furthermore, the critical values for each one can be found in the literature and serve to establish precautionary and critical values. Once the critical limits were reached or surpassed, the lubricant oil had to be replaced to avoid mechanical damage. These values are enlisted in Table 2 [26,27].
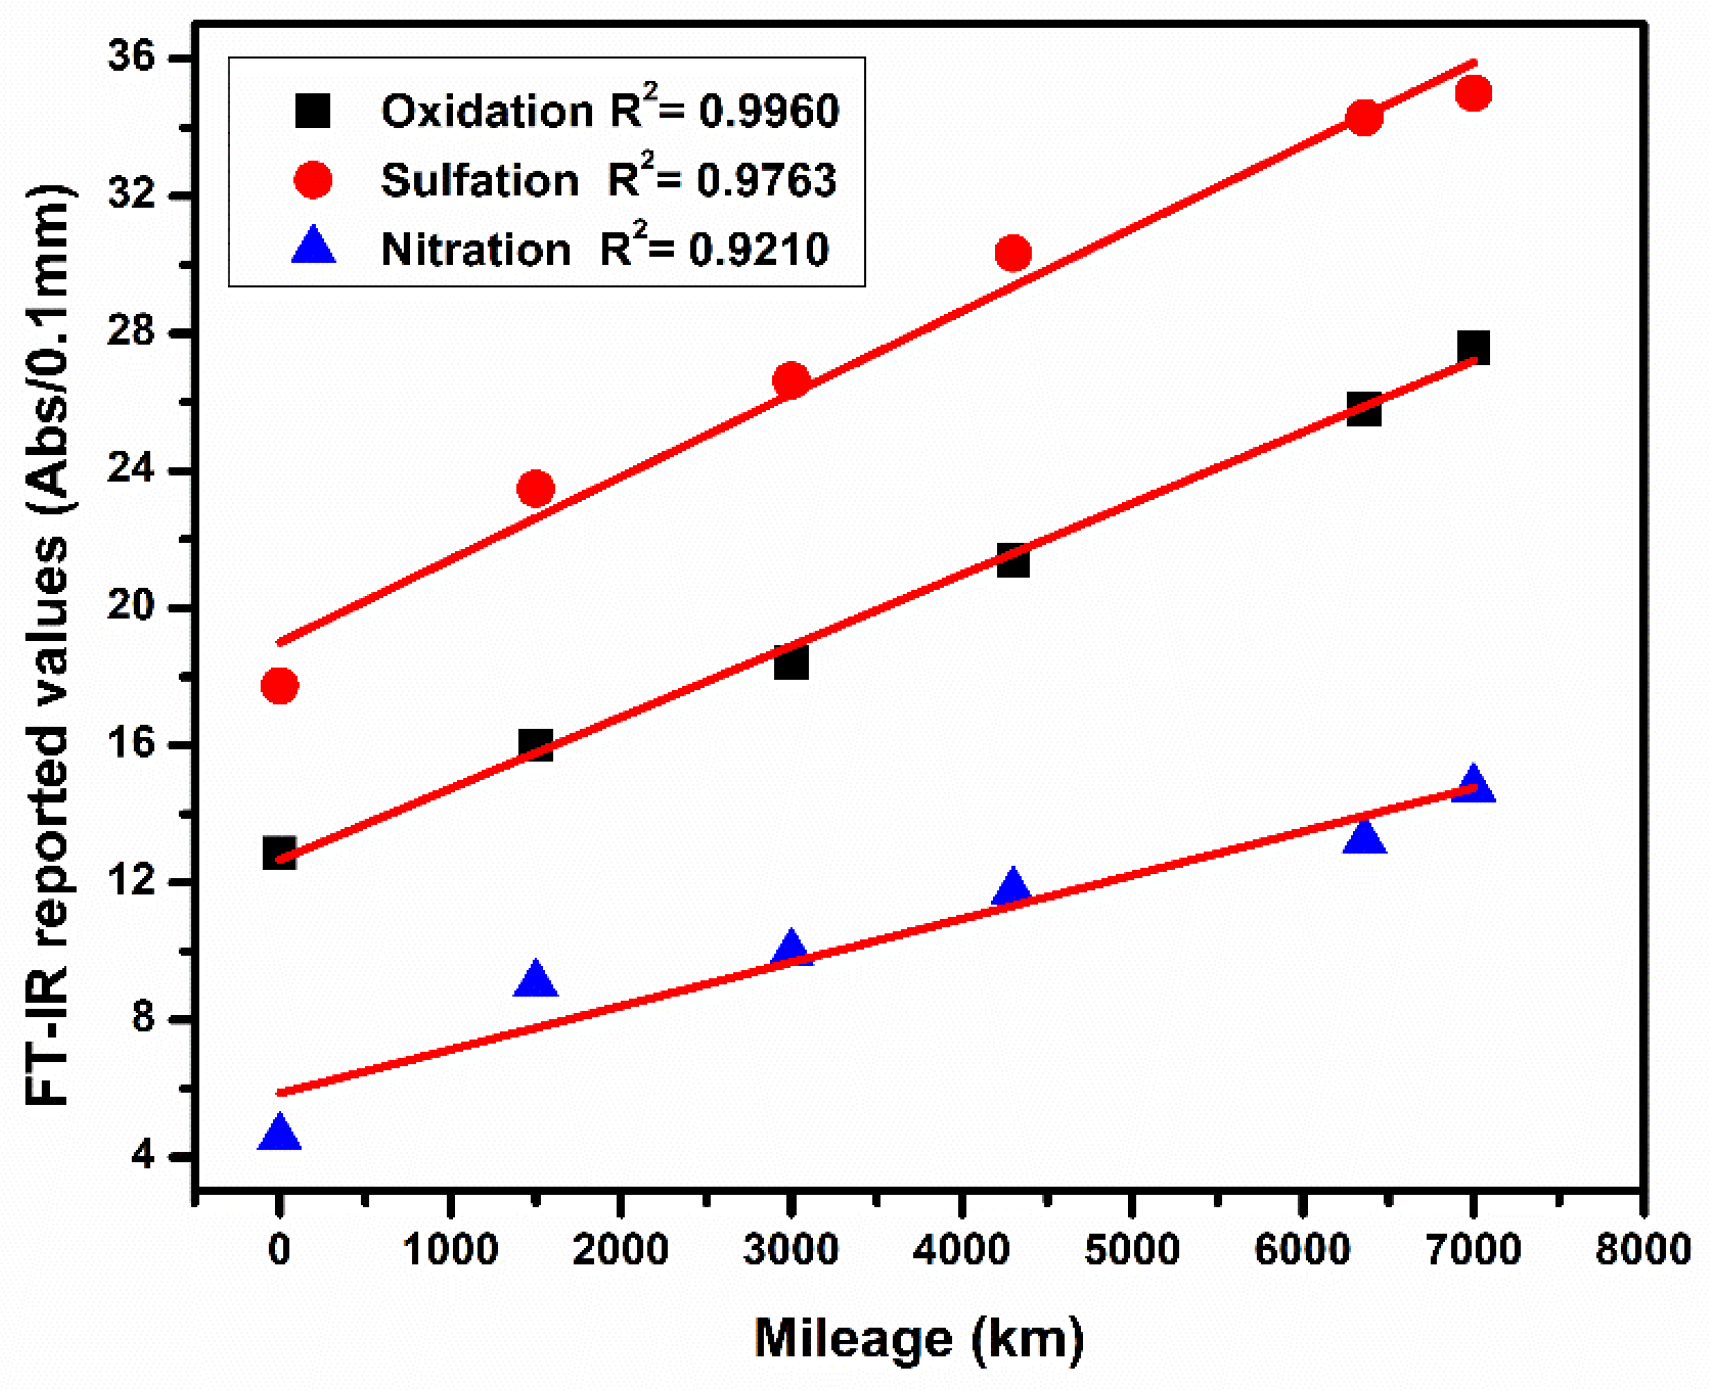
Figure 6 shows the evolution of oxidation, sulfation, and nitration levels of the lubricant at different mileage, obtained according to standard practice ASTM E2412. These measurements represent the main reference to evaluate the quality of the lubricant oil and are useful to correlate and validate the results obtained with the proposed sensor. As expected, all three parameters presented a linear dependence with driving distance given that we were focused on the service life interval of the lubricant recommended by the manufacturer. The linear fit presented good correlation with the experimental data (R2 above 0.9210 for all samples). From the graph it is possible to observe that oxidation level surpassed the critical limits after 6000 km of usage. However, the other two parameters barely reached the critical limits. Considering these results, the oil samples used in this study are useful to evaluate the proposed sensor as they are representative of the different degradation stages of the lubricant. Moreover, its linear behavior with mileage facilitates its future correlation with the obtained results of the plasmonic sensor.

3.2. SEM and EDS

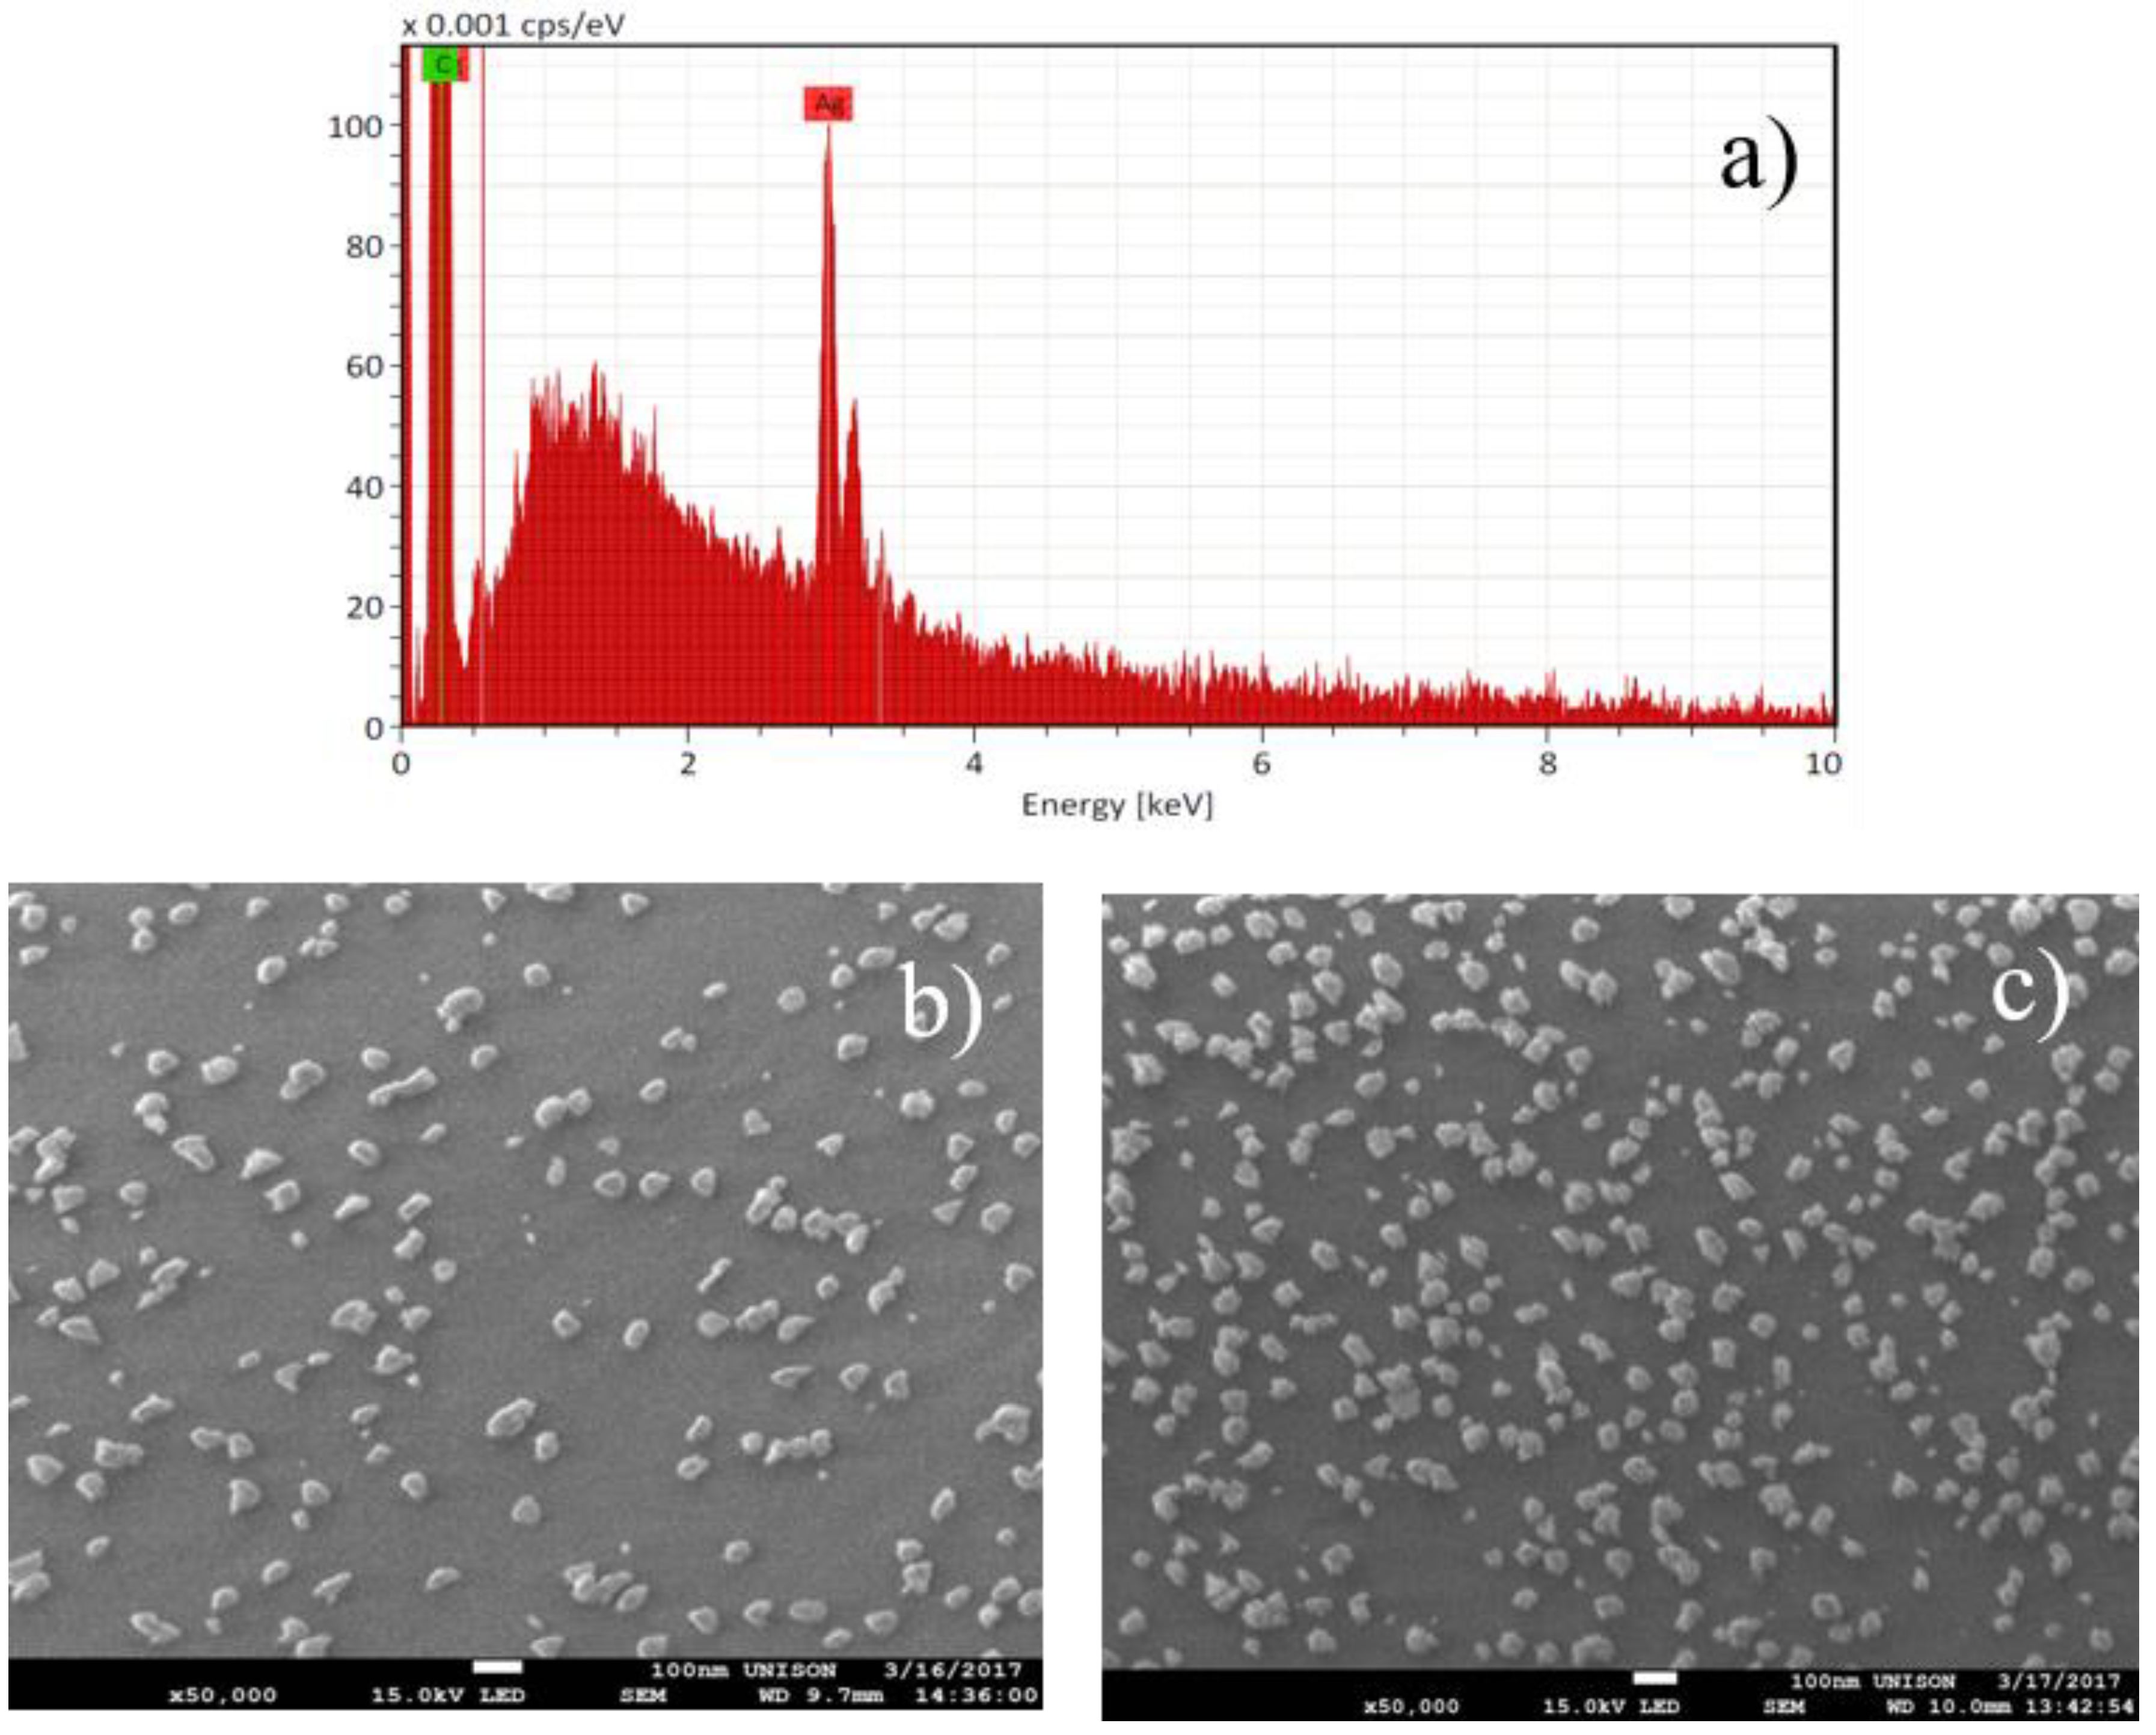
Figure 7a corresponds to the EDS spectrum obtained from the cuvette wall covered with silver nanoparticles. The characteristic X-ray lines around 3 keV confirm the presence of AgNP, while the other peaks that appear, carbon and oxygen, correspond to the chemical composition of the polystyrene cuvette. Figure 7b,c shows the morphology of the AgNP deposited on the polystyrene cell before and after the measurement of an oil sample, respectively. As can be seen, in both micrographs, the size of AgNP is between 50 nm and 90 nm with an irregular shape, homogeneously distributed on the surface of the cuvette, with no apparent variations in the size or shape of the AgNP caused by interaction with the degraded oil. Mayer and Hafner [12] reported that sensors based on the plasmonic properties of nanoparticles tend to be more sensitive with larger nanoparticles, causing a wider LSPR peak, due to multipolar excitation and radiative damping. Therefore, the size of the deposited AgNP was favorable for the sensing purpose.

3.3. UV-Vis Spectroscopy

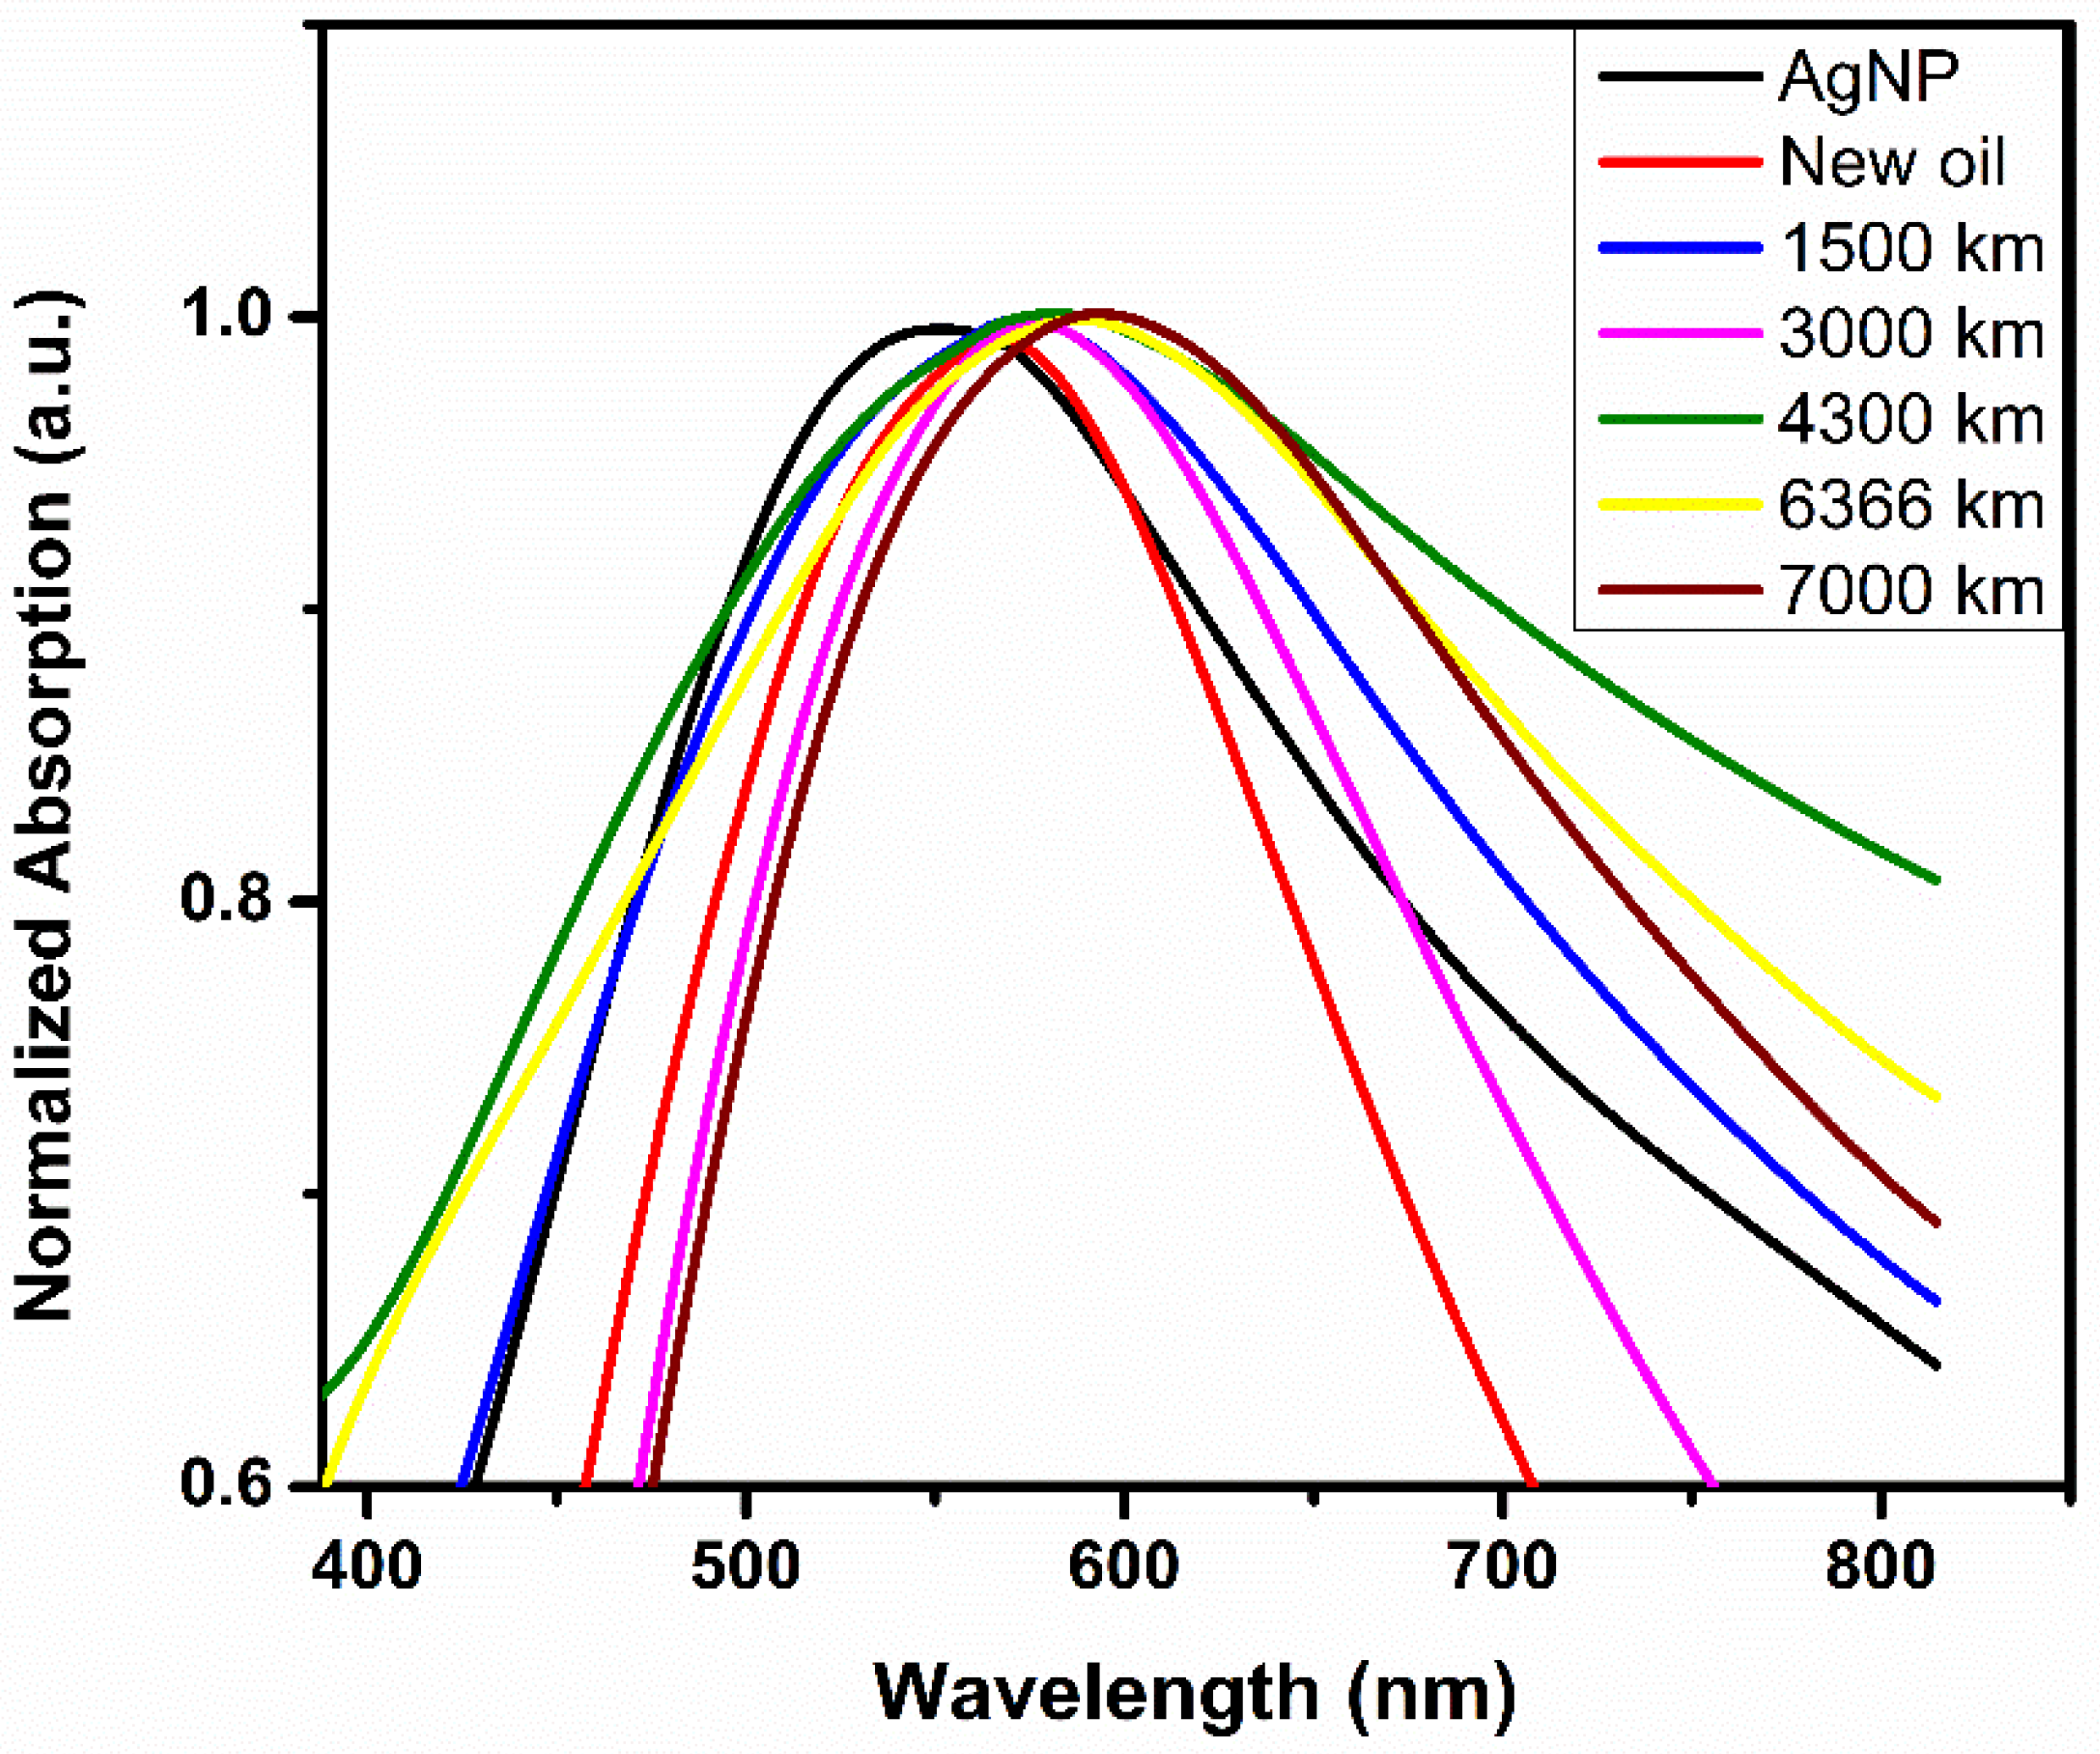
Figure 8 presents the normalized absorption spectra of the six samples of degraded oil. A Gaussian function fit was necessary to obtain the exact LSPR maximum to determine changes in its wavelength caused by different stages of degradation (mileage) in the oil samples. Table 3 shows the results of the Gaussian function fit for all measured samples; the results clearly demonstrate that the LSPR band shifted to higher wavelengths with the increase in mileage. This displacement is associated with changes in the permittivity of the medium as the engine oils degrades [2].
Additional to the displacement of the maximum position, a random variation of the widths of the LSPR bands can be observed in the normalized spectra that could be related with the different oxidation rates of the oil samples. Holland et al. [28] found similar results when they studied the oxidation of engine oil at different oxidation times by means of UV-Vis spectroscopy. They focused on an absorbance band of the engine oil and their results show that not all the widths of the absorbance bands become wider as oxidation increases. They attributed this, in part, to the n – π * transition of the lubricant base oils and additives caused from a decrease in the pH values of the oxidized samples, according to their results of the total base number (TBN). Furthermore, as oxidation increases, multiple conjugated bonds could be broken down at different rates changing the engine oil properties. However, the undesired broadening effect mentioned above did not affect the results obtained with the proposed sensor, which operating principle is the displacement of the LSPR band with the change of the permittivity of the medium, related to oil degradation, as described by Equation (1). Moreover, the broadening effect cannot be associated with morphological changes of the AgNP either, as shown by electron microscopy images obtained before and after the measurement.
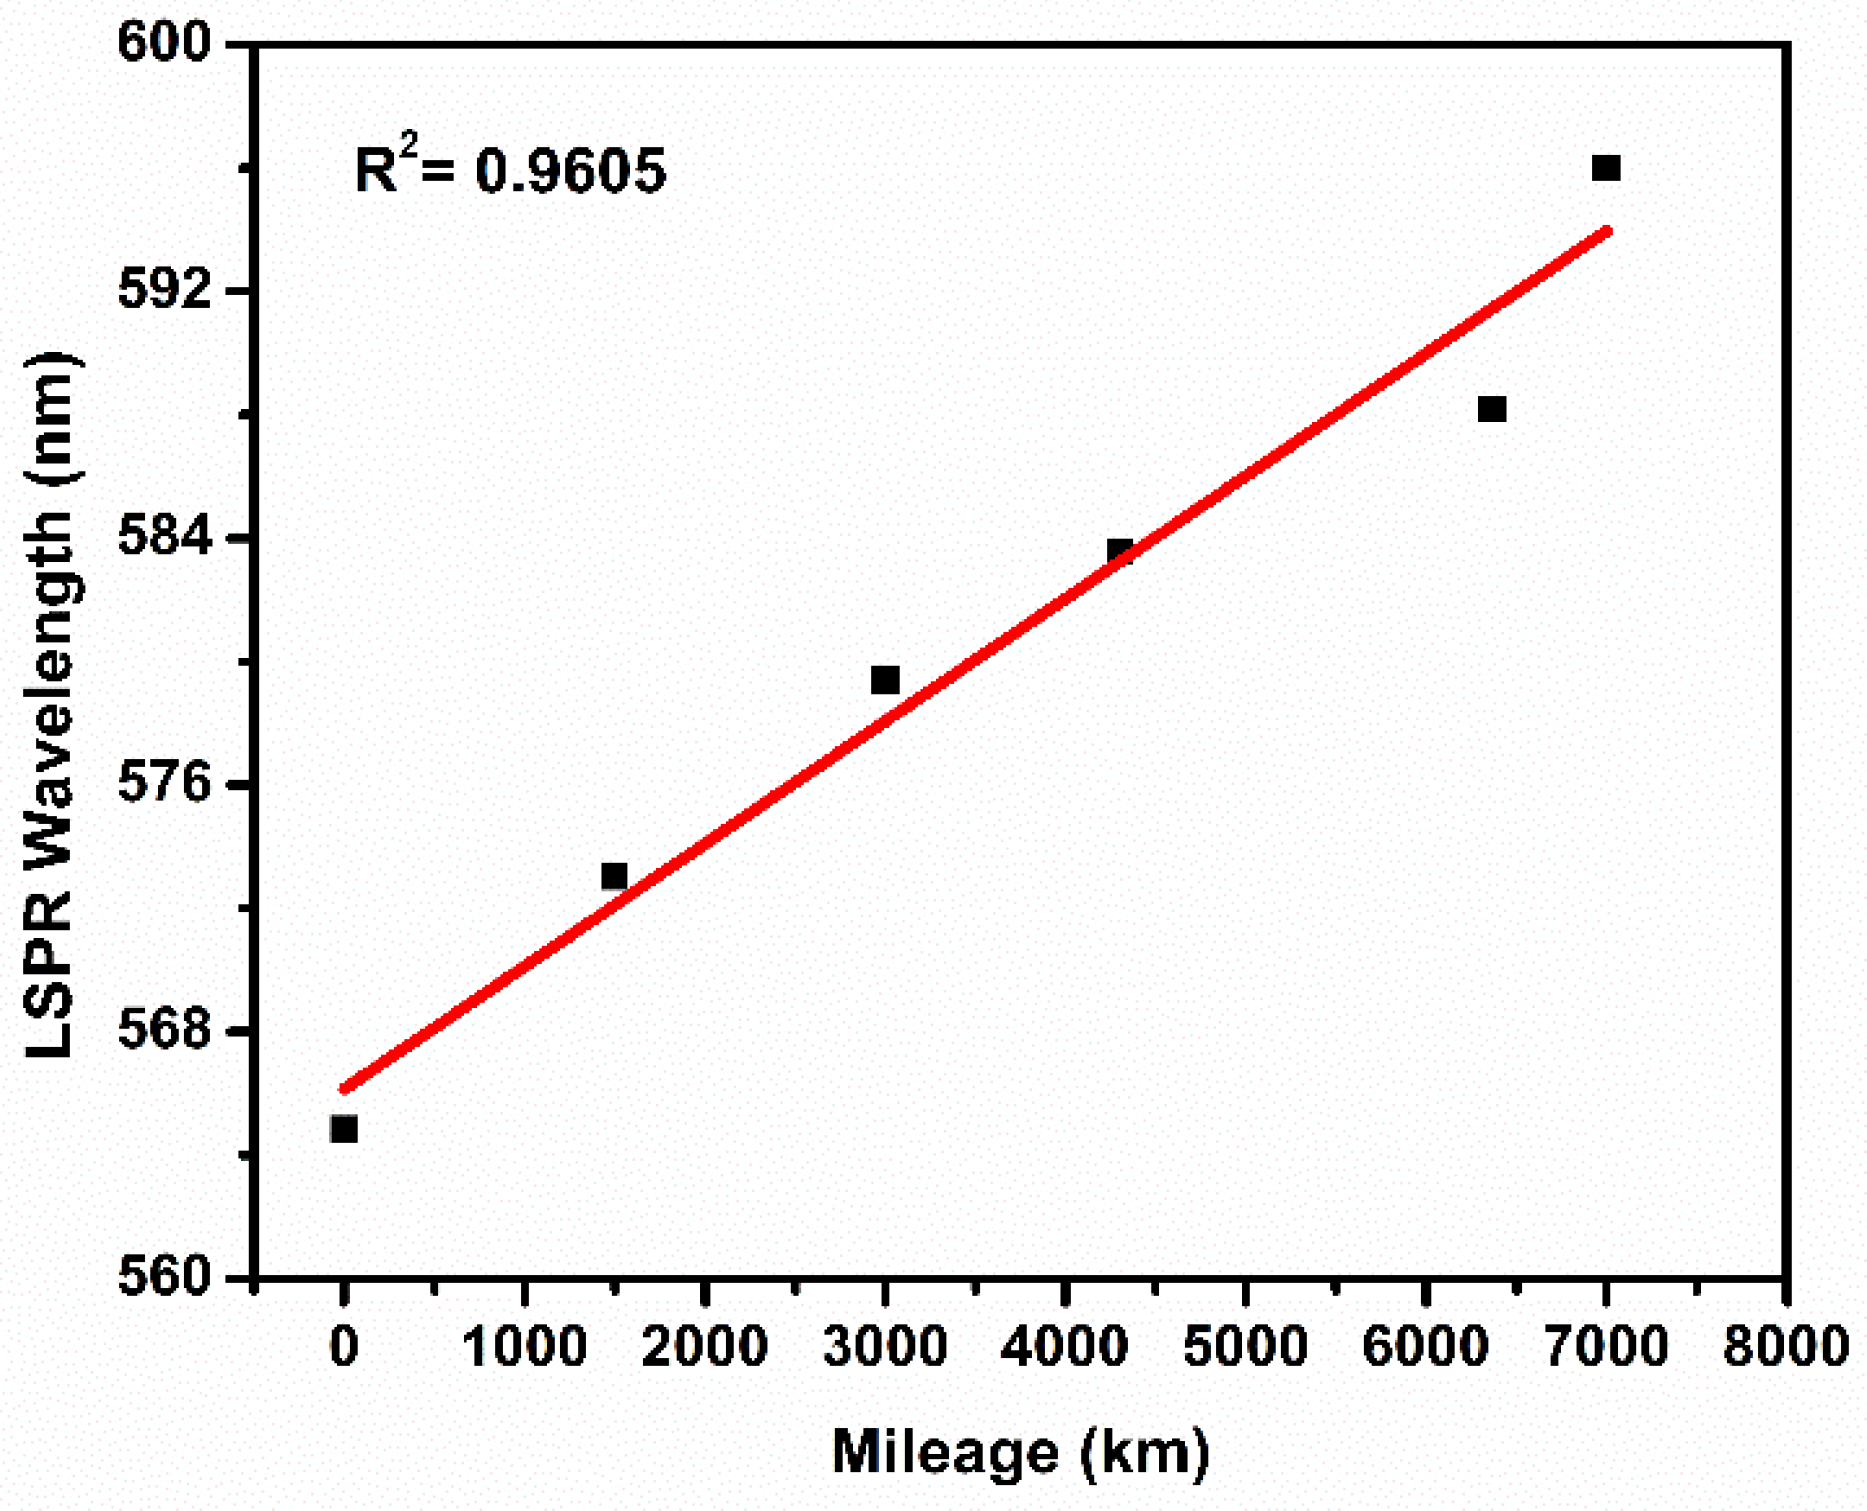
Figure 9 displays a correlation between LSPR peak and mileage, a linear fitting with a R2 = 0.9605 was obtained. This correlation represents an important result to the sensing device due to its capability to detect changes in the oil degradation caused by mileage. Therefore, this facilitates the interpretation of the sensing device to be an option to monitor engine oil condition. Any sudden change in the LSPR peak tendency will involve an abnormal oil degradation process and it would be detected this way.
Mitsushio et al. [29] developed an SPR sensor to detect hydrocarbons and gasoline in engine oils, their sensor was composed of various layers of different materials and a complicated experimental setup. However, they can detect the presence of gasoline at low concentrations and they expected to apply it in areas such as lubricant degeneration detection. Milanese et al. [22] used an SPR sensor to measure lubricant degradation in real-time. The sensor was elaborated with different materials such as silver, gold, copper, and titanium, and a simulation was performed to optimize and select the proper combination of metal. However, only two oil samples were analyzed, 0 and 5700 km. The results showed a variation in the SPR angle that can be detected in real-time. Nonetheless, the equipment used to carry out the measurement was complex and expensive. Aghayan et al. [23] studied the capacity of the SPR sensor to detect contaminants in engine lubricants. They prepared oil samples under artificial degradation, adding gasoline, coolant, and water at different concentrations. Their sensor was able to detect a low concentration of all the contaminants. However, the artificial degradation implies the absence of other mechanisms of degradation during real conditions, so that their SPR sensor needs to be tested under real degradation.

3.4. Correlation between FT-IR and UV-Vis Spectroscopies

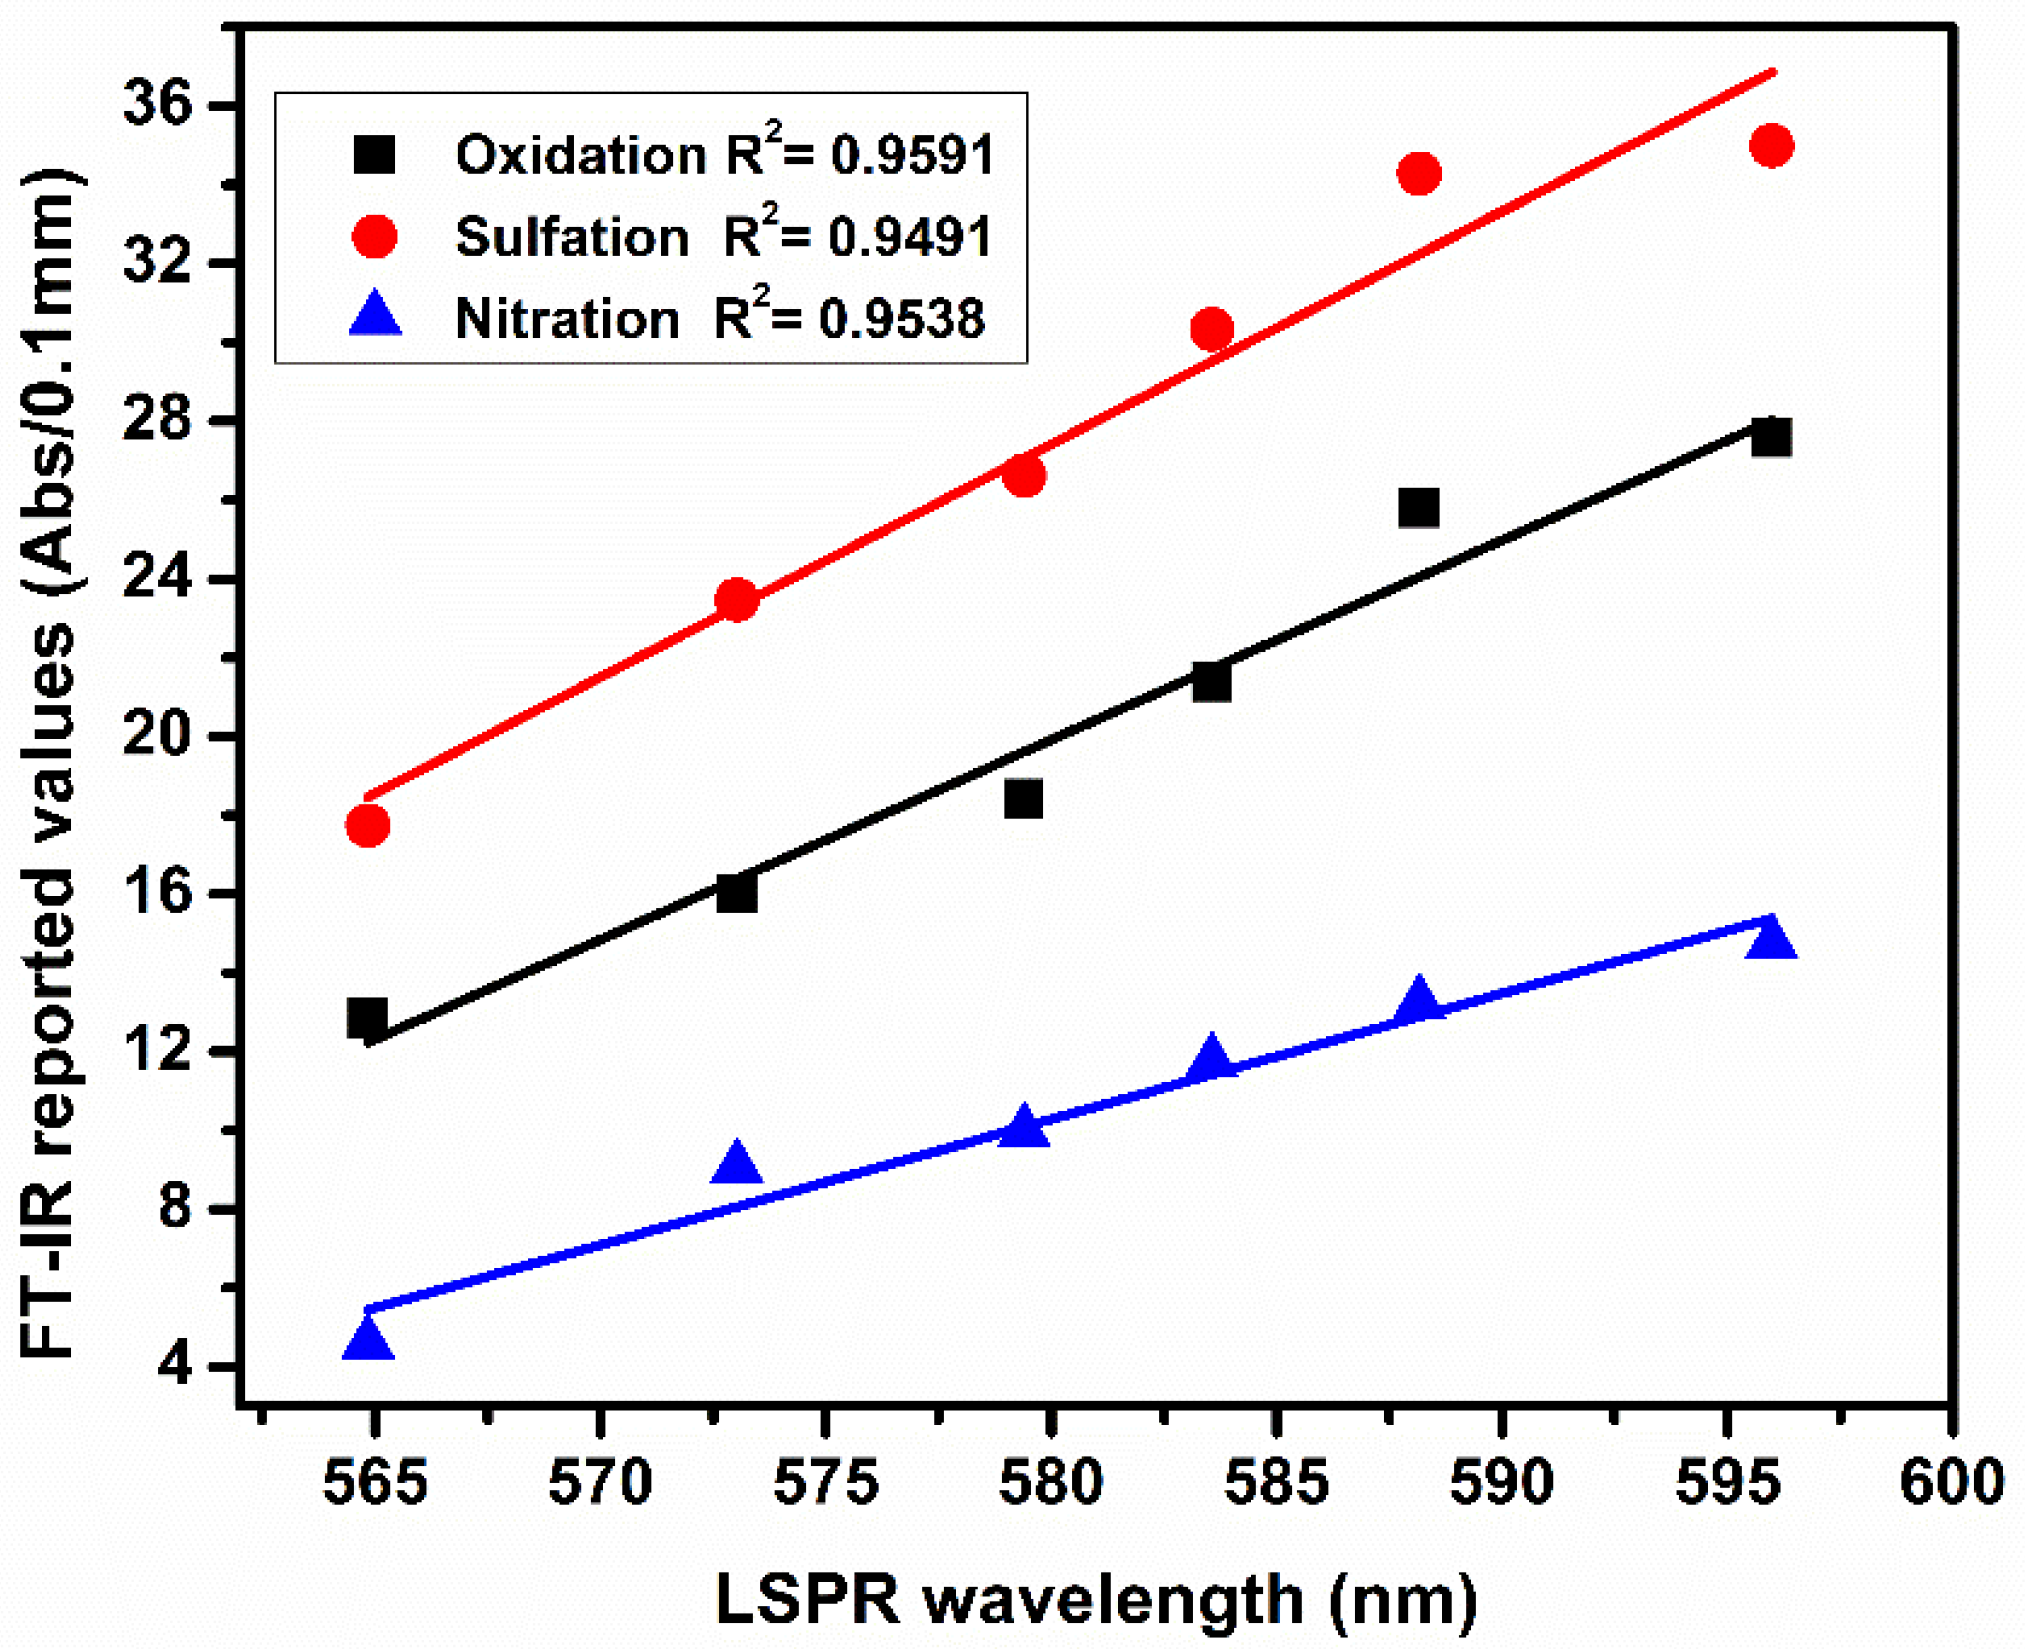
The obtained results from UV-Vis spectroscopy measurements of the degraded oil samples were correlated with the values of the degradation parameters analyzed by FT-IR spectroscopy (Figure 10). The oxidation, sulfation, and nitration levels presented a good correlation and linear trends with a R2 > 0.9491, and the correlation with the chemical properties of the degraded oil gives support and confirms the effectiveness of the sensing device to detect and monitor the evolution of the engine oil degradation process. Since engine oil analysis by FT-IR is a well-established method to evaluate oil condition with critical limits defined in the literature, the oxidation, sulfation, and nitration levels can be described by the displacement of the LSPR band given the good correlation between both methods. Based on the above and considering the linear trends obtained from the different measurements of the specific samples under study, which are in the service life interval of the lubricant recommended by the manufacturer, it is possible to propose that a displacement of the LSPR band beyond 590 nm, using the proposed sensor, will indicate that the lubricant has reached the end of its useful life. However, it is important to mention that the results obtained with this prototype are specific for the system under study and cannot be extrapolated to different vehicles, lubricants, or mileage intervals.

4. Conclusions

The chemical properties of lubricant oil were analyzed by FT-IR spectroscopy according to standard practice ASTM E2412 to evaluate the evolution of oxidation, nitration, and sulfation levels with mileage, as the reference and validation method for the proposed sensor, of which the results were further correlated. The response of the LSPR sensor during the study of degraded oil at different mileage resulted in a notorious displacement to higher wavelengths of the LSPR band as mileage (oil degradation) increases. The plot of the LSPR band position as a function of mileage presented a linear behavior with a coefficient of determination above 0.9605. The correlation between the chemical properties obtained by FT-IR analysis and the LSPR band position exhibited a linear trend with good coefficients of determination, above 0.9491 for the three parameters under study, which confirms the effectiveness and feasibility of the proposed sensor based on the LSPR of AgNP to detect changes in the chemical properties of lubricating oils. Finally, under the experimental conditions described above, a displacement of the LSPR band position beyond 590 nm can be proposed as an indicator that suggests the end of the useful life of the lubricant. However, a more extensive and detailed work is needed to extrapolate the results herein reported to different types of lubricants, vehicles, and mileage intervals.

5. Patents

This research is in the patent process in Mexico under the ID MX/a/2017/013398.

Author Contributions

Conceptualization, M.E.Á.-R. and F.F.-D.; Methodology, J.A.H.-C., F.F.-D., R.C.C.-T., and M.E.Á.-R.; Investigation, J.A.H.-C. and R.C.C.-T.; Resources, M.E.Á.-R.; Writing—original draft preparation, J.A.H.-C.; Writing—review and editing, J.A.H.-C. and R.C.C.-T.; Supervision, M.E.Á.-R. All authors have read and agreed to the published version of the manuscript.

Funding

This research received no external funding.

Institutional Review Board Statement

Not applicable.

Informed Consent Statement

Not applicable.

Data Availability Statement

Data available on request due to privacy/ethical restrictions. The data presented in this study are available on request from the corresponding authors. The data are not publicly available due to their containing information that could compromise the privacy of research participants.

Acknowledgments

The art assistance of Raúl Sempoal is acknowledged.

Conflicts of Interest

The author declares no conflict of interest.

References

  1. Ricciardi, A.; Colombelli, A.; Montagna, G.; Manera, M.G.; MIlanese, M.; De Risi, A.; Rella, R. Surface plasmon resonance optical sensors for engine oil monitoring. In Sensors; Springer: Cham, Switzerland, 2015; pp. 115–118. [Google Scholar]
  2. Heredia-Cancino, J.; Carrillo-Torres, R.; Munguía-Aguilar, H.; Álvarez-Ramos, M. An innovative method to reduce oil waste using a sensor made of recycled material to evaluate engine oil life in automotive workshops. Environ. Sci. Pollut. Res. 2020, 27, 28104–28112. [Google Scholar] [CrossRef]
  3. Gong, Y.-Z.; Guan, L.; Wang, L.-G.; Liu, H.-C. Dielectric submicroscopic phase characterisation of engine oil dispersed in jet fuel based on on-line dielectric spectroscopy. Lubr. Sci. 2017, 29, 335–354. [Google Scholar] [CrossRef]
  4. Balashanmugam, V.; Gobalakichenin, D. Development of dielectric sensor to monitor the engine lubricating oil degradation. Therm. Sci. 2016, 20, 1061–1069. [Google Scholar] [CrossRef]
  5. Adams, M.J.; Romeo, M.J.; Rawson, P. FTIR analysis and monitoring of synthetic aviation engine oils. Talanta 2007, 73, 629–634. [Google Scholar] [CrossRef]
  6. Rudnick, L.R. Lubricant Additives, Chemistry and Application; Taylor and Francis: Boca Raton, FL, USA, 2003. [Google Scholar]
  7. Wooton, D. The lubricant’s nemesis—Oxidation. Pract. Oil Anal. 2007, 9, 5–6. [Google Scholar]
  8. Collister, C.J. Electrical measurement of oil quality. U.S. Patent 6459995B1, 1 October 2002. [Google Scholar]
  9. ASTM E2412-10. Standard Practice for Condition Monitoring of Used Lubricants by Trend Analysis Using Fourier Transform Infrared (FT-IR) Spectrometry; ASTM International: West Conshohocken, PA, USA, 2010. [Google Scholar]
  10. Adbul-Munaim, A.M.; Reuter, M.; Koch, M.; Watson, D.G. Distinguishing Gasoline Engine Oils of Different Viscosities Using Terahertz Time-Domain Spectroscopy. J. Infrared Millim. Terahertz Waves 2015, 36, 687–696. [Google Scholar] [CrossRef] [Green Version]
  11. Soleimani, M.; Sophocleous, M.; Glanc, M.; Atkinson, J.; Wang, L.; Wood, R.J.K.; Taylor, R.I. Engine oil acidity detection using solid state ion selective electrodes. Tribol. Int. 2013, 65, 48–56. [Google Scholar] [CrossRef] [Green Version]
  12. Mayer, K.M.; Hafner, J.H. Localized surface plasmon resonance sensors. Chem. Rev. 2011, 111, 3828–3857. [Google Scholar] [CrossRef] [PubMed]
  13. Cathcart, N.; Coombs, N.; Gourevich, I.; Kitaev, V. Synthesis and sensing properties of D5h pentagonal silver star nanoparticles. Nanoscale 2016, 8, 18282–18290. [Google Scholar] [CrossRef] [PubMed]
  14. Mock, J.J.; Smith, D.R.; Schultz, S. Local Refractive Index Dependence of Plasmon Resonance Spectra from Individual Nanoparticles. Nano Lett. 2003, 3, 485–491. [Google Scholar] [CrossRef]
  15. Ma, W.; Yang, H.; Wang, W.; Gao, P.; Yao, J. Ethanol Vapor Sensing Properties of Triangular Silver Nanostructures Based on Localized Surface Plasmon Resonance. Sensors 2011, 11, 8643. [Google Scholar] [CrossRef] [Green Version]
  16. Zhang, T.; Song, Y.-J.; Zhang, X.-Y.; Wu, J.-Y. Synthesis of Silver Nanostructures by Multistep Methods. Sensors 2014, 14, 5860. [Google Scholar] [CrossRef] [PubMed]
  17. Cheng, C.S.; Chen, Y.Q.; Lu, C.J. Organic vapour sensing using localized surface plasmon resonance spectrum of metallic nanoparticles self assemble monolayer. Talanta 2007, 73, 358–365. [Google Scholar] [CrossRef] [PubMed]
  18. Dubas, S.T.; Pimpan, V. Green synthesis of silver nanoparticles for ammonia sensing. Talanta 2008, 76, 29–33. [Google Scholar] [CrossRef] [PubMed]
  19. Mack, N.H.; Wackerly, J.W.; Malyarchuk, V.; Rogers, J.A.; Moore, J.S.; Nuzzo, R.G. Optical transduction of chemical forces. Nano Lett. 2007, 7, 733–737. [Google Scholar] [CrossRef] [PubMed]
  20. Ahmed, S.W.; Anwar, H.; Siddiqui, A.; Shah, M.R.; Ahmed, A.; Ali, S.A. Synthesis and chemosensing of nitrofurazone using olive oil based silver nanoparticles (O-AgNPs). Sens. Actuators B Chem. 2018, 256, 429–439. [Google Scholar] [CrossRef]
  21. Álvarez-Ramos, M.E.; Necochea-Chamorro, J.I.; Carrillo-Torres, R.C.; Sánchez-Zeferino, R. Room temperature CO2 sensing using Au-decorated ZnO nanorods deposited on an optical fiber. Mater. Sci. Eng. B 2020, 262, 114720. [Google Scholar] [CrossRef]
  22. Milanese, M.; Ricciardi, A.; Manera, M.G.; Colombelli, A.; Montagna, G.; de Risi, A.; Rella, R. Real time oil control by surface plasmon resonance transduction methodology. Sens. Actuators A Phys. 2015, 223, 97–104. [Google Scholar] [CrossRef]
  23. Aghayan, H.R.; Bordatchev, E.V.; Yang, J. Experimental characterization of contaminants in engine lubricants using surface plasmon resonance sensing. Ind. Lubr. Tribol. 2013, 65, 61–68. [Google Scholar] [CrossRef]
  24. Félix-Domínguez, F.; Carrillo-Torres, R.C.; Lucero-Acuña, A.; Sanchez-Zeferino, R.; Álvarez-Ramos, M. Seedless synthesis of silver nanoparticles using sunlight and study of the effect of different ratios of precursors. Mater. Res. Express 2019, 6, 045067. [Google Scholar] [CrossRef]
  25. Jensen, T.R.; Duval, M.L.; Kelly, K.L.; Lazarides, A.A.; Schatz, G.C.; Van Duyne, R.P. Nanosphere Lithography:  Effect of the External Dielectric Medium on the Surface Plasmon Resonance Spectrum of a Periodic Array of Silver Nanoparticles. J. Phys. Chem. B 1999, 103, 9846–9853. [Google Scholar] [CrossRef]
  26. Trujillo, G. Resetting Oil Analysis Parameters for Changing Diesel Engines. In Practicing Oil Analysis January 2004; Noria Publication: Tulsa, OK, USA, 2004. [Google Scholar]
  27. Mayer, A. Limits—The Robots of Oil Analysis; Technical Buletin; WearCheck: Westmead, Pinetown, RSA, 2010. [Google Scholar]
  28. Holland, T.; Abdul-Munaim, A.M.; Mandrell, C.; Karunanithy, R.; Watson, D.G.; Sivakumar, P. UV-Visible Spectrophotometer for Distinguishing Oxidation Time of Engine Oil. Lubricants 2021, 9, 37. [Google Scholar] [CrossRef]
  29. Mitsushio, M.; Uchiyama, E.; Kajiya, R.; Yoshidome, T.; Nakatake, S.; Higo, M. Separation and Detection of Hydrocarbons and Gasoline in Automotive Engine Oil Using a Teflon (R) AF2400-coated Gold deposited Surface Plasmon Resonance-based Glass Rod Sensor. Anal. Sci. 2018, 34, 1085–1091. [Google Scholar] [CrossRef] [PubMed] [Green Version]
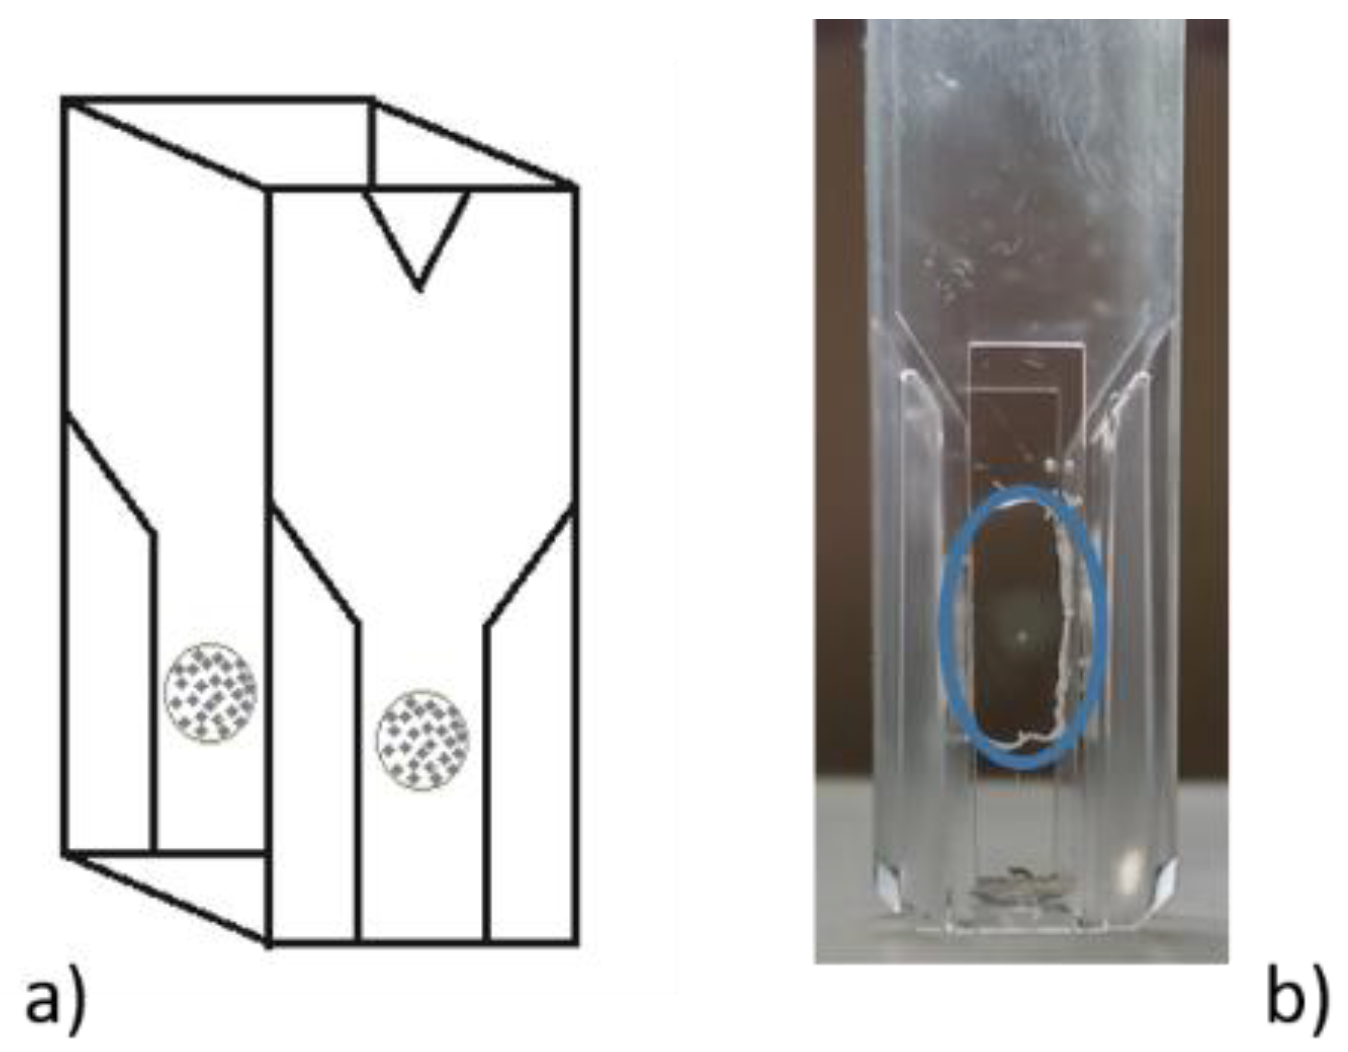
Figure 1. (a) Schematic representation of the covered areas on polystyrene cuvette, (b) photograph of the cuvette after the deposition process, used for the experimental tests.
Applsci 11 08518 g001
Figure 2. Experimental setup of the LSPR sensing technique.
Applsci 11 08518 g002
Figure 3. FT-IR spectra of all samples and identification of the vibrational bands used for the determination of oxidation, nitration, and sulfation levels.
Applsci 11 08518 g003
Figure 4. LSPR response of the AgNP deposited on polystyrene cuvette.
Applsci 11 08518 g004
Figure 5. Absorbance spectra of new and used oil.
Applsci 11 08518 g005
Figure 6. Evolution of lubricant oil degradation parameters plotted as function of mileage. Red lines represent linear fits of the experimental data, coefficients of determination (R2) for each degradation parameter are showed in the inset.
Applsci 11 08518 g006
Figure 7. (a) EDS spectrum of the covered area on the polystyrene surface. It confirms the presence of AgNP. SEM micrographs of the AgNP deposited on polystyrene cell before (b) and after (c) measuring all the oil samples, no apparent variation in size or shape caused by interaction with degraded oil can be observed.
Applsci 11 08518 g007
Figure 8. Normalized absorption spectra of AgNP and six degraded oil samples measured in the sensing prototype.
Applsci 11 08518 g008
Figure 9. Displacement of the LSPR band position with mileage. Red line represents a linear fit of the experimental data.
Applsci 11 08518 g009
Figure 10. Correlation between FT-IR and LSPR wavelength, colored lines represent linear fittings of the experimental data.
Applsci 11 08518 g010
Table 1. Oil samples with their respective driving distance.
Mineral Oil 15W-40
SampleDriving Distance (km)
10
21500
33000
44300
56366
67000
Table 2. Critical limits of the three lubricant oil degradation parameters under study [26,27].
TestCritical Limits (Abs/0.1 mm)
Oxidation23–25
Sulfation30–40
Nitration14
Table 3. LSPR band maximum position of AgNP alone and after interaction with the oil samples and coefficients of determination obtained from the Gaussian fit applied to each spectrum.
SampleBand Maximum (nm)R2
AgNP552.50.9922
0 km564.80.9926
1500 km573.00.9834
3000 km579.40.9860
4300 km583.60.9838
6366 km588.20.9883
7000 km596.00.9945
Publisher’s Note: MDPI stays neutral with regard to jurisdictional claims in published maps and institutional affiliations.