Abstract
Background: The purpose of this in vitro study was to compare the implant axis’ spatial position and orientation by using laboratory scanner versus intra-oral scanner with three different scan abutments. Methods: A 3D model was printed with an internal hex implant analog in the place of teeth 35#. Three standard scan abutments were used: MIS (two-piece titanium), AB (two-piece PEEK and titanium base) and ZZ (one-piece PEEK). Each scan abutment was scanned 30 times by TRIOS E3 (laboratory scanner) and 30 times by Omnicam (intra-oral scanner). For each scan, an STL (stereolithography) file was created, and the spatial characterization of each scan abutment was measured in the X, Y, Z coordinates, and rotational and longitudinal angles. The comparison between all the scans was conducted by superimposition of the STL files, using a 3D software. A t-test and Wilcoxon signed-rank test were used. (p < 0.05) Results: Only the MIS scan abutment showed no statistical difference in the X and Z axes. (p < 0.05). All other scan abutments showed a statistical difference in all axes. The rotational angle of the AB scan abutment was twice the angle of the MIS and ZZ scan abutments. Conclusions: All three scan abutments showed a rotational deviation of the implant axis between the laboratory scanner and the intra-oral scanner. The AB scan abutment showed the greatest deviation (1.04 degrees) while the other two abutments showed deviations of about half a degree in relation to the laboratory scan abutment. There is a need for further studies which will examine the influence of geometry, material, and scan abutment parts on the accuracy of the scan obtained.
Keywords:
CAD-CAM; scan abutment; implant axis; laboratory scanner; intra-oral scanner; TRIOS; CEREC 1. Introduction
At present, digital scanning technology is in common use both for teeth and implants. There are many advantages associated with intra-oral digital impressions, including: reduced distortion from impression materials and plasters, less chair time, acquisition of digital file, improved patient comfort and the ability to take passive impressions [1,2,3,4]. There are two possible methods for taking a digital impression: indirect (laboratory scanner), where the lab scans either the impression or the model, or direct (intra-oral scanner) using chair-side scanning [5]. Yet many dentists continue using traditional impression methods for implants and teeth [6,7,8,9]. Chochlidakis et al. examined digital impressions versus conventional and showed both methods yield similar marginal fits; in the case of implants, digital impressions are more accurate for single crowns, however, cross-arch scanning for multiple unit bridges remains questionable [10].
A digital STL file is a CAD mesh which transmits the three-dimensional scan with a high degree of accuracy, from which the final work can be designed [11]. The scan abutments for digital impressions are commonly made from polyether ether ketone (PEEK), titanium type 5 or combination of both [12]. The geometry of the scan abutment is different between the commercial companies and important for accurately conveying the position and the orientation of the implant. The data derived from the scan abutment are analyzed by the software to define the longitudinal, vertical, and rotational axis of the implant [13]. According to a study by Sialdat et al., scan abutments attached to implants by an internal hexagon show less rotational movement than external connection [14,15]. Moreover, they concluded that the marginal fit of the prosthetic is better than that of those with an external hexagonal design. The laboratory scanner provides a higher degree of accuracy compared to the intra-oral scanner and, therefore, serves as gold standard in comparison to intra-oral scanners [16].
There are several terms relating to the digital files [17], between them: Value—a quantitative characterization; Trueness—Proximity between the expectation of a particular test result/measurement and the true value; Precision—Proximity between independent test results; Accuracy: the results will be close to each other and close to the target.
It is clinically important to capture the implant axis as accurately as possible because it influences the design and manufacturing of the restoration, for example: passive fit, contact areas and occlusal contacts. In recent years, there has been a marked improvement in the impression techniques as well as in prosthetic fabrication, such that the difference in passive seating between cemented and screw-retained crowns has become an insignificant factor [18].
To date, studies have compared the differences between digital impressions using scan abutments and conventional impressions using impression copings, and even these studies have not given unequivocal answers [19]. The purpose of this study was to evaluate the position and orientation of the implant comparing laboratory scanning (gold standard) versus intra-oral scanning with three different scan abutments. The null hypotheses were that no difference will be found between the intra-oral scanner compared to the laboratory scanner by using three different scan abutments.
2. Materials and Methods
For the purpose of this research, a resin V-Print model was printed by SolFlex 650 * 350 3D printer (VOCO GmbH, Heidelberg, Germany). In place of tooth #35, we used a MIS standard internal hex implant analog, 3.75 mm/11.5 mm. Three scanning abutments were used (Figure 1):
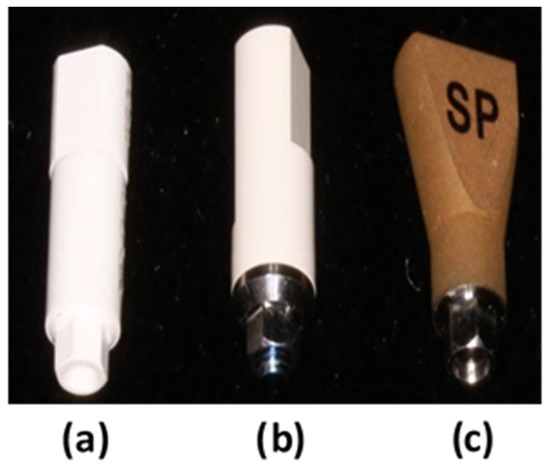
Figure 1.
Scan abutments from left to right: (a) Zirkonzahn (ZZ), (b) Alpha Bio (AB), and (c) MIS.
- MIS scan abutment (titanium, two-piece), asymmetrical geometry, internal hex connection.
- Alpha Bio (AB) scan abutment (PEEK and titanium, two-piece) cylindrical/asymmetric geometry, internal hex connection.
- Zirkonzahn (ZZ) scan abutment (PEEK, one-piece), cylindrical/asymmetric geometry, internal hex connection.
All scan abutments were screwed to the analog with electronic implant prosthetic screwdriver iSD900 (NSK®, Osaka, Japan) at 25 N.cm. Each of the three scan abutments were scanned with a TRIOS E2 (3Shape®, Copenhagen, Denmark) laboratory desktop scanner, a QR file was created and then converted to STL file. This scanner and the resulting scans are considered the gold standard in terms of accuracy [17]. The in vitro intra-oral scans were performed with an Omnicam (CEREC® AC Omnicam; Dentsply Sirona, Milford, DE, USA) scanner using the same scanning protocol suggested by Sirona. All scan abutments were scanned 30 times, and for each scan a STL file was created. The comparison between all the scans was conducted by digital software (PolyWorks®; InnovMetric, Québec QC, Canada) using the best-fit method. This method constructed our alignment from surface points or edge points and used axial constraints to optimize the results.
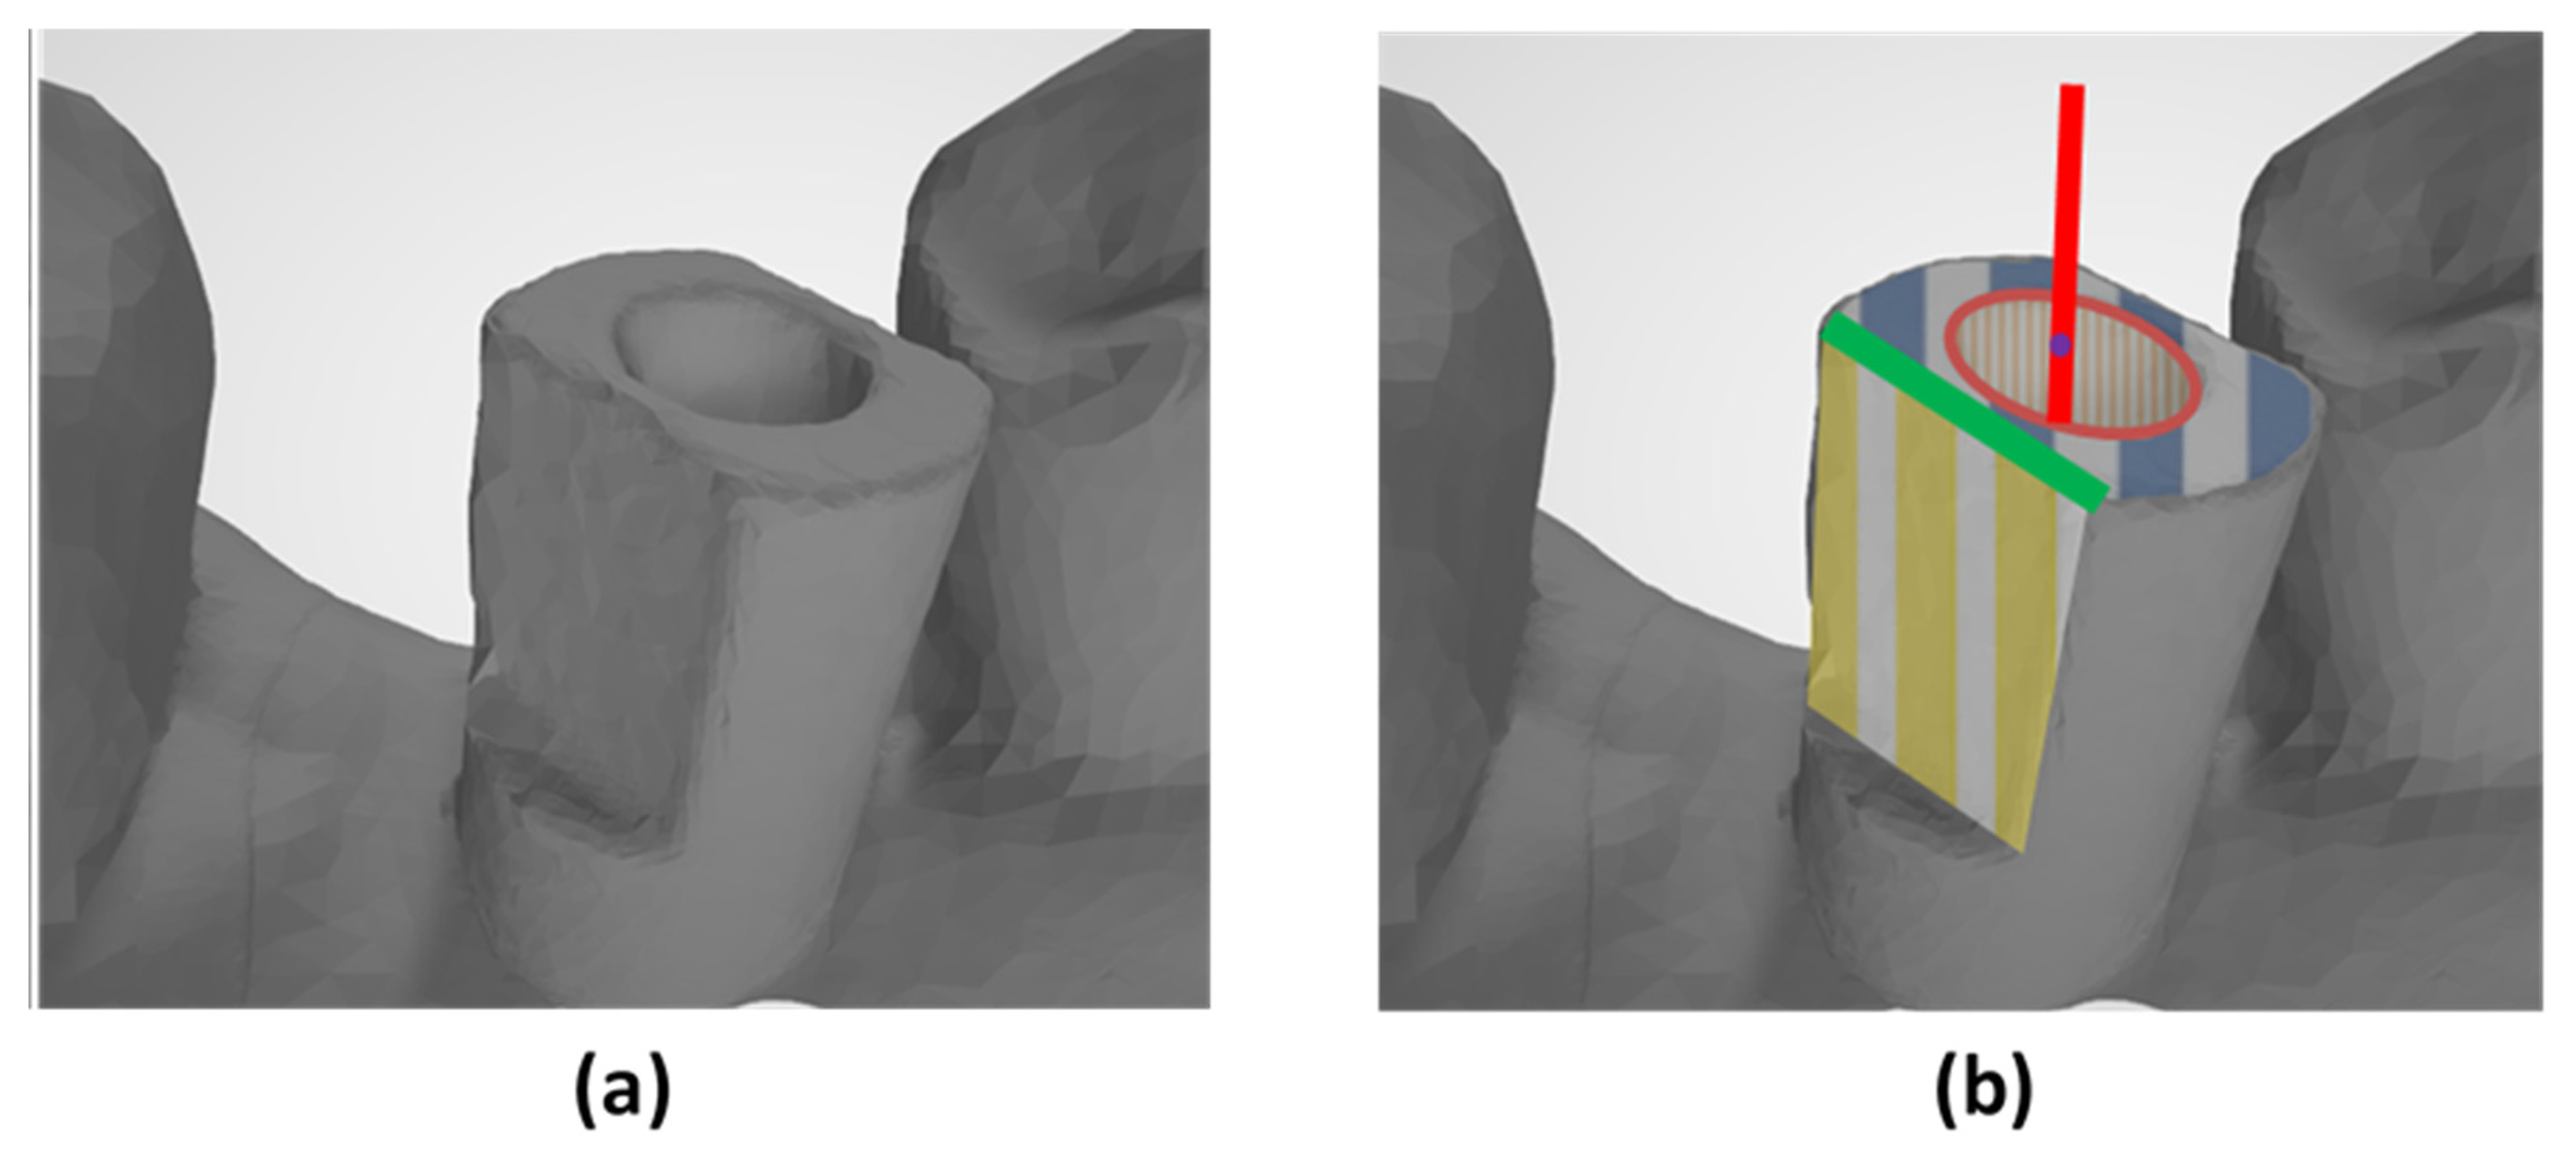
The various scan abutments have different geometries, yet all three have an internal cylinder, a flat occlusal surface and at least one flat side surface. Using these common characteristics, we have a basis for comparing these abutments. (Figure 2):

Figure 2.
(a) Illustrates the Alpha Bio pin scanned image. (b) Illustrates the key features of the scanning pin. Orange—the internal cylinder. Red—the longitudinal axis of the scan abutment. Purple dot—the center of the occlusal surface (blue). The intersection of the occlusal surface (blue) and the side surface (yellow) gives us the straight edge (green), used for calculating the angle of rotation.
- Longitudinal axis of the scanning abutments is defined by the axis of the associated best-fitted cylinder to the abutment.
- The point of intersection between the longitudinal axis and the best-fitted associated top surface of the scanning abutment is the center of the top (occlusal) surface.
- The intersection between the top best-fitted (occlusal) surface and the best-fitted flat side surface is a straight edge. Based on this straight edge, we can calculate the angle of rotation of the scanning abutment (the angle of the scanning abutments relative to its longitudinal axis).
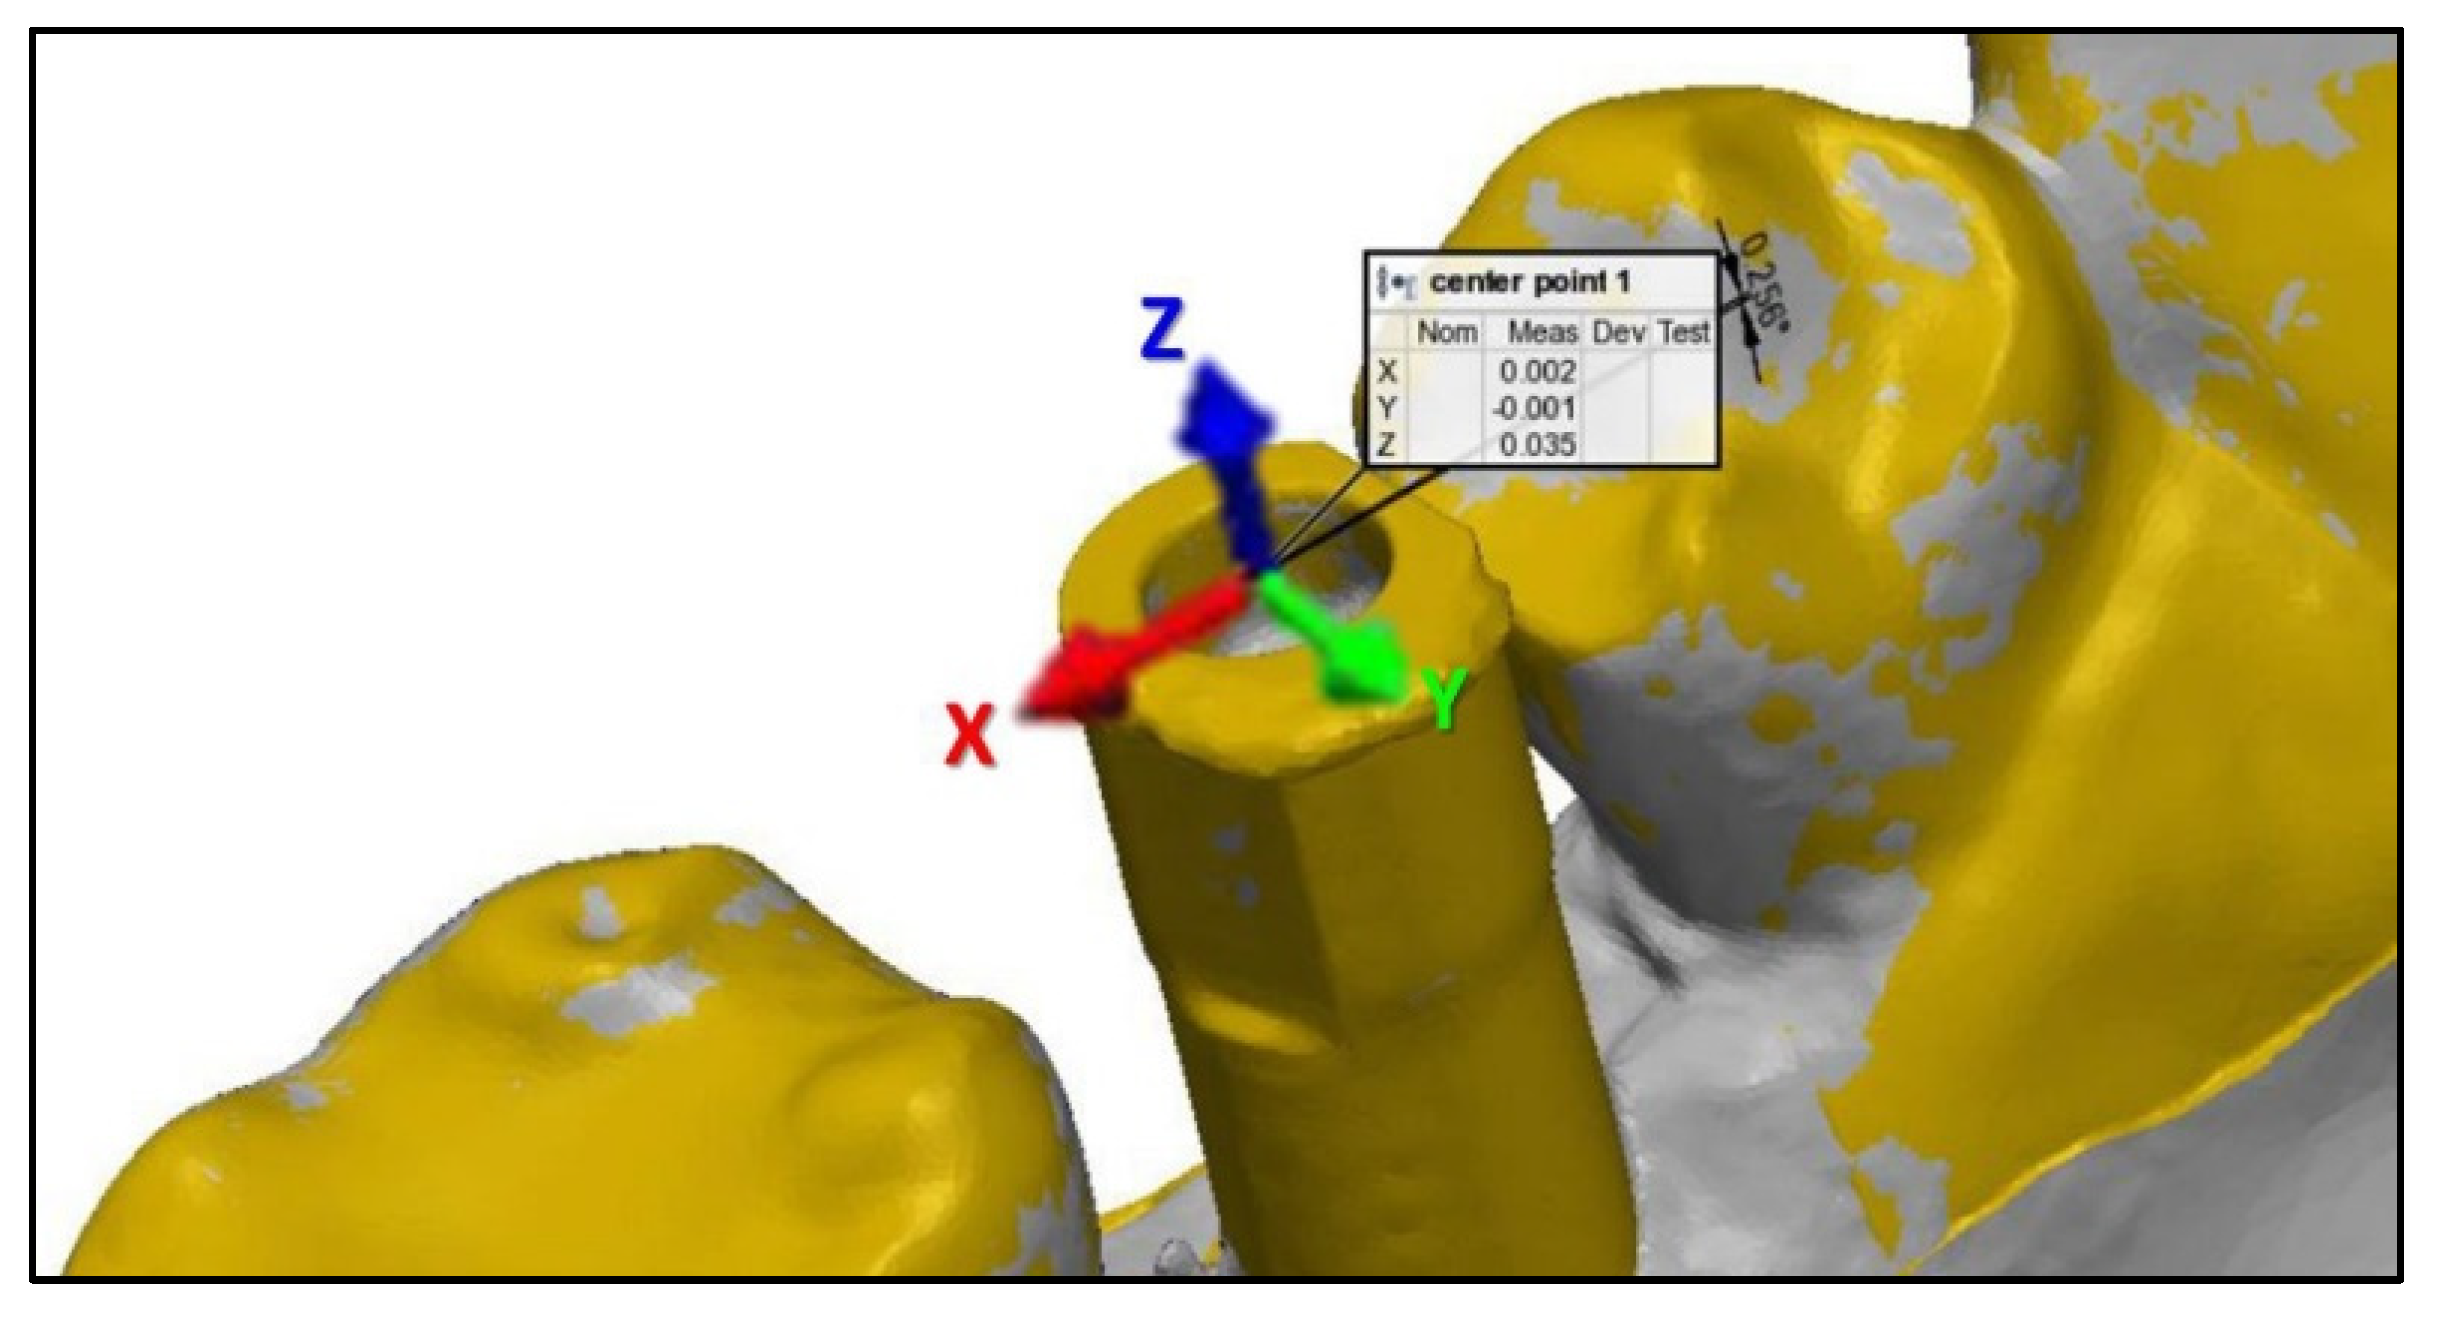
For every type of scanning abutment, we have defined a system of axes that originates in the center of the upper surface. The X-axis is defined in the mesial–distal plane, where the positive inclination is distal. The Y-axis is defined in the buccal–lingual plane where the positive inclination is lingual. The Z-axis is defined in the incisal–gingival plane, where the positive inclination is incisal (Figure 3).

Figure 3.
Illustration of the axes defined by the scan abutments.
By using PolyWorks|Inspector™ Software Verification and Measurement, we superimposed (best-fit algorithm) each laboratory scan image with the intra-oral scan image, based on the adjacent teeth of the model’s scanning abutments. The superimposition process allowed us to measure all the axes. Subsequently, we were able to extract the key features for each scanning abutment and calculate the spatial characterization of each scanning abutment relative to the reference as follows:
- 1.
- The distance between the center of the upper surface of the laboratory scan and the center of the upper surface of the intra-oral scan was defined as the shift of the scan abutment head with respect to the indirect scan from all the axes (purple dot in Figure 2). This was calculated as: .
- 2.
- The longitudinal axis angle was calculated as the three-dimensional angle between the longitudinal axis of the laboratory scan and the longitudinal axis of the intra-oral scan (red axis in Figure 2).
- 3.
- The rotational angle is the angle between the straight lines that comprise the intersection between the occlusal surface and the side surface of the abutments (the green straight line in Figure 2).
Statistical analysis was performed using the Statistical Package for Social Sciences for Windows Release 23.0 (SPSS Inc., Chicago, IL, USA). We used a t-test, for independent variables that are normally distributed. Wilcoxon signed-rank test was also used for variables that are not normally distributed. The statistical significance level for this work was p < 0.05.
3. Results
The overall mean ± standard deviation (STD) value for MIS, ZZ and AB scan abutments are presented in Table 1.

Table 1.
Mean and STD for MIS, ZZ and AB scan abutments (α =0.001).
3.1. Displacement in the Mesio-Distal Axis (x-Axis)
1. MIS—No statistically significant displacement (p-value of 0.6565).
2. AB—A statistically significant displacement was demonstrated (p-value of <0.001).
3. ZZ—A statistically significant displacement was demonstrated (p-value of <0.001).
3.2. Displacement in the Bucco-Lingual Axis (y-Axis)
The scans for each scan abutment demonstrated a statistically significant displacement (p-value < 0.001).
3.3. Displacement in the Occluso-Gingival Axis (z-Axis)
1. MIS—No statistically significant displacement (p-value of 0.475).
2. AB—A statistically significant displacement was demonstrated (p-value of <0.001).
3. ZZ—A statistically significant displacement was demonstrated (p-value of <0.001).
3.4. Absolute Distance from the Axes Origin (D)
Deviation of the absolute distance was statistically significant (p-value < 0.001), for each scan abutment.
3.5. Longitudinal Axis Angle
Deviation from the longitudinal axis was demonstrated to be statistically significant (p-value < 0.001), for each scan abutment.
3.6. Rotational Angle
The scans for each abutment demonstrated a statistically significant deviation in the angle of rotation (p-value < 0.001).
4. Discussion
In our in vitro study, we proposed a method which evaluated the position of the implant, comparing laboratory scanning (gold standard) versus intra-oral scanning with three different scan abutments by superimposed digital STL files. The deriving of the spatial position of the implant was measured in the longitudinal axis, rotational angle, and absolute distance.
When using the digital impression for implants, we must use a scan abutment that will capture the spatial position of the implant related to the intra-oral tissues. The data from the scanning are converted to STL file and this should be as accurate as possible to achieve the best clinical result. Accuracy may be affected by the scanner technology (confocal versus triangulation), the experience of the dentist and the scanning trajectory [20,21].
A study by Andriessen et al. determined that the maximum tolerance of the bone around one implant is 50 microns [22,23]. Hence, in this study, we assumed that movement in any of the axes (B-L, M-L, or I-G) of more than 50 microns may cause distortion in the rehabilitative work (single crown):
- M–D displacement (x-axis) causes inaccurate seating due to inadequate contact with adjacent teeth.
- B–L displacement (y-axis) causes inaccurate buccal or lingual insertion which may lead to cheek or tongue biting, respectively.
- G–I displacement (z-axis) causes improper occlusal contacts.
The parameter D is affecting the pressure on the bone, can affect the passive fit, increase pre-load tension, and cause more mechanical problems. In this study, only the ZZ scan abutment showed D < 50 microns (46 microns). Our hypothesis for this result can be explained by the scan abutment production, the ZZ is the only one-piece scan abutment which may lead to less distortion when connecting this abutment to the analog.
The MIS scanning abutment is the only one which demonstrated no statistically significant displacement in the spatial position in relation to the X and Z axes (Table 1 shows the statistical significance), we assume that perhaps the square geometry versus the cylinder geometry of the other two scan abutments may affect this result. Another assumption is that the MIS abutment is composed of two pieces made from the same material (titanium) while the ZZ abutment is one-piece (PEEK) and the AB abutment is composed of two pieces from different materials (titanium base and body from PEEK).
The rotational angle is one of the most clinically important because a large deviation in the angle may prevent passive fit of the restoration. All three scan abutments showed a rotational deviation of the implant axis between the laboratory scanner and the intra-oral scanner. The AB abutment showed a deviation of 1.04 degrees while the other two abutments showed deviations of about half a degree. It is important to remember that the AB scan abutment is made from two different parts, a cylinder PEEK material and titanium base which is cemented to the cylinder. This may be the reason for the high deviation in the rotational angle. It is reasonable to assume that a scanning error of one-degree may not clinically affect a single implant-based crown, but may affect the clinical result of two or more implants; however, there is not enough evidence in the literature. We also found that with the one-piece scan abutment (ZZ), the rotational angle was the lowest compared to the two-piece scan abutments. This is confirmed with the study of Revilla leon et al [24]. which examined the influence of scan body design on the accuracy of the implant position; they used only one-piece scan abutments which showed no difference in the linear and angular position between the two abutments; however, they used a CMN machine for measuring the spatial position, which is different from our measuring method.
We may suggest that one reason for the differences between the two scanners is related to the technology. Omnicam intra-oral scanner uses a triangulation method while the E2 3shape laboratory scanner uses a confocal method which is considered to be more accurate [25].
In our study we used only the single stage strategy (scanning only with the scan abutments) which should minimize the effect of the scanning on the results compared to the two-stage strategy (scanning without the scan abutments and conducting another scan with the scan abutments) which is less accurate as described by Motel et al [21].
Park et al [26]. scanned a single unit scan abutment and removed 5%, 10% and 15% from the abutment and measured the influence on the linear and angular discrepancy. A 15% scan body image deficiency generated larger discrepancies compared to 5% and 10%. In our study for both intra-oral and laboratory scanning we obtained close to 100% of the scan abutment image.
It stands to reason that spatial characteristic measurements may vary depending on some factors:
- Geometry (cylindar versus square)
- Material (PEEK versus titanium)
- Scan abutment (one-piece versus two-piece)
The study hypothesis was rejected because there was a statistical difference between the laboratory scanner and the intra-oral scanner in relation to the implant spatial position.
Our study limitations are in vitro design, only one type of analog, only one intra-oral scanner (Omnicam), and that the intra-oral scanner (triangular) and laboratory scanner (confocal) are based on different scanning technologies. There is a true need for more in vitro and in vivo studies which will examine important features such as: ability to transfer the implant position with scan abutments, different implant positions and angulations, different intra-oral scanning technologies and partially dentate and completely edentulous conditions.
5. Conclusions
- All three scan abutments showed a rotational deviation of the implant axis between the laboratory scanner and the intra-oral scanner.
- The AB scan abutment showed a deviation of 1.04 degrees while the other two scan abutments showed deviations of about half a degree in relation to the laboratory scan abutment.
- The MIS scan abutment is the only one which demonstrated no statistically significant displacement in the spatial position in relation to the X and Z axes.
- The one-piece PEEK ZZ scan abutment showed the lowest D which is under 50 microns while the other two scan abutment were above 50 microns.
- There is a need for further studies which will examine the influence of geometry, material, and scan abutment parts on the accuracy of the scan obtained.
Author Contributions
Conceptualization, A.S. and G.B.-I.; methodology, E.D. and G.B.-I.; software, S.L. and M.L.; validation, S.L. and E.D.; formal analysis, H.Z. and S.H.-N.; investigation, M.L. and S.B. editing, G.B.-I. and S.B.; visualization, M.L. and S.H.-N.; supervision, E.D. and A.S.; project administration, A.S. and G.B.-I.; funding acquisition, A.S. and G.B.-I. and E.D. All authors have read and agreed to the published version of the manuscript.
Funding
This research received no external funding.
Institutional Review Board Statement
Not applicable.
Informed Consent Statement
Not applicable.
Data Availability Statement
Data available on request due to restrictions e.g., privacy or ethical.
Conflicts of Interest
The authors declare no conflict of interest.
References
- Rosenstiel, S.F.; Land, M.F. Contemporary Fixed Prosthodontics; Elsevier Health Sciences: St. Louis, MO, USA, 2015. [Google Scholar]
- Anadioti, E.; Lee, C.; Schweitzer, A. Fit of CAD/CAM Tooth-supported Single Crowns and Fixed Dental Prostheses. Curr. Oral Health Rep. 2017, 4, 142–150. [Google Scholar] [CrossRef]
- Allen, K.L.; Schenkel, A.B.; Estafan, D. An overview of the CEREC 3D CAD/CAM system. Gen. Dent. 2004, 52, 234–235. [Google Scholar]
- Culp, L.; Wong, N.Y.; Misch, C.E. Digital Technology in Implant Dentistry. In Dental Implant Prosthetics, 2nd ed.; Elsevier Mosby: St. Louis, MO, USA, 2015; pp. 700–723. [Google Scholar]
- Malaguti, G.; Rossi, R.; Marziali, B.; Esposito, A.; Bruno, G.; Dariol, C.; Dl Fiore, A. In vitro evaluation of prosthodontic impression on natural dentition: A comparison between traditional and digital techniques. Oral Implantol. 2016, 9, 21–27. [Google Scholar] [CrossRef] [PubMed]
- Alikhasi, M.; Siadat, H.; Nasirpour, A.; Hasanzade, M. Three-Dimensional Accuracy of Digital Impression versus Conventional Method: Effect of Implant Angulation and Connection Type. Int. J. Dent. 2018, 2018, 1–9. [Google Scholar] [CrossRef]
- Lee, H.; So, J.S.; Hochstedler, J.; Ercoli, C. The accuracy of implant impressions: A systematic review. J. Prosthet. Dent. 2008, 100, 285–291. [Google Scholar] [CrossRef]
- Amin, S.; Weber, H.P.; Finkelman, M.; El Rafie, K.; Kudara, Y.; Papaspyridakos, P. Digital vs. conventional full-arch implant impressions: A comparative study. Clin. Oral Implant. Res. 2017, 28, 1360–1367. [Google Scholar] [CrossRef] [PubMed]
- Basaki, K.; Alkumru, H.; De Souza, G.; Finer, Y. Accuracy of Digital vs Conventional Implant Impression Approach: A Three-Dimensional Comparative In Vitro Analysis. Int. J. Oral Maxillofac. Implant. 2017, 32, 792–799. [Google Scholar] [CrossRef] [Green Version]
- Chochlidakis, K.M.; Papaspyridakos, P.; Geminiani, A.; Chen, C.-J.; Feng, I.J.; Ercoli, C. Digital versus conventional impressions for fixed prosthodontics: A systematic review and meta-analysis. J. Prosthet. Dent. 2016, 116, 184–190.e12. [Google Scholar] [CrossRef] [PubMed]
- Magne, P.; Stanley, K.; Schlichting, L.H. Modeling of ultrathin occlusal veneers. Dent. Mater. 2012, 28, 777–782. [Google Scholar] [CrossRef]
- Skirbutis, G.; Dzingute, A.; Masiliunaite, V.; Sulcaite, G.; Zilinskas, J. PEEK polymer’s properties and its use in prosthodontics. A review. Stomatologija 2018, 20, 54–58. [Google Scholar]
- Fluegge, T.; Att, W.; Metzger, M.; Nelson, K. A Novel Method to Evaluate Precision of Optical Implant Impressions with Commercial Scan Bodies-An Experimental Approach. J. Prosthodont. 2017, 26, 34–41. [Google Scholar] [CrossRef] [PubMed]
- Siadat, H.; Beyabanaki, E.; Mousavi, N.; Alikhasi, M. Comparison of fit accuracy and torque maintenance of zirconia and titanium abutments for internal tri-channel and external-hex implant connections. J. Adv. Prosthodont. 2017, 9, 271–277. [Google Scholar] [CrossRef] [PubMed]
- Priest, G. Virtual-Designed and Computer-Milled Implant Abutments. J. Oral Maxillofac. Surg. 2005, 63, 22–32. [Google Scholar] [CrossRef]
- Tapie, L.; Lebon, N.; Mawussi, B.; Fron-Chabouis, H.; Duret, F.; Attal, J.-P. Understanding dental CAD/CAM for restorations--accuracy from a mechanical engineering viewpoint. Int. J. Comput. Dent. 2015, 18, 343–367. [Google Scholar]
- Mandelli, F.; Gherlone, E.; Gastaldi, G.; Ferrari, M. Evaluation of the accuracy of extraoral laboratory scanners with a single-tooth abutment model: A 3D analysis. J. Prosthodont. Res. 2017, 61, 363–370. [Google Scholar] [CrossRef]
- Gómez-Polo, M.; Ortega, R.; Gómez-Polo, C.; Celemin, A.; Highsmith, J.D.R. Factors Affecting the Decision to Use Cemented or Screw-Retained Fixed Implant-Supported Prostheses: A Critical Review. Int. J. Prosthodont. 2018, 31, 43–54. [Google Scholar] [CrossRef]
- Flügge, T.; Van Der Meer, W.J.; Gonzalez, B.G.; Vach, K.; Wismeijer, D.; Wang, P. The accuracy of different dental impression techniques for implant-supported dental prostheses: A systematic review and meta-analysis. Clin. Oral Implant. Res. 2018, 29, 374–392. [Google Scholar] [CrossRef] [Green Version]
- Waldecker, M.; Rues, S.; Rammelsberg, P.; Bömicke, W. Accuracy of complete-arch intraoral scans based on confocal microscopy versus optical triangulation: A comparative in vitro study. J. Prosthet. Dent. 2021, 126, 414–420. [Google Scholar] [CrossRef]
- Motel, C.; Kirchner, E.; Adler, W.; Wichmann, M.; Matta, R.E. Impact of Different Scan Bodies and Scan Strategies on the Accuracy of Digital Implant Impressions Assessed with an Intraoral Scanner: An In Vitro Study. J. Prosthodont. 2019, 29, 309–314. [Google Scholar] [CrossRef] [Green Version]
- Andriessen, F.S.; Rijkens, D.R.; van der Meer, W.J.; Wismeijer, D.W. Applicability and accuracy of an intraoral scanner for scanning multiple implants in edentulous mandibles: A pilot study. J. Prosthet. Dent. 2014, 111, 186–194. [Google Scholar] [CrossRef] [PubMed]
- Kim, Y.; Oh, T.-J.; Misch, C.E.; Wang, H.-L. Occlusal considerations in implant therapy: Clinical guidelines with biomechanical rationale. Clin. Oral Implant. Res. 2005, 16, 26–35. [Google Scholar] [CrossRef] [PubMed]
- Revilla-León, M.; Smith, Z.; Methani, M.M.; Zandinejad, A.; Özcan, M. Influence of scan body design on accuracy of the implant position as transferred to a virtual definitive implant cast. J. Prosthet. Dent. 2020. [Google Scholar] [CrossRef] [PubMed]
- Lee, S.J.; Kim, S.-W.; Lee, J.J.; Cheong, C.W. Comparison of Intraoral and Extraoral Digital Scanners: Evaluation of Surface Topography and Precision. Dent. J. 2020, 8, 52. [Google Scholar] [CrossRef] [PubMed]
- Park, S.-W.; Choi, Y.-D.; Lee, D.-H. The effect of the improperly scanned scan body images on the accuracy of virtual implant positioning in computer-aided design software. J. Adv. Prosthodont. 2020, 12, 107–113. [Google Scholar] [CrossRef] [PubMed]

Publisher’s Note: MDPI stays neutral with regard to jurisdictional claims in published maps and institutional affiliations. |
© 2021 by the authors. Licensee MDPI, Basel, Switzerland. This article is an open access article distributed under the terms and conditions of the Creative Commons Attribution (CC BY) license (https://creativecommons.org/licenses/by/4.0/).