Featured Application
A slit-type soundproof panel can be applied to attenuate low-frequency noise and withstand wind load alongside traffic roads.
Abstract
With the rapid increase in automobiles, the importance of reducing low-frequency noise is being emphasized for a comfortable urban environment. Helmholtz resonators are widely used to attenuate low-frequency noise over a narrow range. In this study, a slit-type soundproof panel is designed to achieve low-frequency noise attenuation in the range of 500 Hz to 1000 Hz with the characteristics of a Helmholtz resonator and the ability to pass air through the slits on the panel surface for reducing wind load. The basic dimension of the soundproof panel is determined using the classical formula and numerical analysis using a commercial program, COMSOL Multiphysics, for transmission loss prediction. From the numerical study, it is identified that the transmission loss performance is improved compared to the basic design according to the shape change and configuration method of the Helmholtz resonator. Although the correlation according to the shape change and configuration method cannot be derived, it is confirmed that it can be used as an effective method for deriving a soundproof panel design that satisfies the basic performance.
1. Introduction
The Helmholtz resonator (HR) is widely used to passively control noise due to its characteristics of high transmission loss at a low frequency and its structural simplicity in construction. Typical applications of the HR include ducts for air conditioning and ventilation in buildings, automotive exhaust systems, and aero-engines to attenuate noise arising from unavoidable elements. The resonance frequency is determined by the geometry of the structure of the cavity and the neck. It is crucial to determine the resonance frequency precisely to achieve an accurate design, which will present the required attenuation capability. There have been discrepancies between theory and measured resonance frequencies. Therefore, many studies have been conducted to achieve a better solution for minimizing discrepancies.
Ingard studied the effect of neck geometry, such as cross-sectional area shapes, sizes, and locations, on the resonance frequency of an HR in a free field or a wall. Ingard presented mass end correction for three of the simplest cases of a concentric aperture in a circular tube, a circular aperture in a circular tube, and a square aperture in a square tube [1]. Tang and Sirignano investigated a Helmholtz resonator with a neck to reduce combustion instability related to acoustic modes in a rocket engine. They developed a generalized formulation and applied it to a quarter-wave tube and a Helmholtz resonator with different neck lengths [2]. Chanaud also analyzed the effects of geometry on the resonance frequency of an HR. The results from the Rayleigh equation and a transcendental equation were compared under the extreme conditions of the geometry of a cavity and an orifice, such as depth, length, and width. Chanaud concluded that those classical equations had limited validity when extremes of geometry were encountered, and a computer program should be used to calculate the resonance frequency due to the complex interplay of numerical quantities [3]. Selamet and Dickey investigated the effect of the volume length-to-diameter ratio on the resonance frequency and transmission loss of a concentric, cylindrical HR. Their results showed that volume dimensions neglected on the classical theory could significantly affect the resonance frequency and transmission and concluded that multi-dimensional computation would achieve a closer result compared to the experiments [4]. Selamet and Lee presented the effect of an extended neck of a concentric circular Helmholtz resonator with the theoretical, numerical, and experimental methods. Their result showed that the resonance frequency could be controlled by the change in length, shape, and perforation porosity of the extended neck without volume change [5]. Li et al. investigated the nature of Helmholtz resonators related to structural parameters and boundary conditions with the Finite Element Method (FEM). They also compared results from FEM to those of the impedance tube test, and concluded that the numerical analysis yielded reliable results compensating many restrictions from the theoretical formula [6]. Cai and Mak proposed the noise attenuation capacity index, the integral of transmission loss over the frequency domain, to evaluate the noise attenuation performance of a Helmholtz resonator. They derived that index from the theoretical formula and then validated it with FEM simulation. Their results presented that the noise attenuation capacity index was only related to the geometries of the neck and the cross-sectional area of the duct [7].
Along with the studies related to geometric features of an HR, many researchers have also attempted to broaden the attenuation band because a single HR has a narrow noise attenuation band. Griffin et al. demonstrated mechanically coupled resonators to design a particular transmission loss with a wider bandwidth of attenuation. An analytical model was developed for a single coupled resonator mounted on a one-dimensional duct, and experiments were conducted to measure the transmission loss of a coupled resonator system with the membrane. Both analytical and experimental results verified that the transmission loss could be modified by varying the properties of the coupling member [8]. Tang et al. experimentally studied the effects of two coupled cylindrical Helmholtz resonators on the sound absorption performance. Their study presented that the coupling by the cavity compartment could improve the sound absorption capacity and the front resonator should have a weaker acoustic resistance for optimal design. They also concluded that a relatively small cavity of the rear side compared to the original cavity could significantly widen the frequency band without affecting the sound absorption [9]. Cai et al. investigated the wave propagation in the periodic ducted HR theoretically and numerically. The transfer matrix method for the theoretical analysis was developed and compared with the FEM analysis result. Their results showed that both the noise attenuation band and peak amplitude were increased by adding HRs [10]. Langfeldt et al. proposed a new analytical model to calculate the resonance frequency of a Helmholtz resonator with multiple necks considering leaks inside of the resonator as additional necks. They compared their explicit formula with experimental data available in the literature and showed that even small holes in the resonator might lead to a significant increase in the resonance frequency and a considerable reduction in the absorption performance [11].
Although many studies and analyses have been conducted to draw a solid conclusion regarding the relations between resonance frequency and geometric sizes of the cavity and orifice, the complete design practice to obtain a precise resonator matching the resonance frequency at a specified frequency still has not been presented. Thus, many researchers have conducted studies to achieve noise attenuation capacity for their application fields with varying geometric and array configurations [12,13]. In summary, most researchers combine theoretical, numerical, and experimental methods altogether to develop and validate new sound attenuation devices, such as intake and exhaust systems of automotive and jet engines and combustors.
In this study, a slit-type HR is conceived to provide low-frequency sound attenuation and air-transpassing capacities for a soundproof panel. With the rapid increase in automobiles, the importance of noise pollution reduction is emphasized to provide a comfortable environment in urban areas, and soundproof panels are used to alleviate noise levels along traffic roads. Although many soundproof panels have used sound-absorbing material to reduce low-frequency noise, its capacity has gradually deteriorated due to the blockage of small holes in the material, and as the height of the urban space increases, it is necessary to reduce the wind load for the construction of higher soundproof walls. The design concept of the soundproof panel proposed in this study reduces the magnitude of the wind load with air-transpassing slits provided in the panel while maintaining traffic noise reduction capacity using the HR. By reducing the magnitude of the wind load, it is possible to construct a higher soundproofing wall more economically. To effectively minimize traffic noise, the resonance frequencies are designed for low-frequency noise attenuation.
Both numerical and experimental methods are utilized in developing a slit-type soundproof panel, similar to the methods of most researchers. Using classical theory from one-dimensional analysis, the base size and shape of Helmholtz resonators at a specific resonance frequency of 500 Hz and 1000 Hz, typical target frequencies for traffic noise reduction devices as documented road noise usually lies between 700 Hz and 1300 Hz, are induced. Acoustic attenuation performances of candidate design conditions are determined using a commercial sound analysis program, COMSOL Multiphysics. Additionally, the transmission loss is investigated under different configurations of the HR and compared through experiments with the soundproof panel for the resonance frequency of 1000 Hz.
2. Theories, Simulation, and Experiment Methods
2.1. Theoretical Formula of HR
The classical theory of an HR can be analogous to an equivalent mass-spring system, as shown in Figure 1. A neck is a medium between a cavity and an external space and its geometric sizes are import factors to design the resonance frequency.
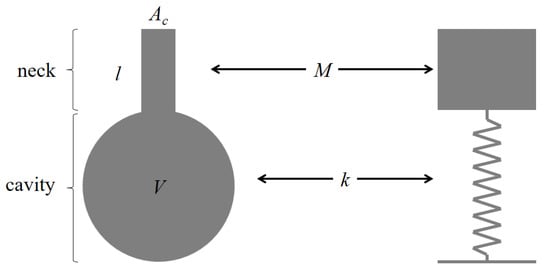
Figure 1.
Schematic diagram of the HR and an equivalent mass-spring system.
The theoretical formula of resonance frequency for an HR is:
where c is the speed of sound, is the cross-sectional area of the neck, is the total neck length, and V is the cavity volume. The total neck length is the actual length of the neck plus the correction length. This formula assumes the characteristic size of the resonator is much smaller than the wavelength.
The transmission loss of a Helmholtz resonator is:
where f is the frequency and is the cross-sectional area of the main duct.
The classical theory of Equations (1) and (2) clearly yields a single resonance frequency and transmission loss for a fixed neck geometry and a cavity volume. However, changes in geometry affect both the resonance frequency and transmission loss of an HR, which is why size and shape decisions required for sound attenuation performance are critical.
2.2. Numerical Simulation
In this paper, a numerical simulation model is constructed using a commercial program, COMSOL Multiphysics, which provides the pressure acoustics. To solve acoustic problems, the program models the propagation of sound pressure waves in the frequency domain. The governing equation is a modified Helmholtz equation [14].
where p is the acoustic pressure, is the density, is the speed of sound, and is the angular frequency. This equation assumes that reactive damping prevails in the low-frequency range.
For boundary conditions, the numerical model uses sound hard boundary conditions at the solid boundaries, imposing that the normal velocity at the boundary is zero, and incoming and outgoing plane waves are specified at the inlet and outlet, respectively.
The transmission loss, TL, is the measure of the attenuation of the acoustic energy in a system and gives the damping as a function of frequency.
where and are the acoustic powers at the inlet and the outlet, respectively. Those variables are dependent on the pressures at the inlet and the outlet.
2.3. Experimental Verification
The reverberation room test is conducted to measure the performance of the soundproof panel with the regulation of ISO 10140-5. A schematic diagram of the reverberation room consisting of two rooms is shown in Figure 2. The source room has a volume of 51.54 m3 and that of 57.02 m3 for the receiving room.
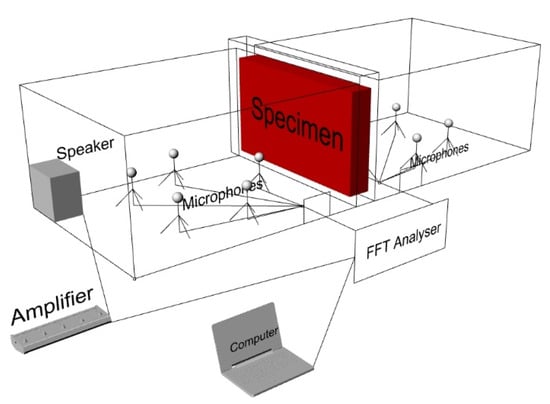
Figure 2.
Schematic diagram of the reverberation room test facility.
The measuring devices and specifications are listed in Table 1.

Table 1.
List of measuring devices and specifications for the test.
In the test, five non-directional microphones are used to derive the average value of sound pressure level as in Equation (5).
where Li is the measured value of the ith sound pressure level (Pa) and n is the number of measuring points.
The equivalent absorption is defined as:
where V is the volume of the receiving room (m3) and T is the reverberation time in the receiving room. From the above equations, the sound reduction index is calculated as:
where L1 is the average sound pressure level in the source room (dB), L2 is the average sound pressure level in the receiving room (dB), and S is the area of the test surface (m2).
3. Prototype of Slit-Type Soundproof Panel and Corresponding HR
The prototype module of the slit-type soundproof panel proposed in this paper is shown in Figure 3 along with the schematic diagram of the HR utilized for preliminary design of the panel. Note that the soundproof panel can be composed by arranging the module, shown in Figure 3a, in a row at regular intervals, which constitute the slit (Figure 3b). Typical soundproof panels for traffic noise need to maintain attenuation capacity ranging from 500 Hz to 1000 Hz, which are the two resonance frequencies considered for the preliminary designs in this study. Basic sizes of geometry and transmission loss based on the classical theory are summarized in Table 2.
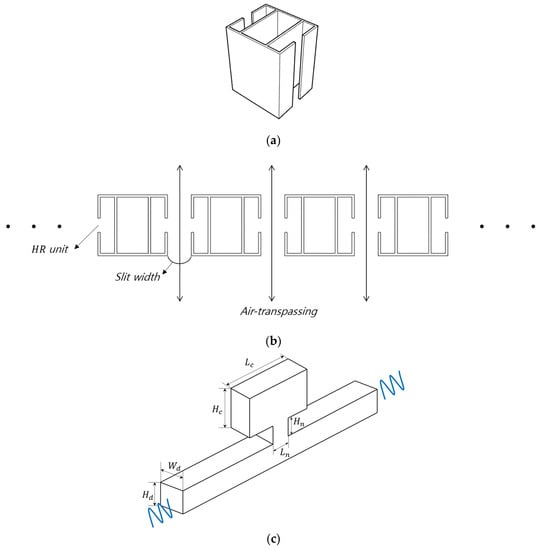
Figure 3.
Prototype of the slit-type soundproof panel and schematic diagram of the HR: (a) Prototype module of the slit-type soundproof panel; (b) Schematic of the slit-type soundproof panel; (c) HR for the panel design.
Table 2.
Preliminary design for two different resonance frequencies.
4. Simulation Results and Discussion
In the initial stage, two HRs with resonance frequencies of 500 Hz and 1000 Hz, respectively, are designed, and we investigate their transmission loss based on the shapes of major elements. Numerical simulations are conducted using COMSOL Multiphysics, which has been proved reliable in various acoustic simulations in fluids and solids [15,16].
4.1. HR for the Resonance Frequency of 500 Hz
Figure 4a shows the HR in a channel based on the dimensions in Table 2, and it has a relatively large cavity compared to other elements. The predicted value, 17.3 dB, of the transmission loss in Figure 4b revealed the peak at the targeted frequency of 500 Hz.

Figure 4.
The HR of 500 Hz resonance frequency: (a) A three-dimensional model of HR; (b) Predicted transmission loss.
The effects of cavity, neck, and duct shape changes while maintaining the same cross-sectional area using a scale factor ranging from 0.4 to 1.6 for the transverse length are investigated. Figure 5 shows the simulation result. Note that details of the numerical study cases are summarized in Table 3.
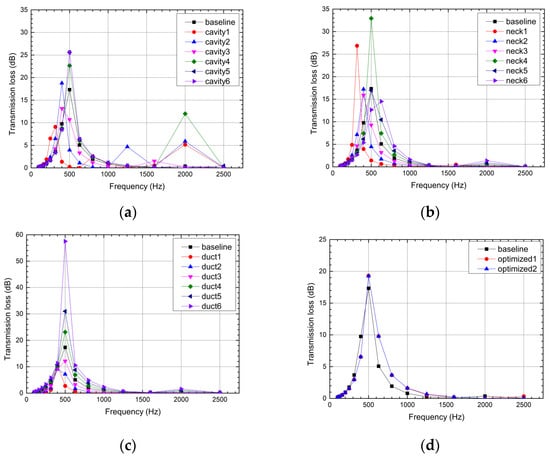
Figure 5.
The shape variation effects on the transmission loss of the HR with the resonance frequency of 500 Hz: (a) variation in cavity shape; (b) variation in neck shape; (c) variation in duct shape; (d) comparison with the optimized and the baseline models.
Table 3.
Parameter case studies for 500 Hz HR.
In Figure 5, it is observed that, even with the identical cavity, neck, and duct area, the shape variation can cause the change in transmission loss. In Figure 5a, it is observed that, as the cavity ratio is reduced, the peak frequency and magnitude of the transmission loss decrease. When the cavity ratio grows, the magnitude of the transmission loss increases without frequency shift. This means the cavity ratio should be close to or greater than 1.0 to avoid frequency shift and achieve better noise reduction. When the neck ratio changes, the frequency shifting phenomenon can be observed at the lower as well as the higher neck ratio, and no notable trend can be found in the magnitude of the transmission loss, as shown in Figure 5b. In Figure 5c, it can be seen that, as the duct ratio is reduced, the peak frequency and magnitude of the transmission loss decrease—the same trend as the cavity ratio. Additionally, as the duct ratio increases, the magnitude of the transmission loss increases without frequency shift.
Note that the peaks of transmission loss curves are increased up to 25.6 dB, 32.9 dB, and 57.5 dB for the shape variation of the cavity, neck, and duct, respectively. From the results, the most dominant factor influencing the peak value of transmission loss is the shape of the duct, but in the panel design, we decided to keep it unchanged for preserving air-transpassing capability. Thus, in designing the optimal model for the maximum transmission loss, two parameters, cavity and neck shapes, are considered using the simulation results provided in Figure 5a,b. In Figure 5d, it is seen that the transmission loss of the optimized model is increased about 11.6% compared to the baseline model, but this is less effective compared to the increment observed in Figure 5a,b.
Besides the effect of shape changes, the effect of HR arrangement, serial and parallel along the duct as shown in Figure 6a,b, is studied. In each arrangement, the effect of the distance between necks in a serial arrangement and the offset distance between necks in a parallel arrangement is compared. The analysis results are depicted in Figure 6c,d. Note that, in the legend of the figures, GD and OD represent neck distance in parallel and serial arrangements, respectively, and the number means the additional distance to the baseline model. In the figure, it can be seen that transmission loss is increased with the increase in the offset distance in a parallel arrangement, while no distinct increment is observed in a parallel arrangement.
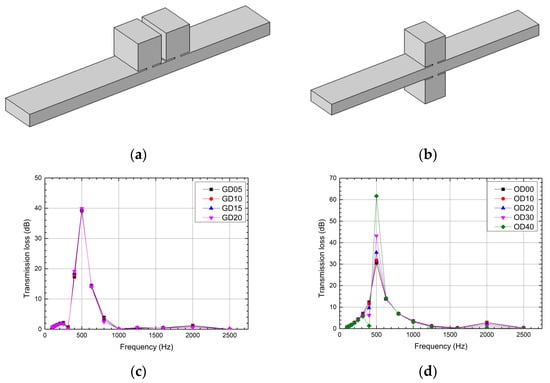
Figure 6.
The effects on the transmission loss with the resonator arrangement: (a) serial arrangement of two resonators; (b) parallel arrangement of two resonators; (c) effect of the neck distance between two resonators in a serial arrangement; (d) effect of the offset distance between two resonators in parallel arrangement.
4.2. HR for the Resonance Frequency of 1000 Hz
Figure 7a shows an HR for the resonance frequency of 1000 Hz, and it has a large length-to-height ratio in the cavity cross-sectional area. The predicted transmission loss showed 22.8 dB and matched well with the target frequency of 1000 Hz, as shown in Figure 7.
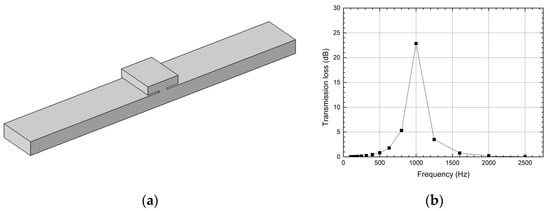
Figure 7.
The HR of 1000 Hz resonance frequency: (a) a three-dimensional model of HR; (b) predicted transmission loss.
An identical study for the 500 Hz HR to identify the effects of shape changes while maintaining the same cross-sectional area using a scale factor ranging from 0.4 to 1.6 for the transverse length is performed. Note that details of the numerical study cases are summarized in Table 4.
Table 4.
Parameter case studies for 1000 Hz HR.
Figure 8 shows the simulation result. In Figure 8, it can be seen that, as happened to the 500 Hz HR, the shape variation causes the change in transmission loss. Figure 8a shows that the peak frequency can be changed outside a certain range of the cavity ratios. The magnitude can be increased with varying cavity ratios, but no certain trend can be observed. The frequency shift phenomenon outside a certain range can also be identified with varying neck and duct ratios, as shown in Figure 8b,c. No definite trend is identified in the magnitude for both varying neck and duct ratio cases, but in the case of duct ratio variation, the magnitude of the transmission loss can be increased with a small change in the duct ratio. In conclusion, the effect of the shape change of the neck and duct is less effective than the 500 Hz resonator. Using this result, the optimal model for the maximum transmission loss is designed, and 37.5 dB of the transmission loss, which was the same with the effect of the shape change of the cavity, is obtained, as shown in Figure 8d.
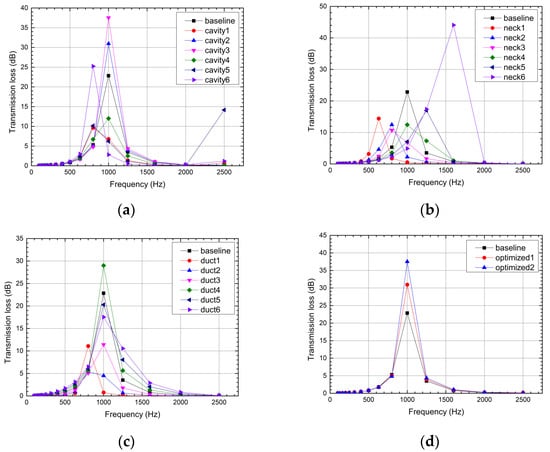
Figure 8.
The shape variation effects on the transmission loss of the Helmholtz resonator with the resonance frequency of 1000 Hz: (a) variation in cavity shape; (b) variation in neck shape; (c) variation in duct shape; (d) comparison with the optimized and the baseline models.
The effect of HR arrangement, serial and parallel along the duct as shown in Figure 9a,b, is studied. In each arrangement, the effect of the distance between necks in a serial arrangement and the offset distance between necks in a parallel arrangement is compared. Note that the transmission loss of baseline serial and parallel arrangements along the duct is 48.17 dB and 15.52 dB, respectively.
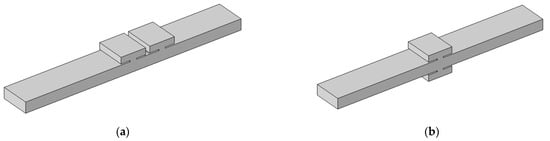
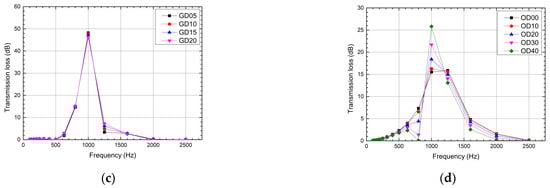
Figure 9.
The effects on the transmission loss with the resonator arrangement: (a) a serial arrangement of two resonators; (b) a parallel arrangement of two resonators; (c) effects of the wall distance of two resonators in a serial arrangement; (d) effects of the offset distance of two resonators in a parallel arrangement.
The analysis results are depicted in Figure 9c,d. Note that, in the legend of the figures, GD and OD represent neck distance in parallel and serial arrangements, respectively, and the number means the additional distance to the baseline model. In the figure, it can be seen that a similar trend to the 500 Hz HR can be observed as the transmission loss increased with the increase in the offset distance in a parallel arrangement, and there was no distinct increment in a parallel arrangement. In the parallel arrangement result, however, an eminent difference is observed in the case of no offset distance as two peak transmission losses appear at 1000 Hz and 1250 Hz of the parallel arrangement. The peak at 1000 Hz becomes distinct as the offset distance becomes greater.
4.3. Soundproof Panel Design with HR
To attain noise attenuation at 500 Hz and 1000 Hz, it is necessary to construct two corresponding HRs arranged together. As shown in Figure 10a, HRs for 500 Hz and 1000 Hz are disposed serially. Figure 10b shows the effect of neck distance (ranging from 5 mm to 20 mm) between the two HRs on the transmission loss, which confirms the proceeding results for serial arrangement. Note that the peak matched well with two target resonance frequencies. However, to reduce traffic noise effectively, the noise attenuation performance between the two target frequencies needs to be improved.
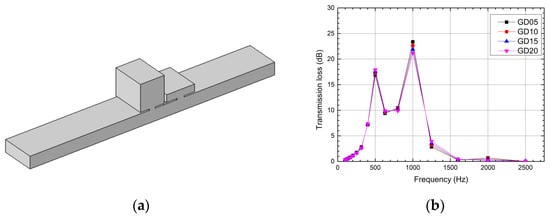
Figure 10.
A soundproof panel model with two HRs: (a) a three-dimensional model of serial HR arrangement; (b) predicted transmission loss for various neck distances.
Considering proceeding analysis results, the parallel arrangement, which showed an increase in the transmission loss compared to a single HR, as shown in Figure 11a, is adopted. As shown in Figure 11b, the parallel arrangement HRs along the duct can improve the capacity of transmission between the target frequencies. One notable observation is that the peak value at the frequency of 500 Hz becomes greater than that of 1000 Hz, unlike in Figure 10b without parallel arrangement. Additionally, Figure 11b shows that as the offset distance increased between two opposite resonator arrangements, the peak values at the target frequencies also increased, but values between the target frequencies decreased.

Figure 11.
A soundproof panel model with two HRs: (a) a three-dimensional model of parallel arrangement; (b) predicted transmission loss.
5. Reverberation Room Test
Slit-type soundproof panels for the resonance frequency of 1000 Hz are built for verification, with dimensions as listed in Table 2. The tests are conducted in the reverberation room. Figure 12a shows the photo of the soundproof panel for the test (1960 mm (W) × 127.5 mm (L) × 1000 mm (H)), and Figure 12b depicts a three-dimensional simulation model built using the COMSOL Acoustics program.
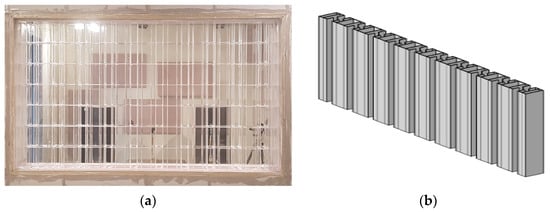
Figure 12.
A slit-type soundproof panel for 1000 Hz sound attenuation: (a) photo of the panel; (b) a three-dimensional model.
Figure 13 shows the comparison of the experimental and numerical results. The transmission loss of a numerical result is nearly the same level of 16 dB for both 1000 Hz and 1250 Hz, but that of the experimental result shows a single peak of 21.2 dB at 1000 Hz. While both experimental and numerical results show definite similarity and apparent transmission loss at 1000 Hz, the discrepancy between two curves, especially near the resonance frequency, can be observed in the figure. This discrepancy can be caused by improper boundary conditions assumed in the simulation model or possible panel misalignments in the test soundproof panel.
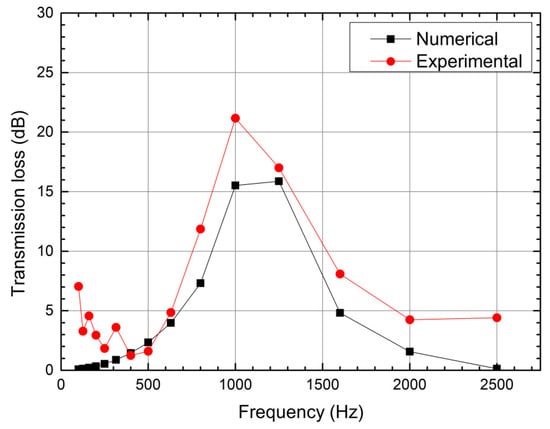
Figure 13.
The comparison of transmission loss between the experiment and the numerical analysis results.
The results clearly show that the concept of HR can actualize a soundproof panel with low-frequency sound attenuation and air-transpassing capacities. However, the reason for the discrepancy should be identified for developing a reliable design procedure via further studies.
6. Conclusions
In this study, a first-step study in developing a soundproof panel featuring low-frequency sound attenuation and air-transpassing capabilities is presented. The basic size of the HR is derived from the classical theory and then numerical studies using COMSOL Multiphysics are conducted to understand the relationships between the shape and arrangement of the resonators, followed by experimental verification. From the numerical and experimental results and observations, the following conclusions can be drawn:
- A unit cell for a soundproof panel is conceived from the classical formula and its transmission loss is predicted using COMSOL Multiphysics. As the shape changes, the transmission loss of a single resonator increases up to 232.37% and 64.47%, respectively, at the resonance frequency of 500 Hz and 1000 Hz. Depending on cavity, neck, and duct shapes, the peak frequency shift as well as the magnitude change can occur.
- In different arrays in series and parallel dispositions of HRs, the transmission loss of resonators increased up to 256.3% and 111.27% at resonance frequencies of 500 Hz and 1000 Hz. The serial disposition of two HRs to attain noise attenuation at 500 Hz and 1000 Hz shows that a soundproof panel design for sound attenuation at multiple resonance frequencies is feasible. However, it is also observed that, for more effective traffic noise reduction, the noise attenuation performance between the two target frequencies needs to be improved.
- A prototype of a soundproof panel (1960 mm (W) × 127.5 mm (L) × 1000 mm (H)) with a resonance frequency of 1000 Hz was built and the transmission loss was measured in a reverberation room for verification. From the comparison result, a similar pattern of transmission loss is observed between numerical and experimental results and apparent transmission loss at the resonance frequency of 1000 Hz, but the discrepancy between two curves, especially near the resonance frequency, can be observed, which should be identified for developing a reliable design procedure via further studies.
- Although this study is limited to providing design methods at an early stage, it may be necessary to derive the optimal dimensions of the soundproof panels for the required transmission loss. Future research should be conducted regarding this topic.
Author Contributions
Methodology, B.K. and S.C.; investigation, B.K., S.K., M.M., Y.P. and H.Y.; writing—original draft preparation, B.K.; writing—review and editing, S.C.; project administration, J.B. All authors have read and agreed to the published version of the manuscript.
Funding
This work was supported by the Korea Agency for Infrastructure Technology Advancement (KAIA) grant funded by the Ministry of Land, Infrastructure and Transport (Grant 21CTAP-C152289-03). This work was also supported by the National Research Foundation of Korea (NRF) grant funded by the Korean government (MSIT) (No. 2019R1A5A8083201).
Conflicts of Interest
The authors declare no conflict of interest.
References
- Ingard, U. On the theory and design of acoustic resonators. J. Acoust. Soc. Am. 1953, 25, 1037–1061. [Google Scholar] [CrossRef]
- Tang, P.K.; Sirignano, W.A. Theory of a generalized Helmholtz resonator. J. Sound Vib. 1973, 26, 247–262. [Google Scholar] [CrossRef]
- Chanaud, R.C. Effects of geometry on the resonance frequency of Helmholtz resonators. J. Sound Vib. 1994, 178, 337–348. [Google Scholar] [CrossRef]
- Selamet, A.; Dickey, N.S. Theoretical, computational and experimental investigation of Helmholtz resonators with fixed volume: Lumped versus distributed analysis. J. Sound Vib. 1995, 187, 358–367. [Google Scholar] [CrossRef]
- Selamet, A.; Lee, I. Helmholtz resonator with extended neck. J. Acoust. Soc. Am. 2003, 113, 1975–1985. [Google Scholar] [CrossRef] [PubMed]
- Li, L.; Liu, Y.; Zhang, F.; Sun, Z. Several explanations on the theoretical formula of Helmholtz resonator. Adv. Eng. Softw. 2017, 114, 361–371. [Google Scholar] [CrossRef]
- Cai, C.; Mak, C.M. Noise attenuation capacity of a Helmholtz resonator. Adv. Eng. Softw. 2018, 116, 60–66. [Google Scholar] [CrossRef]
- Griffin, S.; Lane, S.A.; Huybrechts, S. Coupled Helmholtz resonators for acoustic attenuation. J. Vib. Acoust. 2001, 123, 11–17. [Google Scholar] [CrossRef]
- Tang, S.K.; Ng, C.H.; Lam, E.Y.L. Experimental investigation of the sound absorption performance of compartmented Helmholtz resonators. Appl. Acoust. 2012, 73, 969–976. [Google Scholar] [CrossRef]
- Cai, C.; Mak, C.M.; Wang, X. Noise attenuation performance improvement by adding Helmholtz resonators on the periodic ducted Helmholtz resonator system. Appl. Acoust. 2017, 122, 8–15. [Google Scholar] [CrossRef]
- Langfeldt, F.; Hoppen, H.; Gleine, W. Resonance frequencies and sound absorption of Helmholtz resonators with multiple necks. Appl. Acoust. 2019, 145, 314–319. [Google Scholar] [CrossRef]
- Xu, M.B.; Selamet, A.; Kim, H. Dual Helmholtz resonator. Appl. Acoust. 2010, 71, 822–829. [Google Scholar] [CrossRef]
- Coulon, J.; Atalla, N.; Desrochers, A. Optimization of concentric array resonators for wide band noise reduction. Appl. Acoust. 2016, 113, 109–115. [Google Scholar] [CrossRef]
- COMSOL. COMSOL Acoustics Module User’s Guide; COMSOL Multiphysics/COMSOL AB: Stockholm, Sweden, 2018. [Google Scholar]
- Wu, G.; Lu, Z.; Xu, X.; Pan, W.; Wu, W.; Li, J.; Ci, J. Numerical investigation of aeroacoustics damping performance of a Helmholtz resonator: Effects of geometry, grazing and bias flow. Aerosp. Sci. Technol. 2019, 86, 191–203. [Google Scholar] [CrossRef]
- Jena, D.P.; Dandsena, J.; Jayakumari, V.G. Demonstration of effective acoustics properties of different configurations of Helmholtz resonators. Appl. Acoust. 2019, 155, 371–382. [Google Scholar] [CrossRef]
Publisher’s Note: MDPI stays neutral with regard to jurisdictional claims in published maps and institutional affiliations. |
© 2021 by the authors. Licensee MDPI, Basel, Switzerland. This article is an open access article distributed under the terms and conditions of the Creative Commons Attribution (CC BY) license (https://creativecommons.org/licenses/by/4.0/).