Article

Efficient Shot Detector: Lightweight Network Based on Deep Learning Using Feature Pyramid

1
Department of Plasma Bio Display, Kwangwoon University, 20 Kwangwoon-ro, Nowon-gu, Seoul 01897, Korea
2
Ingenium College of Liberal Arts, Kwangwoon University, 20 Kwangwoon-ro, Nowon-gu, Seoul 01897, Korea
3
College of General Education, University of Ulsan, 93 Daehak-ro, Nam-gu, Ulsan 44610, Korea
*
Author to whom correspondence should be addressed.
Appl. Sci. 2021, 11(18), 8692; https://doi.org/10.3390/app11188692
Submission received: 20 August 2021 / Revised: 4 September 2021 / Accepted: 10 September 2021 / Published: 17 September 2021
(This article belongs to the Special Issue Advances in Small Infrared Target Detection Using Deep Learning)

Abstract

:
Convolutional-neural-network (CNN)-based methods are continuously used in various industries with the rapid development of deep learning technologies. However, an inference efficiency problem was reported in applications that require real-time performance, such as a mobile device. It is important to design a lightweight network that can be used in general-purpose environments such as mobile environments and GPU environments. In this study, we propose a lightweight network efficient shot detector (ESDet) based on deep training with small parameters. The feature extraction process was performed using depthwise and pointwise convolution to minimize the computational complexity of the proposed network. The subsequent layer was formed in a feature pyramid structure to ensure that the extracted features were robust to multiscale objects. The network was trained by defining a prior box optimized for the data set of each feature scale. We defined an ESDet-baseline with optimal parameters through experiments and expanded it by gradually increasing the input resolution for detection accuracy. ESDet training and evaluation was performed using the PASCAL VOC and MS COCO2017 Dataset. Moreover, the average precision (AP) evaluation index was used for quantitative evaluation of detection performance. Finally, superior detection efficiency was demonstrated through the experiment compared to the conventional detection method.

1. Introduction

The rapid advancements and current level of computational power of deep learning based methods can be used in several applications, including autonomous driving systems [1], air traffic control [2], and image restoration [3], with high accuracy, which exhibit their capacity to replace the existing and traditional systems. However, high latency networks and traffic problems occur when processing an infinite amount of data using a graphics processing unit (GPU) based cloud system. Moreover, there is a limit to learning and reasoning when the network is embedded in mobile applications and devices. The lightweight deep learning research based on the convolution neural network (CNN), which includes changing the convolutional filter of the network [4], network discovery (e.g., AutoML) [5], and changing the network architecture [6], is being continuously studied to efficiently use limited system resources. In lightweight deep learning research, various studies are conducted in improving the convolution filter and network architecture require high computational cost. Several neural networks using this method include the residual neural network (ResNet) [7], dense convolutional network (DenseNet) [8], and MobileNet [9]. ResNet is a method for feature extraction and can be improved by optimizing the convolutional layer using residual blocks. Meanwhile, DenseNet is a method to accumulate and reuse feature maps as the network propagates forward. On the other hand, MobileNet is a method to perform convolution in units of channels (depthwise) and feature points (pointwise) instead of employing the existing convolution method. These methods can save the computation cost for about 8 times than that of the standard convolution. Alternatively, there is a network weight compression method, where the filter weights use the floating-point format and 32 bits from a memory point of view. The overparametrization in the general deep learning networks exists that may lead to overfitting. Therefore, a quantization method that reduces the number of bits to a specific number can be applied, resulting in a loss because the weight expression range is reduced and reducing the storage capacity of the network. CNN-based object detection methods are categorized into two-stage and one-stage detector methods. The two-stage detector, which includes the mask region-based CNN (RCNN) [10], performs classification after searching for a region proposal in which an object may exist. Although this method has high localization and object accuracy, it is not suitable for real-time detection because it consumes a lot of search time when searching for proposals. The one-stage detector, such as such as YOLOv3 [11] and SSD300 [12], performs classification and localization of objects through one network propagation, which uses a predefined anchor box (prior box). This method is an improvement of the two-stage detector method. Based on the aforementioned information, various lightweight techniques should be used for efficient object detection. For the existing detection networks, it is important to minimize the trade-off between accuracy and inference speed. Therefore, this study proposes a new object detection network—efficient shot detector (ESDet) using a lightweight deep learning method.
The main contributions of this paper are:
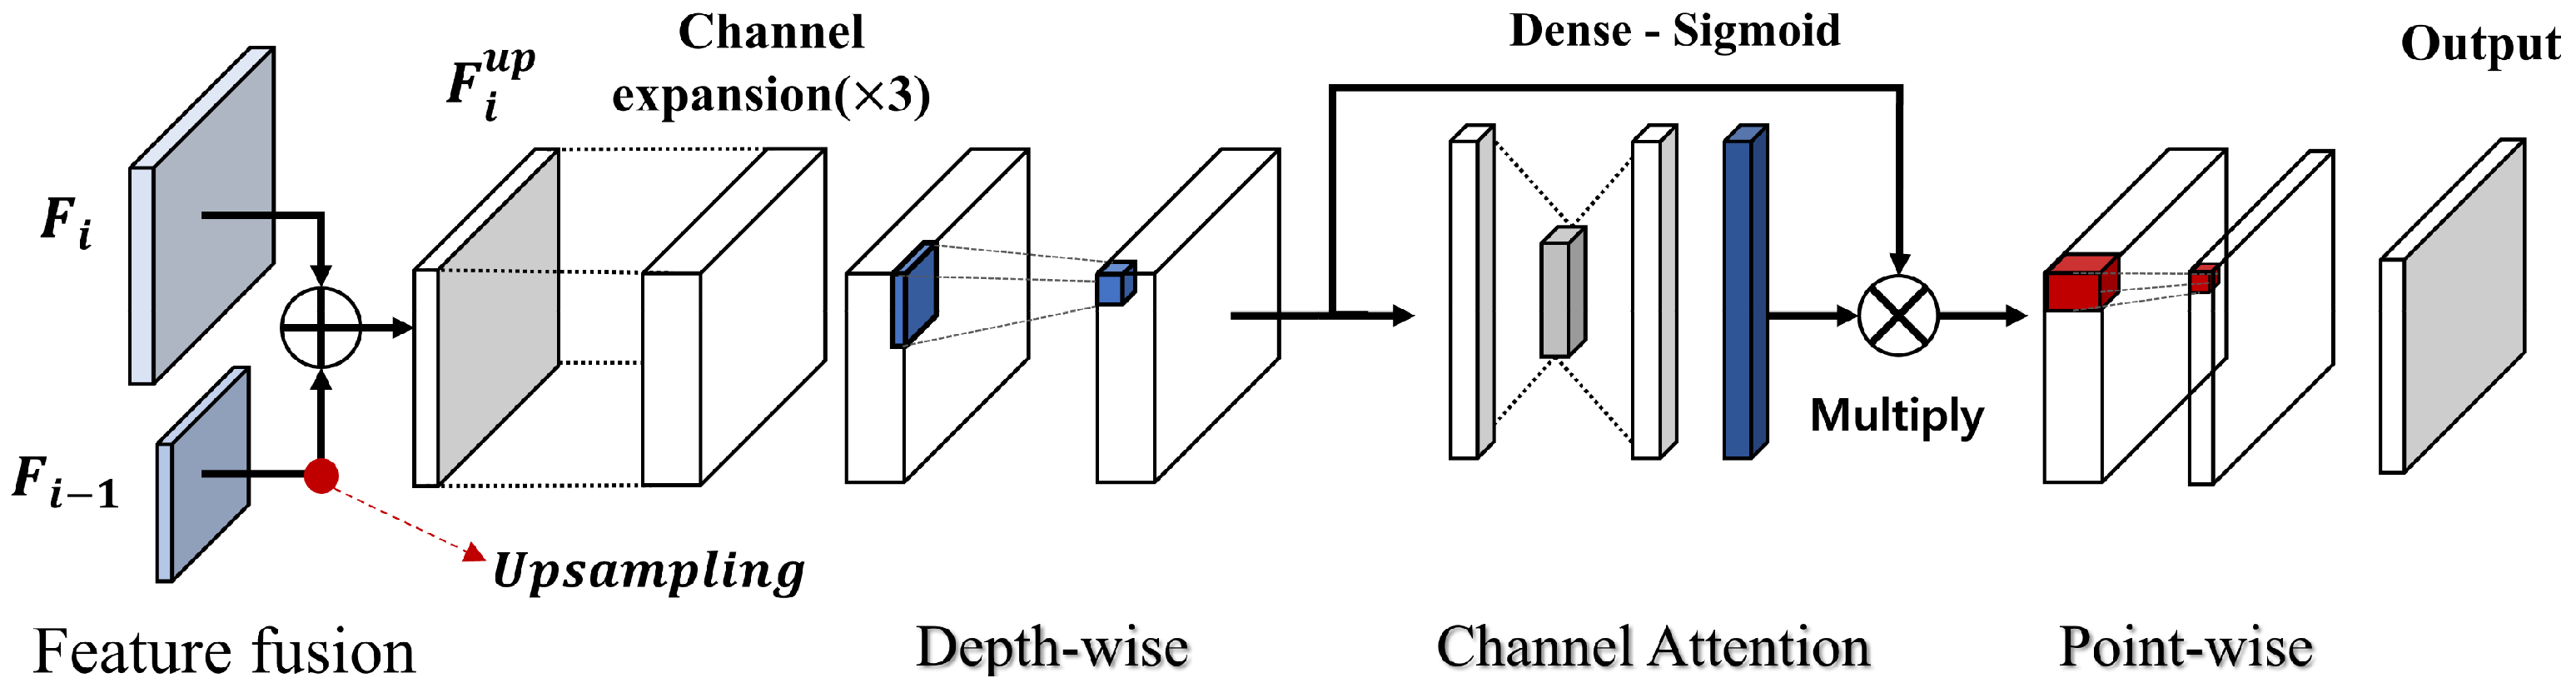
  • A lightweight pyramid-structured object detection network with few parameters is proposed. Although it uses fewer channels than the existing pyramid structure, it is possible to efficiently extract features with a structure that repeats the number of times. In addition, it is designed to suppress unnecessary feature information by adding a feature refining process in the pyramid structure.
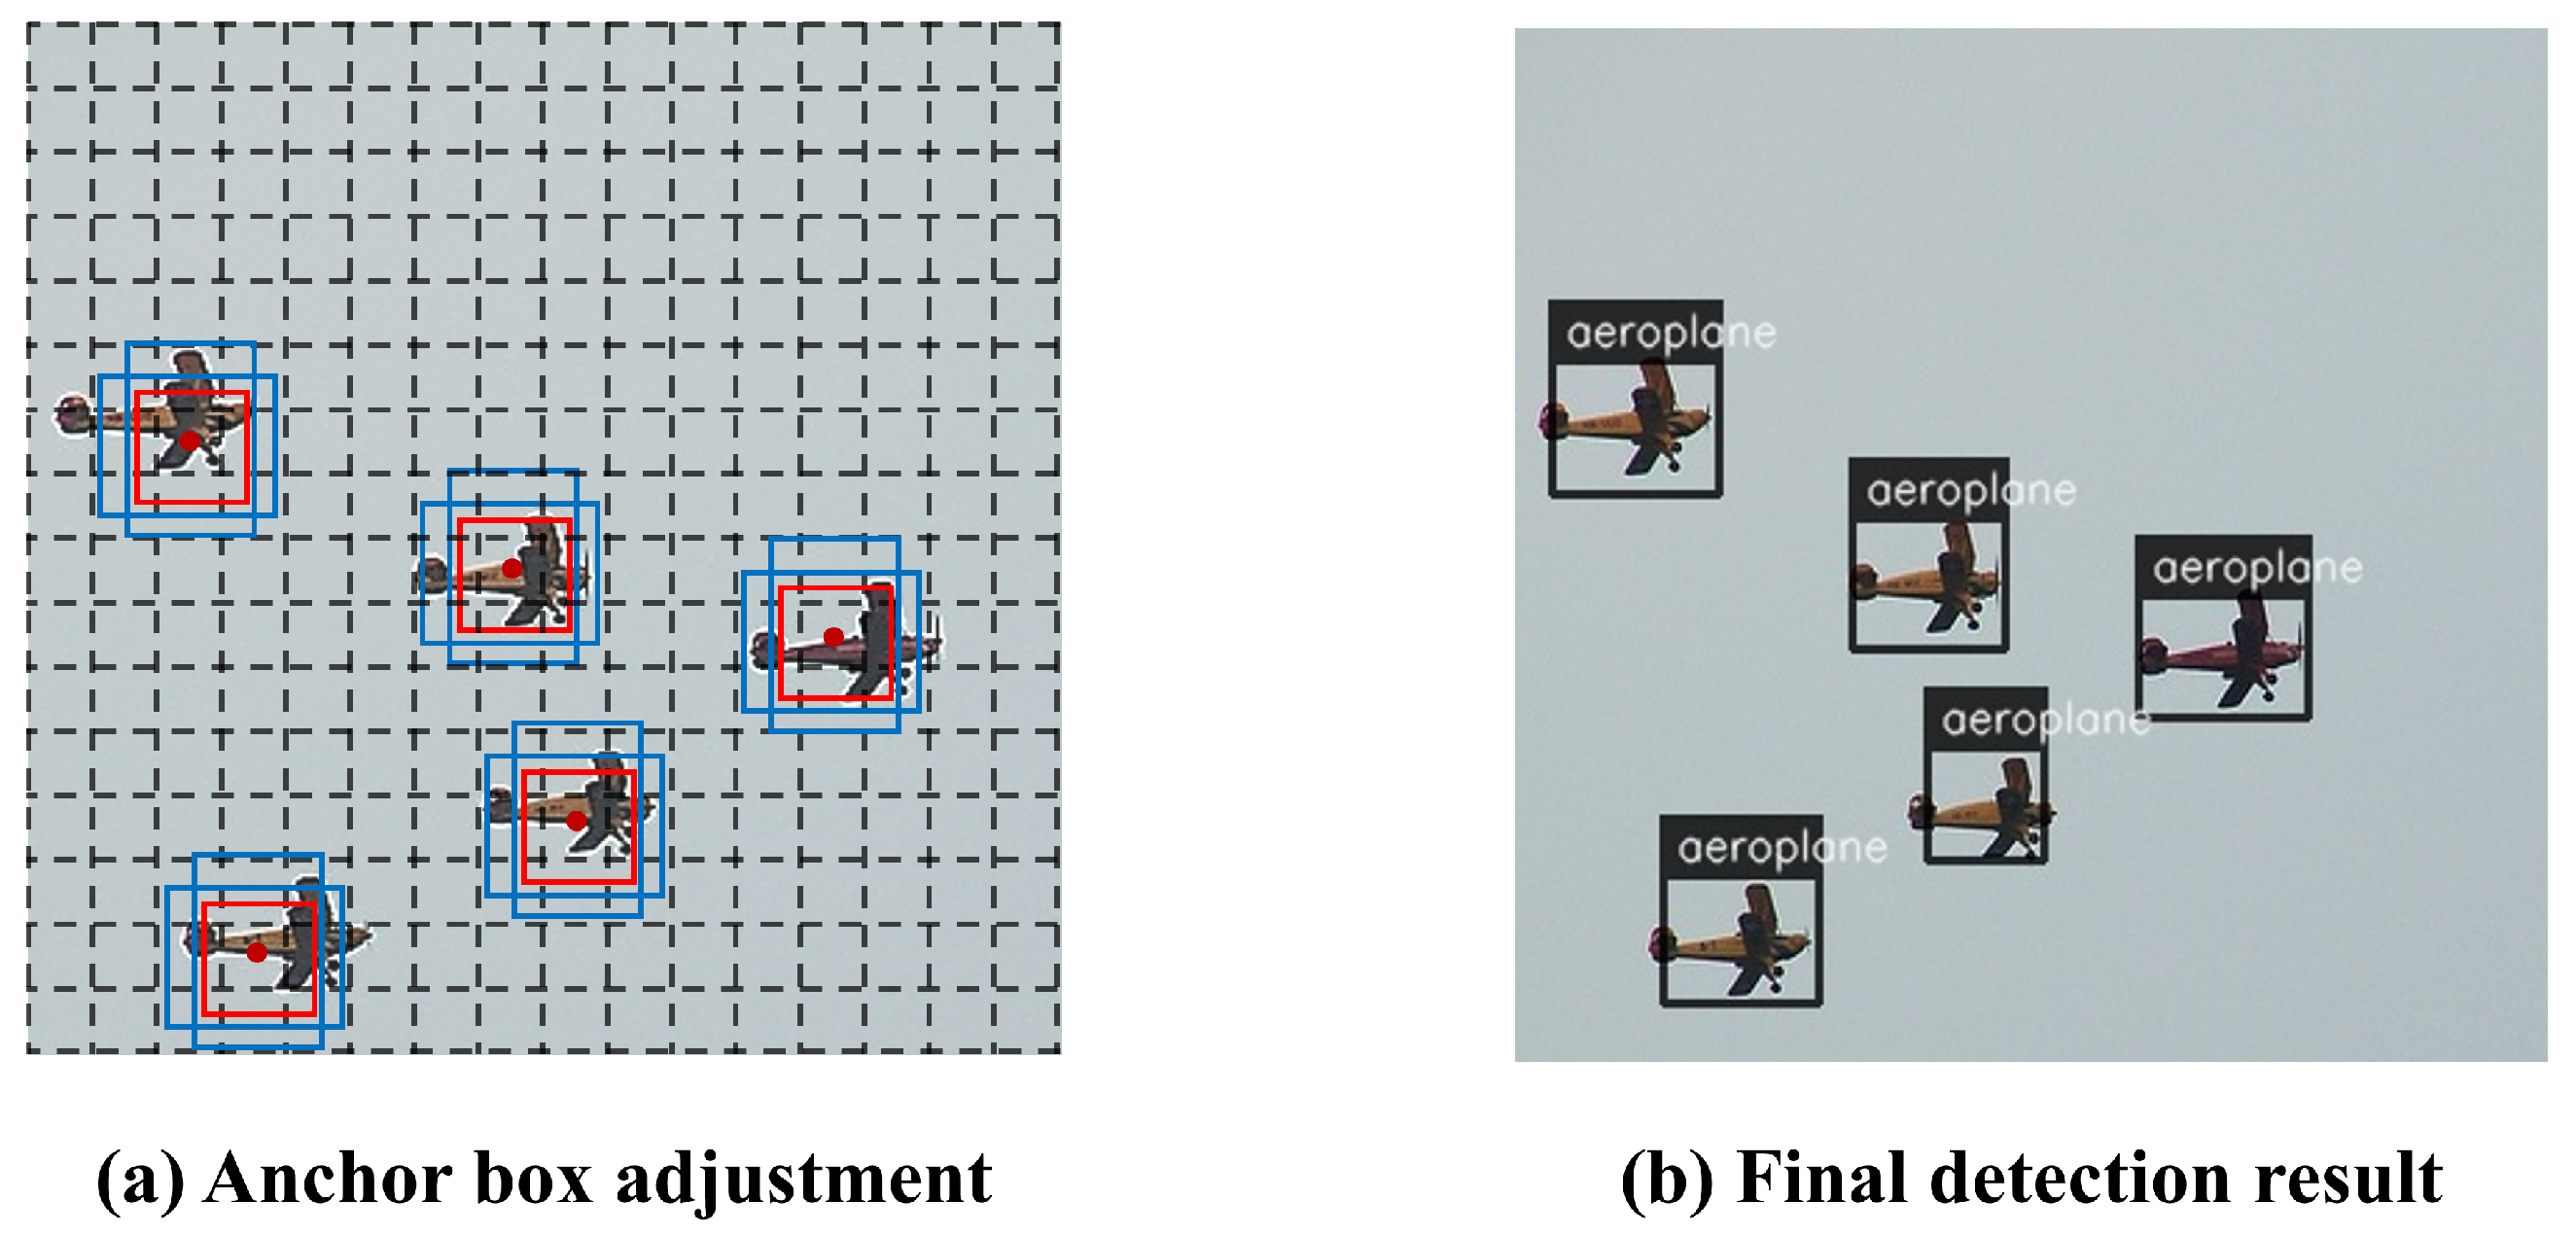
  • The one-stage detection method uses a prior box because it detects each feature map grid. In this paper, we redesigned the prior box to be robust to small and large objects.
  • Based on the ESDet-baseline, the experiment was conducted by expanding and reducing the network. It proves that the proposed network architecture can be used universally. It can be extended and used for tasks that require accuracy. When applied to mobile applications, it reports the efficiency that can be scaled down.

2. Related Works

Several CNN networks have been proposed to improve the classification performance of the neural network. For example, a convolutional layer and an activation function were used to improve the classification performance of AlexNet [13]. However, the number of variables increases as the network expands, which becomes a problem because there are too many variables to learn. In the past, reducing feature channels (1 × 1 convolution) and using the down sampling process were employed to reduce the network weight. Furthermore, as research on lightweight algorithms continues, the network can be miniaturized enough to be used in mobile applications. This section discusses the recently proposed network lightweight method.

2.1. Lightweight Backbone Networks

The CNN-based object detection method generally uses a feature map extracted from a feature extraction network. The backbone network encodes the input data according to the purpose using classification networks, such as VGG [14] and ResNet. Moreover, MobileNet and EfficientNet improved the convolution filter for lightweight deep learning and classification performance [15]. EfficientNet defined the baseline network after searching the network using AutoML to create an efficient network design since the neural network development requires a lot of domain knowledge and time. In addition, the network is expanded by compound scaling, which considers the depth, width, and input resolution of the network rather than a single dimensional view, shown in Equation (1).
d e p t h : d = α ϕ w i d t h : w = β ϕ i n p u t r e s o l u t i o n : r = γ ϕ s . t . α · β 2 · γ 2 2 α 1 , β 1 , γ 1
The values α , β , and γ are calculated by grid search after setting ϕ = 1 in EfficientNet-B0, a baseline network. Then, we extended the network by adding ϕ coefficients up to B7.

2.2. Weight Quantization

Forward propagation and backpropagation operations in deep learning generally perform weighting in a single precision floating point format (FP32), which usually occupies 32 bits in the computer memory. Several computational gain can be observed by performing the lowerbit operation when performing sum and multiplication operations on the graphics processing unit (GPU) under the same conditions. In addition, the quantized neural network can use a relatively low bandwidth because it reduces the frequency of the memory access. The quantization is possible with 8-bit to 16-bit real number types, depending on the quantization strength. However, the network accuracy is lowered because the expressive power is lost after quantization. In the case of a CNN affected by the previous layer, the more the network has fewer parameters, the greater the decrease in accuracy. Quantization techniques have been proposed to minimize the lost value. Specifically, the static quantization method combines the network weights and activation functions in advance, and the dynamic quantization method adjusts only the weight values. Recently, a technique for quantizing weights and activation functions of the network during quantization aware training was proposed. Moreover, the mixed precision method uses both 16-bit and 32-bit floating point during training. When changing a 32-bit value to 16-bit, 16-bit will be used except for the part where accuracy decreases rapidly.

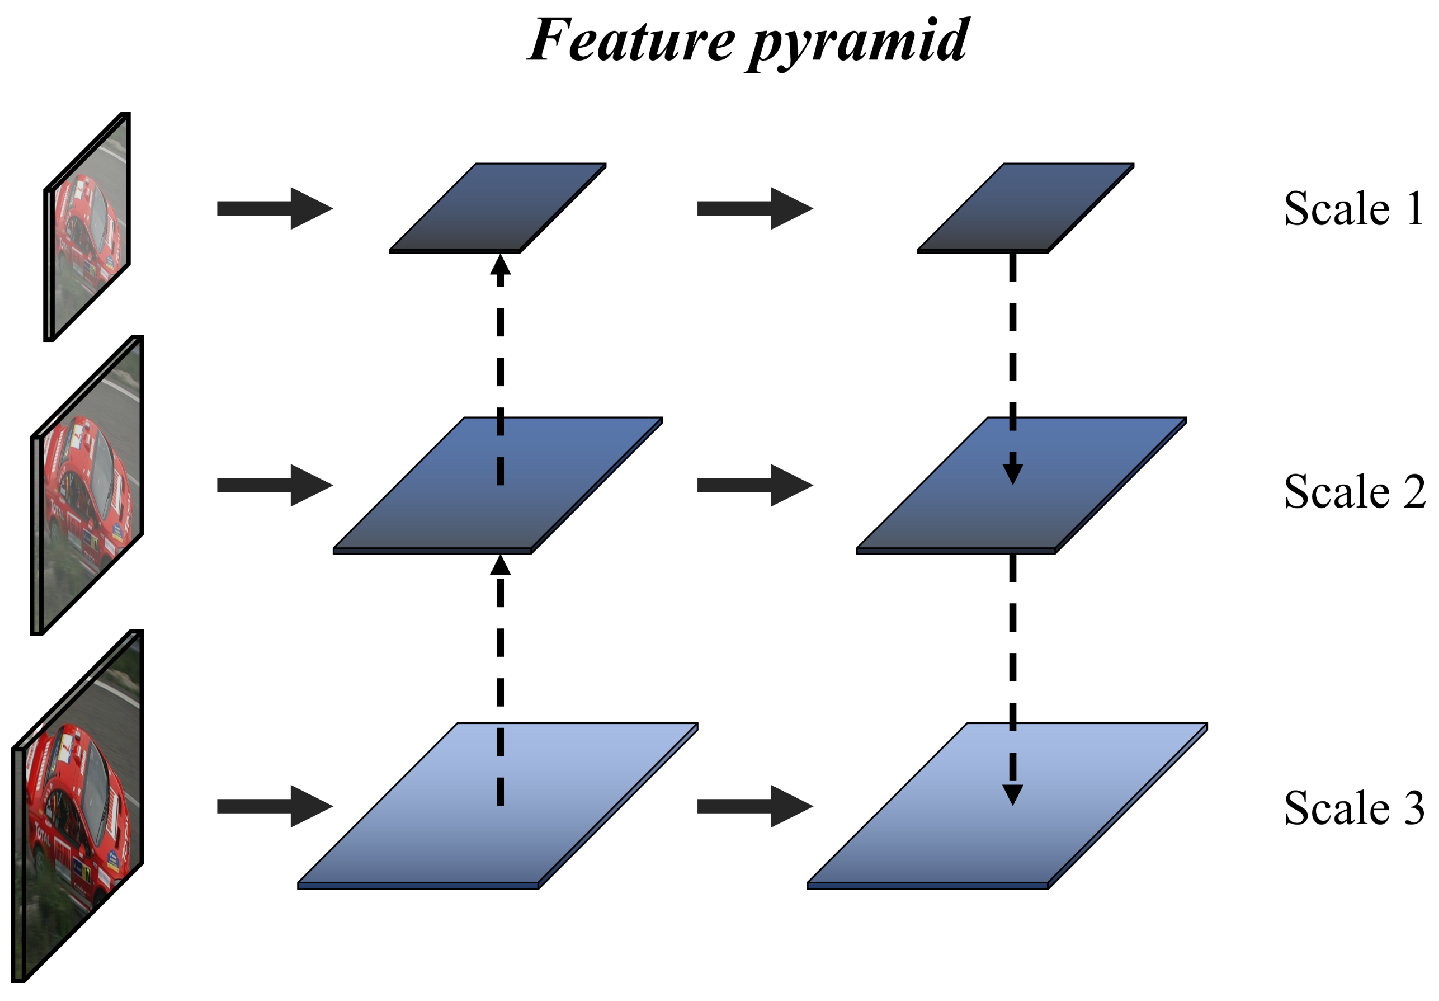
2.3. Feature Pyramid

The feature pyramid [16] was proposed to solve the feature scale invariant problem. The information of small objects is commonly lost when employing the one-stage detector because this information are compressed into the context information of the input data through convolution. To solve this problem, the feature pyramid, which is shown in Figure 1, performs detection using the feature map of the convolution intermediate process.

3. Proposed Method

This section describes the proposed method, and Figure 2 shows the proposed ESDet architecture. First, feature maps of the input image of the network with different scales extracted from EfficientNet were used. The size of the object that can be detected varies depending on the feature map scale. To consider both small and large objects, feature maps S1, S2, and S3 with different scales are extracted from the backbone. The extracted feature map was used as an input for the subsequent layer of the pyramid structure. The location and semantic information of the object was supplemented by fusion with the features of the adjacent scale. This method allows the detector to detect large and small objects. We reduced the computational cost of the fusion process of the feature pyramid by replacing the standard convolution with a convolution module with fewer parameters. The proposed network uses five heads that have passed through the feature pyramid to detect small and large objects for each scale. Moreover, the prior anchor for training was newly designed. Additionally, the groundtruth for CNN-based object detection methods should be designed and used in advance to fit the network head during training. Furthermore, the loss function that calculates the error between the prediction data and the groundtruth during training was explained.

3.1. Network Architecture

The overhead should be low in the process after the backbone network for fast and efficient object detection. The proposed network leads to a lightweight pyramid structure with features extracted from EfficientNet. The scaling value of EfficientNet mentioned in Equation (1) was set as α = 1.2 , β = 1.1 , γ = 1.15 . The max-pooling process at the top scale S3 of the pretrained backbone network was applied twice to generate S4 and S5 with 8 × 8 and 4 × 4 scales, respectively. In general, CNN-based object detection is performed using a prior box based on the center point of the feature map grid. Therefore, the highly compressed high-level feature map compared to the input image scale has information about large objects. Conversely, a low-level feature map has information about small objects because it is not compressed with the context information about the image. The proposed lightweight pyramid structure performs detection with a total of five heads from S1 to S5 scales. First, the fusion process was performed with features with adjacent scales through the upsampling path. This serves to supplement the semantic information of the object by utilizing the context information of the feature. Second, the location information of the object was supplemented from each feature channel through the downsampling path. Between the two paths, efficient training is possible by designing a shortcut structure that reuses input features. Finally, the detection was performed through classification and localization of each head. Table 1 shows the scale of the five heads.
We used depthwise and pointwise instead of standard convolution in the lightweight pyramid structure to minimize the network computation cost. A convolution operation is performed on one channel of a feature as a unit instead of performing a filter operation on multiple channels of a feature map, reducing the computation cost compared to the standard convolution. Equations (2) and (3) show the comparison of standard convolution and depthwise and pointwise convolution operations.
c o n v s t d = F w × F h × C i n p u t × C o u t p u t
C o n v d w + p w = D W + P W = ( F w × F h × C i n p u t ) + ( C i n p u t × C o u t p u t ) = C i n p u t × ( F w × F h + C o u t p u t )
The standard convolution requires 3 × 3 × 112 × 40 = 40,320 parameters when S3 is calculated as an example, as shown in Table 1. On the other hand, 112 × 3 × 3 + 40 = 5488 parameters are required when using the depthwise and pointwise convolution. Therefore, the parameter cost can be reduced by about eight times. Based on this, all convolutions of networks are replaced with the depthwise and pointwise convolution. The features of adjacent scales are fused based on the feature refining process in the feature pyramid structure shown in Figure 2. The feature fusion adds features with different information to the same input image, as shown in Equation (4). This method classifies object sizes in various ways compared to using a single feature.
F i u p = C o n v ( x = 1 W y = 1 h ( F i bilinear ( F i 1 ) )
This process shows an example of an upsampling path. The small scale F i 1 is adjusted to the same size as F i using the bilinear interpolation method. Then, the element summing is performed for each pixel. A low-cost convolution for the fused features was used as shown in Equation (3). However, all input features are treated equally when a refinement process is added between layers by simply convolution. Therefore, the proposed feature refinement process is performed as in Equation (5).
F i D W = DW ( Conv 1 × 1 ( F i u p ) ) F i R F = PW ( σ ( Dense ( F i D W ) ) F i D W )
The feature F i u p fused with two scale features is extended to 1 × 1 convolution C o n v 1 × 1 to preserve the channel information. F i D W features were generated by compressing the spatial axis position information using depthwise convolution D W after the expansion. Then, they were arranged in a one-dimensional vector through a dense layer. Additionally, the normalization process with the sigmoid activation function ( σ ) was followed by the multiplication operation after calculating the correlation of the listed feature vectors. This process is channel attention, which emphasizes important information in the channel, and includes semantic information necessary for object classification. Moreover, unnecessary noise is suppressed because it multiplies values for object information. Then, the computational cost continuously increases when the extended channels are maintained. Thus, the number of channels is reduced to the input channel size by pointwise convolution PW to generate a refined feature F i R F . The entire process from ESDet fusion to feature purification is shown in Figure 3.

3.2. Prior Anchor Box Design

CNN-based detectors perform bounding box regression using prior boxes. One-stage based detectors such as YOLO and SSD do not perform region proposals but perform coordinate prediction with an output feature map. The detection performance is significantly affected because the correct coordinates are generated using a prior box for each feature map grid to be detected. After designing a network with optimal parameters, a prior anchor box was designed to improve the detection accuracy. Five heads were used for detection, and prior box parameters were set for each scale shown in Table 2.
Based on the values presented in Table 2, a basic prior box to be used for training was defined for each head, as shown in Equation (6).
P b a s e l i n e = { x c e n t e r , x c e n t e r , w , h }
The prior box, which has an area based on the center point of the feature map grid, can be expressed as Equation (7).
x c e n t e r = ( i + 0.5 ) image / shrinkage y c e n t e r = ( i + 0.5 ) image / shrinkage w , y = Box min / image
where i and j are the indices from the top left of the feature map plane. Shrinkage means the scaling factor of the current feature map from the input resolution. The shrinkage is divided by the image size to obtain the center point of the feature map grid. The width and height of the box from the center point are the obtained values by dividing the image by B o x m i n assigned to each head. A box is added as in Equation (8) after defining the baseline prior box to detect horizontally or vertically long objects.
ratio = x , x { 1 , 2 , 3 } w , h = Box min Box max w , h = w ratio h / ratio , w / ratio h ratio
Three prior boxes, which detect horizontally or vertically long objects and perform bounding box regression, were generated for each feature scale through aspect ratio adjustment. Figure 4 shows an example of detection using three prior boxes.
The prior box scale of ESDet-baseline was designed based on the input resolution of 512 × 512 . The number of negative samples increases when the number of prior boxes is set excessively, resulting in an inefficient training. Therefore, it is important to perform detection with a minimum of prior boxes. Finally, the anchor ratio in Table 2 can also be proportionally increased when extending the input resolution of ESDet.

3.3. Loss Function

Classification: Proposals for a two-stage detector are generated through selective search to distinguish the foreground and background classes. The one-stage detector architecture considers all proposals from the extracted features. Because the preprocessing process is omitted, fast detection is possible, but there is a problem of class imbalance during training. The proposed method has approximately 16,000 proposals with an input size of 512 × 512 , and only a few of them are valid. This causes a problem since most of the easy samples (e.g., background) dominate the gradient. Therefore, the improved cross-entropy was used to induce focus on difficult-to-learn samples. First, Equation (9) represents the cross-entropy equation.
CE ( p , g ) = log ( p ) i f g = 1 log ( 1 p ) o t h e r w i s e , 1 g > 0 ,
where p is the value generated by the classifier of the network and g is the actual label value. Using cross-entropy loss easily classified negative samples that dominate the loss. Therefore, the loss was processed in the form of lowering the weight for samples such as a vast background class, as shown in Equation (10).
p t = p 1 p Focal ( p , g ) = ( 1 p t ) γ log ( p t )
If the classification of the sample is close to the correct answer through focal loss, the loss value becomes small. Meanwhile, the loss value becomes large when the classification is wrong. When the value of γ = 0 , it is the same as the general cross-entropy loss. In this study, we employed γ = 1.5 .
Bounding box regression: The loss of a one-stage detector is defined as the sum of the classification and regression losses. The error for the regression loss was calculated for the four coordinates of the predicted box. The regression loss used in this experiment was expressed as Equation (11) with smooth L1.
R e g r e s s i o n ( x , l , g ) = i p o s N m { c x , c y , w , h } x i , j k s m o o t h L 1 ( l i m g ^ j m ) g ^ j c x = ( g j c x p i c x ) p i w , g ^ j c y = ( g j c y p i c y ) p i h g ^ j w = log ( g j w p i w ) , g ^ j h = log ( g j h p i h )
The regression loss in the output feature map x is defined as the smoothL1 loss of l, which is the network output coordinates, and g, which is the groundtruth box. Moreover, p is the prior box and has a significant effect on the regression loss. Finally, the loss of the network is defined as the sum of the classification and regression losses and is expressed as Equation (12).
T o t a l ( x , p , l , g ) = F o c a l ( p , g ) + R e g r e s s i o n ( x , l , g )

4. Experiment Results

We used the public data sets PASCAL VOC [17] and MS COCO2017 [18] to verify and evaluate the performance of ESDet. The backbone network was pretrained with the ILSVRC CLS-LOC data set before conducting the experiment. Then, the network was extended up to ESDet-B7 in proportion to the input image size. Consequently, the Efficient-Net used as the backbone was extended to EfficientNet-B7 in proportion to the input resolution. When training the network in the experiment, it was conducted in Tensorflow 2.4.1, NVIDIA Geforce RTX 3090 X2 48 GB environment. For all networks, we used the SGD optimizer and set the momentum value to 0.9. The initial training rate was 0.005, and 0.0005 weight attenuation was applied to the weights and biases of the convolution filter. To measure the network fair inference time, we set the batch size to 1 in NVIDIA Geforece GTX TITAN X 12GB environment. Based on the proposed ESDet-baseline network, 10.1 ms GPU latency (99 FPS) and 3.3 BFLOPS were measured. Table 3 shows the network configuration according to the input resolution and backbone change.

4.1. Data Sets

The object detection data sets PASCAL VOC (07+12) and MS CO-CO2017 were trained and evaluated for network training. The data sets were divided into sets that were used for training, validation, and testing. The train set was used for training. Meanwhile, the validation set did not participate in the actual weight training and could check the training state, setting network parameters. The test set was used in the training process. The PASCAL VOC data set used for evaluation has a total of 20 classification categories and used 8324 images for the train set, 11,227 images for the validation set, and 4952 images for the test set. Moreover, the MS COCO data set has a total of 80 classification categories, and 118,287 train images, 5000 validation images, and 4952 images were used for evaluation. The characteristics of the data set may not be reflected well when training was done without using data augmentation during training, degrading the network generalization performance. Therefore, random data augmentation was applied as shown in Figure 5.
The data was augmented with random probability during the training process rather than physically expanding them before training. The augmentation method that modifies image color information and adjusts the image scale or shape of an object was used. Additionally, it is important to change the image color information because convolution filters are greatly affected by image pixel values. In the case of objects, small or large data are not well distributed in the training set. Therefore, the data imbalance problem was alleviated by cropping the object area or reducing the image scale ratio.

4.2. Evaluation Metrics

The average precision (AP) [19] is a metric used to evaluate detection accuracy, which was also used in this experiment. AP can be expressed as the area of precision and recall (PR-RC) curve. Precision and recall are defined by Equations (13) and (14).
Precision = T P T P + F P
Recall = T P T P + F N
When calculating AP, if there is only one class to be classified, it is defined as Equation (15).
A P = 1 11 r { 0.0 , 1.0 } P i n t e r p ( r )
The mean of maximum precision values at 11 recall levels (0.0, 0.1,..., 1.0) was calculated. It is necessary to calculate the average value for the AP because the classification task in the public data set has more than one class. Equation (16) defined the average of AP for all classes.
m A P = 1 N i = 1 N A P i

4.3. Comparison to Other Networks

The comparison with the latest detectors is performed to evaluate the performance of ESDet, as shown in Table 4. The proposed network showed competitive performance with 81.9% mAP in the PASCAL VOC 2007 test set. Moreover, it showed similar performance and faster detection speed compared with the latest two-stage detector, which has large input resolution and excellent performance. High-resolution images improve the detection success rate because they provide more features for small objects. Conversely, the detection accuracy of cases of the one-stage detector tends to be relatively low because the detection is performed with a small resolution.
The proposed network has a faster detection speed than the latest detector because it has fewer parameters. In addition, the proposed network has a detection speed that is three times faster than that of the RefineDet512+ with the same input size. Most detectors use VGG-16 and ResNet-101 as backbones, and YOLO series uses Darknet as backbones. The aforementioned backbone networks have more parameters than EfficientNet because of the larger number of feature channels. In this study, we used EfficientNet with relatively few parameters. Results showed a good balance between accuracy and detection speed when compared with other conventional detectors.
In addition, training in this experiment was also performed with MS COCO2017, and the detection results is shown in Table 5. Experimental settings were set similarly as PASCAL VOC. However, all detectors showed lower mAP results than PASCAL VOC since there are 80 classes to classify in MS COCO2017.
The AP evaluation method of MS COCO is different from PASCAL VOC. The AP in Table 5 uses only a value with an intersection of union (IoU) ratio between 50% and 95% between the predicted and groundtruth boxes. AP50 is the same evaluation method as PASCAL VOC, and AP75 is evaluated to predict only items with an IoU ratio of 75% or more. A high AP was achieved with fewer parameters compared with EfficientDet-50 using the same backbone. Therefore, the proposed network achieves relatively improved detection accuracy with few parameters, enabling efficient object detection.

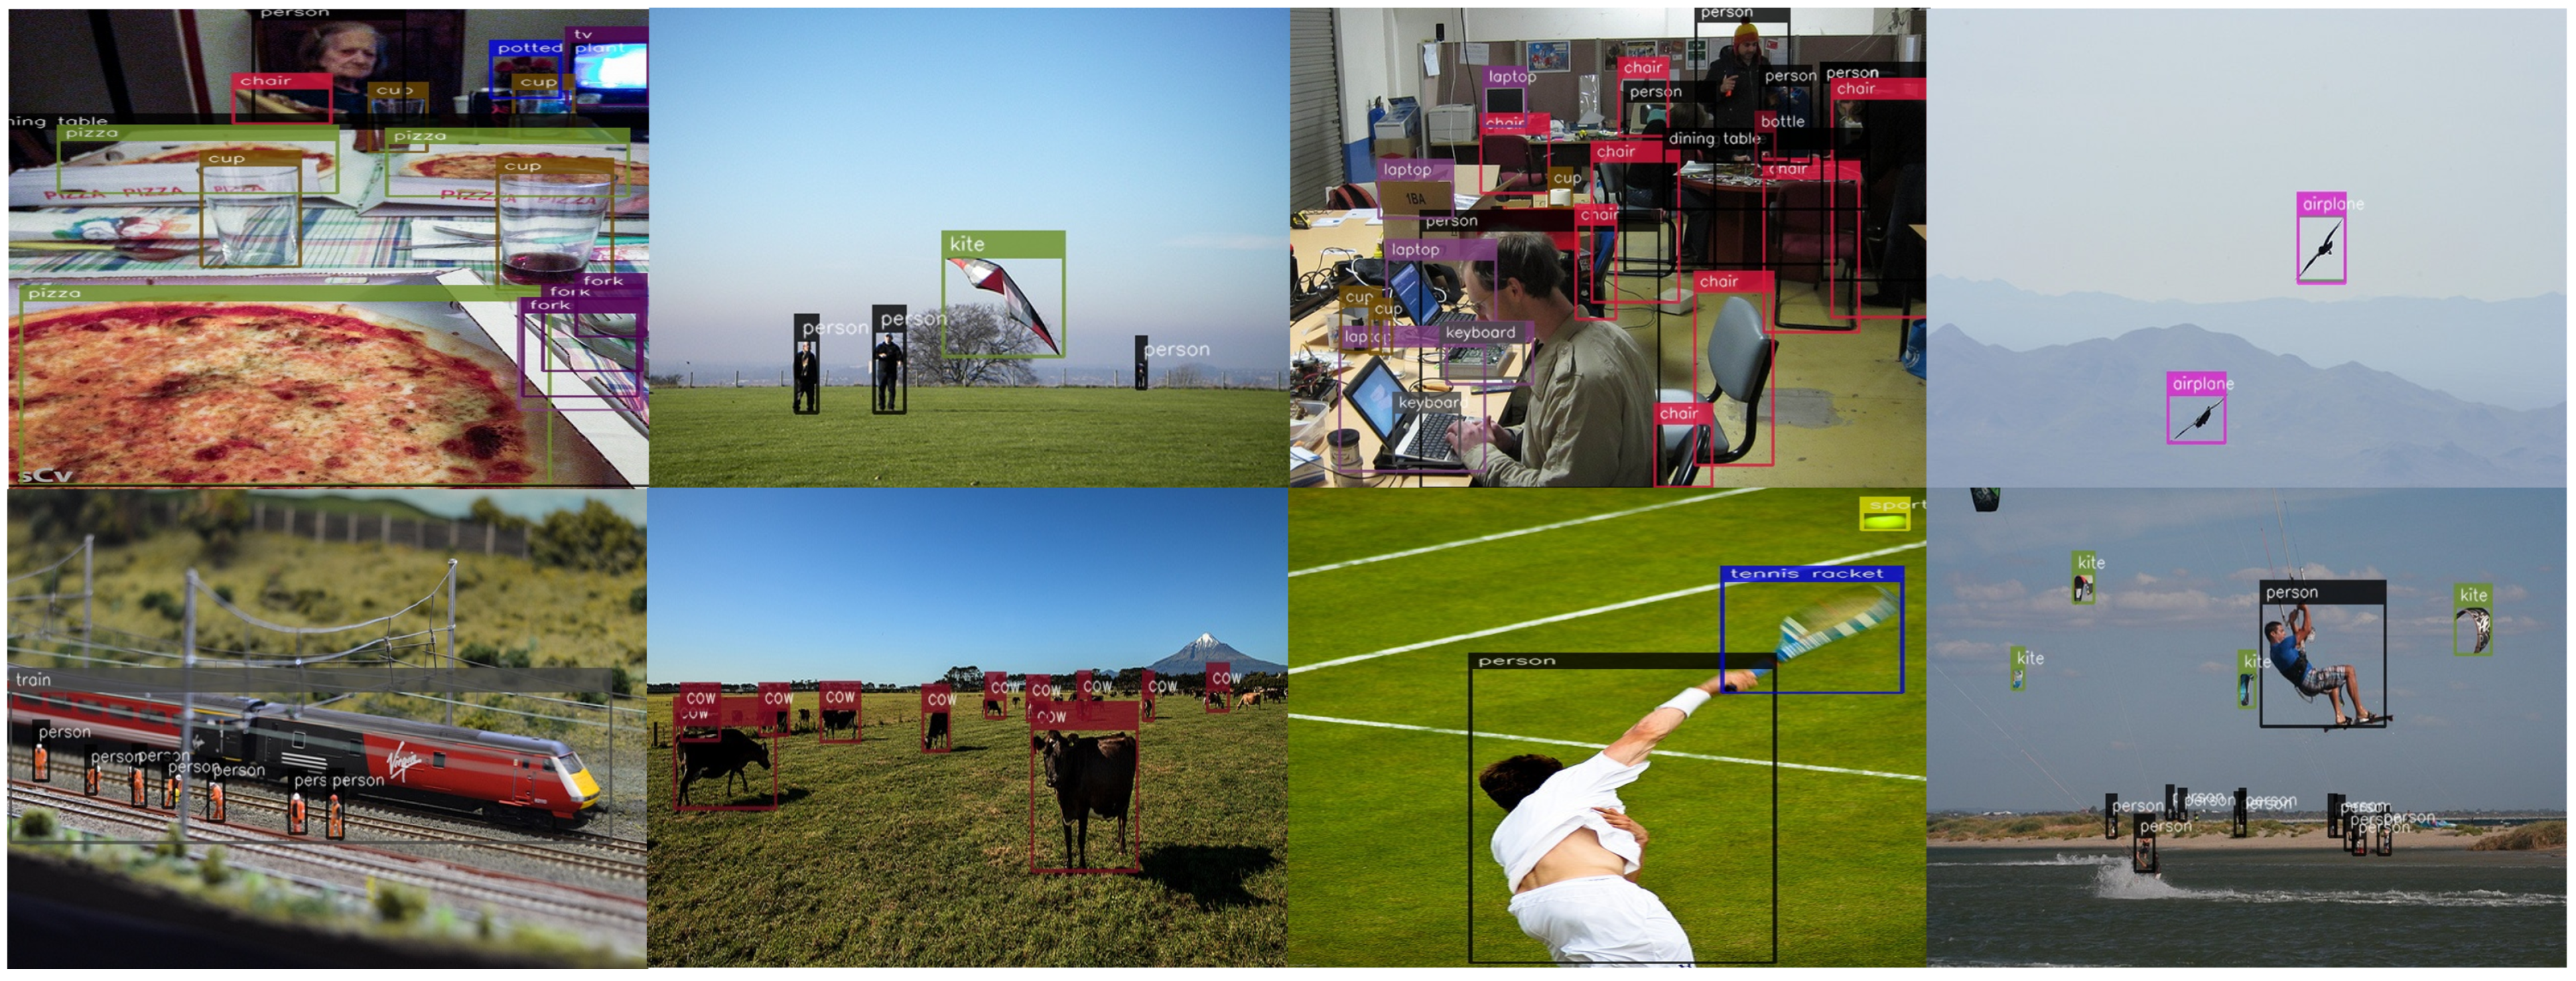
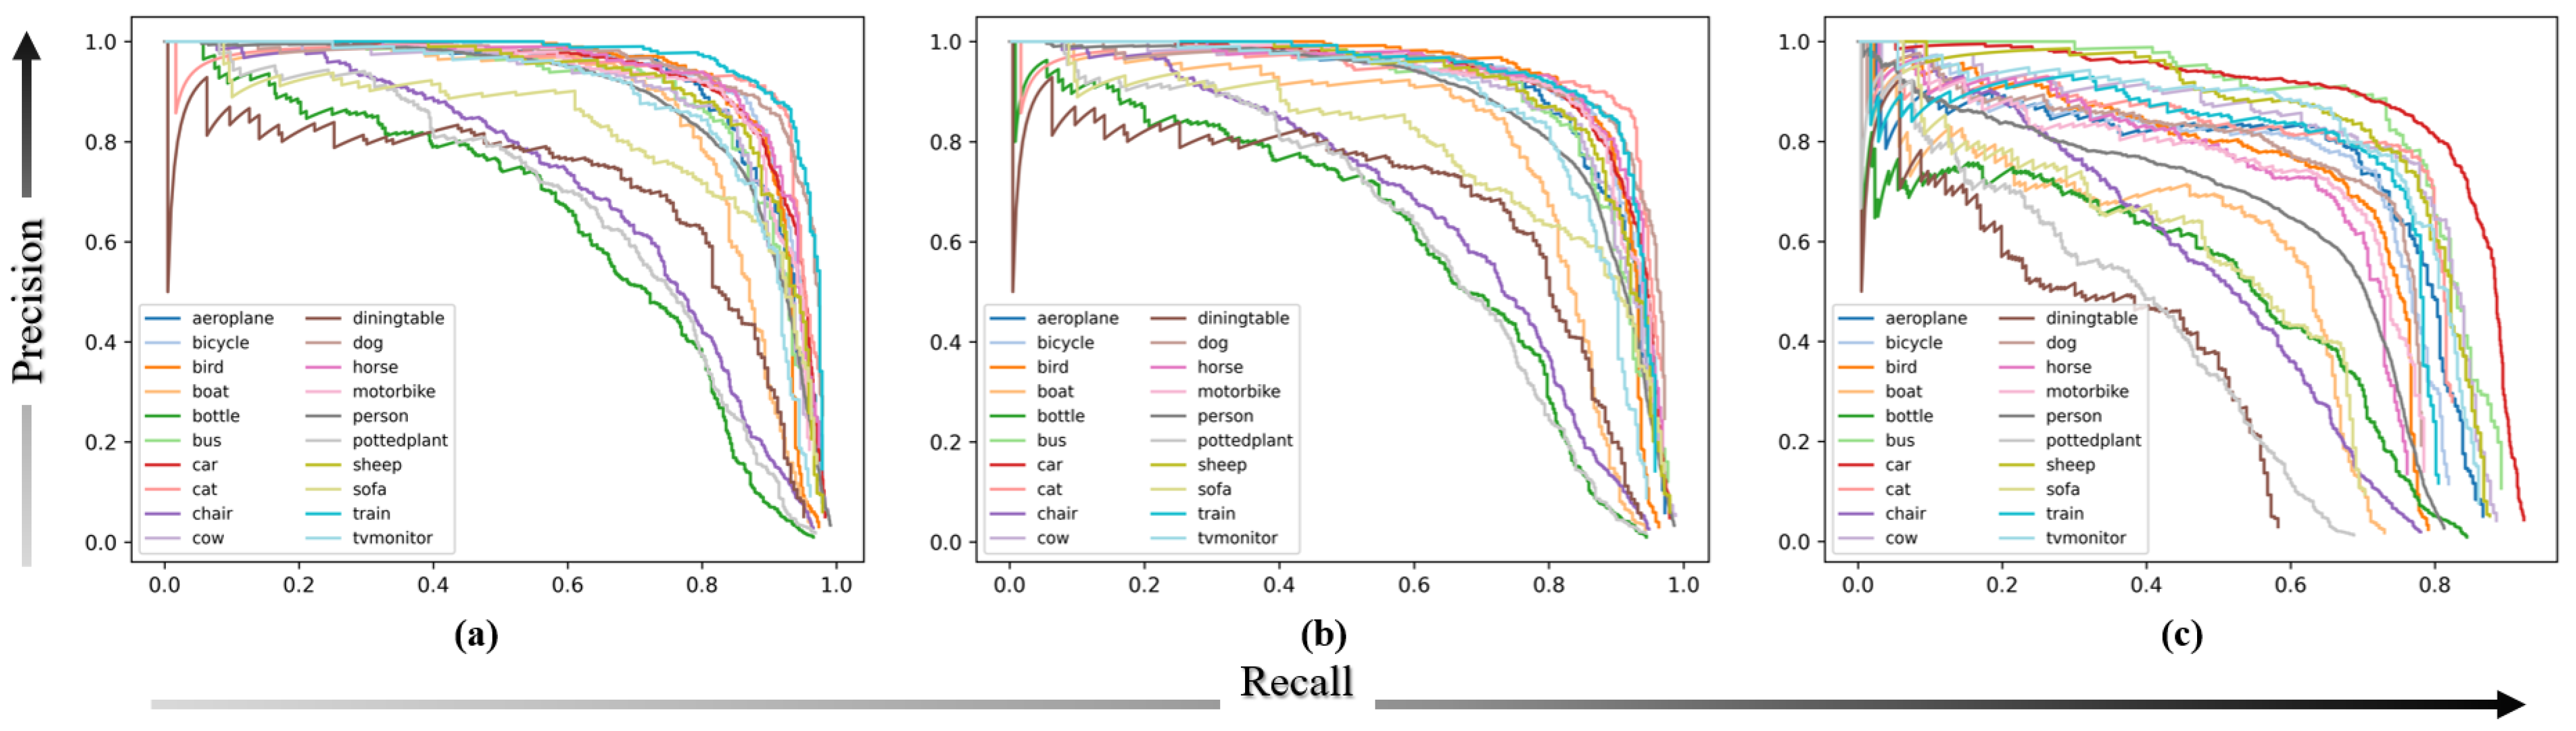
4.4. PASCAL VOC and MS COCO Datasets Detections Results

A prediction was performed with the test set of each public data set to test the detection performance of ESDet. Figure 6 shows the detection result of the PASCAL VOC 07 test, and Figure 7 shows the detection result of the MS CO-CO2017 minival set.
The data set has different distributions of large and small objects. Objects with a fixed size proportional to the feature map size will only be detected if only a single head is used. It was confirmed that both large and small objects were detected since the proposed ESDet uses five heads with different scales. In the case of multiclass classification, the number of objects in the data set is not constant. Therefore, the performance measurement results for each class are shown in Table 6 to check the classification accuracy for each class.
This is the detection performance table of the proposed ESDet-baseline. Most classes has more than 80% AP. However, the bottle, plant, and table objects showed relatively low detection performance. In fact, it is difficult to detect objects when analyzing the data set because the objects are smaller or occluded than other classes. The detection result in Table 6 can be expressed as a precision–recall curve as shown in Figure 8.
As shown in the curve graph above, the precision value of the objects mentioned above and small or occluded objects decreased as the IoU threshold increased.

4.5. Ablation Study

An ablation study of the proposed network was performed based on the ESDet-baseline (EfficientNet-B0). The objective of this study, which is based on the baseline network, is to find the optimal network by expanding or reducing the network. The resection studies conducted in this experiment are network extension, network compression, and refining process test.

4.5.1. Network Extension

EfficientNet extends the network using compound scaling. EfficientDet using the same backbone showed high accuracy by gradually increasing the input resolution. The neural network effectively detect small objects as the input resolution increases. However, it is necessary to design the network after understanding the trade-off relationship between the performance and speed because the area to be calculated widens. As shown in Table 7, ESDet-baseline was expanded according to the input resolution and then evaluated with the PASCAL VOC 07 test set.
An improved mAP was achieved by replacing the input resolution and backbone of ESDet. The number of pixels to be processed increases and the network needs to be configured deeply as the input resolution increases, as shown in Table 3. Moreover, the number of proposals it generates for each head of the network increases, increasing the number of parameters and training time. In the case of a network in which EfficientNet-B7 is applied, the highest mAP was achieved in the one-stage series. A 0.2% improvement in the detection accuracy than the SNIPER was found compared with the two-stage series. The Cascade Eff-B7 is approximately 2.2% lower than NAS-FPN, indicating that the proposed ESDet-B7 shows better detection efficiency because of its one-stage architecture.

4.5.2. Network Compression

We further proposed a model that compressed the input resolution of the baseline network and minimized proposals (ESDet-tiny) due to the need of minimizing network parameters for portability. The baseline network repeated the feature pyramid three times. However, the compressed network performed postpropagation detection only once without repeating the feature pyramid. Table 8 shows the comparison of the compressed baseline networks.
Low detection results are apparent with fewer region proposals because there are fewer objects to detect. In addition, the parameters also affect the detection accuracy of the detector during detection. Through experiments, the effects of proposals, parameters, and network architecture on detection performance were confirmed. In the reduced network, which has an architecture that utilizes features extracted from the backbone, only the proposals according to the pyramid structure and the input resolution are changed. Moreover, detection can be performed in an environment that provides limited resources since Tiny SSD requires a little overhead. Finally, the network should be designed with a detection architecture, which does not rely on a separate feature extractor (e.g., backbone network) like Tiny SSD, when high-speed detection is required after being transplanted to an embedded device.

4.5.3. Refining Process Test

In the proposed network architecture shown in Figure 2, the features between the upsampling and downsampling paths were applied to each head of the add-attention path and were compared. The refining process was individually applied to the S2, S3, and S4 features involved in all five heads in the feature pyramid, as shown in Figure 3. The experiment is based on the proposed baseline network, and the comparison results are presented in Table 9.
The mAP decreased by 1.8% compared to the baseline network when the refining process was not applied. Moreover, there was a 0.7% improvement when applied to the S2 layer, and a 1.2% improvement was observed when added to the S3 layer. Furthermore, the proposed network was effective to apply to the S2, S3 and S4 scales involved in all heads, which was confirmed through experiments.

5. Discussion

Most proposed detectors have a trade-off between accuracy and speed. Various CNN models have slower speed in limited resources, including mobile applications, IoT service devices, and embedded devices. One of the main objectives of this study is to find the optimal trade-off between accuracy and speed. Therefore, we proposed a network with an optimal trade-off verified through experiments. The performance of the detector was evaluated similarly with the other detector by using quantitative evaluation methods, which includes the precision–recall and average precision. Results showed that the proposed network has a competitive performance when compared with other detectors. Furthermore, we suggest that the feature extractor–multiheads structure should be changed into a single head type for better application in small devices.

6. Conclusions

In this study, we proposed a novel lightweight network, called ESDet, for efficient object detection by extracting features required for detection and stacking these extracted features from the EfficientNet backbone into a feature pyramid. Moreover, noise information that are unnecessary for detection was suppressed by applying the proposed feature refining process between feature pyramids. In addition, the network was scaled proportionally to the input resolution to check the detector performance. The ESDet-baseline is defined based on EfficientNet-B0 and is extended to ESDet-B7 according to the input resolution. Then, the experiment was compared with the latest detectors with AP, which is a quantitative evaluation method in PASCAL VOC and MS COCO data sets. Both PASCAL VOC and MS COCO data sets achieved competitive detection accuracy with fewer parameters than that of the latest detectors. Finally, we confirmed that the proposed network has an optimal architecture through ablation studies.

Author Contributions

Conceptualization, C.P. and S.L.; data curation, C.P.; formal analysis, C.P. and H.H.; investigation, C.P.; methodology, C.P. and S.L.; project administration, S.L.; software, C.P. and H.H.; supervision, S.L. and H.H.; validation, C.P. and H.H.; visualization, C.P.; writing—original draft preparation, C.P.; writing—review and editing, S.L. and H.H. All authors have read and agreed to the published version of the manuscript.

Funding

The present research has been conducted by the Research Grant of Kwangwoon University in 2021.

Data Availability Statement

The data presented in this study are openly available online: http://host.robots.ox.ac.uk/pascal/VOC/voc2007/index.html, http://host.robots.ox.ac.uk/pascal/VOC/voc2012/index.html (accessed on 26 May 2020), reference number [17], and https://cocodataset.org/#home (accessed on 26 May 2020), reference number [18].

Conflicts of Interest

The authors declare no conflict of interest.

References

  1. Lee, Y.; Park, S. A deep learning-based perception algorithm using 3d lidar for autonomous driving: Simultaneous segmentation and detection network (SSADNet). Appl. Sci. 2020, 10, 4486. [Google Scholar] [CrossRef]
  2. Wang, J.; Zhong, Y.; Zheng, Z.; Ma, A.; Zhang, L. RSNet: The Search for Remote Sensing Deep Neural Networks in Recognition Tasks. IEEE Trans. Geosci. Remote Sens. 2021, 59, 2520–2534. [Google Scholar] [CrossRef]
  3. Shao, L.; Zhang, E.; Li, M. An efficient convolutional neural network model combined with attention mechanism for inverse halftoning. Electronics 2021, 10, 1574. [Google Scholar] [CrossRef]
  4. Chollet, F. Xception: Deep Learning with Depthwise Separable Convolutions. In Proceedings of the IEEE Conference on Computer Vision and Pattern Recognition, San Juan, PR, USA , 17–19 June 1997 ; pp. 1251–1258. [Google Scholar]
  5. He, X.; Zhao, K.; Chu, X. AutoML: A Survey of the State-of-the-Art. 2019. Available online: https://arxiv.org/abs/1908.00709 (accessed on 2 August 2019). [CrossRef]
  6. Carion, N.; Massa, F.; Synnaeve, G.; Usunier, N.; Kirillov, A.; Zagoruyko, S. End-to-End Object Detection with Transformers. 2020. Available online: https://link.springer.com/chapter/10.1007/978-3-030-58452-8_13 (accessed on 26 May 2020).
  7. He, K.; Zhang, X.; Ren, S.; Sun, J. Deep Residual Learning for Image Recognition. In Proceedings of the 2016 IEEE Conference on Computer Vision and Pattern Recognition (CVPR), Las Vegas, NV, USA, 27–30 June 2016; pp. 770–778. [Google Scholar] [CrossRef] [Green Version]
  8. Steen, M.; Downe, S.; Bamford, N.; Edozien, L. DenseNet:Densely Connected Convolutional Networks. arXiv 2018, arXiv:1608.06993v5. [Google Scholar]
  9. Howard, A.G.; Zhu, M.; Chen, B.; Kalenichenko, D.; Wang, W.; Weyand, T.; Andreetto, M.; Adam, H. MobileNets: Efficient Convolutional Neural Networks for Mobile Vision Applications. 2017. Available online: https://arxiv.org/abs/1704.04861 (accessed on 17 April 2017).
  10. He, K.; Gkioxari, G.; Dollár, P.; Girshick, R. Mask R-CNN. Ieee Cvpr 2017. pp. 770–778. Available online: https://arxiv.org/abs/1703.06870 (accessed on 20 March 2017).
  11. Redmon, J.; Farhadi, A. YOLOv3: An Incremental Improvement. 2018. Available online: https://arxiv.org/abs/1804.02767 (accessed on 8 April 2018).
  12. Liu, W.; Anguelov, D.; Erhan, D.; Szegedy, C.; Reed, S.; Fu, C.-Y.; Berg, A.C. SSD: Single Shot MultiBox Detector. 2015, pp. 21–37. Available online: https://arxiv.org/abs/1512.02325 (accessed on 8 December 2015). [CrossRef] [Green Version]
  13. Krizhevsky, A.; Sutskever, I.; Hinton, G.E. ImageNet classification with deep convolutional neural networks. Commun. ACM 2017, 60, 84–90. [Google Scholar] [CrossRef]
  14. Simonyan, K.; Zisserman, A. Very Deep Convolutional Networks for Large-Scale Image Recognition. In Proceedings of the 3rd International Conference on Learning Representations, ICLR 2015, San Diego, CA, USA, 7–9 May 2015; pp. 1–14. [Google Scholar]
  15. Tan, M.; Le, Q.V. EfficientNet: Rethinking Model Scaling for Convolutional Neural Networks. 2019. Available online: https://arxiv.org/abs/1905.11946 (accessed on 28 May 2019).
  16. Li, X.; Lai, T.; Wang, S.; Chen, Q.; Yang, C.; Chen, R. Feature Pyramid Network. In Proceedings of the 2019 IEEE International Conference Parallel Distributed Processing with Applications, Big Data & Cloud Computing, Sustainable Computing & Communications, Social Computing & Networking (ISPA/BDCloud/SocialCom/SustainCom), Xiamen, China, 16–18 December 2019; pp. 1500–1504. [Google Scholar]
  17. Everingham, M.; Van Gool, L.; Williams, C.K.I.; Winn, J.; Zisserman, A. The Pascal Visual Object Classes (VOC) Challenge. Int. J. Comput. Vis. 2010, 88, 303–338. [Google Scholar] [CrossRef] [Green Version]
  18. Lin, T.-Y.; Maire, M.; Belongie, S.; Bourdev, L.; Girshick, R.; Hays, J.; Perona, P.; Ramanan, D.; Zitnick, C.L.; Dollár, P. Microsoft COCO: Common Objects in Context. In Proceedings of the IEEE Computer Society Conference on Computer Vision and Pattern Recognition, Zurich, Switzerland, 6–12 September 2014; pp. 3686–3693. [Google Scholar]
  19. Henderson, P.; Ferrari, V. End-to-end training of object class detectors for mean average precision. Encycl. Database Syst. 2016, 1703. [Google Scholar] [CrossRef]
  20. Girshick, R. Fast R-CNN. arXiv 2015, arXiv:1504.08083. [Google Scholar]
  21. Ren, S.; He, K.; Girshick, R.; Sun, J. Faster R-CNN: Towards Real-Time Object Detection with Region Proposal Networks. Biol. Conserv. 2015, 158, 196–204. [Google Scholar] [CrossRef] [PubMed] [Green Version]
  22. Shrivastava, A.; Gupta, A.; Girshick, R. Training Region-based Object Detectors with Online Hard Example Mining. 2016. Available online: https://arxiv.org/abs/1604.03540 (accessed on 12 April 2016).
  23. Kong, T.; Yao, A.; Chen, Y.; Sun, F. HyperNet: Towards Accurate Region Proposal Generation and Joint Object Detection. In Proceedings of the 2016 IEEE Conference on Computer Vision and Pattern Recognition (CVPR), Las Vegas, NV, USA, 27–30 June 2016; Volume 2016, pp. 845–853. [Google Scholar]
  24. Bell, S.; Zitnick, C.L.; Bala, K.; Girshick, R. Inside-Outside Net: Detecting Objects in Context with Skip Pooling and Recurrent Neural Networks. Neural Netw. Stat. Learn. 2015, 8, 337–353. [Google Scholar]
  25. Gidaris, S.; Komodakis, N. Object detection via a multi-region & semantic segmentation-aware CNN model. In Proceedings of the IEEE International Conference on Computer Vision, Santiago, Chile, 7–13 December 2015; pp. 1134–1142. [Google Scholar] [CrossRef] [Green Version]
  26. Dai, J.; Li, Y.; He, K.; Sun, J. R-FCN: Object Detection via Region-based Fully Convolutional Networks. Adv. Neural Inf. Process. Syst. 2016. Available online: https://arxiv.org/abs/1605.06409 (accessed on 20 May 2016).
  27. Zhu, Y.; Zhao, C.; Wang, J.; Zhao, X.; Wu, Y.; Lu, H. CoupleNet: Coupling Global Structure with Local Parts for Object Detection. In Proceedings of the IEEE International Conference on Computer Vision, Venice, Italy, 22–29 October 2017; pp. 4146–4154. [Google Scholar] [CrossRef] [Green Version]
  28. Redmon, J.; Divvala, S.; Girshick, R.; Farhadi, A. You Only Look Once: Unified, Real-Time Object Detection. In Proceedings of the IEEE Conference on Computer Vision and Pattern Recognition (CVPR), Las Vegas, NV, USA, 27–30 June 2016; pp. 779–788. [Google Scholar]
  29. Kong, T.; Sun, F.; Yao, A.; Liu, H.; Lu, M.; Chen, Y. RON: Reverse connection with objectness prior networks for object detection. In Proceedings of the 30th IEEE Conference on Computer Vision and Pattern Recognition (CVPR), Honolulu, HI, USA, 21–26 July 2017; pp. 5936–5944. [Google Scholar] [CrossRef] [Green Version]
  30. Fu, C.-Y.; Liu, W.; Ranga, A.; Tyagi, A.; Berg, A.C. DSSD: Deconvolutional Single Shot Detector. 2017. Available online: https://arxiv.org/abs/1701.06659 (accessed on 23 January 2017).
  31. Redmon, J.; Farhadi, A. YOLO9000: Better, Faster, Stronger. In Proceedings of the 2017 IEEE Conference on Computer Vision and Pattern Recognition (CVPR), Honolulu, HI, USA, 21–26 July 2017; Volume 2017, pp. 6517–6525. [Google Scholar]
  32. Cao, J.; Pang, Y.; Han, J.; Li, X. Hierarchical Shot Detector. In Proceedings of the 2019 IEEE/CVF International Conference on Computer Vision (ICCV), Seoul, Korea, 27 October–2 November 2019; Volume 2019, pp. 9704–9713. [Google Scholar]
  33. Zhang, Z.; He, T.; Zhang, H.; Zhang, Z.; Xie, J.; Li, M. Bag of Freebies for Training Object Detection Neural Networks. 2019. Available online: https://arxiv.org/abs/1902.04103 (accessed on 11 February 2019).
  34. Zhang, S.; Wen, L.; Bian, X.; Lei, Z.; Li, S.Z. Single-Shot Refinement Neural Network for Object Detection. 2017. Available online: https://arxiv.org/abs/1711.06897 (accessed on 18 November 2017).
  35. Tan, M.; Pang, R.; Le, Q.V. EfficientDet: Scalable and Efficient Object Detection. In Proceedings of the 2020 IEEE/CVF Con-ference on Computer Vision and Pattern Recognition (CVPR), Seattle, WA, USA, 13–19 June 2020; pp. 10778–10787. [Google Scholar]
  36. Singh, B.; Najibi, M.; Davis, L.S. SNIPER: Efficient Multi-Scale Training. Adv. Neural Inf. Process. Syst. 2018, 2018, 9310–9320. [Google Scholar]
  37. Ghiasi, G.; Cui, Y.; Srinivas, A.; Qian, R.; Lin, T.-Y.; Cubuk, E.D.; Le, Q.V.; Zoph, B. Simple Copy-Paste is a Strong Data Augmentation Method for Instance Segmentation. 2020. Available online: https://arxiv.org/abs/2012.07177 (accessed on 13 December 2020).
Figure 1. Feature pyramid architecture. A method of fusing extracted feature maps of different scales through upsampling or downsampling processes.
Applsci 11 08692 g001
Figure 2. Efficient Shot Detector (ESDet) architecture.
Applsci 11 08692 g002
Figure 3. Feature refining process.
Applsci 11 08692 g003
Figure 4. Example of detection using a prior anchor box. (a) Example of an adjusted prior anchor box. (b) Detection results using the adjusted anchor box. Three prior boxes are used for each head, and the positive sample most consistent with groundtruth is generated.
Applsci 11 08692 g004
Figure 5. An example of the data augmentation used in the experiment.
Applsci 11 08692 g005
Figure 6. Detection results of the PASCAL VOC 2007 test data set. The network used in the experiment uses an input resolution of 512 × 512, and EfficientNet-B0 is used as the backbone network. (Number of classification classes: 20).
Applsci 11 08692 g006
Figure 7. Detection results of the MS COCO2017 minival data set. The network used in the experiment uses an input resolution of 512 × 512, and EfficientNet-B0 is used as the backbone network. (Number of classification classes: 80).
Applsci 11 08692 g007
Figure 8. Precision–recall curve. (a) IoU threshold of 50%, (b) IoU threshold of 75%, and (c) IoU threshold of 90%.
Applsci 11 08692 g008
Table 1. Lightweight Pyramid Head Scale.
HeadInput ResolutionChannelsFilter Size/Times
S1 64 × 64 40 32 × 32 / 2
S2 32 × 32 80 32 × 32 / 2
S3 16 × 16 112 32 × 32 / 2
S4 8 × 8 64 32 × 32 / 2
S5 4 × 4 64 32 × 32 / 2
Table 2. Prior boxes setting value. It was set based on the input resolution of 512 × 512 . The B o x m i n and B o x m a x values should be gradually expanded when increasing the input resolution.
IndexFeature Size Box min Box max Shrinkage
16415318
232408216
3169218432
4819422864
54310386128
Table 3. Expand the network based on the ESDet-baseline.
DetectorInput ResolutionProposalsPyramid Times/ChannelParams (M)
ESDet-Baseline 512 × 512 16,3683/643.81 M
ESDet-B1 544 × 544 18,4474/886.64 M
ESDet-B2 576 × 576 20,6525/1128.08 M
ESDet-B3 608 × 608 23,0616/16011.91 M
ESDet-B4 640 × 640 25,5187/22420.42 M
ESDet-B5 672 × 672 28,1587/28833.10 M
ESDet-B6 704 × 704 30,8677/28845.34 M
ESDet-B7 736 × 736 33,7987/28868.24 M
Table 4. Detection results on PASCAL VOC 07 test data set. All networks were trained using VOC 07 and VOC 12 train sets.
DetectorBackboneInput ResolutionProposalsFPSmAP (%)
Two-stage
Fast R-CNN [20]VGG-16∼1000 × 60020000.570.0
Faster R-CNN [21]VGG-16∼1000 × 600300773.2
OHEM [22]VGG-16∼1000 × 600300774.6
HyperNet [23]VGG-16∼1000 × 6001000.8876.3
Faster R-CNN [21]ResNet-101∼1000 × 6003002.476.4
ION [24]VGG-16∼1000 × 60040001.2576.5
MR-CNN [25]VGG-16∼1000 × 6002500.0378.2
R-FCN [26]ResNet-101∼1000 × 600300980.5
CoupleNet [27]ResNet-101∼1000 × 6003008.282.7
One-stage
YOLO [28]GoogleNet448 × 448984563.4
RON [29]VGG-16384 × 38430,6001575.4
SSD321 [30]Resnet-101321 × 32117,08011.277.1
SSD300 [12]VGG-16300 × 30087324677.2
YOLOv2 [31]Darknet-19544 × 5448454078.6
DSSD321 [30]Resnet-101321 × 32117,0809.578.6
SSD512 [12]VGG-16512 × 51224,5641979.8
SSD512 [30]Resnet-101513 × 51343,6886.880.6
DSSD513 [30]Resnet-101513 × 51343,6885.581.5
HSD512 [32]VGG-16512 × 512--83.0
YOLOv3 + mixup [33]Darknet-53416 × 41610,64734.583.6
RefineDet512+ [34]VGG-16512 × 51216,32024.183.8
ESDet-baselineEfficientNet-B0512 × 51216,3689981.9
Table 5. Detection results on PASCAL VOC 07 test data set. All networks were trained using VOC 07 and VOC 12 train sets.
DetectorBackboneInput ResolutionAPAP50AP75FPSParams (M)
YOLOv3 [11]Darknet-53608 × 60833.057.934.42065.2
EfficientDet-D0 [35]EfficientNet-B0512 × 51234.653.037.1973.9
ESDet-baselineEfficientNet-B0512 × 51235.155.238.2993.81
Table 6. ESDet-baseline Performance (mAP %) on the PASCAL VOC 2007 Test Set.
aerobikebirdboatbottlebuscarcatchaircow
86.587.587.880.962.385.487.288.468.884.5
tabledoghorsembikepersonplantsheepsofatraintv
69.088.387.986.283.866.185.978.289.583.8
Table 7. Evaluation of results after extending it based on the ESDet-baseline. All evaluations were performed on the PASCAL VOC 07 test set. The (*) mark on the detector means a two-stage detector.
DetectorInput ResolutionmAP (%)
ESDet-B1 (with EfficientNet-B1)512 × 51283.6
ESDet-B2 (with EfficientNet-B2)576 × 57684.2
ESDet-B3 (with EfficientNet-B3)608 × 60885.1
ESDet-B4 (with EfficientNet-B4)640 × 64085.6
ESDet-B5 (with EfficientNet-B5)672 × 67286.1
ESDet-B6 (with EfficientNet-B6)704 × 70486.4
SNIPER [36] *∼1000 × 60086.9
ESDet-B7 (with EfficientNet-B7)736 × 73687.1
Cascade Eff-B7 NAS-FPN [37] *-89.3
Table 8. Comparison of the compressed ESDet-baseline.
DetectorInput ResolutionProposalsParams (M)mAP (%)
ESDet-baseline512 × 51216,3683.8181.9
SSD300 × 300873236.177.2
Tiny SSD300 × 300-1.1361.3
ESDet-tiny300 × 30058173.5976.9
Table 9. Comparison of the compressed ESDet-baseline.
MethodmAP (%)
w/o refining80.1
apply to S2 scale80.8
apply to S2 and S3 scales81.3
apply all scales81.9
Publisher’s Note: MDPI stays neutral with regard to jurisdictional claims in published maps and institutional affiliations.

