Article

ODPA-CNN: One Dimensional Parallel Atrous Convolution Neural Network for Band-Selective Hyperspectral Image Classification

1
Advanced Visual Intelligence Laboratory, Department of Electronic Engineering, Yeungnam University, 280 Daehak-ro, Gyeongsan 38541, Gyeongbuk-do, Korea
2
LIG Nex1, 207 Mabuk-ro, Giheung-gu, Yongin-si 16911, Gyeonggi-do, Korea
*
Author to whom correspondence should be addressed.
Appl. Sci. 2022, 12(1), 174; https://doi.org/10.3390/app12010174
Submission received: 24 November 2021 / Revised: 14 December 2021 / Accepted: 16 December 2021 / Published: 24 December 2021
(This article belongs to the Special Issue Advances in Small Infrared Target Detection Using Deep Learning)

Abstract

:
Recently, hyperspectral image (HSI) classification using deep learning has been actively studied using 2D and 3D convolution neural networks (CNN). However, they learn spatial information as well as spectral information. These methods can increase the accuracy of classification, but do not only focus on the spectral information, which is a big advantage of HSI. In addition, the 1D-CNN, which learns only pure spectral information, has limitations because it uses adjacent spectral information. In this paper, we propose a One Dimensional Parellel Atrous Convolution Neural Network (ODPA-CNN) that learns not only adjacent spectral information for HSI classification, but also spectral information from a certain distance. It extracts features in parallel to account for bands of varying distances. The proposed method excludes spatial information such as the shape of an object and performs HSI classification only with spectral information about the material of the object. Atrous convolution is not a convolution of adjacent spectral information, but a convolution between spectral information separated by a certain distance. We compare the proposed model with various datasets to the other models. We also test with the data we have taken ourselves. Experimental results show a higher performance than some 3D-CNN models and other 1D-CNN methods. In addition, using datasets to which random space is applied, the vulnerabilities of 3D-CNN are identified, and the proposed model is shown to be robust to datasets with little spatial information.

Graphical Abstract

1. Introduction

The hyperspectral image (HSI) is a technique of adding spectral information to spatial information and deriving the state, composition, characteristics, and variation of an object by composing two-dimensional image information according to the spectral band of an electromagnetic wave in the form of a hyperspectral cube [1]. The hyperspectral cube has more than 100 spectral resolution functions, and is classified into multispectral, hyperspectral, and ultra spectral according to the number of spectral bands. A human eye or color camera can also be referred to as spectral imaging because it recognizes the color or state of an object by acquiring spectral information of red, green, and blue. However, usually a spectral image means that it has a larger number of spectral bands. Hyperspectral images do not measure distant spectral bands, but rather contiguous spectral bands [2]. The higher the number of spectral bands, the higher the resolution. The ultra spectral images classify objects according to the chemical composition ratio of solid or liquid, and hyperspectral images can even analyze the chemical composition ratio of gases. These characteristics are used in various fields such as defense, geology, environment, and medical care [3,4,5].
There are two main methods for obtaining hyperspectral images. There are reflection spectroscopy using light reflected from an object and radiation spectroscopy using radiant heat information. Depending on the band of the spectrum to be detected, an appropriate spectroscopy method should be used. In general, reflection spectroscopy detects a spectrum in the VNIR∼SWIR (0.4–2.5 μ m) band, and radiation spectroscopy detects MWIR (3–5 μ m) and LWIR (8–14 μ m). Since the reflected spectral area measures light reflected from an object, it is greatly affected by the surrounding environment, such as the reflected angle and the intensity of light. In contrast, radiative spectroscopy is less susceptible to atmospheric moisture. Reflected spectroscopy is relatively cheaper to acquire than radiated spectroscopy.
Recently, deep learning has been one of the most successful techniques and has been very spectacular in the field of computer vision [6]. Motivated by this successful technique development, deep learning was used to classify HSI in the field of remote sensing [7,8,9]. Compared with the existing manual classification process, HSI data composed of complex spectral bands can be automatically classified effectively through learning with a high level of function. This can effectively respond with the problem of large variability in the signature spectrum. However, the types of features extracted from the deep network may be different; for example, there is spectral information feature extraction, spatial information feature extraction, and spectral-spatial information feature extraction. Spectral information is the most important feature of HSI and is an important factor in classification. Traditional spectral feature extraction (e.g., PCA [10,11] ICA [12] and LDA [13]) is still good, but these linear models find it difficult to process the complex spectral information present in HSI. The 1D-CNN [14,15,16,17] is a representative deep learning network using spectral information feature extraction for HSI classification. In previous studies, it was proved that the performance can be further improved by adding spatial information features to the classifier in HSI classification [18,19]. Adding spatial information here is a subsequent fusion to other feature extraction. In [15,16,20,21,22], PCA is first applied to the entire HSI to reduce the dimensions of the original space, and spatial information of the peripheral pixels of the spectral information being entered is utilized for 2D-CNN. The above methods successfully combined CNN and PCA, combined spatial feature extraction, and reduced computational cost. In addition to the subsequent fusion of spatial information, networks that simultaneously feature spatial information and spectral information have become popular. These deep networks can be divided into three categories—feature fusion by shallowly extracting two features [23,24], feature extraction at once using 3D convolution [15,16,17,25,26,27] and deep feature extraction and the fusion of two pieces of information [28].
The method that subsequently fuses spatial information and the spatial-spectral information feature extraction method have a significantly better performance than the spectral information feature extraction method [9,15,29]. This is because both methods fuse the extraction of other information features in addition to the spectral information.
However, in the hyperspectral data, fusion of other information and the spectral information to classify the hyperspectral image greatly deteriorates the significance of the hyperspectral data.This is a big drawback in some fields. For example, in the military field, which is one of the hyperspectral fields, the detection and classification performance of objects disguised in remote detection is inevitably poor. This is because the disguised object is not given much spatial information. In contrast, the pure spectral information feature extraction is very robust against such problems because it does not classify as spatial information. There is a risk of overfitting due to the limited public dataset. This is verified through hyperspectral images, to which random spatial information is applied. In addition, 3D-CNN, which also uses spatial information, is diluted with feature extraction for spectral information. We prove the problem of 3D-CNN, a network using the spatial-spectral information feature extraction mentioned above, through an experiment in which spatial information is randomly made. Therefore, a deep learning network using only spectral information is the most useful method for HSI information. Among them, 1D-CNN is one of the most actively studied fields in spectral information feature extraction using deep learning. This network excels at spectral information features extraction using 1D-Convolution and it does not undermine the original purpose of the HSI data mentioned above. The 1D-Convolution extracts features of adjacent spectral information according to kernel size. This method produced significant results [14,15,16,17]. This means that 1D-Convolution is a good spectral information feature extractor. However, 1D-Convolution has a limitation because it extracts features only from adjacent spectral information. The spectral information should be able to see the characteristics of the bands away. In addition, by parallelizing feature extraction according to the spectral distance, a band-selective factor was also added to deep learning. In this paper, we propose networks capable of feature extraction even for spectral information that are separated from each other.
Atrous Convolution is also called Dilated convolution. The concept was first introduced in [30], and it can be seen that the performance of deep learning is greatly improved through [31]. Looking at Figure 1, unlike the conventional convolution, the Atrous Convolution can check spectral information separated from each other. This is a very positive factor for deep learning networks that learn spectral information. It is meaningful to classify the spectral information of a substance only with adjacent bands, but it is more meaningful from the viewpoint of HSI data because feature extraction is performed by looking at the association between not only adjacent bands but also distant bands. This can also be seen as an element of band selection. In general 1D-Convolution, the spectral resolution is impaired in the process of extracting features, and this damages spectral information a lot. Based on the above, Atrous Convolution is very suitable for spectral information feature extraction networks.
The three contributions in this paper are summarized as follows:
(1)
The network based on spectral-spatial feature extraction currently being studied is not suitable for HSI classification because it dilutes spectral information in HSI classification. Therefore, a network based on spectral feature extraction is more suitable for HSI classification than a network based on spectral-spatial feature extraction.We train and compare the hyperspectral image data with disguised objects and public data of the hyperspectral image with randomized spatial information in our proposed network and 3D-CNNs [15,25,26,27];
(2)
Existing 1D-CNN extracts features from adjacent spectral information. This refers to the limitation of 1D-CNN and is a weak point in the spectral information feature extraction network. So, we propose a spectral information feature extraction network using the Atrous Convolution;
(3)
When using the Atrous Convolution Layer, spectral information features of various distances can be extracted through parallel processing. So we propose a parallel layer model of the 1D-Atrous Convolution Neural Network.
This paper is organized as follows. Atrous convolution is described in Section 2. In Section 3, we describe our proposed network, which is named ODPA-CNN. The experiment with HSI data is described in Section 4 and compared with other techniques. We conclude the paper in Section 5.

2. Related Work

2.1. Applying CNN to HSI Classification

Deep CNN was first devised in [32], and it has achieved breakthrough results in [33] as the most efficient and successful way to learn visual expressions in the field of image processing architecture. Learning and classifying these visual expressions is to find out differences in visual shapes and shapes between classes. Hyperspectral data with hundreds of spectral bands can be expressed as Figure 2. You can see that there are some classes that the human eye cannot distinguish, but they have a relatively different visual shape. CNN has proven many times that it is capable of a more competitive and higher performance with elements that cannot be seen by the human eye [34,35,36,37]. So, it is very suitable to apply CNN to HSI classification.

2.2. Atrous Convolution

Atrous Convolution was used in DeepLav3 [31], developed by Google, and the performance for segmentation problems in the field of computer vision was effectively improved. In an image, a general convolution is calculated between adjacent pixels, but an atrous convolution calculates a distant pixel according to the rate value and extracts features (Figure 3). This convolution has been applied in the direction used for segmentation in computer vision networks.
The big feature of this convolution is that feature extraction is performed by calculating the pixel values that are separated according to the value of rate. This is a great advantage in HSI classification using spectral information. Convolution of the existing spectral information feature extraction network does not learn deeply about spectral information by calculating it with adjacent spectral information. It does not contribute deeply to the extraction of spectral information features. This can be explained by not selecting adjacent spectroscopy when extracting HSI spectral band features [14,15,16,17].
The 1D-Atrous Convolution can be expressed by Equation (1) and the output y is applied to the spectral specific x for each position i of the filter w, where R means the spectral distance away. As the size of R increases, a wider spectral distance is used for feature extraction, and if R = 1 , it is a typical convolution.
y [ i ] = k x [ i + R · k ] w [ k ] .

3. Proposed One Dimensional Atrous Convolution Nerual Network

3.1. ODPA-CNN

We introduce One Dimensional Parallel Atrous Convolution Neural Network (ODPA-CNN), a CNN for new hyperspectral classification. The proposed CNN model is outlined in Figure 4. The input spectral data goes through the first convolution layer and then the atrous convolution layer. Here, each parallel computation is performed using various sized Atrous Convolutions. When using atrous convolution with a bigger size of rate value, it includes padding values. It causes spectral information corruption. After that, the calculated features are combined and then passed through the remaining convolutional layers. After that, the output is completed through a full connection. Paragraphs for each layer are in Table 1. Each rate size of 1D-Convolution layer is 1, 6, 12, and 18. The reason is: first, because parallel processing is performed, the effect of parallel processing is small if the difference between the rate sizes is small. Second, if the difference between the rate sizes is too large, there is a possibility that the largest layer exceeds the size of the spectral information, and the spectral information is distorted.

3.2. Atrous Convolution Layer

In CNN, the convolution layer is a part for feature extraction. In hyperspectral image classification using 1D-CNN, it is used to extract spectral information features. As mentioned earlier, the convolution layer in the existing 1D-CNN features only adjacent spectral information. This can be confirmed from Equation (2). On the other hand, the Atrous Convolution Layer can extract features from distant spectral information according to the size of l as shown in Equation (3). Figure 5 represents 1D-atruos convolution with a kernel size of 3 and a rate size of 3.
y [ n ] = x [ n ] h [ n ] = x [ k ] h [ n k ]
y [ n ] = ( x R · h ) [ n ] = x [ k ] h [ n R · k ] .

3.3. Activation Function

The features extracted from the above convolution layer come out quantitatively. What makes this more curved is the Activation function. The Rectified Linear Unit (ReLU) is one of the most popular activation functions. The advanced ReLU6 is a function in which x is 0 for less than 0, x for more than 0 and 6 for more than 6 (Equation (4)). In our proposed CNN, we used an activation function called Hard-swish (5). Hard-swish is shown better performance than other activation functions [38]. Hard-swish [38] is a function that is slightly dented on the negative side, unlike the existing ReLU function. Therefore, this function is more curved than ReLU. In other words, ReLU does not differentiate from 0 and stops updating, but Hard-swish does not. Figure 6 shows the graph of ReLU6 and Hard-swish
ReLU 6 ( x ) = 0 ( if x < 0 ) x ( if 0 x < 6 ) 6 ( if x 6 )
Hard swish ( x ) = x ReLU 6 ( x + 3 ) 6 .

3.4. Optimizer and Loss Function

The loss function represents the interval between the actual correct answer and the predicted value. In other words, the higher the loss, the greater the gap difference, and the network learns in the direction of reducing it.
The proposed model uses Cross Entropy(CE). t i is the ground truth (correct answer), and s i is the i-th element of the score vector, which is the output of the last layer of CNN for each class i.
C E = i C t i log ( s i ) .
The optimizer is a function that finds the parameters that reduce the value of the loss function as much as possible in the network, that is, the weight and the bias. Optimizer functions include Batch Gradient Descent (BGD) [39] and Stochastic Gradient Descent (SGD) [40]. Currently, the most widely used optimizer is Adaptive Moment Estimation (Adam) [41]. Our proposed model also uses the Adam optimizer.

4. Experimental Result

4.1. The Datasets

In our study, hypersepctral datasets are widely used. They are three public datasets (Indian Pines, Salinas, Pavia University) and our dataset, which is named YU Paint data.
Indian Pines hyperspectral data were collected with an Airborne Visible/Infrared Imaging Spectrometer (AVIRIS) sensor, and was obtained in northwest Indiana, USA. It provides a spatial resolution of 20m and 200 spectral channels in the 0.4 to 2.45 μ m region of the visible and infrared spectrum. There are a total of 16 classes. Figure 7 is about the class of the dataset, the RGB image, and the ground truth.
Salinas hyperspectral data were also collected with an AVIRIS sensor and provide 220 spectral channels with a spectral resolution of 3.7 m. Consisting of 16 classes, an area in the Salinas Valley, CA, USA was obtained. Figure 8 is about the class of the dataset, the RGB image, and the ground truth.
Pavia University hyperspectral data were collected with a Reflective Optics System Imaging Spectrometer (ROSIS) sensor. The band range is 0.43–0.86 μ m, and the spatial resolution is 1.3 m. There are nine classes. Figure 9 is about the class of the dataset, the RGB image, and the ground truth.
As shown in Figure 10, the hyperspectral image acquisition system used in the experiment consists of a SPECIM hyperspectral camera, a rotating stage, and an experimental object. The test was painted on an aluminum plate. The spectral resolution of the hyperspectral camera used in the experiment is 2.8 nm, and the CCD sensor stores data as 1392 samples and 1040 bands. However, only 1/4 of the band was used for algorithm speed. The spectrum acquisition range is from 400 nm to 1000 nm. Figure 11 is about the class of the dataset, the RGB image, and the ground truth.
We experimented with the random spatial information of public datasets. Figure 12 presents images of each dataset’s randomly given spatial information. HSI, applying random spatial, can check where the model feature extraction is concentrated among spatial information and spectral information. It can also be assumed that this is an HSI with objects hiding spatial information.

4.2. Experiment Setup

For public datasets, training was conducted at a rate of 10% for trainest and 90% for testset for each label. The trainset and the testset were each randomly selected as different data. As for the hyperspectral data we obtained (hereinafter, YU Paint data), only 50 trainsets were selected from each label. You can see the specific number of trains and test samples in Table 2, Table 3, Table 4 and Table 5. For each model, when training each dataset, the batch size was set to 16∼64, and the epoch was set to 100∼800. The results were compared with the best performance.
Our proposed model is implemented in python and pytorch [42]. Pytorch is a python library for implementing deep learning models. It is an efficient library in which various convolution layers, activation functions, loss functions, optimizers and so forth are defined. The results are generated on a PC equipped with a AMD Ryzen Threadripper 1920X with 4 GHz and Nvdia Geforce GTX 1080ti graphics card.
We compared the proposed model with the representative 1D-CNN Hu model [14] and 3D-CNN models (e.g., Luo model [27], Li model [26], Hamida model [25] and Chen model [15]). We use the YU dataset to prove that the proposed model is better than 3D-CNN models in the HSI dataset with less spatial information. The dataset to which random spatial information was applied was trained in two approaches. First, the models were trained and tested with a dataset of random spatial information and, secondly, models were trained with a general dataset and were tested with a dataset of random spatial information. That is, we conducted the experiment in three ways: (1) Learning and testing with a normal dataset; (2) training and testing with a dataset of random spatial information; (3) training with a normal dataset and testing with a dataset of random spatial information.

4.3. Result and Comparison

The performance indicators for the results were expressed as F1-score (Equation (9)), Accuracy of each class, Overall Accuracy (OA) (Equation (10)), Average Accuracy (AA), and Kappa of all classes. The F1-score is the harmonic average of Precision (Equation (7)) and Recall (Equation (8)). Precision is the proportion of what the model classifies as true that is actually true. Recall is the proportion of what the model predicts as true among what is actually true. OA is the proportion of correct answers predicted correctly from the total data. AA is the average of the accuracy of each class. Kappa is a statistical measure for assessing the confidence of a match between a fixed number of appraisers when categorizing multiple items or classifying items. The measurement metric Kappa was calculated by weighting the measured accuracy. The last measure includes both diagonal and non-diagonal items in the confusion matrix and is a strong indicator of the degree of match.
Precision = TP TP + FP
Recall = TP TP + FN
F 1 score = 2 1 1 / Precision + 1 / Recall = 2 Precision Recall Precision + Recall
OA ( Overall Accuracy ) = TP + TN TP + FN + FP + TN .
TP is True Positive, FP is False Positive, FN is False Negative, and TN is True Negative.

4.3.1. Train and Test with General datasets

Table 6 is the classification result of training and testing the proposed model and the existing 1D-CNN Hu model and 3D-CNN on the Indian Pines dataset. In the case of Indian Pines, the performance is severely problematic due to class imbalance. However, the Hamida model and the proposed model show high performance compared to other models with an OA of about 82%. In view of this, the proposed model is robust against class imbalance. Figure 13 shows the resulting images.
Table 7 shows the classification results of the proposed model and the existing 1D-CNN Hu model and 3D-CNNs trained and tested on the Salinas dataset. The Salinas dataset does not have severe class imbalance compared to the Indian Pines dataset. The proposed model shows overall higher performance than other models except for the Hamida model. This is because the training data is less than 10% of the total data. Hamida model and the proposed model showed high performance with OA of 96% and 92%, respectively. Figure 14 shows the resulting images.
Table 8 shows the classification results of the proposed model and the existing 1D-CNN Hu model and 3D-CNNs trained and tested on the Pavia University dataset. This dataset learns quickly and well because there are few classes. Therefore, high performance was obtained except for models that require a lot of training data. Among them, the Li model, Hamida model, and proposed model are the models with an OA of more than 90%. Figure 15 shows the resulting images.
Through the above data, it can be confirmed that our model is superior to the existing 1D-CNN in comparison with public HSI data. Also The proposed model is strong against class imbalance and less training data.
The Table 9 shows that YU Paint was compared to several 3D-CNN models. Among them, the Luo model, Li model, and Chen model showed low performance. Even looking at all the performance indicators, they came out very low. This comes from the problem of the 3D-CNN. In a situation where there is very little spatial information, 3D-Convolution, which includes spatial feature extraction in addition to spectral information feature extraction, cannot properly extract features. However, among the models based on 3D-CNN, the hamida model showed a very high performance. The reason is that this model contains 1D-Convolution in the middle, so it extracts features to some extent from spectral information. The Hu model is 1D-CNN, but shows low performance. This seems to be from few data. On the other hand, the proposed model shows very high performance with few data. Figure 16 shows the resulting images.
It was confirmed that spatial-spectral feature extraction by 3D-Convolution through the YU Paint data has little effect on data with too little spatial information. In the data, if it is very small, the effect is not great. Through this, it was confirmed that the performance of our proposed ODPA-CNN is very good for very limited data and new data.

4.3.2. Train and Test with Random Spatial datasets

In the previous experiment, the performance of each model was investigated with public datasets and the YU dataset. However, in order to clarify the weakness of the 3D-CNN model, random spatial information was tested.
The training results of the Indian Pines dataset to which the random spatial is applied are in the Table 10. All models except the proposed model deteriorated, and the 3D-CNN models especially were severely degraded.
Table 11 is the training result of the Salinas dataset to which random space is applied. It did not degrade the performance compared to random space Indian Pines, but it still shows a decrease. The Hu model and the proposed model, which are 1D-CNN, did not show any performance degradation.
In the case of the Pavia University dataset to which the random space was applied, like the Salinas dataset, the performance of the 3D-CNN models fell, and the 1D-CNN did not drop significantly. Table 12 shows the results.

4.3.3. Trained with General datasets and Tested with Random Spatial datasets

This experiment learns with data that do not apply random space, and tests the random space data to find out how vulnerable the trained 3D-CNN is in a situation with little spatial information.
The results of Indian Pines are presented in Table 13. The performance of the 3D-CNN models decreased significantly. Only 1D-CNN models maintain performance.
As in the Indian Pines dataset, in the case of the Salinas dataset, the 3D-CNN models have poor performance, and the 1D-CNN model maintains the performance. The results of Indian Pines are presented in Table 14.
The case of the Pavia University dataset is the same as that of other datasets. The 3D-CNN models have a poor performance, and the 1D-CNN models maintain their performance. The results of Indian Pines are presented in Table 15.
Through the above experiments, it can be seen that 3D-CNN models rely heavily on spatial information. It can be seen that 3D-CNN may overfit with excessive feature extraction. Therefore, 1D-CNN, which classifies classes only with spectral information of an object, is more advantageous than 3D-CNN in a situation where there is little spatial information.

4.4. Limitation

Even if the model is processed in parallel and the rate size of the atrous convolution is changed and used, feature extraction according to the band distance inevitably makes the model heavy. Additionally, if you use a more variable size rate, the model becomes heavier and there is a risk of overfitting.

5. Conclusions and Future Work

We propose a new HSI classification model, ODPA-CNN. This model is a CNN using band-selective yosho, spectral feature extraction at various band distances and parallel feature extraction. The proposed model is robust even on new data by experimenting with the data we collected in addition to public data. Through experiments, it was confirmed that the performance of ODPA-CNN in public data was excellent. In addition, it can be confirmed that it has excellent performance in experiments using new data. Through experiments on datasets to which random space is applied, we found out that the weakness of 3D-CNN is the lack of spatial information. In data with little spatial information, 1D-CNN dominates and, among them, our proposed model ODPA-CNN has an excellent performance. In terms of future research, we plan to study band selection in this network that can feature extraction at various band distances. Feature extraction at various band distances is expected to have a very good effect on band selection, which will be a great benefit.

Author Contributions

The contributions were distributed between authors as follows: B.K. wrote the text of the manuscript and programmed the ODPA-CNN. S.K. performed the in-depth discussion of the related literature, and confirmed the accuracy experiments that are exclusive to this paper. I.P. helped collect these new data and played a major role in making the ground truth. C.O. analyzed the experimental results. All authors have read and agreed to the published version of the manuscript.

Funding

This research was funded by LIG Nex1 (grant number: LIGNEX1-2020-0890(02)). This research was supported by the 2021 Yeungnam University Research Grants.

Institutional Review Board Statement

Not applicable.

Informed Consent Statement

Not applicable.

Data Availability Statement

Indian Pines dataset, Pavia University dataset, Salinas dataset (http://www.ehu.eus/ccwintco/index.php/Hyperspectral_Remote_Sensing_Scenes, accessed on 23 November 2021).

Acknowledgments

This work was supported by LIG Nex1 (contract no. LIGNEX1-2020-0890(02)).This work was supported by the 2021 Yeungnam University Research Grants.

Conflicts of Interest

The authors declare no conflict of interest.

References

  1. Chang, C.I. Hyperspectral Imaging: Techniques for SPECTRAL detection and Classification; Springer Science & Business Media: New York, NY, USA, 2003; Volume 1. [Google Scholar]
  2. Hagen, N.A.; Kudenov, M.W. Review of snapshot spectral imaging technologies. Opt. Eng. 2013, 52, 090901. [Google Scholar] [CrossRef] [Green Version]
  3. Lacar, F.; Lewis, M.; Grierson, I. Use of hyperspectral imagery for mapping grape varieties in the Barossa Valley, South Australia. In IGARSS 2001, Scanning the Present and Resolving the Future, Proceedings of the IEEE 2001 International Geoscience and Remote Sensing Symposium (Cat. No. 01CH37217), Sydney, NSW, Australia, 9–13 July 2001; IEEE: New York, NY, USA, 2001; Volume 6, pp. 2875–2877. [Google Scholar]
  4. Bioucas-Dias, J.M.; Plaza, A.; Camps-Valls, G.; Scheunders, P.; Nasrabadi, N.; Chanussot, J. Hyperspectral remote sensing data analysis and future challenges. IEEE Geosci. Remote Sens. Mag. 2013, 1, 6–36. [Google Scholar] [CrossRef] [Green Version]
  5. Calin, M.A.; Parasca, S.V.; Savastru, D.; Manea, D. Hyperspectral imaging in the medical field: Present and future. Appl. Spectrosc. Rev. 2014, 49, 435–447. [Google Scholar] [CrossRef]
  6. LeCun, Y.; Bengio, Y.; Hinton, G. Deep learning. Nature 2015, 521, 436–444. [Google Scholar] [CrossRef] [PubMed]
  7. Zhang, L.; Zhang, L.; Du, B. Deep learning for remote sensing data: A technical tutorial on the state of the art. IEEE Geosci. Remote Sens. Mag. 2016, 4, 22–40. [Google Scholar] [CrossRef]
  8. Zhu, X.X.; Tuia, D.; Mou, L.; Xia, G.S.; Zhang, L.; Xu, F.; Fraundorfer, F. Deep learning in remote sensing: A comprehensive review and list of resources. IEEE Geosci. Remote Sens. Mag. 2017, 5, 8–36. [Google Scholar] [CrossRef] [Green Version]
  9. Li, S.; Song, W.; Fang, L.; Chen, Y.; Ghamisi, P.; Benediktsson, J.A. Deep learning for hyperspectral image classification: An overview. IEEE Trans. Geosci. Remote Sens. 2019, 57, 6690–6709. [Google Scholar] [CrossRef] [Green Version]
  10. Licciardi, G.; Marpu, P.R.; Chanussot, J.; Benediktsson, J.A. Linear versus nonlinear PCA for the classification of hyperspectral data based on the extended morphological profiles. IEEE Geosci. Remote Sens. Lett. 2011, 9, 447–451. [Google Scholar] [CrossRef] [Green Version]
  11. Prasad, S.; Bruce, L.M. Limitations of principal components analysis for hyperspectral target recognition. IEEE Geosci. Remote Sens. Lett. 2008, 5, 625–629. [Google Scholar] [CrossRef]
  12. Villa, A.; Benediktsson, J.A.; Chanussot, J.; Jutten, C. Hyperspectral image classification with independent component discriminant analysis. IEEE Trans. Geosci. Remote Sens. 2011, 49, 4865–4876. [Google Scholar] [CrossRef] [Green Version]
  13. Bandos, T.V.; Bruzzone, L.; Camps-Valls, G. Classification of hyperspectral images with regularized linear discriminant analysis. IEEE Trans. Geosci. Remote Sens. 2009, 47, 862–873. [Google Scholar] [CrossRef]
  14. Hu, W.; Huang, Y.; Wei, L.; Zhang, F.; Li, H. Deep convolutional neural networks for hyperspectral image classification. J. Sens. 2015, 2015, 258619. [Google Scholar] [CrossRef] [Green Version]
  15. Chen, Y.; Jiang, H.; Li, C.; Jia, X.; Ghamisi, P. Deep feature extraction and classification of hyperspectral images based on convolutional neural networks. IEEE Trans. Geosci. Remote Sens. 2016, 54, 6232–6251. [Google Scholar] [CrossRef] [Green Version]
  16. Haut, J.M.; Paoletti, M.E.; Plaza, J.; Li, J.; Plaza, A. Active learning with convolutional neural networks for hyperspectral image classification using a new bayesian approach. IEEE Trans. Geosci. Remote Sens. 2018, 56, 6440–6461. [Google Scholar] [CrossRef]
  17. Yang, X.; Ye, Y.; Li, X.; Lau, R.Y.; Zhang, X.; Huang, X. Hyperspectral image classification with deep learning models. IEEE Trans. Geosci. Remote Sens. 2018, 56, 5408–5423. [Google Scholar] [CrossRef]
  18. Ghamisi, P.; Maggiori, E.; Li, S.; Souza, R.; Tarablaka, Y.; Moser, G.; De Giorgi, A.; Fang, L.; Chen, Y.; Chi, M.; et al. New frontiers in spectral-spatial hyperspectral image classification: The latest advances based on mathematical morphology, Markov random fields, segmentation, sparse representation, and deep learning. IEEE Geosci. Remote Sens. Mag. 2018, 6, 10–43. [Google Scholar] [CrossRef]
  19. Fang, L.; Li, S.; Kang, X.; Benediktsson, J.A. Spectral–spatial classification of hyperspectral images with a superpixel-based discriminative sparse model. IEEE Trans. Geosci. Remote Sens. 2015, 53, 4186–4201. [Google Scholar] [CrossRef]
  20. Yue, J.; Zhao, W.; Mao, S.; Liu, H. Spectral–spatial classification of hyperspectral images using deep convolutional neural networks. Remote Sens. Lett. 2015, 6, 468–477. [Google Scholar] [CrossRef]
  21. Makantasis, K.; Karantzalos, K.; Doulamis, A.; Doulamis, N. Deep supervised learning for hyperspectral data classification through convolutional neural networks. In Proceedings of the 2015 IEEE International Geoscience and Remote Sensing Symposium (IGARSS), Milan, Italy, 26–31 July 2015; pp. 4959–4962. [Google Scholar]
  22. Fang, L.; Liu, Z.; Song, W. Deep hashing neural networks for hyperspectral image feature extraction. IEEE Geosci. Remote Sens. Lett. 2019, 16, 1412–1416. [Google Scholar] [CrossRef]
  23. Mei, S.; Ji, J.; Hou, J.; Li, X.; Du, Q. Learning sensor-specific spatial-spectral features of hyperspectral images via convolutional neural networks. IEEE Trans. Geosci. Remote Sens. 2017, 55, 4520–4533. [Google Scholar] [CrossRef]
  24. Kang, X.; Li, C.; Li, S.; Lin, H. Classification of hyperspectral images by Gabor filtering based deep network. IEEE J. Sel. Top. Appl. Earth Obs. Remote Sens. 2017, 11, 1166–1178. [Google Scholar] [CrossRef]
  25. Ben Hamida, A.; Benoit, A.; Lambert, P.; Ben Amar, C. 3-D Deep Learning Approach for Remote Sensing Image Classification. IEEE Trans. Geosci. Remote Sens. 2018, 56, 4420–4434. [Google Scholar] [CrossRef] [Green Version]
  26. Li, Y.; Zhang, H.; Shen, Q. Spectral—Spatial Classification of Hyperspectral Imagery with 3D Convolutional Neural Network. Remote Sens. 2017, 9, 67. [Google Scholar] [CrossRef] [Green Version]
  27. Luo, Y.; Zou, J.; Yao, C.; Zhao, X.; Li, T.; Bai, G. HSI-CNN: A novel convolution neural network for hyperspectral image. In Proceedings of the 2018 International Conference on Audio, Language and Image Processing (ICALIP), Shanghai, China, 16–17 July 2018; pp. 464–469. [Google Scholar]
  28. Ghamisi, P.; Plaza, J.; Chen, Y.; Li, J.; Plaza, A.J. Advanced spectral classifiers for hyperspectral images: A review. IEEE Geosci. Remote Sens. Mag. 2017, 5, 8–32. [Google Scholar] [CrossRef] [Green Version]
  29. Imani, M.; Ghassemian, H. An overview on spectral and spatial information fusion for hyperspectral image classification: Current trends and challenges. Inf. Fusion 2020, 59, 59–83. [Google Scholar] [CrossRef]
  30. Yu, F.; Koltun, V.; Funkhouser, T. Dilated residual networks. In Proceedings of the IEEE Conference on Computer Vision and Pattern Recognition, Honolulu, HI, USA, 21–26 July 2017; pp. 472–480. [Google Scholar]
  31. Chen, L.C.; Papandreou, G.; Kokkinos, I.; Murphy, K.; Yuille, A.L. Deeplab: Semantic image segmentation with deep convolutional nets, atrous convolution, and fully connected crfs. IEEE Trans. Pattern Anal. Mach. Intell. 2017, 40, 834–848. [Google Scholar] [CrossRef]
  32. LeCun, Y.; Boser, B.; Denker, J.S.; Henderson, D.; Howard, R.E.; Hubbard, W.; Jackel, L.D. Backpropagation applied to handwritten zip code recognition. Neural Comput. 1989, 1, 541–551. [Google Scholar] [CrossRef]
  33. Krizhevsky, A.; Sutskever, I.; Hinton, G.E. ImageNet Classification with Deep Convolutional Neural Networks. Commun. ACM 2017, 60, 84–90. [Google Scholar] [CrossRef]
  34. Krizhevsky, A.; Sutskever, I.; Hinton, G.E. ImageNet Classification with Deep Convolutional Neural Networks. In Advances in Neural Information Processing Systems; Pereira, F., Burges, C.J.C., Bottou, L., Weinberger, K.Q., Eds.; Curran Associates, Inc.: London, UK, 2012; Volume 25. [Google Scholar]
  35. Simonyan, K.; Zisserman, A. Very Deep Convolutional Networks for Large-Scale Image Recognition. arXiv arXiv:1409.1556, 2015.
  36. Szegedy, C.; Liu, W.; Jia, Y.; Sermanet, P.; Reed, S.; Anguelov, D.; Erhan, D.; Vanhoucke, V.; Rabinovich, A. Going Deeper With Convolutions. In Proceedings of the IEEE Conference on Computer Vision and Pattern Recognition (CVPR), Boston, MA, USA, 7–12 June 2015. [Google Scholar]
  37. He, K.; Zhang, X.; Ren, S.; Sun, J. Deep Residual Learning for Image Recognition. In Proceedings of the IEEE Conference on Computer Vision and Pattern Recognition (CVPR), Las Vegas, NV, USA, 27–30 June 2016. [Google Scholar]
  38. Howard, A.; Sandler, M.; Chu, G.; Chen, L.C.; Chen, B.; Tan, M.; Wang, W.; Zhu, Y.; Pang, R.; Vasudevan, V.; et al. Searching for mobilenetv3. In Proceedings of the IEEE/CVF International Conference on Computer Vision, Seoul, Korea, 27–28 October 2019; pp. 1314–1324. [Google Scholar]
  39. Ruder, S. An overview of gradient descent optimization algorithms. arXiv 2016, arXiv:1609.04747. [Google Scholar]
  40. Bottou, L. Stochastic gradient descent tricks. In Neural Networks: Tricks of the Trade: Heildelberg, Dordrecht, London, New York; Springer: Berlin/Heidelberg, Germany, 2012; pp. 421–436. [Google Scholar]
  41. Kingma, D.P.; Ba, J. Adam: A Method for Stochastic Optimization. arXiv 2017, arXiv:1412.6980. [Google Scholar]
  42. Paszke, A.; Gross, S.; Massa, F.; Lerer, A.; Bradbury, J.; Chanan, G.; Killeen, T.; Lin, Z.; Gimelshein, N.; Antiga, L.; et al. PyTorch: An Imperative Style, High-Performance Deep Learning Library. In Advances in Neural Information Processing Systems 32; Wallach, H., Larochelle, H., Beygelzimer, A., d’Alché-Buc, F., Fox, E., Garnett, R., Eds.; Curran Associates, Inc.: London, UK, 2019; pp. 8024–8035. [Google Scholar]
Figure 1. Differences of 1D-Convolution and 1D-Atrous Convolution. (a) 1D-Convolution. (b) 1D-Atrous Convolution. The gray regions are not included in the calculation when calculating one kernel in the convolution. In general, the 1D-Convolution calculates only limited neighbors, but the 1D-Atrous Convolution calculates far distances as well.
Applsci 12 00174 g001
Figure 2. Examples of paint spectral of YU dataset acquired in an outdoor environment. This shows how difficult it is to classify spectral information.
Applsci 12 00174 g002
Figure 3. Basic concept of Atrous convolution in 2D image processing.
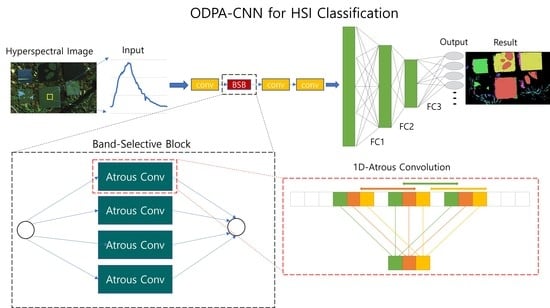
Applsci 12 00174 g003
Figure 4. Proposed CNN Model, ODPA-CNN: AtConv is 1D-Atrous Convolution. Conv is normal 1D-Convolution. Table 1 has detailed parameters of each convolution. In this model, AtConv is processed in parallel to extract features for bands separated by various distances.
Applsci 12 00174 g004
Figure 5. Concept of spectral feature extraction using 1D-Atrous Convolution: Example has 3 kernel size and 3 rate size.
Applsci 12 00174 g005
Figure 6. Graph of ReLU6 and Hard-swish: (a) ReLU6 (b) Hard-swish.
Applsci 12 00174 g006
Figure 7. Indian Pines dataset: Left is the names of classes, Center is ground truth, Right is the RGB image.
Applsci 12 00174 g007
Figure 8. Salinas dataset: Left is the names of classes, Center is ground truth, Right is the RGB image.
Applsci 12 00174 g008
Figure 9. Pavia University dataset: Left is the names of classes, Center is ground truth, Right is the RGB image.
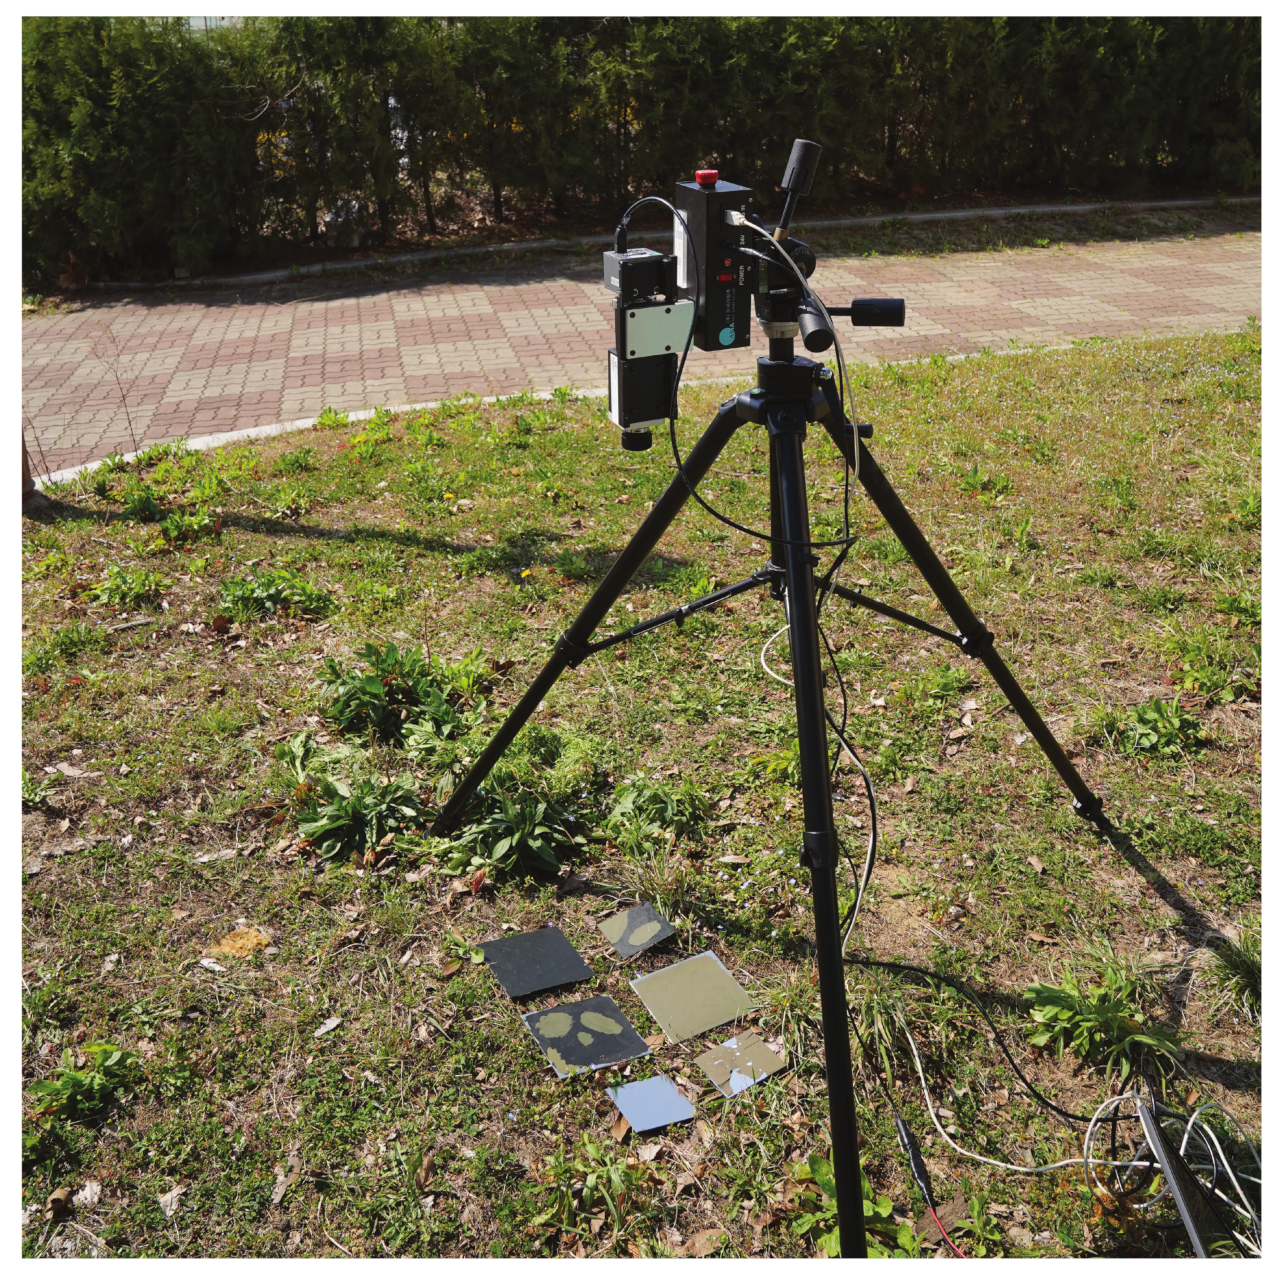
Applsci 12 00174 g009
Figure 10. Acquisition of the YU paint data.
Applsci 12 00174 g010
Figure 11. YU Paint dataset: Left is the names of classes, Top is ground truth, Bottom is the RGB image.
Applsci 12 00174 g011
Figure 12. HSI datasets applied random spatial information: (a) Indian Pines, (b) Pavia University, (c) Salinas.
Applsci 12 00174 g012
Figure 13. Classification results of Indian Pines: (a) ground truth, (b) Luo model, (c) Li model, (d) Hamida model, (e) Chen model, (f) Hu model, (g) proposed ODPA-CNN.
Applsci 12 00174 g013
Figure 14. Classification results of Salinas: (a) ground truth, (b) Luo model, (c) Li model, (d) Hamida model, (e) Chen model, (f) Hu model, (g) proposed ODPA-CNN.
Applsci 12 00174 g014
Figure 15. Classification results of Pavia University: (a) ground truth, (b) Luo model, (c) Li model, (d) Hamida model, (e) Chen model, (f) Hu model, (g) proposed ODPA-CNN.
Applsci 12 00174 g015
Figure 16. Classification results of YU Paint and Comparison of 3D-CNNs and the proposed ODPA-CNN: (a) ground truth, (b) Luo model, (c) Li model, (d) Hamida model, (e) Chen model, (f) Hu model, (g) proposed ODPA-CNN.
Applsci 12 00174 g016
Table 1. The parameters of ODPA-CNN.
LayersKernel SizeFeature MapsDilated RateStridePadding
Conv111111
Conv2_1132110
Conv2_2332616
Conv2_333212112
Conv2_433218118
Conv316411same
Conv433211same
Conv533211same
FC1Input: feature size, Output: feature size/2
FC2Output: 128
FC3Output: number of classes
Table 2. Number of train and test sample in the Indian Pines dataset.
#Class NameTotalTrainTest
1Alfalfa46442
2Corn-notill14281421286
3Corn-mintill83083747
4Corn23723214
5Grass-pasture48348435
6Grass-trees73073657
7Grass-pasture-mowed28226
8Hay-windrowed47847431
9Oats20218
10Soybean-notill97297875
11Soybean-mintill24552452210
12Soybean-clean59359534
13Wheat20520185
14Woods12651261139
15Buildings-Grass-Trees-Drives38638348
16Stone-Steel-Towers93984
Table 3. Number of train and test sample in the Salinas dataset.
#Class NameTotalTrainTest
1Brocoli_green_weeds_120092001809
2Brocoli_green_weeds_237263723354
3Fallow19761971779
4Fallow_rough_plow13941391255
5Fallow_smooth26782672411
6Stubble39593953564
7Celery35793573222
8Grapes_untrained11,271112710,144
9Soil_vinyard_develop62036205583
10Corn_senesced_green_weeds32783272951
11Lettuce_romaine_4wk1068106962
12Lettuce_romaine_5wk19271921735
13Lettuce_romaine_6wk91691825
14Lettuce_romaine_7wk1070107963
15Vinyard_untrained72687266542
16Vinyard_vertical_trellis18071801627
Table 4. Number of train and test sample in the Pavia University dataset.
#Class NameTotalTrainTest
1Asphalt66316635968
2Meadows18,649186416,785
3Gravel20992091890
4Trees30643062758
5Painted metal sheets13451341211
6Bare Soil50295024527
7Bitumen13301331197
8Self-Blocking Bricks36823683314
9Shadows94794853
Table 5. Number of train and test sample in the YU Paint dataset.
#Class NameTotalTrainTest
1bright paint26,7345026,684
2dark paint28,7375028,687
3aluminum10,9775010,927
4grass3516503466
5fallen leaves1326501276
6shadow2616502566
Table 6. Classification results of the Indian Pines dataset to which random spatial information is not applied.
Luo ModelLi ModelHamida Model
#F1-ScoreAccuracyF1-ScoreAccuracyF1-ScoreAccuracy
10.0000.00%0.18912.20%0.73560.98%
20.0020.08%0.62361.79%0.74476.34%
30.0000.00%0.53950.47%0.75971.89%
40.0000.00%0.44841.78%0.80383.10%
50.0000.00%0.87881.84%0.91889.89%
60.51679.76%0.88288.58%0.97297.11%
70.0000.00%0.78372.00%0.85180.00%
80.36432.56%0.93998.60%0.97899.07%
90.0000.00%0.38938.89%0.88283.33%
100.0000.00%0.61062.86%0.76675.77%
110.53696.97%0.72573.21%0.81982.17%
120.0000.00%0.56357.30%0.68364.04%
130.0000.00%0.94596.76%0.99298.38%
140.81699.21%0.95194.64%0.97097.37%
150.0000.00%0.55150.43%0.76570.03%
160.0000.00%0.85175.00%0.95792.86%
OA(%)42.688%61.34%82.851%
AA(%)19.29%66.02%82.64%
Kappa0.2970.70100.804
Chen ModelHu ModelProposed Model
#F1-ScoreAccuracyF1-ScoreAccuracyF1-ScoreAccuracy
10.96395.12%0.0000.00%0.71459.52%
20.91189.73%0.48236.50%0.78379.32%
30.51535.48%0.50645.78%0.73171.08%
40.42728.64%0.41740.38%0.63968.22%
50.69956.09%0.1408.28%0.91289.89%
60.95996.04%0.81997.11%0.93693.15%
70.90292.00%0.31220.00%0.83376.92%
80.73959.07%0.93398.37%0.96499.54%
90.63677.78%0.0000.00%0.70372.22%
100.85680.46%0.52346.06%0.76176.46%
110.90886.15%0.68586.97%0.82381.76%
120.74863.48%0.45035.96%0.76074.91%
130.96699.46%0.86292.97%0.92394.05%
140.84274.28%0.84096.49%0.93192.27%
150.33219.88%0.33222.77%0.64166.09%
160.64251.19%0.97695.24%0.89798.81%
OA(%)73.420%64.455%82.342%
AA(%)69.05%51.43%80.89%
Kappa0.7040.5850.799
Table 7. Classification results of the Salinas dataset to which random spatial information is not applied.
Luo ModelLi ModelHamida Model
#F1-ScoreAccuracyF1-ScoreAccuracyF1-ScoreAccuracy
10.00011.06%0.90489.11%0.98396.74%
20.0020.18%0.94794.28%1100.00%
30.00039.24%0.84282.41%0.99399.72%
40.00099.84%0.95894.34%0.99399.92%
50.00094.73%0.89390.17%0.99599.50%
60.51698.15%0.99098.74%0.99699.27%
70.00099.29%0.98497.30%0.99599.22%
80.36498.58%0.81880.58%0.9293.66%
90.00097.21%0.95395.24%0.99899.77%
100.00055.66%0.87184.85%0.97896.07%
110.5360.00%0.76271.00%0.97496.36%
120.00032.76%0.87686.57%0.98998.04%
130.0000.00%0.86784.48%0.9998.42%
140.8167.17%0.86483.28%0.98797.92%
150.0000.00%0.74072.67%0.86786.37%
160.00012.18%0.94090.29%0.94790.77%
OA(%)59.605%86.512%95.269%
AA(%)46.63%87.21%96.99%
Kappa0.5390.8500.947
Chen ModelHu ModelProposed Model
#F1-ScoreAccuracyF1-ScoreAccuracyF1-ScoreAccuracy
10.96380.20%0.985100%0.96793.68%
20.91198.87%0.98997.95%0.98099.69%
30.51594.83%0.93095.88%0.98998.99%
40.42792.83%0.98898.73%0.98897.66%
50.69993.40%0.95993.56%0.98398.66%
60.95991.05%0.99999.94%0.99899.94%
70.90291.24%0.99399.13%0.999100%
80.73984.39%0.76178.94%0.86280.6%
90.63696.53%0.99299.09%0.99599.04%
100.85688.85%0.89085.64%0.96797.52%
110.90887.72%0.90892.54%0.96698.38%
120.74886.97%0.98397.34%0.98697.31%
130.96689.21%0.96496.25%0.97395.34%
140.84286.81%0.95495.81%0.96497.15%
150.33299.29%0.66764.73%0.74485.93%
160.64239.54%0.97997.68%0.99499.81%
OA(%)87.005%88.66%92.94%
AA(%)87.61%93.32%96.23%
Kappa0.8570.8740.9212
Table 8. Classification results of the Pavia University dataset to which random spatial information is not applied.
Luo ModelLi ModelHamida Model
#F1-ScoreAccuracyF1-ScoreAccuracyF1-ScoreAccuracy
10.83795.16%0.96597.69%0.98297.45%
20.84695.04%0.97394.77%0.99895.84%
30.0000.00%0.92691.05%0.97993.17%
40.66052.14%0.97998.15%0.98996.63%
50.99599.26%0.9999.83%0.98899.83%
60.21313.19%0.97999.87%0.99598.12%
70.0000.00%0.93889.06%0.99697.83%
80.72689.38%0.96294.33%0.88996.29%
90.98597.07%0.99799.53%0.99699.18%
OA(%)74.433%95.932%96.584%
AA(%)60.14%96.03%97.15%
Kappa0.6420.9470.955
Chen ModelHu ModelProposed Model
#F1-ScoreAccuracyF1-ScoreAccuracyF1-ScoreAccuracy
10.96378.74%0.80476.35%0.94294.44%
20.91176.38%0.86779.48%0.95894.52%
30.51574.01%0.05825.41%0.80575.89%
40.42788.32%0.78778.32%0.93097.34%
50.699100.00%0.97696.15%0.99699.59%
60.95992.97%0.35581.65%0.87689.77%
70.90299.58%0.05511.78%0.86492.64%
80.73998.61%0.74762.28%0.85486.62%
90.63695.31%0.99699.3%0.99899.77%
OA(%)83.233%76.71%92.69%
AA(%)89.32%67.86%92.29
Kappa0.7910.66780.9026
Table 9. Classification results of the YU Paint dataset to which random spatial information is not applied.
Luo ModelLi ModelHamida Model
#F1-ScoreAccuracyF1-ScoreAccuracyF1-ScoreAccuracy
10.0000%0.94299.33%0.99799.89%
20.0000%0.69783.69%0.98599.61%
30.0000%0.93699.20%0.99799.91%
40.0904.71%0.85883.27%0.95597.71%
50.0000%0.88797.35%0.98398.73%
60.0000%0.29317.23%0.88881.79%
OA(%)4.694%68.58%98.25%
AA(%)0.79%80.01%96.27%
Kappa0.0000.70100.9748
Chen ModelHu ModelProposed Model
#F1-ScoreAccuracyF1-ScoreAccuracyF1-ScoreAccuracy
10.51437.36%0.05295.34%0.99699.44%
20.0000%0.79999.29%0.99899.90%
30.0000%0.45129.23%0.99099.63%
40.0900%0.81599.87%0.98997.46%
50.0000%0.80667.53%0.99098.08%
60.0000%0.34320.69%0.98081.49%
OA(%)35.54%50.136%99.47%
AA(%)6.23%68.66%98.67%
Kappa0.0160.3860.992
Table 10. Classification results of Indian Pines dataset to which random spatial information is applied.
Luo ModelLi ModelHamida Model
#F1-ScoreAccuracyF1-ScoreAccuracyF1-ScoreAccuracy
10.0000.00%0.31926.83%0.52758.54%
20.0000.00%0.47748.79%0.57555.49%
30.0000.00%0.32528.11%0.40138.02%
40.0000.00%0.33032.86%0.24122.54%
50.0000.00%0.44839.31%0.61652.64%
60.0000.00%0.74674.28%0.85686.15%
70.0000.00%0.1058.00%0.47436.00%
80.0000.00%0.80875.35%0.82977.21%
90.0000.00%0.0000.00%0.43527.78%
100.0000.00%0.40339.20%0.50550.17%
110.000100.00%0.60061.90%0.67871.45%
120.3970.00%0.30026.40%0.43837.08%
130.0000.00%0.70664.32%0.86689.19%
140.0000.00%0.78580.68%0.83483.76%
150.0000.00%0.54651.30%0.55453.31%
160.0000.00%0.80967.86%0.86378.57%
OA(%)0.00054.504%62.829%
AA(%)6.25%45.33%57.37%
Kappa0.0100.4810.575
Chen ModelHu ModelProposed Model
#F1-ScoreAccuracyF1-ScoreAccuracyF1-ScoreAccuracy
10.0000.00%00.00%0.79182.93%
20.4240.00%0.42434.63%0.81082.57%
30.1260.00%0.12611.51%0.78876.97%
40.0000.00%00.00%0.67368.08%
50.0000.00%00.00%0.88687.59%
60.6630.00%0.66397.87%0.93596.65%
70.0000.00%00.00%0.68356.00%
80.8730.00%0.87398.60%0.96598.37%
90.0000.00%00.00%0.60655.56%
100.0710.00%0.0714.80%0.80576.69%
110.58364.89%0.58382.94%0.85485.20%
120.0000.00%00.00%0.80385.77%
130.0000.00%00.00%0.93394.05%
140.8360.00%0.83698.60%0.93895.96%
150.0000.00%00.00%0.60251.59%
160.0000.00%00.00%0.95894.05%
OA(%)49.821%49.821%84.715%
AA(%)26.81%26.81%80.50%
Kappa0.0090.4020.826
Table 11. Classification results of the Salinas dataset to which random spatial information is applied.
Luo ModelLi ModelHamida Model
#F1-ScoreAccuracyF1-ScoreAccuracyF1-ScoreAccuracy
10.0000.00%0.93591.54%0.94893.69%
20.73794.04%0.95695.35%0.93090.10%
30.0000.00%0.86886.40%0.82579.65%
40.96196.02%0.93890.92%0.95592.99%
50.68996.14%0.89287.51%0.90389.42%
60.97895.87%0.97995.93%0.97495.17%
70.91196.49%0.98497.33%0.96193.11%
80.67793.36%0.80979.11%0.81380.80%
90.72398.46%0.94994.68%0.96597.49%
100.0856.20%0.89388.03%0.89790.81%
110.0000.00%0.75468.68%0.82777.00%
120.0000.00%0.91292.10%0.90090.02%
130.0000.00%0.90488.61%0.91090.79%
140.58141.12%0.89387.23%0.90590.65%
150.0683.93%0.73171.84%0.74073.05%
160.0000.00%0.95693.23%0.97797.23%
OA(%)59.534%86.508%87.126%
AA(%)45.10%88.03%88.87%
Kappa0.5370.8500.857
Chen ModelHu ModelProposed Model
#F1-ScoreAccuracyF1-ScoreAccuracyF1-ScoreAccuracy
10.63264.16%0.97695.24%0.99799.45%
20.67362.34%0.98599.88%0.99899.82%
30.37529.45%0.89791.74%0.99299.61%
40.14912.03%0.98599.60%0.99399.52%
50.25820.54%0.94192.49%0.98598.46%
60.58252.43%0.99899.55%0.99999.97%
70.51345.89%0.98199.22%0.99899.81%
80.65576.47%0.79191.01%0.86888.64%
90.73669.59%0.9796.76%0.99799.98%
100.47948.34%0.86587.59%0.97196.71%
110.27123.52%0.80885.85%0.98599.69%
120.28923.36%0.96799.65%0.998100.00%
130.14114.18%0.94797.58%0.99899.64%
140.19917.34%0.93192.32%0.98799.17%
150.60264.44%0.53539.93%0.78876.00%
160.56943.36%0.95592.13%0.98397.60%
OA(%)51.438%87.241%93.953%
AA(%)41.71%91.28%97.13%
Kappa0.4650.8570.933
Table 12. Classification results of the Pavia University dataset to which random spatial information is applied.
Luo ModelLi ModelHamida Model
#F1-ScoreAccuracyF1-ScoreAccuracyF1-ScoreAccuracy
10.64797.17%0.79679.74%0.87287.08%
20.83495.17%0.88189.54%0.91290.97%
30.0000.00%0.47745.61%0.69868.71%
40.48738.76%0.8379.94%0.87784.34%
50.83972.50%0.96895.46%0.98297.03%
60.0261.33%0.63158.45%0.78075.32%
70.0000.00%0.47843.36%0.67162.99%
80.19813.88%0.66168.23%0.77376.10%
90.88980.05%0.95392.97%0.98697.42%
OA(%)64.734%78.511%85.142%
AA(%)44.32%72.59%82.22%
Kappa0.4970.7140.804
Chen ModelHu ModelProposed Model
#F1-ScoreAccuracyF1-ScoreAccuracyF1-ScoreAccuracy
10.24125.49%0.87188.79%0.95995.53%
20.65964.23%0.91398.47%0.97897.96%
30.14311.22%0.60758.71%0.84382.42%
40.14315.08%0.87580.78%0.95896.01%
50.37828.32%0.99398.76%0.99599.75%
60.31126.14%0.62948.06%0.93893.28%
70.1169.44%0.69361.65%0.91491.40%
80.16115.12%0.82783.61%0.88690.37%
90.0736.46%0.99999.88%0.99899.65%
OA(%)39.284%85.444%95.369%
AA(%)22.39%79.86%94.04%
Kappa0.2100.8010.939
Table 13. Classification results of the Indian Pines dataset to which random spatial information is not applied for training and random spatial information to test.
Luo ModelLi ModelHamida Model
#F1-ScoreAccuracyF1-ScoreAccuracyF1-ScoreAccuracy
10.0000.00%0.0000.00%0.0000.00%
20.0704.41%0.0714.20%0.0794.90%
30.0000.00%0.14133.49%0.0886.63%
40.0000.00%0.04616.03%0.07064.14%
50.0000.00%0.0948.49%0.18221.12%
60.15856.03%0.0796.44%0.1237.67%
70.0000.00%0.0187.14%0.03610.71%
80.08425.10%0.12010.88%0.1186.69%
90.0000.00%0.0000.00%0.0000.00%
100.0000.00%0.0493.09%0.0291.54%
110.36136.25%0.1268.07%0.22915.32%
120.0000.00%0.0796.41%0.0624.55%
130.0000.00%0.0432.93%0.27025.85%
140.27917.55%0.19211.94%0.55860.63%
150.0000.00%0.12331.09%0.06310.88%
160.0000.00%0.0000.00%0.0000.00%
OA(%)16.626%10.352%17.074%
AA(%)8.71%9.39%15.04%
Kappa0.064780.03760.113
Chen ModelHu ModelProposed Model
#F1-ScoreAccuracyF1-ScoreAccuracyF1-ScoreAccuracy
10.0000.00%0.0000.00%0.74463.04%
20.0000.00%0.48336.41%0.80281.23%
30.0060.30%0.51246.27%0.75773.86%
40.0010.07%0.43241.77%0.67171.31%
50.0000.00%0.1508.90%0.92190.89%
60.0000.00%0.82197.40%0.94293.84%
70.0000.00%0.28617.86%0.84678.57%
80.24231.17%0.93398.33%0.96799.58%
90.0000.00%0.0000.00%0.71475.00%
100.10122.88%0.52145.68%0.78378.60%
110.0000.00%0.68687.54%0.84083.42%
120.0301.92%0.46737.10%0.78277.23%
130.02925.22%0.86293.17%0.93094.63%
140.0110.84%0.84196.60%0.93792.96%
150.0010.03%0.33122.54%0.67168.91%
160.0000.00%0.97294.62%0.90698.92%
OA(%)8.403%64.719%83.969%
AA(%)5.15%51.51%82.63%
Kappa−0.00280.58780.817
Table 14. Classification results of the Salinas dataset to which random spatial information is not applied for training and random spatial information to test.
Luo ModelLi ModelHamida Model
#F1-ScoreAccuracyF1-ScoreAccuracyF1-ScoreAccuracy
10.0000.00%0.0000.00%0.0000.00%
20.0291.48%0.0000.00%0.0895.07%
30.0678.76%0.0150.76%0.0180.96%
40.0482.94%0.0080.43%0.0030.14%
50.0825.97%0.0533.25%0.0392.65%
60.0120.63%0.0522.80%0.21914.85%
70.0634.36%0.0000.00%0.0724.47%
80.37073.33%0.33654.64%0.36854.68%
90.1025.59%0.0603.77%0.19214.19%
100.13322.94%0.17324.86%0.14210.37%
110.0000.00%0.0140.84%0.0302.25%
120.0404.88%0.0757.58%0.08310.59%
130.0000.00%0.04920.63%0.04527.07%
140.0213.46%0.0246.92%0.0339.35%
150.0000.00%0.16313.11%0.1329.42%
160.0000.00%0.0221.16%0.0613.76%
OA(%)18.668%16.292%17.996%
AA(%)8.40%8.80%10.61%
Kappa0.04690.04320.0753
Chen ModelHu ModelProposed Model
#F1-ScoreAccuracyF1-ScoreAccuracyF1-ScoreAccuracy
10.0000.00%0.97197.76%0.998899.75%
20.0513.08%0.98097.45%0.997399.95%
30.0282.05%0.87180.97%0.983297.82%
40.0000.00%0.97998.21%0.993299.00%
50.0565.59%0.92396.86%0.986099.70%
60.11026.58%0.99799.67%0.999099.80%
70.0000.00%0.97598.71%0.997699.58%
80.09022.38%0.77494.28%0.859885.36%
90.0000.00%0.96397.37%0.994499.53%
100.0020.10%0.85481.73%0.955594.69%
110.0945.42%0.75172.94%0.965398.97%
120.0000.00%0.94699.90%0.997999.95%
130.0382.93%0.93898.91%0.985197.60%
140.0351.82%0.92790.37%0.971898.13%
150.0000.00%0.40126.50%0.793380.09%
160.0000.00%0.95092.81%0.992298.84%
OA(%)5.385%85.281%93.589%
AA(%)4.37%89.03%96.80%
Kappa0.00670.83480.9286
Table 15. Classification results of the Paviua University dataset to which random spatial information is not applied for training and random spatial information to test.
Luo ModelLi ModelHamida Model
#F1-ScoreAccuracyF1-ScoreAccuracyF1-ScoreAccuracy
10.21217.78%0.20217.24%0.0563.17%
20.64086.61%0.0693.64%0.47141.79%
30.0000.00%0.0030.14%0.0060.29%
40.0010.07%0.17221.54%0.0734.47%
50.0040.22%0.0190.97%0.0000.00%
60.15113.78%0.24473.35%0.26263.65%
70.0000.00%0.0030.15%0.0000.00%
80.0816.06%0.22130.53%0.19026.67%
90.0020.11%0.0020.11%0.0000.00%
OA(%)42.67%17.098%28.824%
AA(%)13.85%16.41%15.56%
Kappa0.11000.0610.0897
Chen ModelHu ModelProposed Model
#F1-ScoreAccuracyF1-ScoreAccuracyF1-ScoreAccuracy
10.15712.74%0.86787.92%0.95094.60%
20.1106.11%0.91297.30%0.97998.48%
30.0000.00%0.34127.11%0.83383.18%
40.0978.78%0.88185.15%0.96595.56%
50.11311.23%0.99198.88%0.99499.85%
60.20755.44%0.63950.07%0.93792.54%
70.0000.00%0.66157.22%0.90491.58%
80.14518.31%0.78187.86%0.88187.81%
90.0020.11%0.99799.68%0.99699.26%
OA(%)13.72%84.02%95.149%
AA(%)12.52%76.80%93.65%
Kappa0.02740.78240.9355
Publisher’s Note: MDPI stays neutral with regard to jurisdictional claims in published maps and institutional affiliations.

