
Effectiveness of an mHealth Application to Overcome Problematic Smartphone Use: Comparing Mental Health of a Smartphone Control-Use Group and a Problematic-Use Group


Abstract
:1. Introduction
2. Method
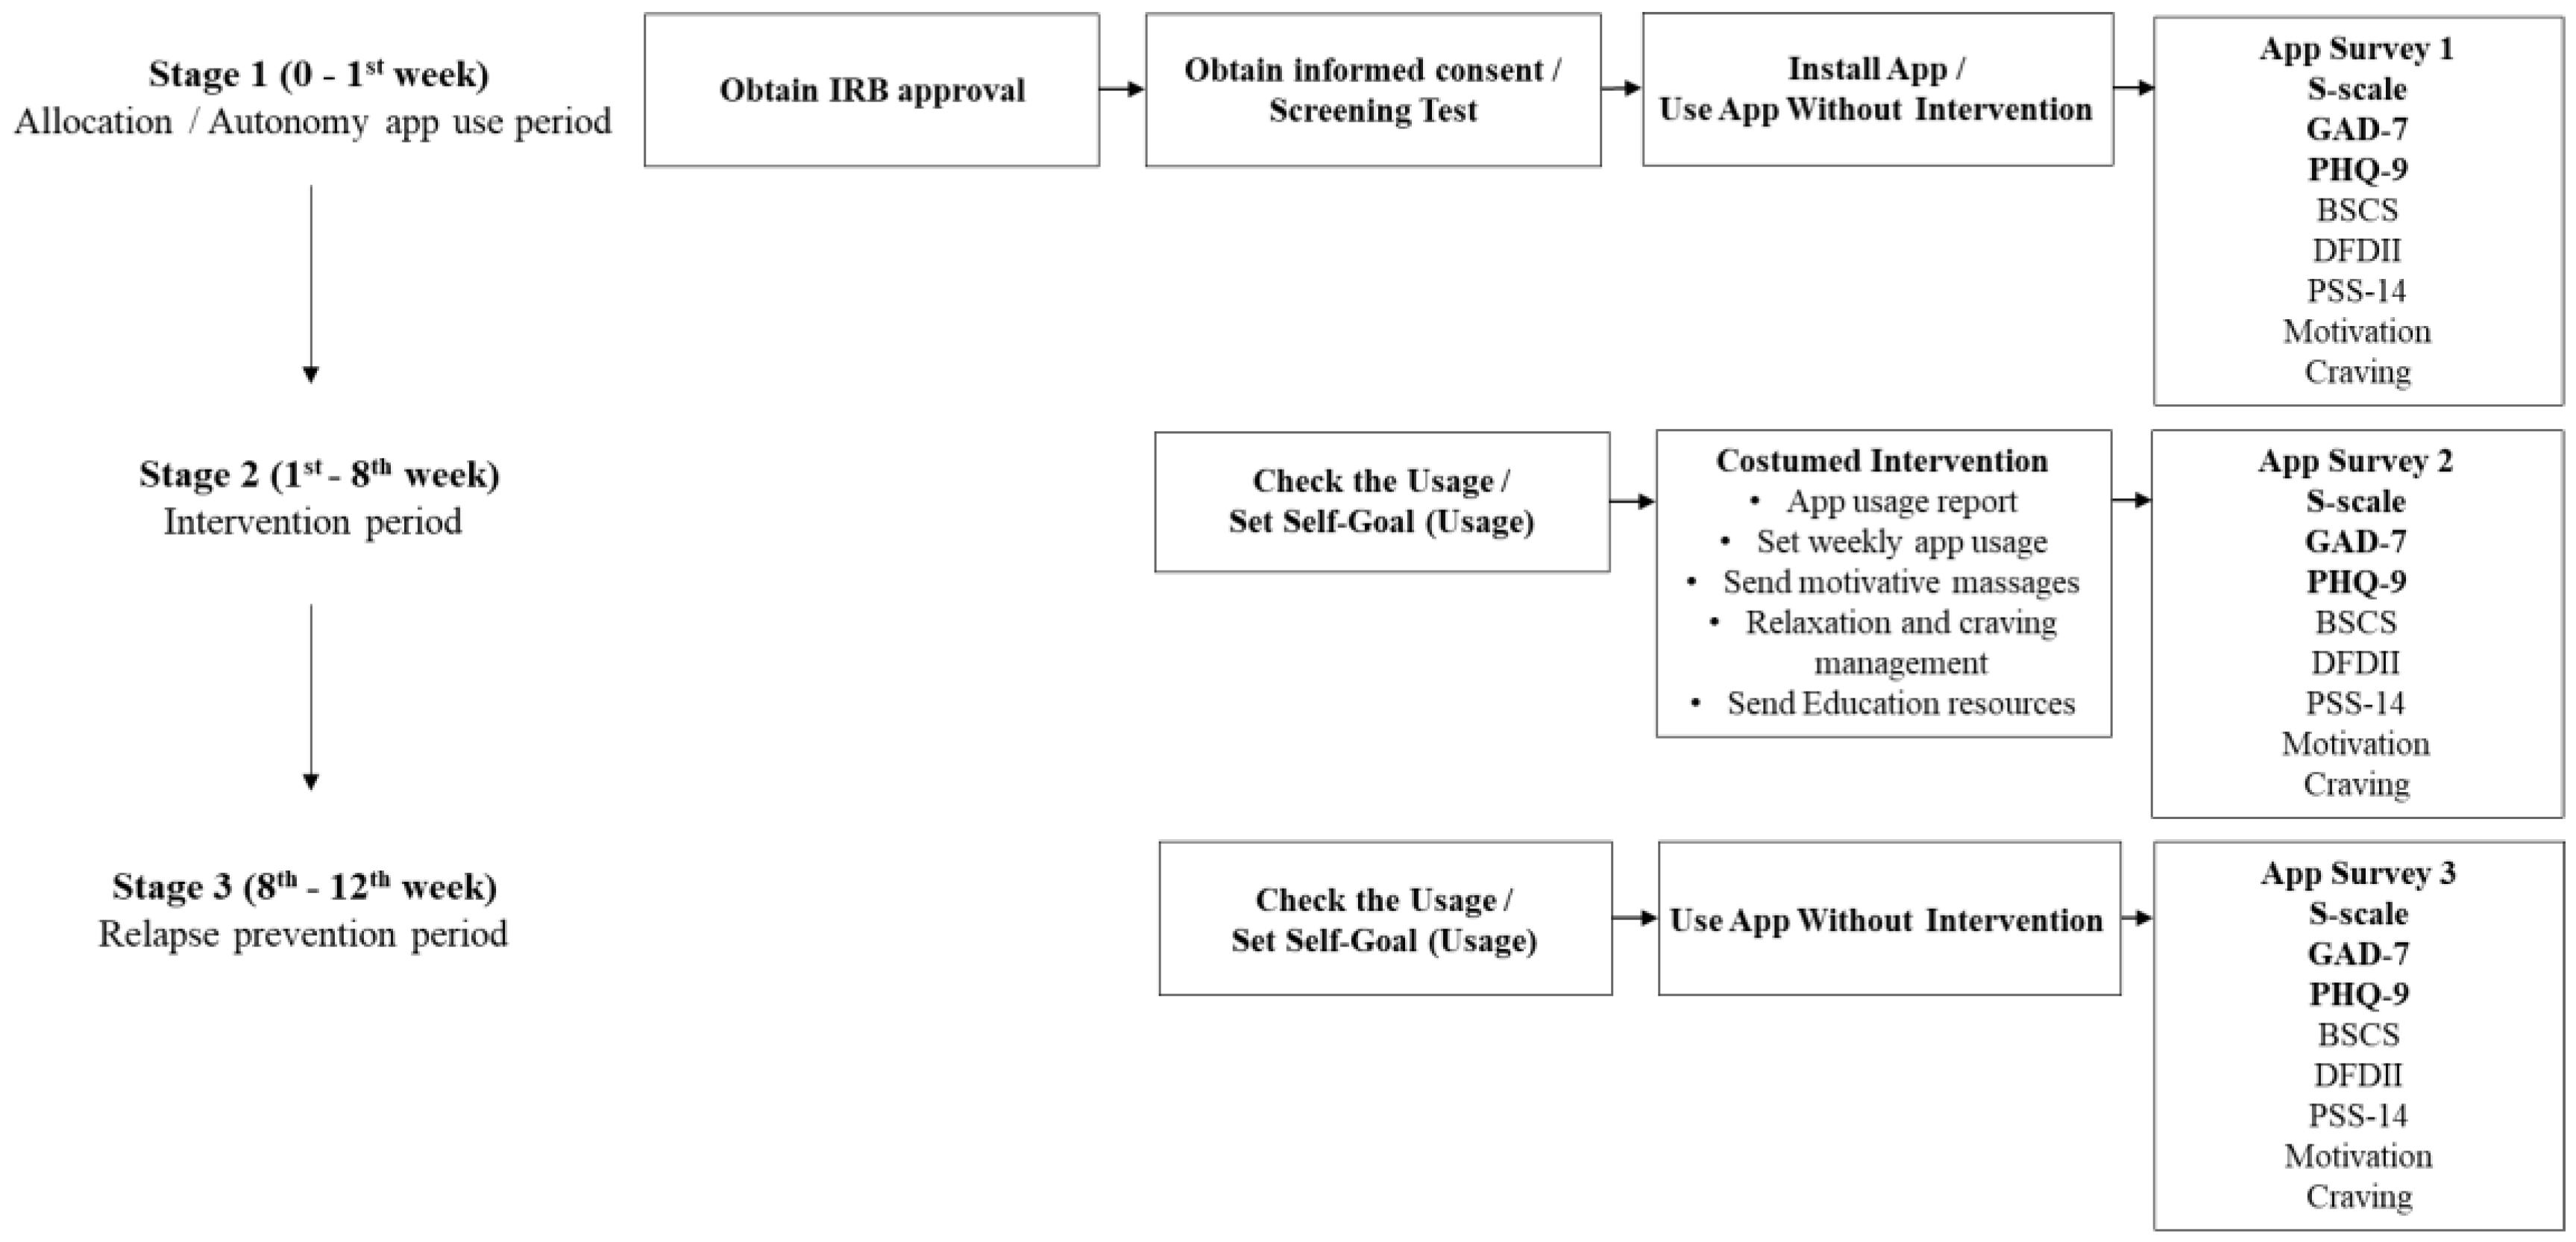
2.1. Study Design
2.2. Participant Eligibility Criteria
2.3. Participant Enrollment
2.4. Study Tools and Measurements
2.4.1. Smartphone Application MindsCare
2.4.2. Problematic Smartphone Use
2.4.3. Anxiety
2.4.4. Depression
2.5. Statistic Analysis
3. Results
3.1. Demographics
3.2. Outcomes
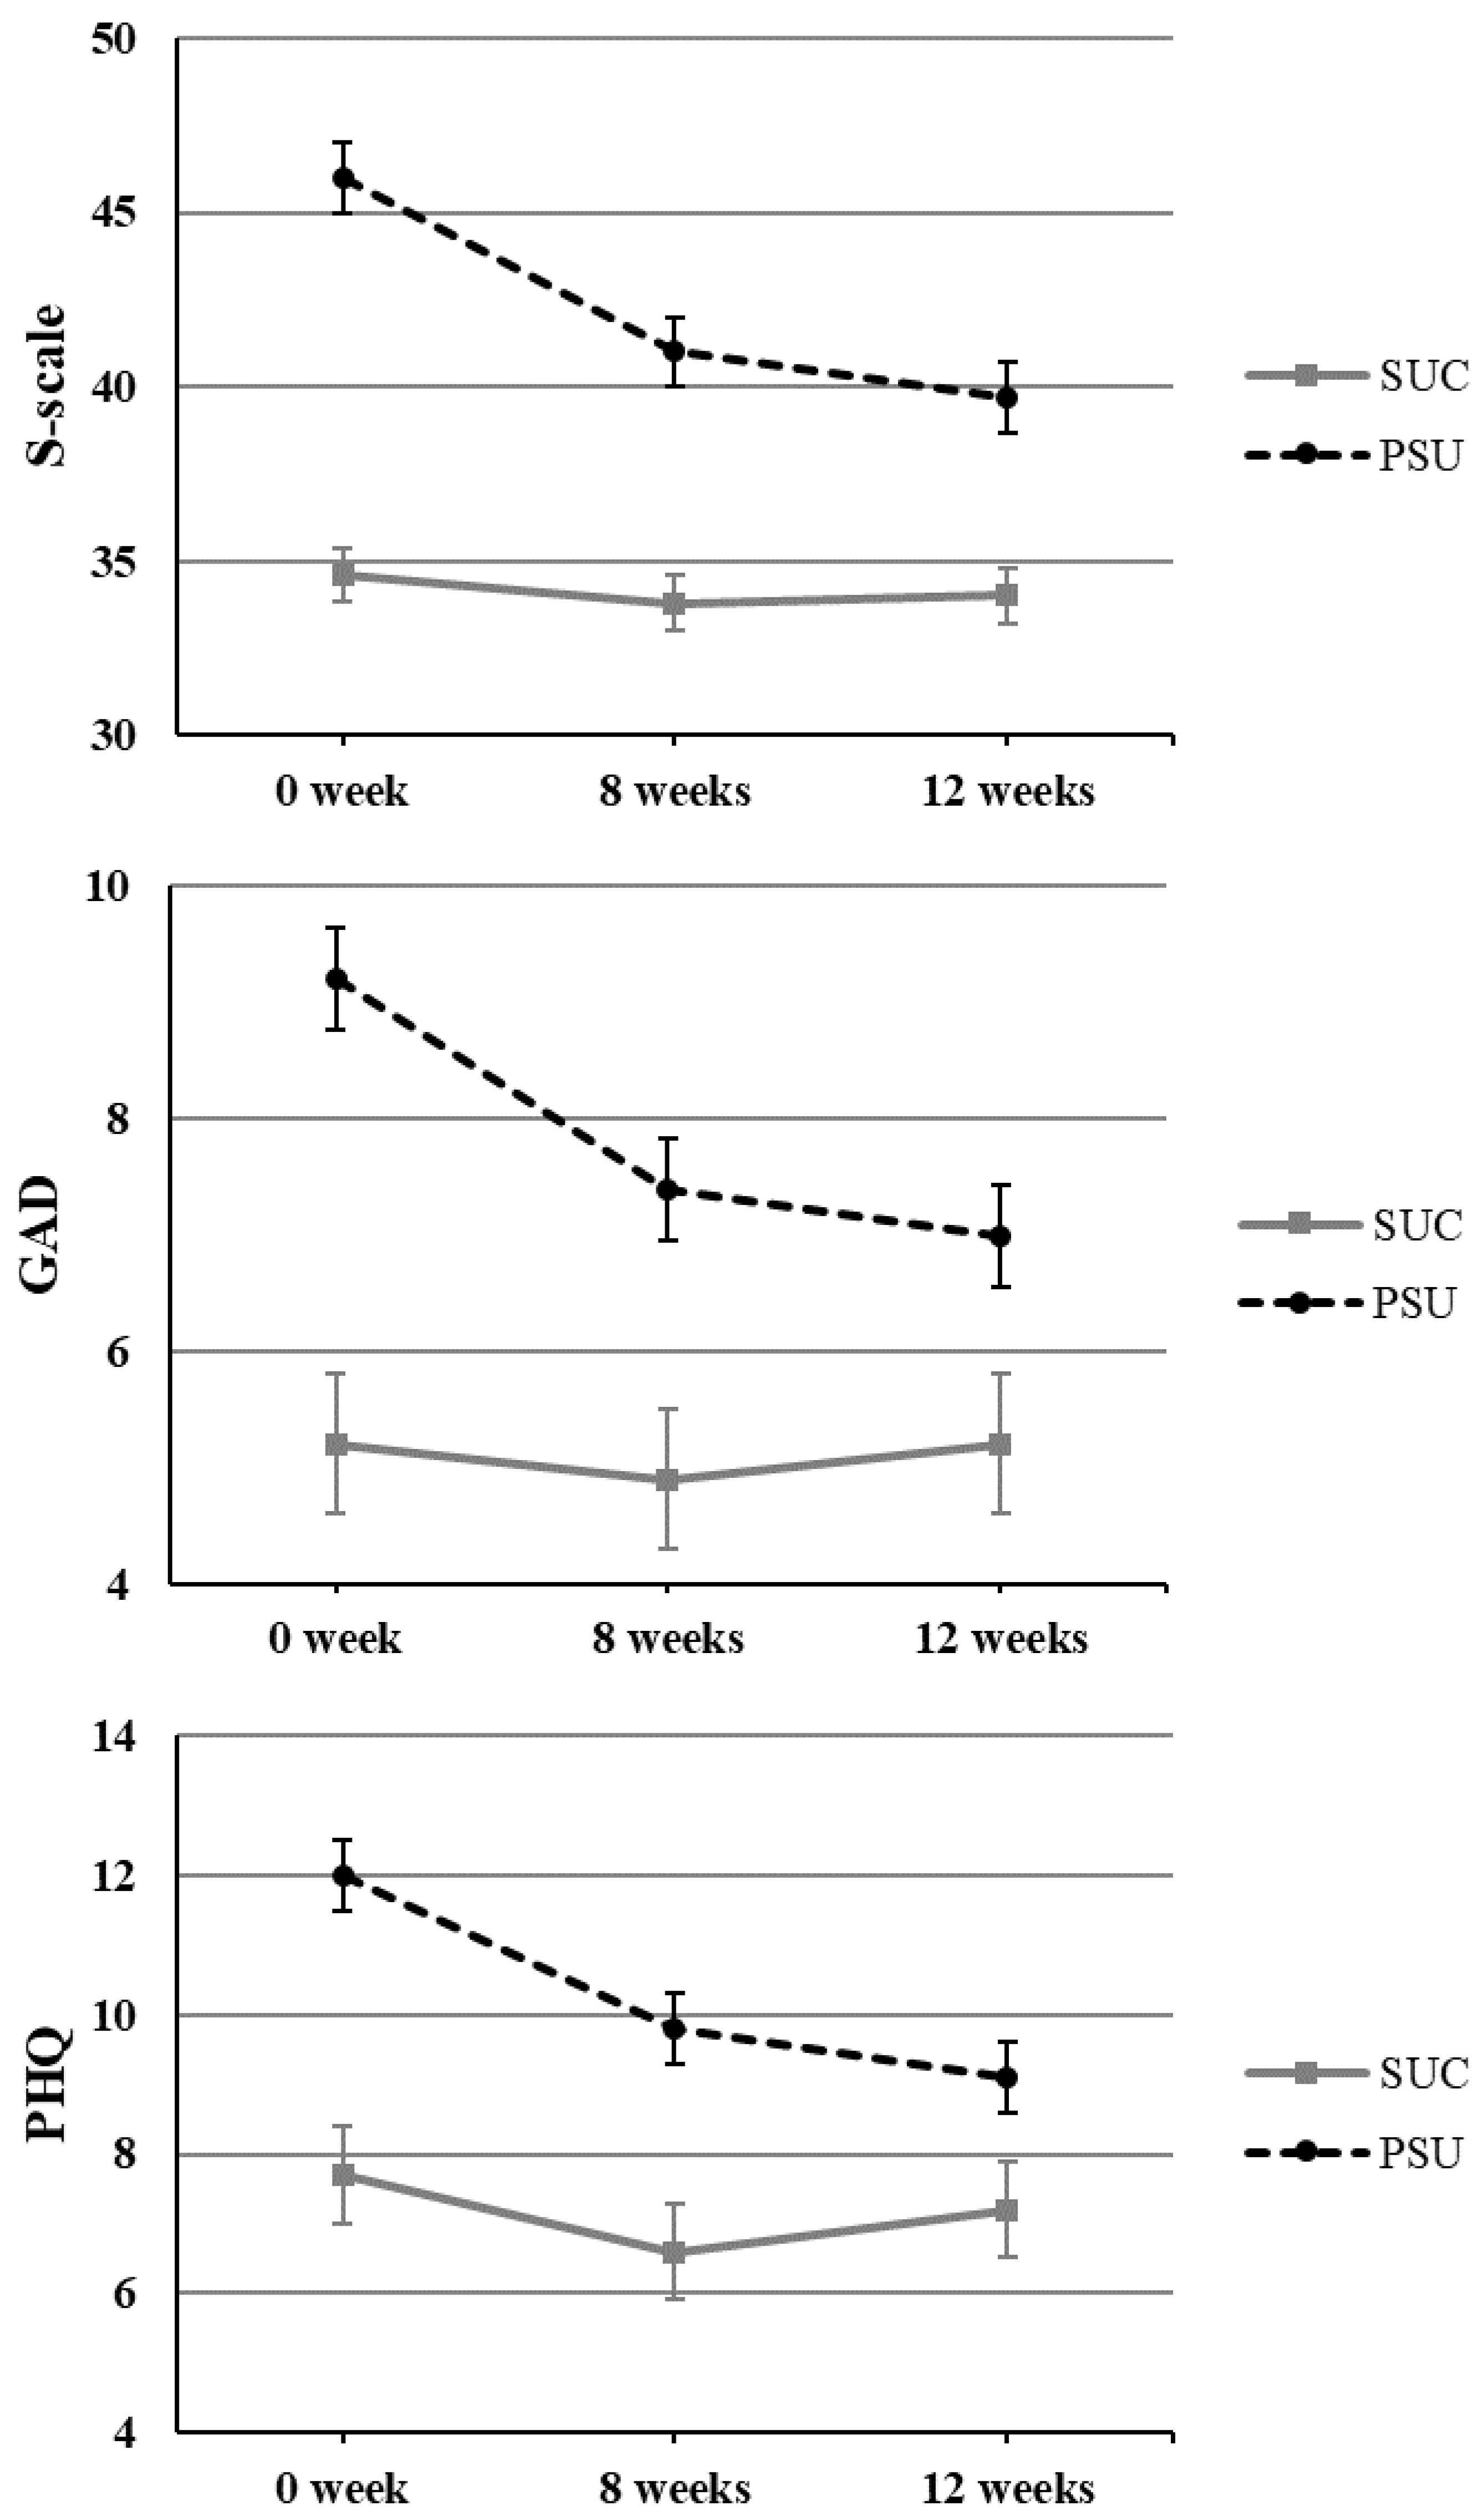
3.2.1. Problematic Smartphone Use
3.2.2. Anxiety
3.2.3. Depression
4. Discussion
4.1. Principal Findings
4.2. Strengths, Implications, and Limitations
5. Conclusions
Author Contributions
Funding
Institutional Review Board Statement
Informed Consent Statement
Data Availability Statement
Conflicts of Interest
Abbreviations
References
- Statista. Smartphone Penetration Worldwide as Share of Global Population 2016–2020. 2020. Available online: https://www.statista.com/statistics/203734/global-smartphone-penetration-per-capita-since-2005/ (accessed on 28 February 2020).
- Silver, L. Smartphone Ownership Is Growing Rapidly around the World, but Not Always Equally 1. Digital Connectivity Growing Rapidly in Emerging Economies. 2019. Available online: https://www.pewresearch.org (accessed on 5 February 2019).
- Bertschek, I.; Niebel, T. Mobile and more productive? Firm-level evidence on the productivity effects of mobile internet use. Telecommun. Policy 2016, 40, 888–898. [Google Scholar] [CrossRef] [Green Version]
- Noë, B.; Turner, L.D.; Linden, D.E.; Allen, S.M.; Winkens, B.; Whitaker, R.M. Identifying indicators of smartphone addiction through user-app interaction. Comput. Hum. Behav. 2019, 99, 56–65. [Google Scholar] [CrossRef]
- Elhai, J.D.; Dvorak, R.D.; Levine, J.C.; Hall, B.C. Problematic smartphone use: A conceptual overview and systematic review of relations with anxiety and depression psychopathology. J. Affect. Disord. 2017, 207, 251–259. [Google Scholar] [CrossRef]
- Cheever, N.A.; Rosen, L.D.; Carrier, M.L.; Chavez, A. Out of sight is not out of mind: The impact of restricting wireless mobile device use on anxiety levels among low, moderate and high users. Comput. Hum. Behav. 2014, 37, 290–297. [Google Scholar] [CrossRef]
- Clayton, R.B.; Leshner, G.; Almond, A. The extended iSelf: The impact of iPhone separation on cognition, emotion, and physiology. J. Comput. Mediat. Commun. 2015, 20, 119–135. [Google Scholar] [CrossRef]
- Lee, S.R.; Kim, H.S. The effect of smartphone overdependence on university life adjustment of university students: Focused on the mediating effect of self-efficacy and the moderating effect of social support. Locality Glob. Korean J. Soc. Sci. 2017, 41, 157–184. [Google Scholar]
- Demirci, K.; Akgönül, M.; Akpinar, A. Relationship of smartphone use severity with sleep quality, depression, and anxiety in university students. J. Behav. Addict. 2015, 4, 85–92. [Google Scholar] [CrossRef] [Green Version]
- Lee, Y.K.; Chang, C.T.; Lin, Y.; Cheng, Z.H. The dark side of smartphone usage: Psychological traits, compulsive behavior and technostress. Comput. Hum. Behav. 2014, 31, 373–383. [Google Scholar] [CrossRef]
- Elhai, J.D.; Dvorak, R.D.; Levine, J.C.; Hall, B.C. Non-social features of smartphone use are most related to depression, anxiety and problematic smartphone use. Comput. Hum. Behav. 2017, 69, 75–82. [Google Scholar] [CrossRef]
- Bianchi, A.; Phillips, J.G. Psychological predictors of problem mobile phone use. Cyberpsychol. Behav. 2005, 8, 39–51. [Google Scholar] [CrossRef] [PubMed]
- Oulasvirta, A.; Rattenbury, T.; Lingyi, M.; Raita, E. Habits make smartphone use more pervasive. Pers. Ubiquitous Comput. 2012, 16, 105–114. [Google Scholar] [CrossRef]
- Takao, M.; Takahashi, S.; Kitamura, M. Addictive personality and problematic mobile phone use. Cyberpsychol. Behav. 2009, 12, 501–507. [Google Scholar] [CrossRef] [PubMed]
- Panova, T.; Carbonell, X. Is smartphone addiction really an addiction? J. Behav. Addict. 2018, 7, 252–259. [Google Scholar] [CrossRef] [PubMed]
- Billieux, J.; Maurage, P.; Lopez-Fernandez, O.; Kuss, D.J.; Griffiths, M.D. Can disordered mobile phone use be considered a behavioral addiction? An update on current evidence and a comprehensive model for future research. Curr. Addict. Rep. 2015, 2, 156–162. [Google Scholar] [CrossRef] [Green Version]
- Elhai, J.D.; Levine, J.C.; O’Brien, K.D.; Armour, C. Distress tolerance and mindfulness mediate relations between depression and anxiety sensitivity with problematic smartphone use. Comput. Hum. Behav. 2018, 84, 477–484. [Google Scholar] [CrossRef]
- Smetaniuk, P. A preliminary investigation into the prevalence and prediction of problematic cell phone use. J. Behav. Addict. 2014, 3, 41–53. [Google Scholar] [CrossRef] [Green Version]
- Elhai, J.D.; Dvorak, R.D.; Levine, J.C.; Hall, B.C. Fear of missing out, need for touch, anxiety and depression are related to problematic smartphone use. Comput. Hum. Behav. 2016, 63, 509–516. [Google Scholar] [CrossRef]
- Firth, J.; Torous, J.; Nicholas, J.; Carney, R.; Rosenbaum, S.; Sarris, J. Can smartphone mental health interventions reduce symptoms of anxiety? A meta-analysis of randomized controlled trials. J. Affect. Disord. 2017, 218, 15–22. [Google Scholar] [CrossRef]
- Wilhide III, C.C.; Peeples, M.M.; Kouyate, R.C.A. Evidence-based mHealth chronic disease mobile app intervention design: Development of a framework. JMIR Res. Protoc. 2016, 5, e25. [Google Scholar] [CrossRef]
- Free, C.; Phillips, G.; Galli, L.; Watson, L.; Felix, L.; Edwards, P.; Patel, V.; Haines, A. The effectiveness of mobile-health technology-based health behaviour change or disease management interventions for health care consumers: A systematic review. PLoS Med. 2013, 10, e1001362. [Google Scholar] [CrossRef] [Green Version]
- Drolia, M.; Sifaki, E.; Papadakis, S.; Kalogiannakis, M. An Overview of Mobile Learning for Refugee Students: Juxtaposing Refugee Needs with Mobile Applications’ Characteristics. Challenges 2020, 11, 31. [Google Scholar] [CrossRef]
- Lin, Y.H.; Lin, P.H.; Chiang, C.L.; Lee, Y.H.; Yang, C.C.H.; Kuo, T.B.J.; Lin, S.H. Incorporation of mobile application (app) measures into the diagnosis of smartphone addiction. J. Clin. Psychiatry 2017, 78, 866–872. [Google Scholar] [CrossRef]
- Teasdale, J.D.; Segal, Z.V.; Williams, J.M.G.; Ridgeway, V.A.; Soulsby, J.M.; Lau, M.A. Prevention of relapse/recurrence in major depression by mindfulness-based cognitive therapy. J. Consult. Clin. Psychol. 2000, 68, 615–623. [Google Scholar] [CrossRef]
- Lee, S.J.; Rho, M.J.; Yook, I.H.; Park, S.H.; Jang, K.S.; Park, B.J.; Lee, O.; Lee, D.K.; Kim, D.J.; Choi, I.Y. Design, development and implementation of a smartphone overdependence management system for the self-control of smart devices. Appl. Sci. 2016, 6, 440. [Google Scholar] [CrossRef] [Green Version]
- Kim, Y.; Jeong, J.E.; Cho, H.; Jung, D.J.; Kwak, M.; Rho, M.J.; Yu, H.; Kim, D.J.; Choi, I.Y. Personality factors predicting smartphone addiction predisposition: Behavioral inhibition and activation systems, impulsivity, and self-control. PLoS ONE 2016, 11, e0159788. [Google Scholar] [CrossRef] [PubMed]
- Choi, J.; Rho, M.J.; Kim, Y.; Yook, I.H.; Yu, H.; Kim, D.J.; Choi, I.Y. Smartphone dependence classification using tensor factorization. PLoS ONE 2017, 12, e0177629. [Google Scholar] [CrossRef]
- Shin, K.; Kim, D.; Jung, Y. Development of Korean Smart Phone Addiction Proneness Scale for Youth and Adults; Korean National Information Society Agency: Seoul, Korea, 2011. [Google Scholar]
- Wild, B.; Eckl, A.; Herzog, W.; Niehoff, D.; Lechner, S.; Maatouk, I.; Schellberg, D.; Brenner, H.; Müller, H.; Löwe, B. Assessing generalized anxiety disorder in elderly people using the GAD-7 and GAD-2 scales: Results of a validation study. Am. J. Geriatr. Psychiatry 2014, 22, 1029–1038. [Google Scholar] [CrossRef]
- Kroenke, K.; Spitzer, R.L.; Williams, J.B. The PHQ-9: Validity of a brief depression severity measure. J. Gen. Intern. Med. 2001, 16, 606–613. [Google Scholar] [CrossRef] [PubMed]
- West, B.T.; Welch, K.B.; Galecki, A.T. Linear Mixed Models: A Practical Guide Using Statistical Software; CRC Press: Boca Raton, FL, USA, 2014. [Google Scholar]
- Shek, D.T.; Ma, C.M. Longitudinal data analyses using linear mixed models in SPSS: Concepts, procedures and illustrations. Sci. World J. 2011, 5, 42–76. [Google Scholar] [CrossRef] [Green Version]
- Girden, E.R. ANOVA: Repeated Measures; Sage: Thousand Oaks, CA, USA, 1992; p. 84. [Google Scholar]
- Yoo, H.K.; Son, C.N. Effects of ACT on smartphone addiction level, self-control, and anxiety of college students with smartphone addiction. J. Digit. Converg. 2016, 14, 415–426. [Google Scholar] [CrossRef] [Green Version]
- Papadakis, S.; Kalogiannakis, M. A research synthesis of the real value of self-proclaimed mobile educational applications for young children. In Mobile Learning Applications in Early Childhood Education; IGI Global: Hershey, PA, USA, 2020; pp. 1–19. [Google Scholar]
- Fu, L.; Wang, P.; Zhao, M.; Xie, X.; Chen, Y.; Nie, J.; Lei, L. Can emotion regulation difficulty lead to problematic smartphone use in adolescents? Moderated mediation model of depression and perceived social support. Child. Youth Serv. Rev. 2020, 108, 0190–7409. [Google Scholar] [CrossRef]
- Kuss, D.J.; Griffiths, M.D.; Karila, L.; Billieux, J. Internet addiction: A systematic review of epidemiological research for the last decade. Curr. Pharm. Des. 2014, 20, 4026–4052. [Google Scholar] [CrossRef] [PubMed] [Green Version]


| Characteristics | SUC (n = 66) | PSU (n = 124) | X2 Value | p-Value | |
|---|---|---|---|---|---|
| Gender | Male | 32 (35.6) | 58 (64.4) | 0.051 | 0.822 |
| Female | 34 (34.0) | 66 (66.6) | |||
| Age group | 19 to 29 | 24 (38.7) | 38 (61.3) | 1.045 | 0.593 |
| 30 to 39 | 25 (35.2) | 46 (64.8) | |||
| Over 40 | 17 (29.8) | 40 (70.2) | |||
| Marital status | Married | 44 (38.6) | 70 (61.4) | 1.873 | 0.171 |
| Unmarried | 22 (28.9) | 54 (71.1) | |||
| Education | High School or Lower | 7 (35.0) | 13 (65.0) | 0.208 | 0.901 |
| College Student | 10 (31.3) | 22 (68.8) | |||
| Graduate School or Above | 49 (35.5) | 89 (64.5) | |||
| Occupation | White-collar/Professional | 29 (33.7) | 57 (66.3) | 0.653 | 0.884 |
| Student | 10 (31.3) | 22 (68.8) | |||
| Unemployed | 11 (40.7) | 16 (59.3) | |||
| Others | 16 (35.6) | 29 (64.4) | |||
| Most Used Application for the Past One Year | SNS | 17 (31.5) | 37 (68.5) | 0.761 | 0.944 |
| Web Surfing | 20 (35.1) | 37 (64.9) | |||
| Game | 9 (40.9) | 13 (59.1) | |||
| Entertainment | 8 (38.1) | 13 (61.9) | |||
| Others | 12 (33.3) | 24 (66.7) | |||
| Post-Hoc Test | Mean Diff. (I–J) | Std. Error | Sig. * | CI | ||||
|---|---|---|---|---|---|---|---|---|
| Group | (I) Time | (J) Time | Lower Bound | Upper Bound | ||||
| S-scale | SUC | 0 week | 8 weeks | 0.803 | 0.678 | 0.712 | −0.829 | 2.435 |
| 0 week | 12 weeks | 0.561 | 0.862 | 1.000 | −1.519 | 2.641 | ||
| 8 weeks | 12 weeks | −0.242 | 0.678 | 1.000 | −1.874 | 1.389 | ||
| PSU | 0 week | 8 weeks | 4.919 * | 0.495 | <0.001 | 3.729 | 6.110 | |
| 0 week | 12 weeks | 6.290 * | 0.629 | <0.001 | 4.773 | 7.808 | ||
| 8 weeks | 12 weeks | 1.371 * | 0.495 | 0.018 | 0.181 | 2.561 | ||
| GAD | SUC | 0 week | 8 weeks | 0.303 | 0.504 | 1.000 | −0.909 | 1.515 |
| 0 week | 12 weeks | 0.076 | 0.552 | 1.000 | −1.258 | 1.409 | ||
| 8 weeks | 12 weeks | −0.227 | 0.504 | 1.000 | −1.439 | 0.985 | ||
| PSU | 0 week | 8 weeks | 1.815 * | 0.367 | <0.001 | 0.930 | 2.699 | |
| 0 week | 12 weeks | 2.258 * | 0.403 | <0.001 | 1.285 | 3.231 | ||
| 8 weeks | 12 weeks | 0.444 | 0.367 | 0.685 | −0.441 | 1.328 | ||
| PHQ | SUC | 0 week | 8 weeks | 1.091 | 0.620 | 0.238 | −0.401 | 2.583 |
| 0 week | 12 weeks | 0.424 | 0.637 | 1.000 | −1.113 | 1.962 | ||
| 8 weeks | 12 weeks | −0.667 | 0.620 | 0.849 | −2.159 | 0.825 | ||
| PSU | 0 week | 8 weeks | 2.210 * | 0.452 | <0.001 | 1.121 | 3.298 | |
| 0 week | 12 weeks | 2.927 * | 0.465 | <0.001 | 1.806 | 4.049 | ||
| 8 weeks | 12 weeks | 0.718 | 0.452 | 0.340 | −0.371 | 1.806 | ||
| Dependent Variable | Fixed Effects | numDF | denDF | F-Value | p-Value |
|---|---|---|---|---|---|
| S-scale | (Intercept) | 1 | 374.982 | 3914.799 | <0.001 |
| Gender | 1 | 186.991 | 0.313 | 0.577 | |
| Group | 1 | 374.703 | 110.413 | <0.001 | |
| Time | 1 | 207.583 | 40.763 | <0.001 | |
| Group × Time | 1 | 207.583 | 28.512 | <0.001 | |
| GAD | (Intercept) | 1 | 385.172 | 270.135 | <0.001 |
| Gender | 1 | 186.912 | 0.294 | 0.588 | |
| Group | 1 | 385.148 | 27.801 | <0.001 | |
| Time | 1 | 204.051 | 11.632 | 0.001 | |
| Group × Time | 1 | 204.051 | 10.171 | 0.002 | |
| PHQ | (Intercept) | 1 | 383.295 | 380.835 | <0.001 |
| Gender | 1 | 186.879 | 0.023 | 0.879 | |
| Group | 1 | 383.243 | 27.707 | <0.001 | |
| Time | 1 | 203.621 | 18.050 | <0.001 | |
| Group × Time | 1 | 203.621 | 10.068 | 0.002 |
Publisher’s Note: MDPI stays neutral with regard to jurisdictional claims in published maps and institutional affiliations. |
© 2021 by the authors. Licensee MDPI, Basel, Switzerland. This article is an open access article distributed under the terms and conditions of the Creative Commons Attribution (CC BY) license (https://creativecommons.org/licenses/by/4.0/).
Share and Cite
Choi, M.J.; Lee, S.J.; Kim, H.; Kim, D.-J.; Choi, I.Y. Effectiveness of an mHealth Application to Overcome Problematic Smartphone Use: Comparing Mental Health of a Smartphone Control-Use Group and a Problematic-Use Group. Appl. Sci. 2021, 11, 8716. https://doi.org/10.3390/app11188716
Choi MJ, Lee SJ, Kim H, Kim D-J, Choi IY. Effectiveness of an mHealth Application to Overcome Problematic Smartphone Use: Comparing Mental Health of a Smartphone Control-Use Group and a Problematic-Use Group. Applied Sciences. 2021; 11(18):8716. https://doi.org/10.3390/app11188716
Chicago/Turabian StyleChoi, Mun Joo, Sun Jung Lee, HyungMin Kim, Dai-Jin Kim, and In Young Choi. 2021. "Effectiveness of an mHealth Application to Overcome Problematic Smartphone Use: Comparing Mental Health of a Smartphone Control-Use Group and a Problematic-Use Group" Applied Sciences 11, no. 18: 8716. https://doi.org/10.3390/app11188716