Article

Physical Alteration and Color Change of Granite Subjected to High Temperature

1
Department of Engineering Geology and Geotechnics, Budapest University of Technology and Economics, H-1521 Budapest, Hungary
2
Department of Mechatronics, Optics and Engineering Informatics, Budapest University of Technology and Economics, H-1521 Budapest, Hungary
*
Author to whom correspondence should be addressed.
Appl. Sci. 2021, 11(19), 8792; https://doi.org/10.3390/app11198792
Submission received: 17 June 2021 / Revised: 16 September 2021 / Accepted: 18 September 2021 / Published: 22 September 2021
(This article belongs to the Special Issue Effects of Temperature on Rock and Rock Masses)

Abstract

:
Cylindrical specimens obtained from the monzogranite host rock of the National Radioactive Waste Repository of Hungary were tested at room temperature and 250 °C, 500 °C, and 750 °C of heat treatment. Reflectance spectra (color), bulk density, Duroskop surface hardness, and ultrasound-wave velocity values were measures before and after thermal stress. According to CIE L*a*b* colorimetric characteristics, the specimens’ color became brighter and yellower after the heat treatment. At 750 °C, a significant volume increase was recorded linked to the formation of macro-cracks, and it also led to the drop in bulk density. Smaller temperature treatment (250 °C) caused a minor decrease in density (−1.3%), which is higher than the reduction of density at 500 °C (−0.8%). Duroskop surface strength showed a slight decrease until 500 °C, and then a drastic decline at 750 °C. P- and S-wave velocity values tend to decrease uniformly and significantly from room temperature to 750 °C. P-wave velocity and Duroskop values have a high exponential correlation at elevated temperatures. Physical alterations originated from the differential thermal-induced expansion of minerals, the formation of micro-cracks. Mineralogical changes at higher temperatures also contribute to the volume change and the loss in strength.

1. Introduction

The increased energy demand of our age may require answers to environmental issues such as the management and disposal of radioactive waste [1]. Today, the most effective solution to this problem is the disposal in deep geological repositories [2]. The primary task of such a facility is to be inert and permanently isolated from the outside world with a high level of technical safety over the long term (in some cases more than 100,000 years [3]. To achieve such safety, natural and engineered barriers work together to ensure the content of the waste. The most critical natural barrier is a geological barrier: the host rock, which has several primary functions of long isolation. The geological, hydrogeological, geophysical, geochemical, and rock-mechanical parameters of the host formations must meet very strict rock mechanical requirements [1,4].
Granite—or its metamorphosed type gneiss—is used to dispose of radioactive waste in Finland, Sweden, and Hungary. In Hungary, low- and intermediate-level radioactive waste is stored at the Bátaapáti National Radioactive Waste Repository, located at the foot of the Eastern-Mecsek Mountains. The research project first examining the site started in 1993, after which the construction and the repository started in 2012. Now, it is in full operation, hosting low- and medium-level radioactive waste [5]. The disposal chambers are located below the surface at 200–250 m, with more than 1.7 km-long access tunnels leading to the disposal chambers. The host rock forms a part of the Carboniferous Mórágy Granite Formation [6].
Granite has already proven their worth as a host rock type many times before and, therefore, is considered one of the best target rocks for radioactive waste disposal. Among the many investigated mechanical features of this rock type, one of the most crucial is the mechanical strength loss due to elevated temperatures. The study of thermal effects on rock properties is an emerging area of research with publications on the thermal behavior of several lithologies, including limestone [7,8,9], sandstone [10,11], and granite [12,13,14]. Besides the mechanical changes, mineralogical changes and other physical transformations are linked to increasing temperature in rocks such as granite [15,16] or especially carbonate rocks such as limestone [17,18,19].
One of the main safety factors of a deep geological radioactive waste repository is to ensure that high temperatures do not occur and that the facility operates within normal temperature conditions. However, in certain failure events (such as a sudden fire or heat caused by the decay of radioactive waste), the temperature of the facility can rise to several hundred degrees Celsius. In previous works, it has been demonstrated that micro-cracks are already formed at lower temperatures [20] due to thermal expansion [21], cooling [22], or being linked to thermal cycles of 20 °C to 105 °C [23,24]. Temperature increase generates stresses in granitic rocks [25] which is also associated with the anisotropy of granite micro-texture [26,27]. Understanding such behavior and cracking-linked damage of the granitic rocks need further studies. Suppose the waste disposal site is subjected to elevated temperatures for short or long periods. In this case, the facility’s structure and the host rock are exposed to the negative consequences of the thermal effects, which is one of the critical risks in safety [28]. For these reasons, the changes resulting from thermal treatment must be analyzed and interpreted in the design.
This study focuses on the thermal-induced physical alteration and color change of the primary rock type of the Mórágy Granite Formation.

2. Materials and Methods

The Bátaapáti radioactive waste repository is found in a slightly metamorphosed granitoid rock type of Carboniferous age, the Mórágy Granite Formation in South Hungary (Figure 1).
The Móragyi Granite Formation is a lower Carboniferous age intrusive rock formation. The rock types in the formation have undergone magmatic, ductile, and fracture-related structural evolution associated with the Variscan and Alpine orogenesis. Regional metamorphism of varying intensity altered the formation [5,6,30]. Several distinct rock types characterize the Móragyi Granite Formation: monzonite; monzogranite; the so-called contaminated or hybrid rocks; the intersecting felsic rocks, and the xenoliths [5,31,32,33,34].
Since the general lithology is monzogranite, the paper focuses on that lithotype. The tested specimens belong to the porphyritic monzogranite group in the formation. The group is a reddish dark grey fresh formation, and the main minerals are potassium feldspar, quartz, and biotite. Scattered pale pink potassium feldspar megacrystals are a maximum of 3 cm. An undirected texture is commonly based on mineral mixtures, but orientation can be observed in some zone. The rock type is holocrystalline, medium and coarse-grained, and at some places with fine-grained around inclusions. Phenocrystalline, inequigranular, the shape of the minerals is hypomorph, rarely xenomorphic. In cracked zones, the surface of the cracks is barely weathered and fresh. In some zones, the rock-type contains dark grey monzonite and contaminated monzonite inclusions [5,31,32,33].
The laboratory tests were carried out on 24 pieces of regularly shaped monzogranite cylindrical samples. The average diameter of the specimens was 4.73 cm. The specimens were cut from the core drillings and been prepared for thermal treatment and laboratory measurements.
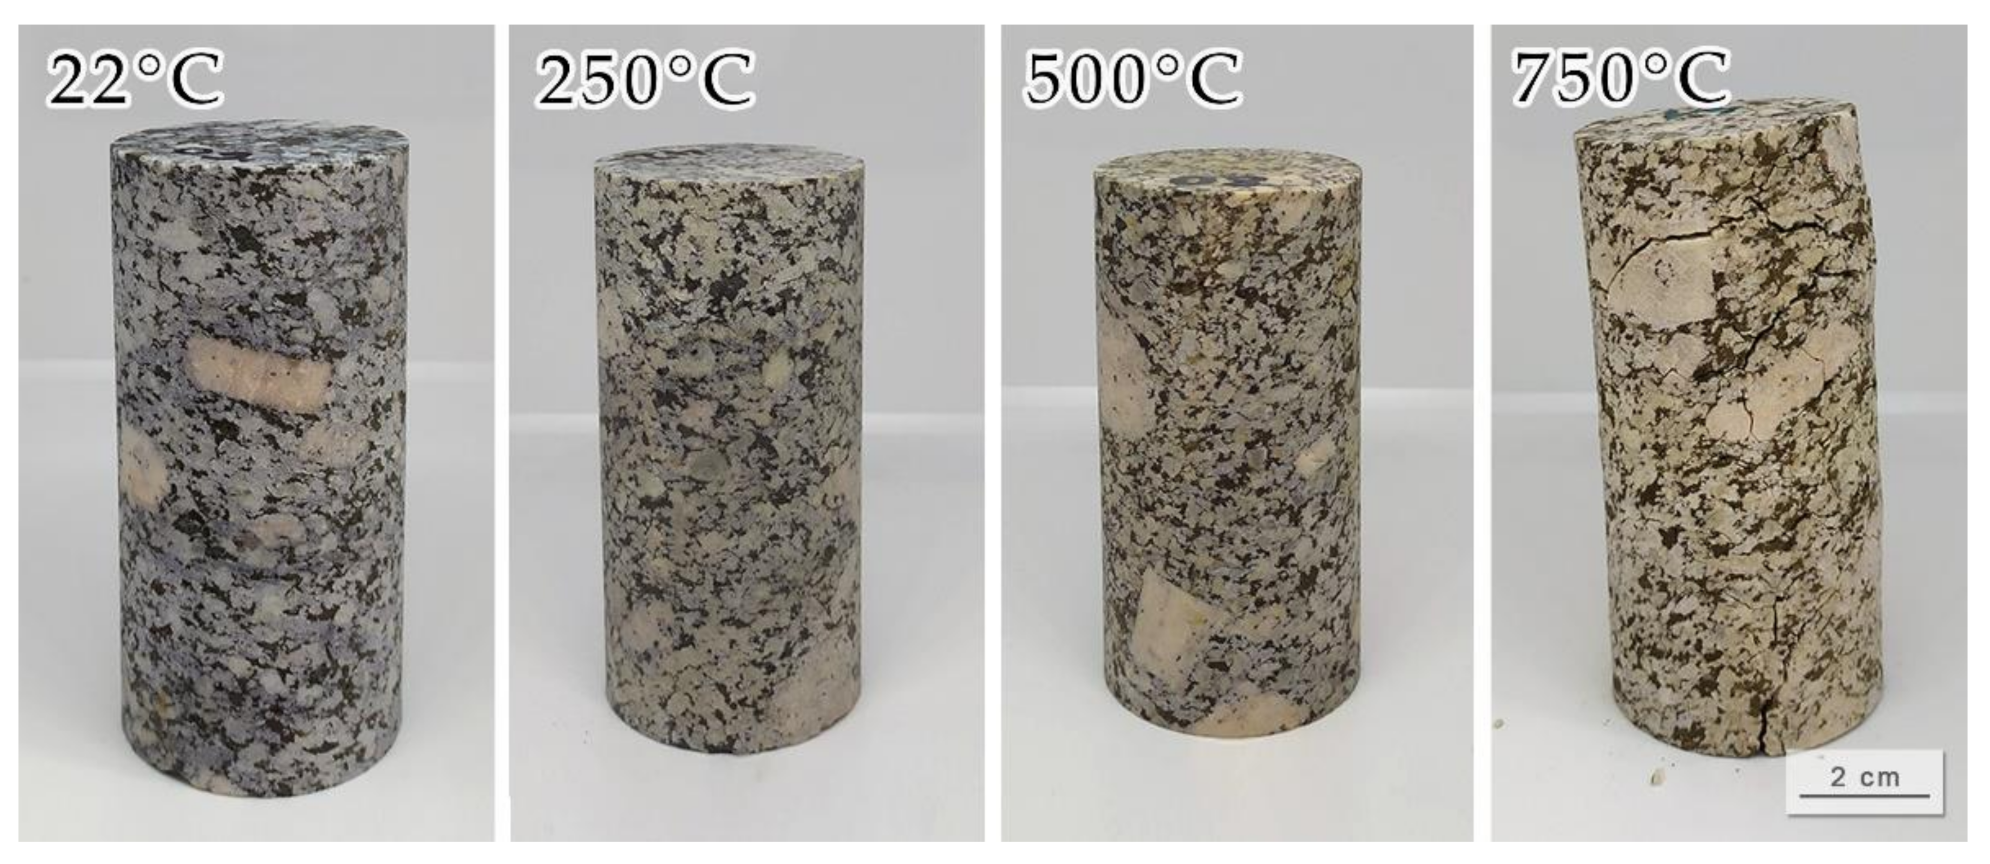
All in all, four thermal groups were made, as 22 °C (room temperature, not tempered) 250 °C, 500 °C, and 750 °C, respectively. The thermal treatment was performed in a Carbolite ABA 7/35 electric oven. The heating rate was set to 20 °C/min for generating a homogeneous thermal field and was linearly increased to 250 °C/500 °C/750 °C and kept for 4 h. The cooling was 5 °C/min until room temperature was reached and were tested on room temperatures. The heating and cooling rates were verified by the built-in digital temperature gauge of the electric oven. The temperature-related changes of the samples are clearly visible by the naked eye (Figure 2).
One of our important basic hypotheses was that the mechanical, chemical, and spectral reflectance properties of a geological object are permanently altered by heat transfer. Color image analysis is a widely accepted reliable tool for examining thermally treated materials, as previous studies researched color change of building materials exposed to fire [35,36]. Color coordinates defined by the International Commission on Illumination (CIE) can be determined for a reflective surface based on the emission spectral distribution of a given illumination, the reflection spectral distribution of the surface, and the CIE color-matching functions [37], also defined by the CIE [38]. From the XYZ color space [39], a CIE xyY diagram can be derived, which is often used to graphically represent the chromaticity of colors [40]. Unfortunately, this is not a uniform color space, so the geometric distance in the representation cannot be assumed to be a visually perceived color difference [41]. Therefore, to calculate the visual color difference mathematically, the data must be transformed into a uniform color space. In our case, the CIE L*a*b* color space is perfectly suited for this purpose [42]. It should be noted that the CIE L*a*b* color space is not perfectly uniform perceptually, but it is still useful in the industry for detecting small color differences. From the CIE XYZ coordinates and a reference, which in our case is the reference light source D65, we can determine the L* lightness and the chromaticity, which is characterized by the values a* extends from green (−a*) to red (+a*) and b* extend from blue (−b*) to yellow (+b*). These can be used to determine the color difference between two surfaces with different spectral reflectance under a given reference illumination. Since this color difference corresponds to human perception, it can be compared with other color differences determined under such conditions.
The reflectance spectra of the investigated surfaces were measured with a Konica Minolta CM-2600d spectrophotometer. The instrument parameters are 8 mm head diameter, SCI (specular component included) measurement mode, and CIE 1964/10° geometry. Using the spectrophotometer calibration process, absolute reflectance spectral distributions were measured. As it was mentioned earlier, D65 was used as the reference light source for the calculations. From the CIE L*a*b* colorimetric characteristics determined from the reflectance spectra of the investigated surfaces, the colorimetric transformation due to temperature stress could be quantified.
The physical parameters were tested following the guidelines given by European Norms: Bulk density (EN 1936:2006) [43], the propagation speed of the ultrasonic wave (EN 14579:2005) [44]. For measuring the P- and S-wave velocities, a PUNDIT and a GEOTRON device were used. The PUNDIT (Portable Ultrasonic Non-destructive Digital Indicating Tester) is an automatic P-wave propagation time tester instrument. It is suitable for easy and quick measurements, however less accurate than a more precise instrument (e.g., GEOTRON). To increase accuracy, plasticine was used as a coupling agent to fill the gap between the sample and the transducers. The frequency of the transducers was 50 kHz. The GEOTRON instrument is a more sophisticated design than PUNDIT, which allows more accurate detection of wave propagation velocity at a longer measurement time. This instrument is capable of detecting the speed of S waves in addition to P waves. UP-SW transducers with an 80 kHz frequency were used for measurements. For the identification of the first onset of P- and S waves, the selected amplitudes of 100 mV were applied. On 750 °C groups, P- and S-wave velocity with the GEOTRON device could not be carried out due to the highly cracked sample and the sensitivity of the device. Instead, a non-standardized test, the Duroskop, was used to determine the surface hardness of the samples. This instrument was initially used to test the surface hardness of metals. It has recently been used to test rock specimens [45,46]. Duroskop is a powerful tool for measuring small surfaces and minor changes in surface strength as it has a small-pointed mass that rebounded from the surface [47]. The device is primarily a portable tool, but a frame was used in the laboratory to test cylindrical specimens.
The test numbers of measurements used in statistical results can be seen in Table 1.
Testing for physical parameters in most cases was performed before and after the thermal treatments. However, in some cases, the GEOTRON ultrasound velocity measurements and spectral recordings were carried out only on heat-treated samples.

3. Results and Discussion

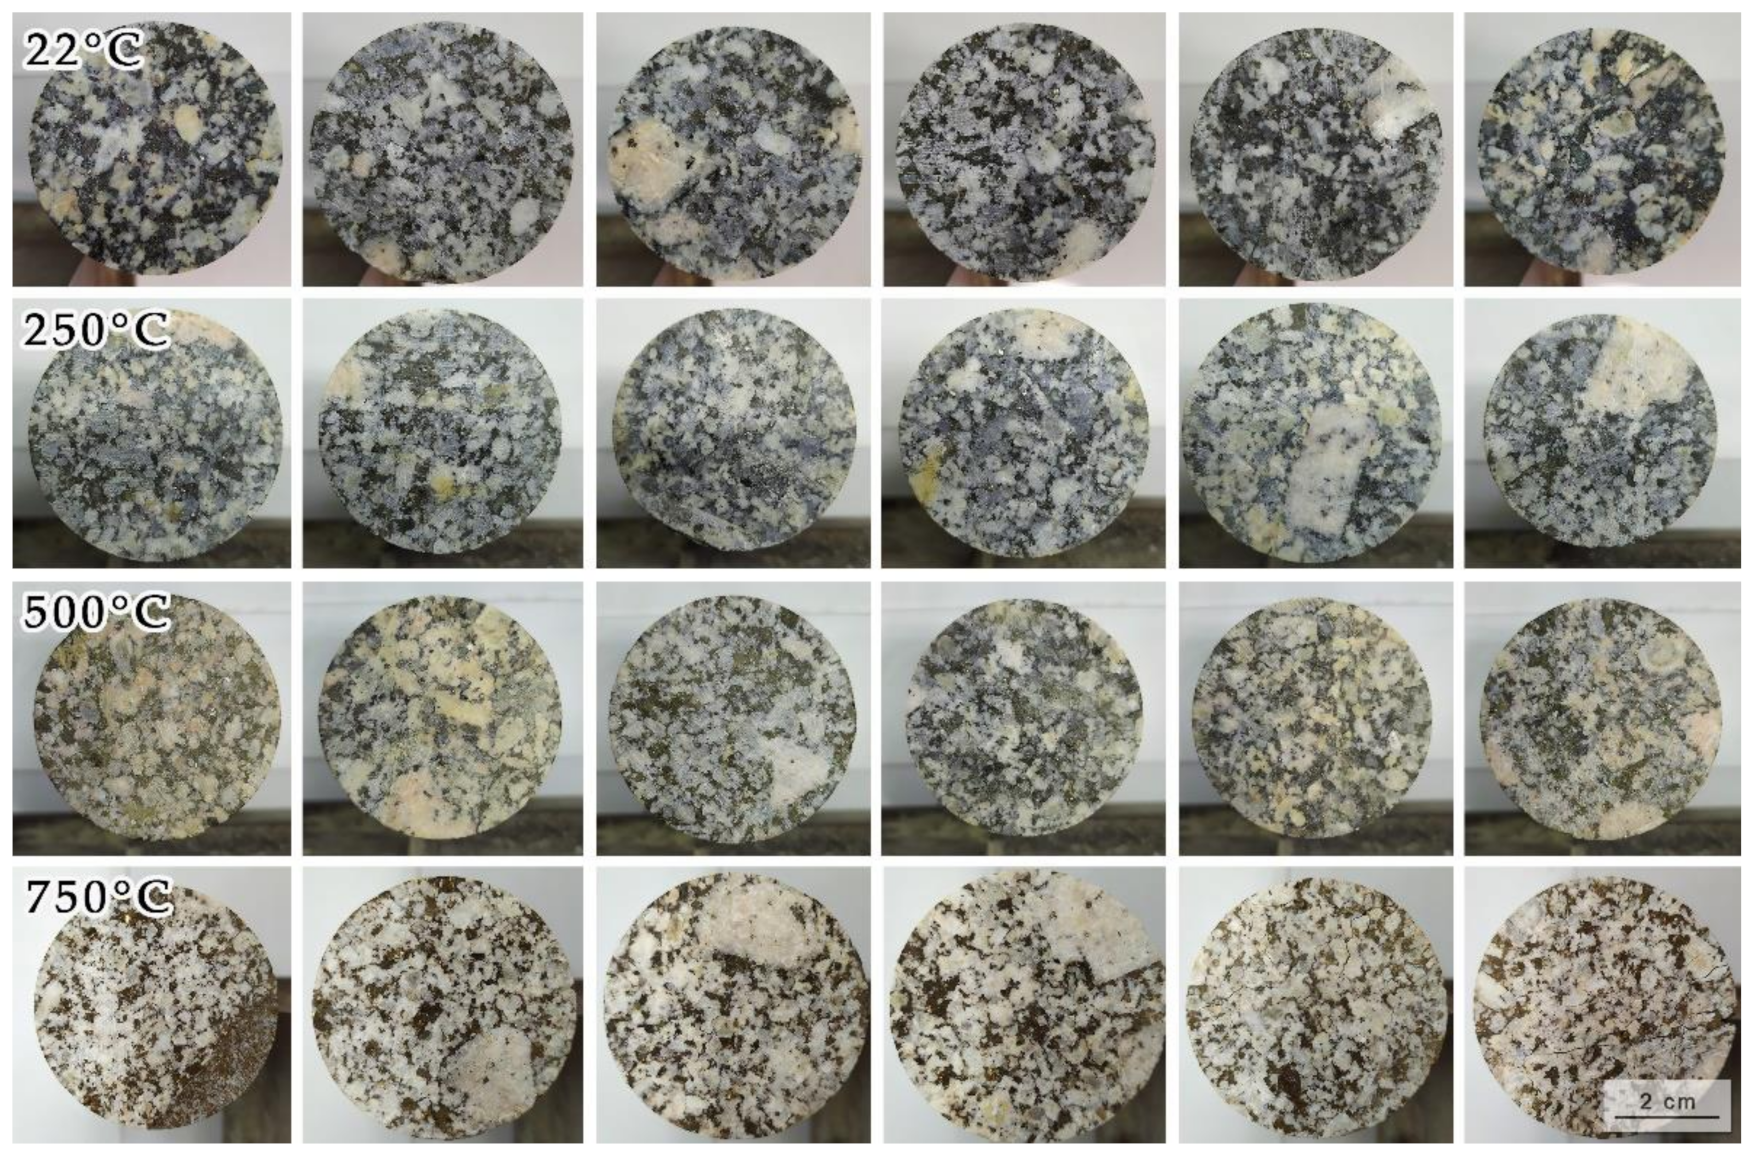
The monzogranite samples showed apparent and significant physical changes after heat treatment. The colors and the texture of the specimens were also changed in addition to the specified factors (Figure 3).
The standard 22 °C groups had a reddish-dark grey base color, which is typical of the examined monzogranite. Small yellowish-brown patches emerged on the surface of the specimens after heat treatment at 250 °C. The entire sample exhibited a pale yellowish-brown base color after being heated from 22 °C to 500 °C. After 750 °C of thermal treatment, the most substantial alteration occurred. The specimens had a yellowish-reddish-brown color transition, and visible inter- and intragranular macro-cracks appeared on the surface. The whitening of the grey and light pale pink feldspars appeared among the primary phases of the rock, separating the light quartz and feldspar from the biotitic phases and transforming them into dark red.
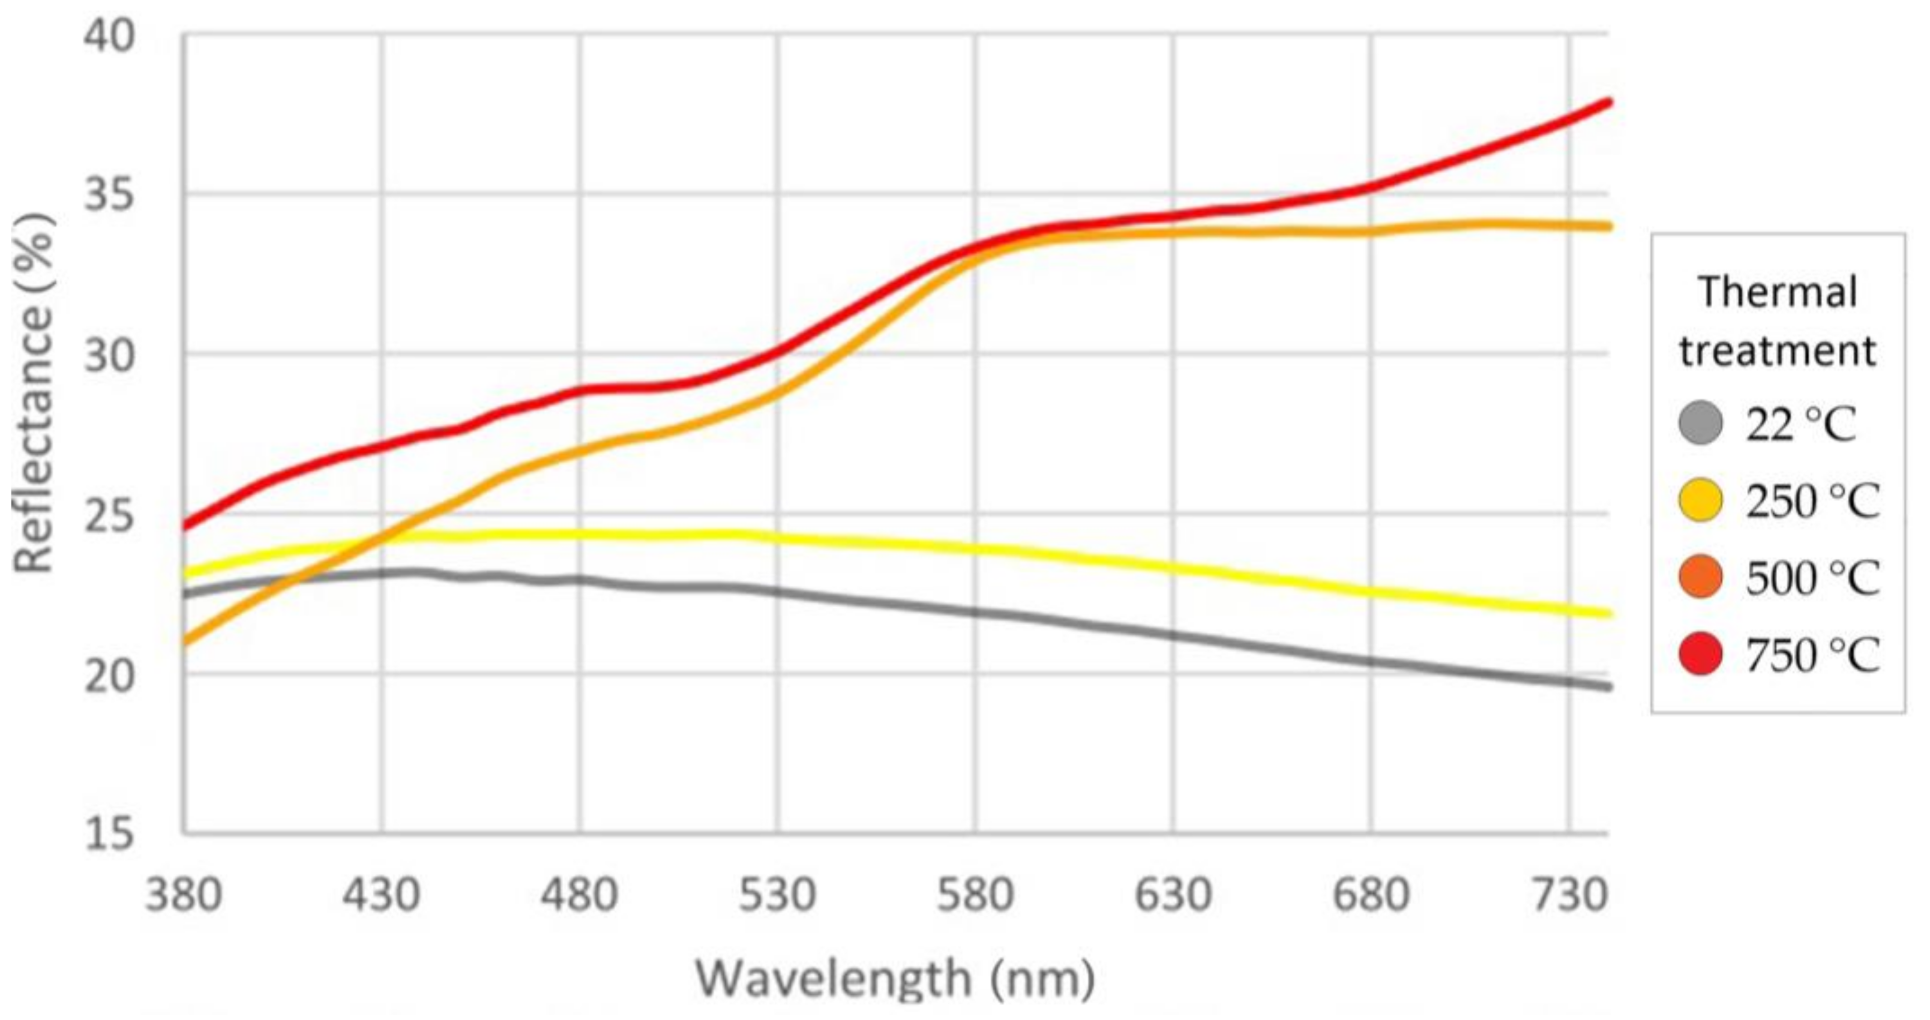
According to the distribution of the spectral reflectance spectrum (Figure 4), it can be clearly stated that the curves shift upwards due to the rising temperature, so the samples become brighter. It can also be seen that in the range of longer wavelengths, the curves rise more strongly, so their color shifts in the direction of yellow.
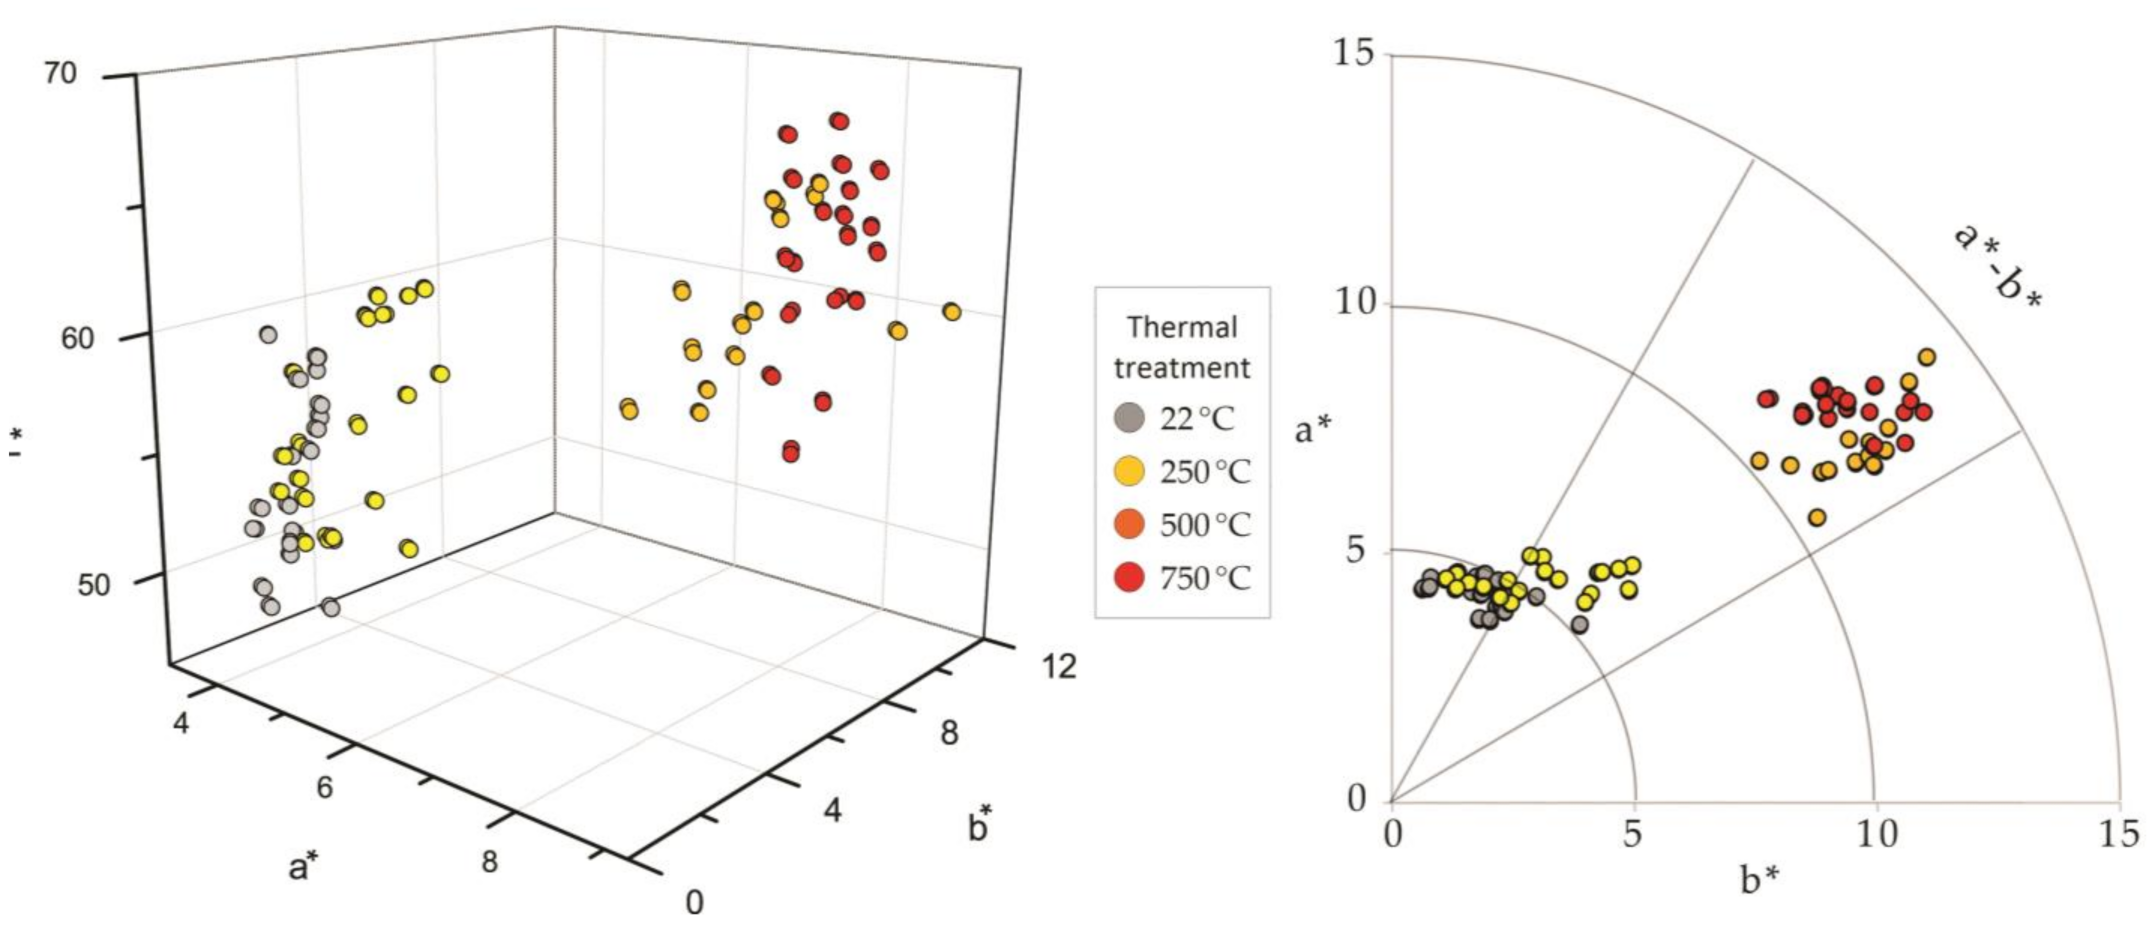
Table 2 shows the colorimetric data of the room temperature and heat-treated granite samples used in the CIE L*a*b* system. The data reflects the trends in a color change from 22 °C to 750 °C (Figure 5).
However, the CIE L*a*b* system is suitable for calculating the extent of the color difference as its preferred method for more sophisticated tracking of color change. It is known that it converts the reflectance spectrum into a uniform color space. In our case, the illumination was a D65 standard light source corresponding to sunlight.
The plot of the samples in CIE L*a*b* color space (Figure 5) shows that the measurement results for each temperature are well separated in terms of both lightness and color, and the trend of changes is also well identified. This is also supported by the projection of the CIE L*a*b* color space data onto the a*-b* plane, the direction of color change as a function of heat impact is clear. As mentioned earlier, lightness increases with temperature have also been proven [48]. The color changes from green to red and from ‘blue’ to yellow are represented in the a* vs. b* diagram (Figure 5).
Our results show an agreement with previous findings, namely that the color and brightness values vary with the composition of the material and the degree of heat impact [49,50].
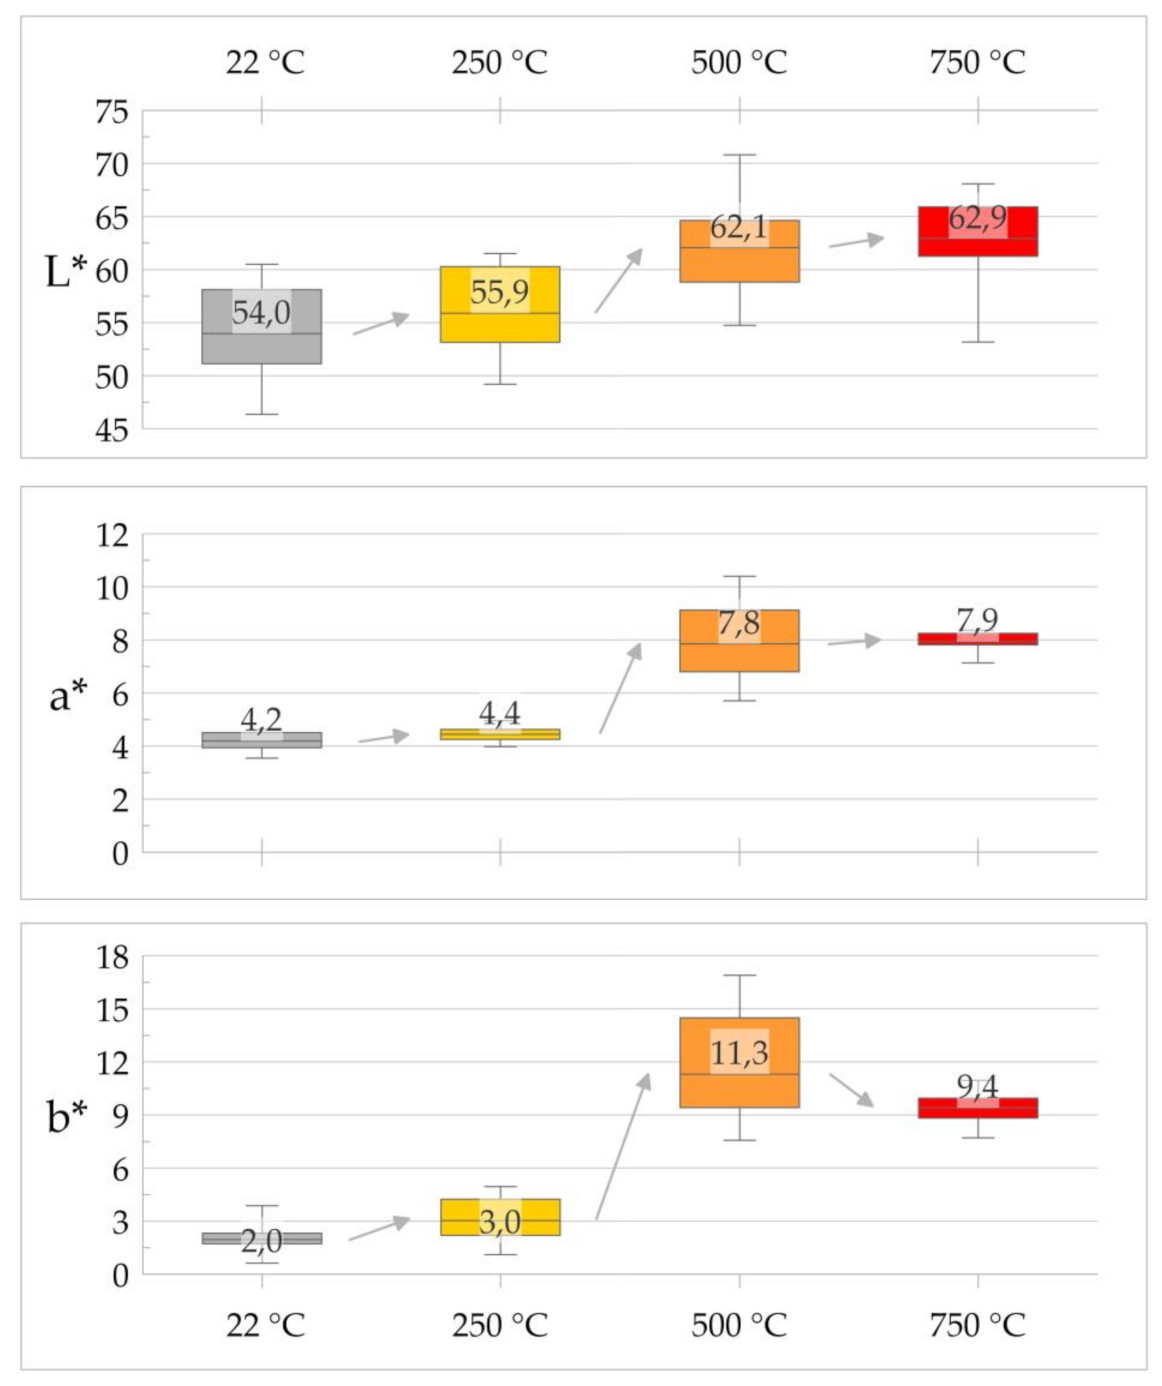
The CIE L*a*b * diagram suggests a significant change in the colorimetric parameters between 250 and 500 °C, with little change at temperatures below and above (Figure 6). Note that further refining the temperature scale and applying a skewed ramp function approximation would be possible to accurately identify the temperature around which a significant change in colorimetric parameters occurs.
It has been shown that color changes are good indicators of the thermal decay of granitic rocks [51]. Our results also support the previous findings that non-destructive measurement of the change in colorimetric parameters is an excellent tool for estimating heat damage [48]. Because the color change due to heating correlates with changes in other material properties, the color change can be used to detect the exposure temperature, from which the corresponding fire damage can be estimated [49,50,52].
Physical properties such as mass, volume, bulk density, P-wave velocity, S-wave velocity, and surface hardness show changes with temperature (Table 3).
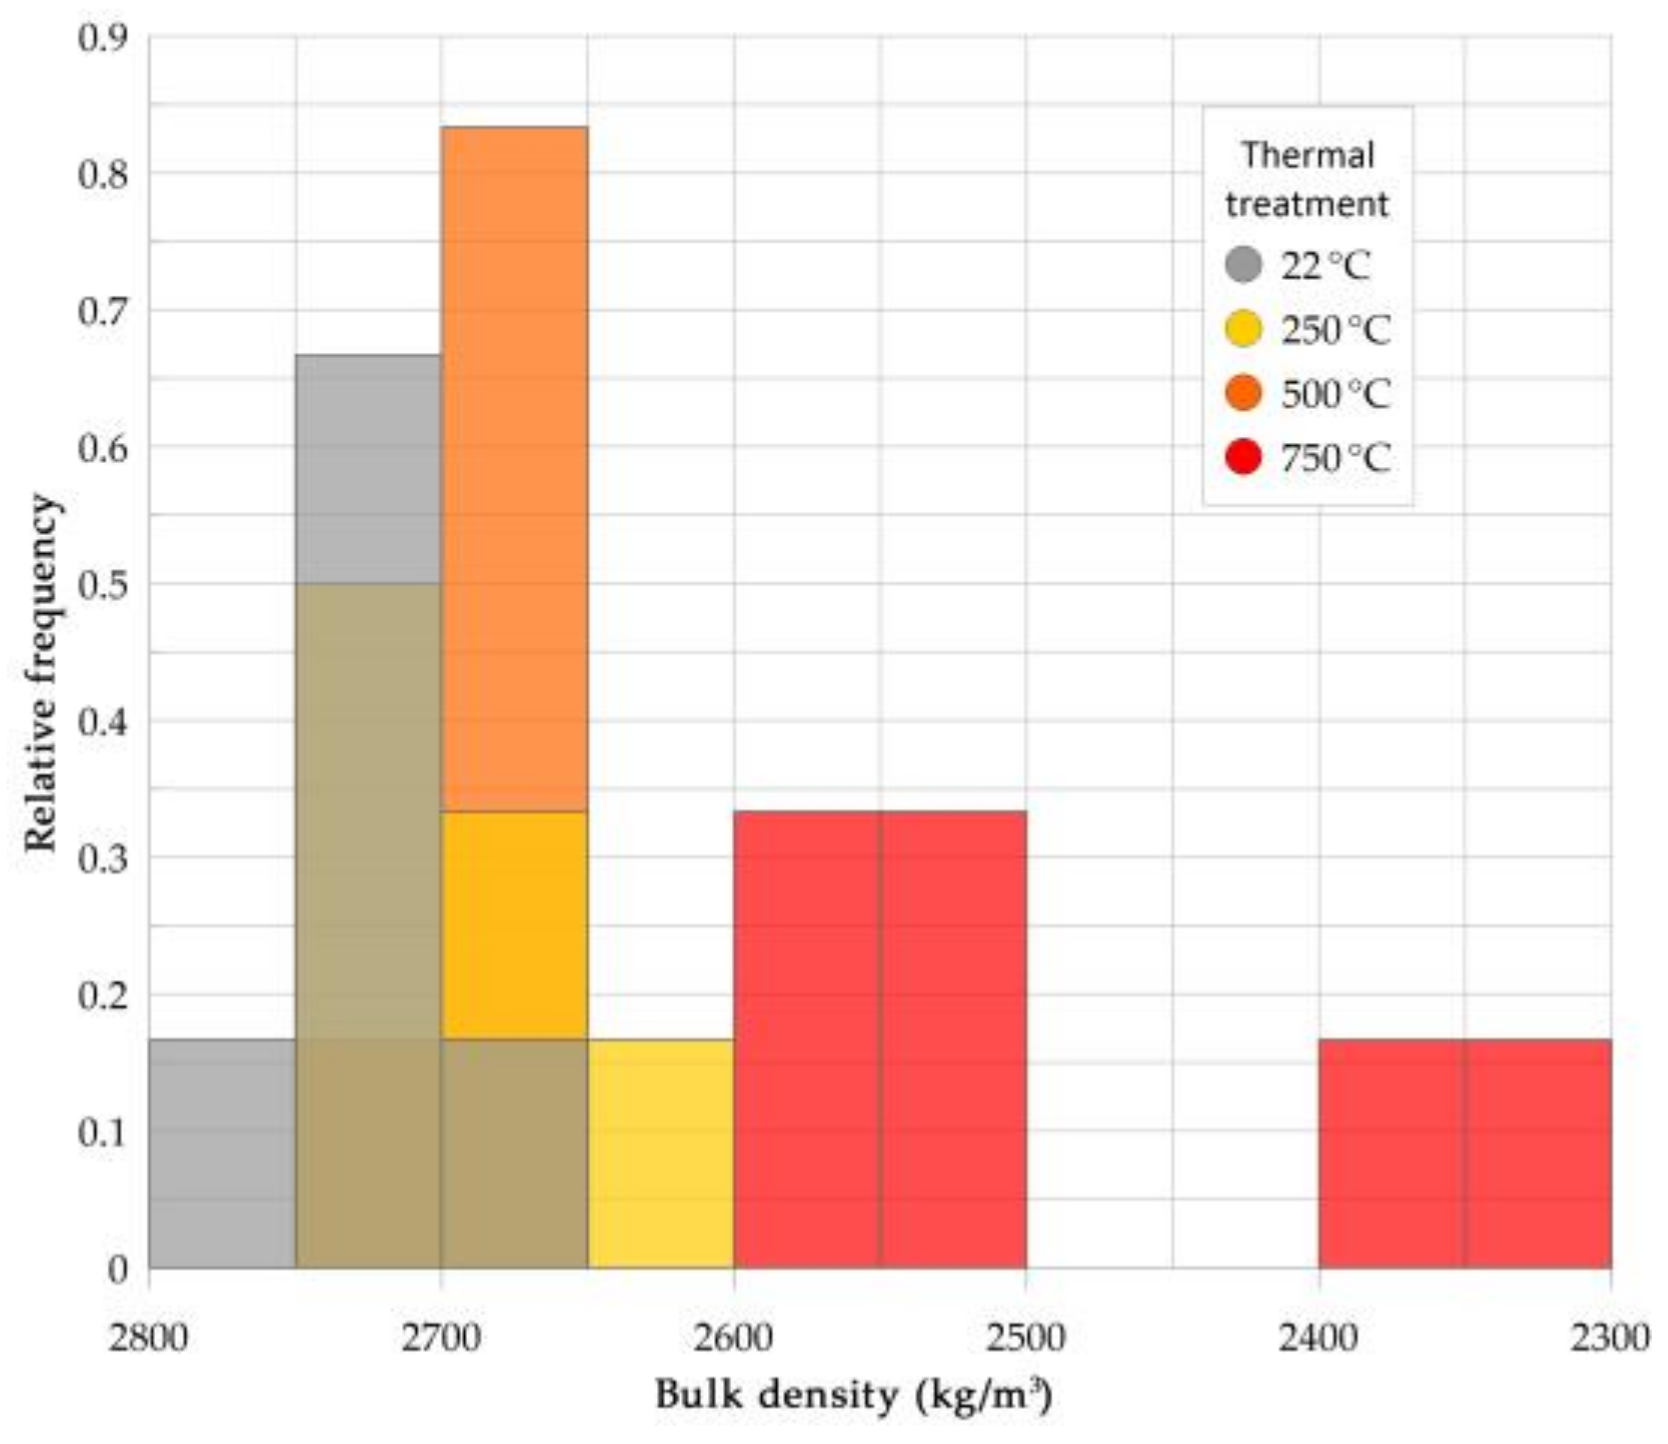
The mean bulk density of 2716.0 kg/m3, with a standard deviation of 23.6 at room temperature, decreased to 2678.1 kg/m3 at 250 °C. Surprisingly, at 500 °C, a slight increase of 0.62% in density (mean value 2694.7 kg/m3) was found compared to 250 °C bulk density values However, comparing 22 °C and 500 °C density values, bulk density decreases slightly with heat-treatment. Further heating to 750 °C caused a significant drop (−7.47%) in mean bulk density. This change is linked to a volume increase. Bulk density values after 750 °C of heat-treatment tend to split into two subgroups with means of 2559.3 and 2361.3 kg/m3 (Figure 7).
Bulk density values decreased from 22 °C to 250 °C, followed by a slight increase to 500 °C. At 750 °C, they are indicating a significant drop in bulk density values. In terms of mass and volume change—as the primary control factor of bulk density change—a minor but continuous decrease in mass appear in the groups, but volume change tends to differ. Volume increased from 22 °C to 250 °C (+1.2%) and further increases to 500 °C, which was followed by a significant rise in volume at 750 °C (+8,3%). As the heat expansion difference of the main rock-forming minerals and phase alterations (such as α-quartz to β-quartz alteration at 573 °C) occur, significant volume increases, and thereby, cracks develop in the structure of the monzogranite samples [14,15,53,54]. The heat-induced cracks might develop at lower temperatures [24], but at elevated temperatures (750 °C) can be seen macroscopically on the surface of the specimens (Figure 8). These factors contribute to the bulk density changes.
Comparing the measured heat-treated granite results reported in the literature [14,55,56,57,58], the bulk density value changes after heat treatment shows similar trends as reported in this paper. Similar bulk density value decreases from room temperature to around 200 °C and a similar increase occurs from ~200 °C to ~500 °C, which is also documented in the literature [55,56]. From 500 °C to 800 °C, a significant decrease in bulk density values occur similarly in the literature as in this paper; thus, the measured data in this research match the processes known from other similar works (Figure 9).
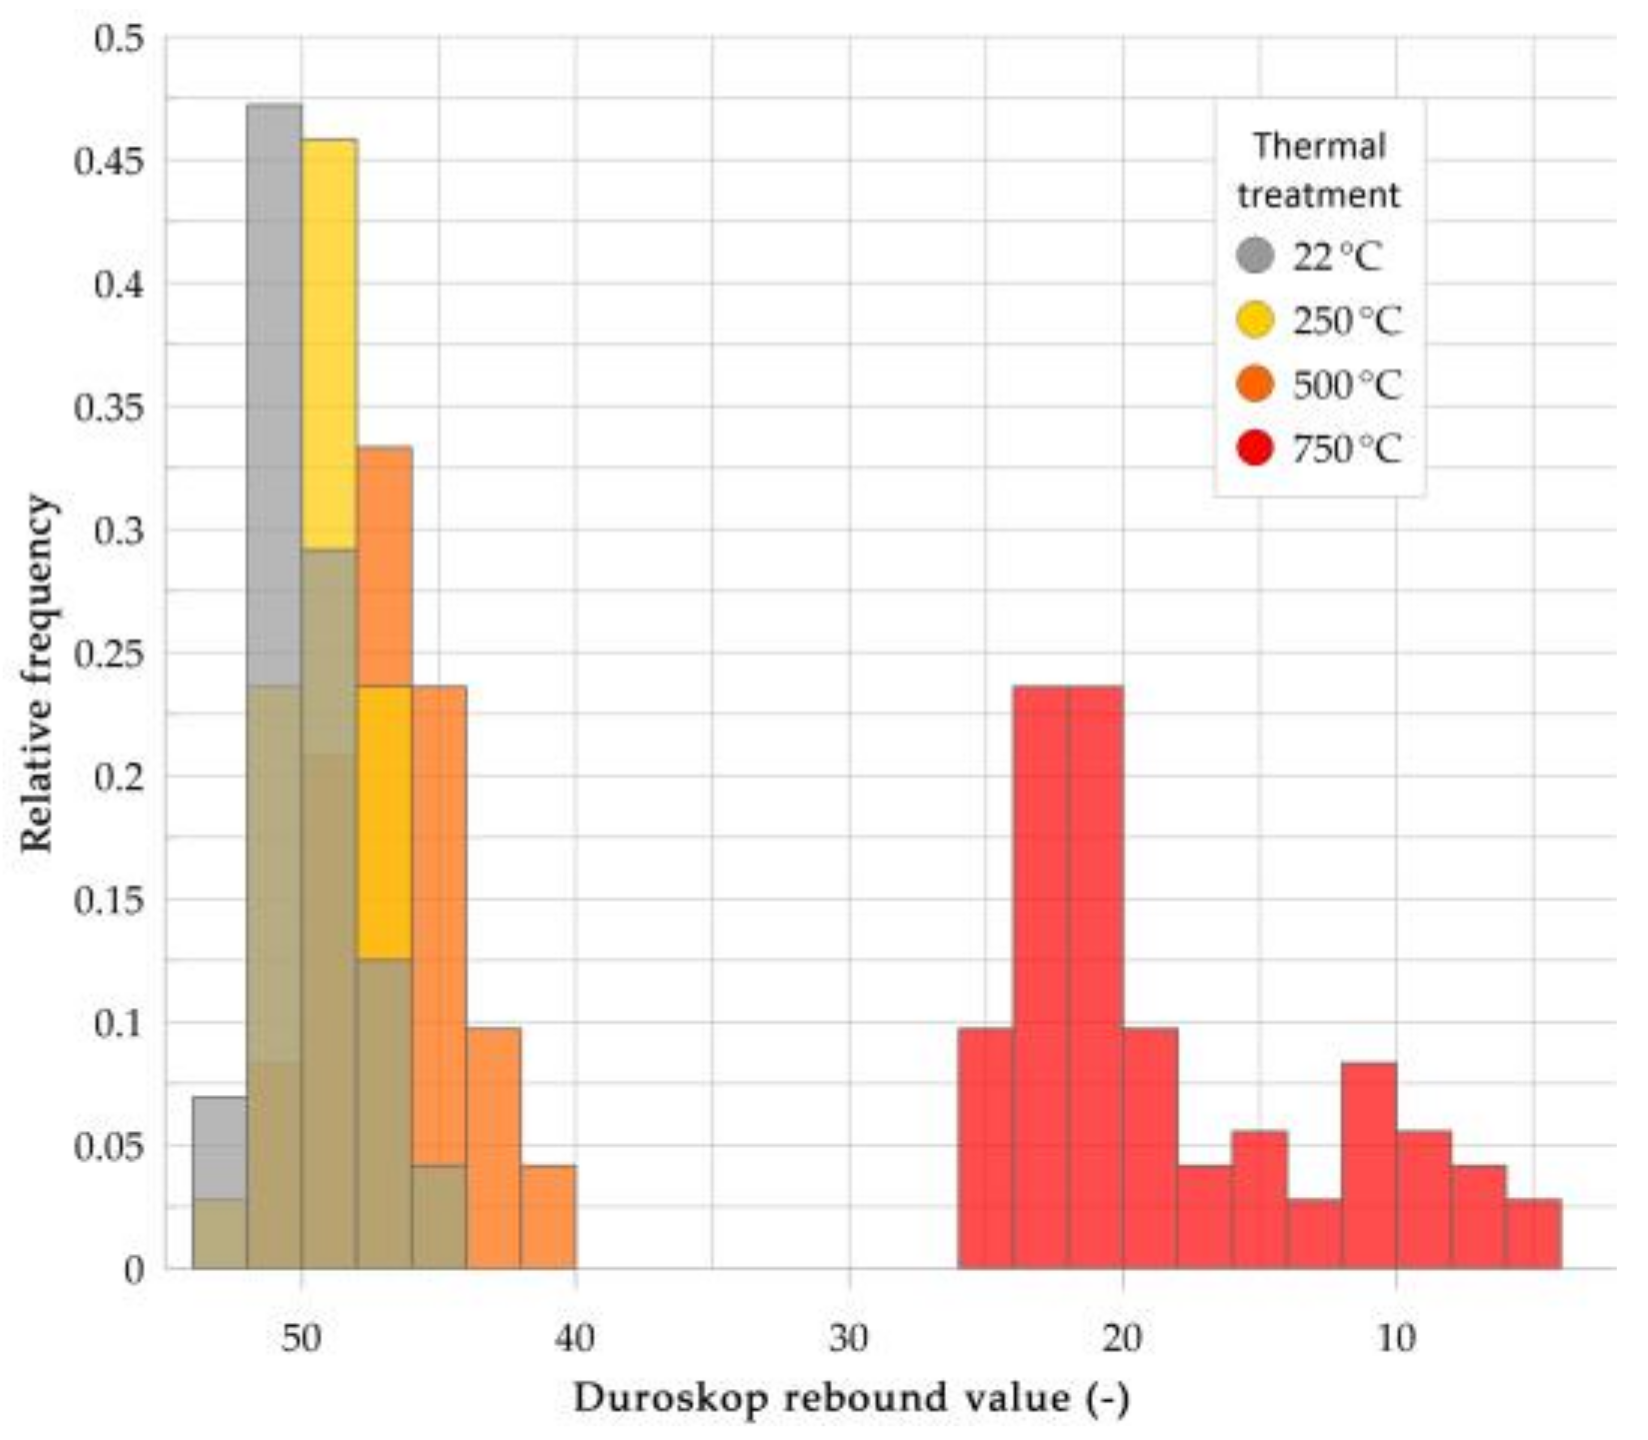
Duroskop rebound values show that surface strength also decreases after heat treatment (Figure 10) besides the granite’s mass-, volume (Figure 7), phase-, and color changes (Figure 7). The surface strength of the samples slightly decreases from room temperature to 250 °C and 500 °C and significantly drops at 750 °C. The phase alteration- and thermal expansion-driven crack development [14,15] significantly weakens the surface strength of the monzogranite. At room temperature, an average of 51 decreases to 49 at 250 °C. Rebound values at 500 °C show another slight decrease in surface hardness with an average of 47. After 750 °C heat-treatment, a significant 63% decrease in Duroskop mean values occurred compared to room temperature averages with a mean of 19 (Figure 10). This tool has been proved to describe well small surface strength changes in heritage stones associated with weathering [45,46,47]. It has only been recently applied to test the surface strength of heat-treated stones such as granitic rocks [59], suggesting strength loss with increasing temperature [60]. Our results are in good agreement with these previous studies [59,60], namely, values around 50 signify high surface strength, while values less than 20 represent weakened surfaces.
P-wave velocity data of PUNDIT instrument in heat-treated groups decrease from 22 °C to 750 °C with average values of 5.29 km/s (22 °C), 4.49 km/s (250 °C), 3.32 km/s (500 °C) and 0.76 km/s at 750 °C. Data shows that at 750 °C, a significant 87% decrease in mean values occur from room temperature to heat-treated average values. The results of GEOTRON instrument P-wave velocity values show similar results as PUNDIT values. At room temperature, an average of 5.28 km/s decreases to 4.56 km/s at 250 °C. At 500 °C, the mean P-wave velocity of the specimens was 3.39 km/s. S-wave velocities show a similar decrease in velocity values. At 22 °C 3.23 km/s average slows down to 3.00 km/s at 250 °C. At 500 °C, a mean of 2.40 km/s occurs at the samples (Figure 11).
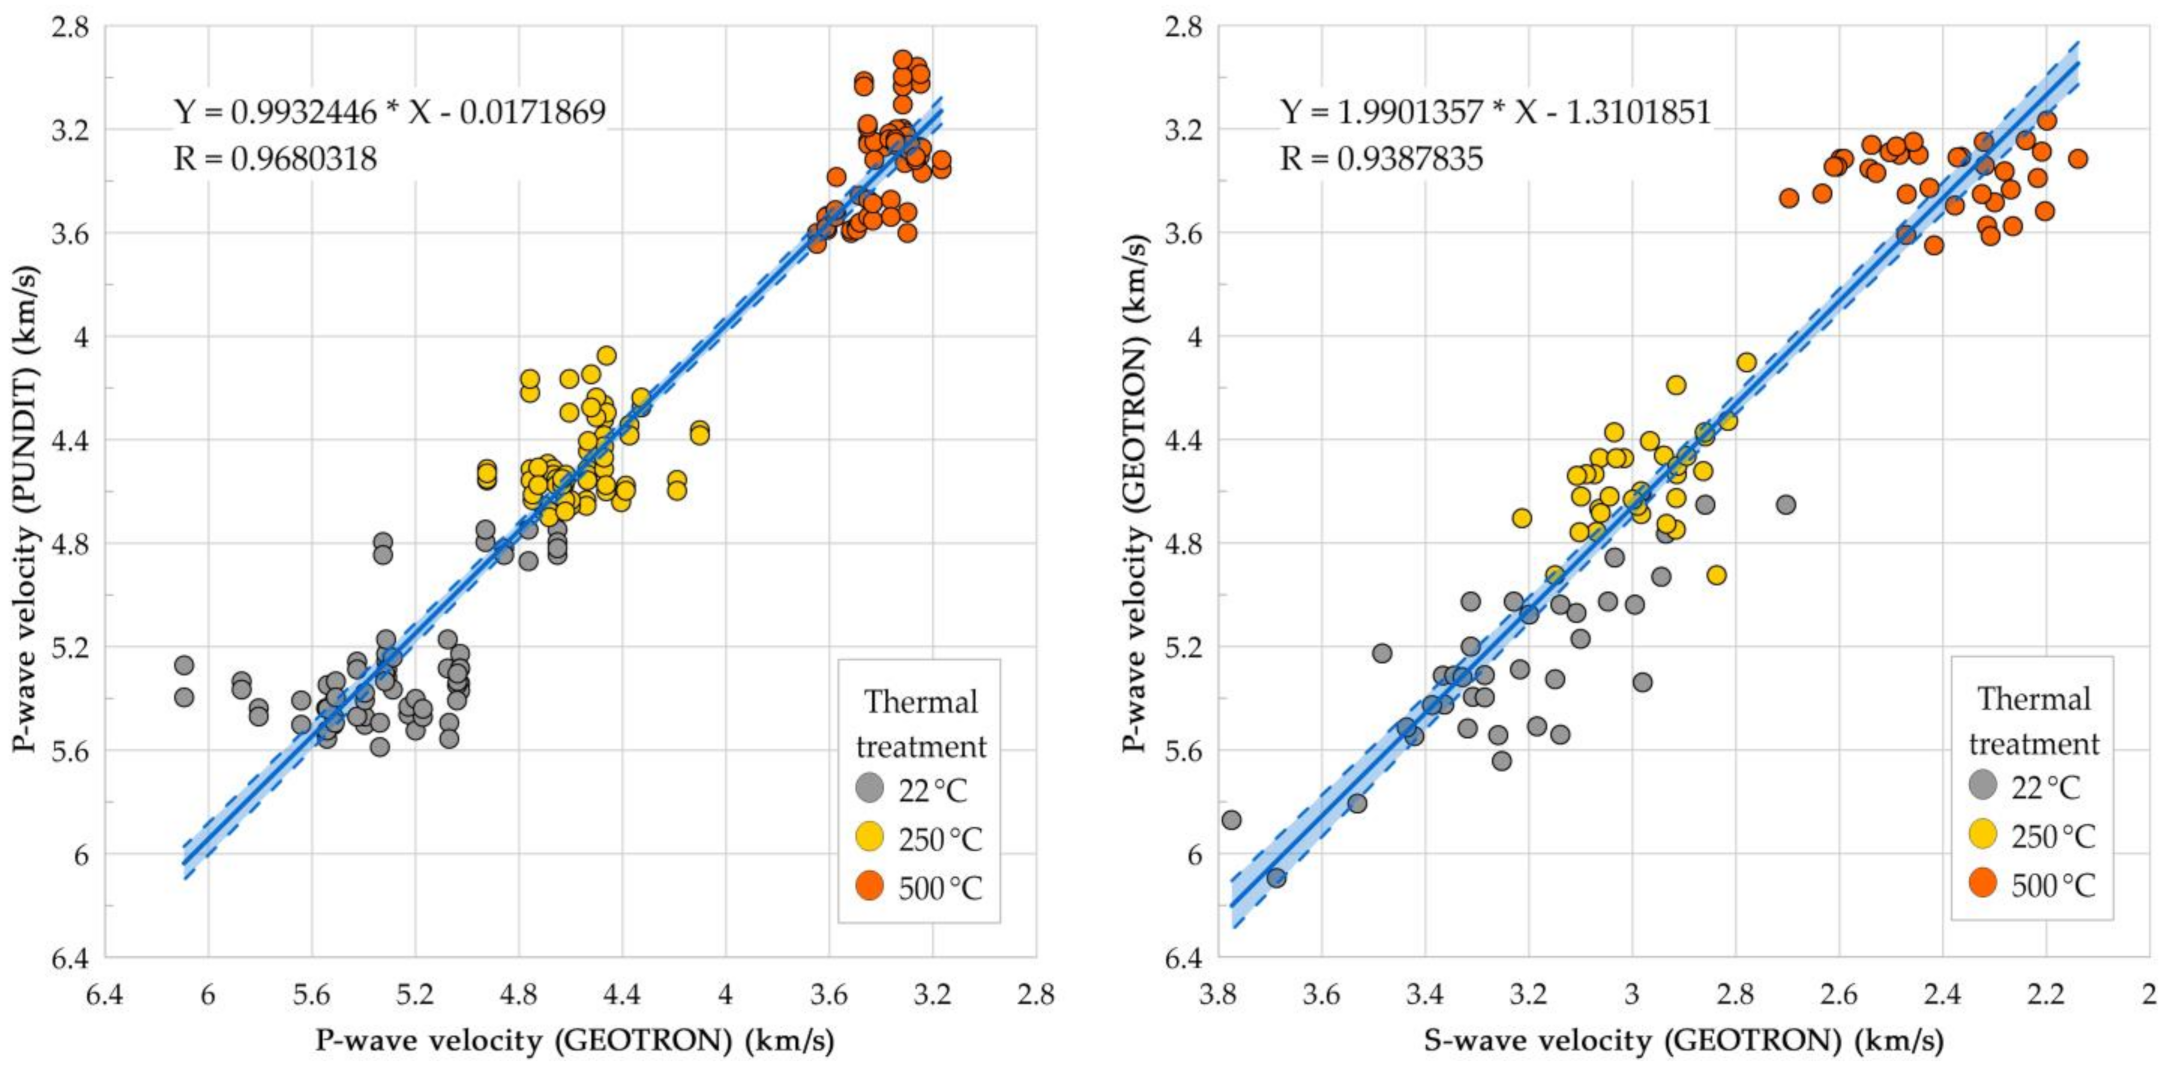
GEOTRON instrument P-wave velocity values show a high correlation with PUNDIT instrument values with an R-value of 97%, and therefore, presents the same trend and similar values as PUNDIT P-wave values. This high correlation value shows that the quick and easy-to-use PUNDIT-, and the more accurate but time-consuming GEOTRON instrument results can be used side by side. The sensitivity of the GEOTRON instrument did not allow to record the P-, (nor the S-wave) velocity measurements of 750 °C heat-treated samples, however, the PUNDIT measurement could measure these values.
For further studies, these results could be used as complements to each other. S-wave velocity values of the GEOTRON instrument show a similar tendency as the P-wave velocity value decreases among heat-treated groups. At room temperature of 22 °C, the mean pulse velocity is 3.23 km/s, dropping to 3.00 km/s at 250 °C. It shows a further decrease to 2.40 km/s after 750 °C heat-treatment. S-wave and P-wave velocity values of the GEOTRON instrument show a high linear correlation with an R-value of 94% (Figure 12).
Ultrasound velocity values as P- and S-wave velocity values from both PUNDIT and GEOTRON instruments show the best way to quantify physical changes in the samples after heat-treatment from the examined measurements.
Phase alteration- and thermal expansion generated crack development processes, which tend to slow down ultrasound velocities in the samples [14,15]. Different heat-treated subgroups form separate data populations and show a continuous decrease in velocities between heat-treated groups.
P-wave velocity values decrease similarly in this research and the examined literature [14,54,55,56,57]. Ultrasound velocities gradually decrease from room temperature to 200–300 °C, followed by a rapid fall in velocity values from 400 °C to 800 °C, as reported before (Figure 13).
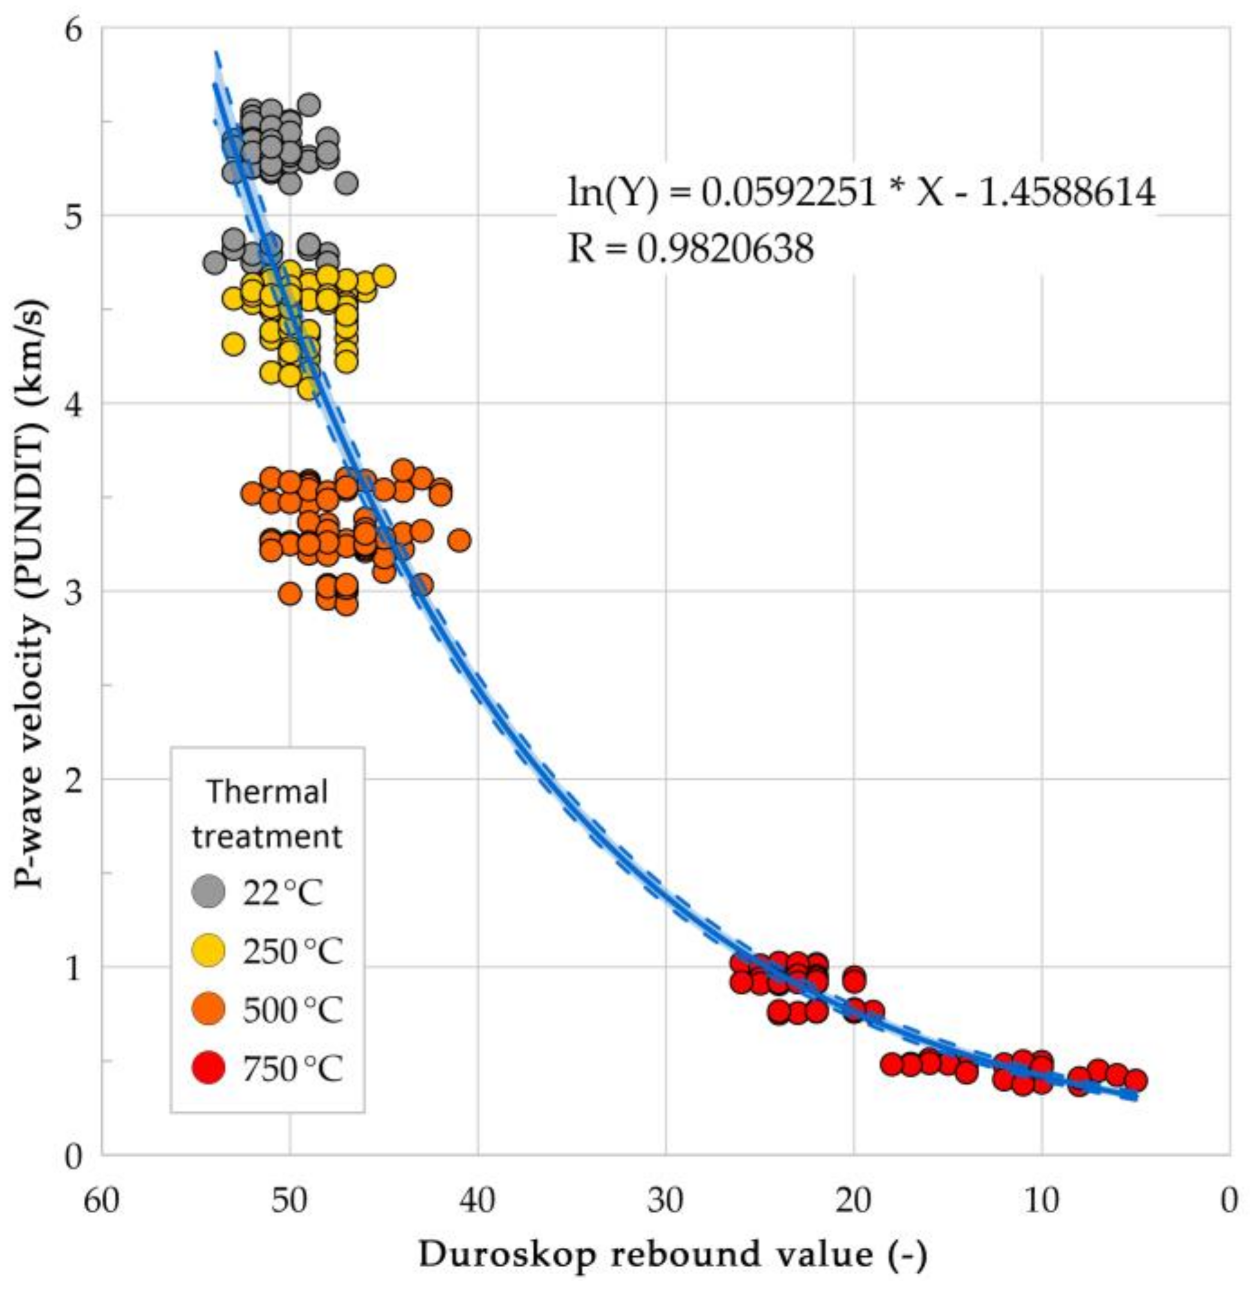
Temperature elevation tends to alter the physical properties of the specimens, as previously shown. PUNDIT P-wave velocity shows a high exponential correlation with Duroskop values (Figure 14).
P-wave velocity and Duroskop show exponential correlation with an R-value of 98%. As P-wave velocity shows the best way to indicate the physical changes inside the samples and Duroskop value changes of the surface hardness change, the high correlation of these two parameters suggests that physical changes occur inside and outside the specimens.
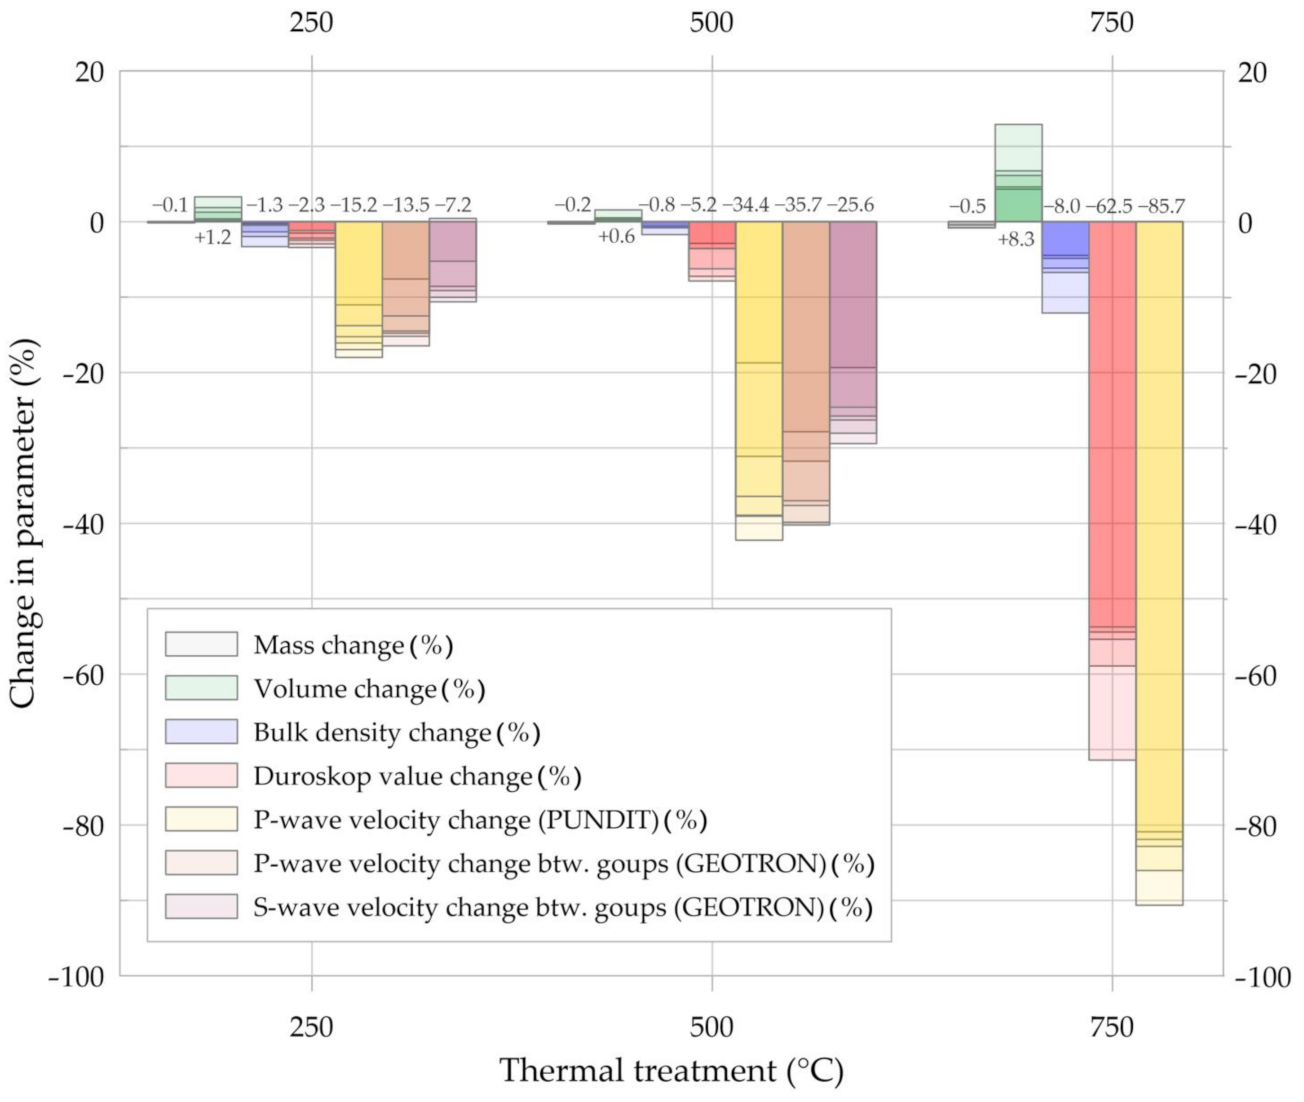
From room temperature to 250 °C, 500 °C and 750 °C mass decrease slightly, volume values at 250 °C increase then decrease at 500 °C and increase significantly at 750 °C. From these results, bulk density values show similar changes as volume changes in the specimens at elevated temperatures. Duroskop values decrease slightly at 250 °C and 500 °C, then significantly at 750 °C. P- and S-wave velocity values decrease continuously. The percental changes and comparison of all measured physical parameters can be seen in Figure 15. Percental changes of mass, volume, bulk density, PUNDIT and GEOTRON P- and S- wave velocity, and Duroskop values represent the percentage changes between untreated room temperature and heat-treated values and not between consecutive temperatures.
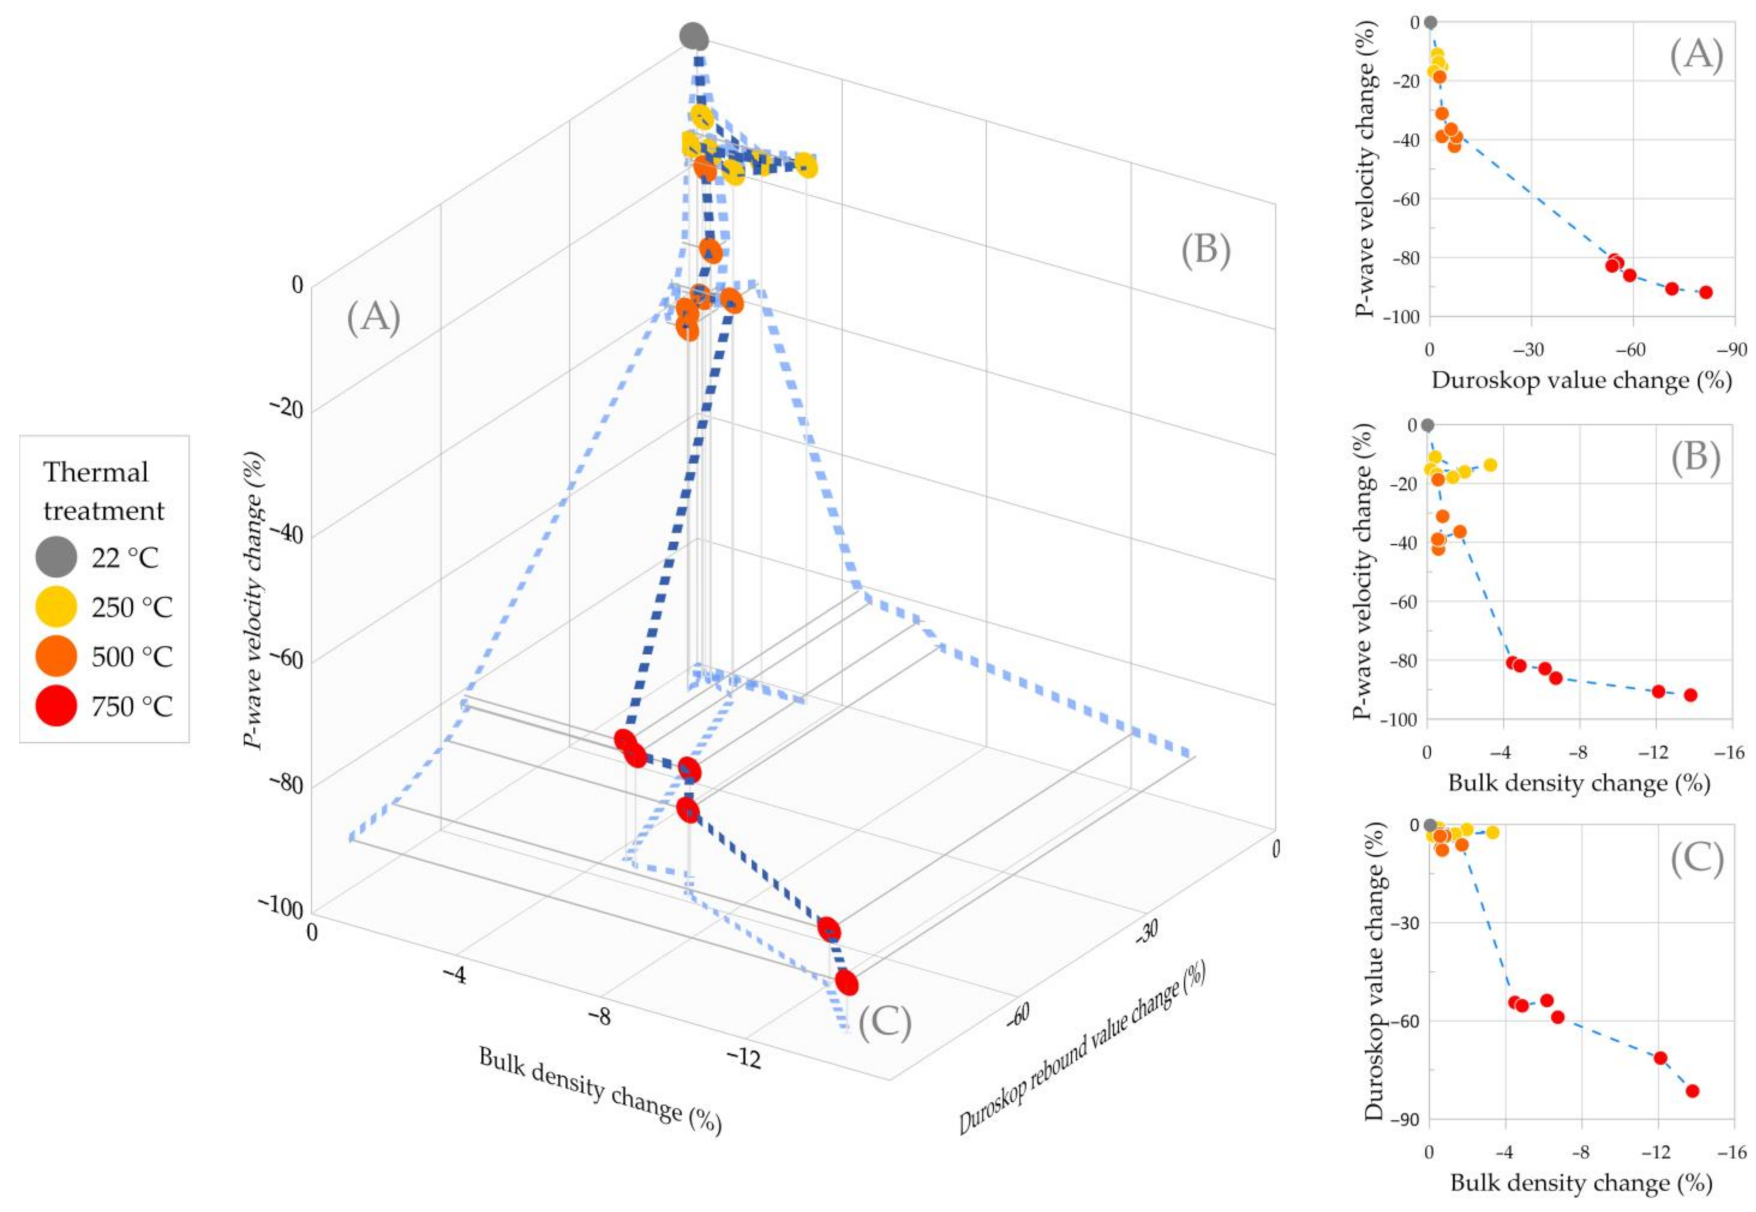
P-wave velocity, bulk density, and Duroskop value changes together show a correlation in parameters in terms of multi-modal comparisons. Heat-treatment processes induce significant bulk density, surface strength-, and ultrasound velocity decreases. These physical changes tend to correlate exponentially (Figure 16).
Physical parameters change slightly between room temperature and 500 °C and significantly between 500 °C and 750 °C, as shown in Figure 15. Mineral alterations and related expansions (such as α-quartz to β-quartz inversion at 573 °C) and the thermal expansion difference of the main rock-forming minerals cause micro- and macro cracking inside and on the outer surface of the specimens between 500 °C and 750 °C [14,15,52,53]. This cracking development increases volume significantly and permanently while decreasing bulk density-, P- and S-wave velocity-, and Duroskop surface strength values.
For further research, heat-treatment between 500 °C and 750 °C is essential in order to increase the examination of the physical decrease of the host rock.

4. Conclusions

Thermal experiments at 250 °C, 500 °C, and 750 °C altered the physical and color properties of monzogranite samples that form the host rock of Hungary’s National Radioactive Waste Storage Facility. Heat treatment caused color and textural changes in the tested monzogranite rocks.
The most deleterious one was at 750 °C when macro-cracks appeared on the surface of the specimens. Mineral changes and thermal expansion differences of main rock-forming minerals caused a change in the physical properties of the monzogranite samples. Reflectance spectra of the heat-treated specimens show a curve shift upwards due to the rising temperature; the samples become brighter. Furthermore, the color shifts in the direction of yellow. Color change of CIE L*a*b * diagram shows a significant change in the colorimetric parameters between 250 °C and 500 °C.
At 250 °C, bulk density tends to drop, then increase at 500 °C. At 750 °C, there is a significant decrease in bulk density values related to the volume change in the samples. Duroskop surface strength of the monzogranite slightly decreases until 500 °C; then, it is significantly reduced at 750 °C. Ultrasound velocity of both P- and S-waves with PUNDIT and GEOTRON instruments show uniform and a significant decrease in values at elevated temperatures due to micro-cracking development of the specimens. Ultrasound velocity values seem to be the best non-destructive test method to describe the thermal behavior of the monzogranite since it decreases with temperature increase, indicating the volume increase, the formation of micro-cracks, and the loss in material strength.

Author Contributions

Conceptualization, A.N. and Á.T.; methodology, A.N., Á.A. and Á.T.; rock mechanical parameters testing, A.N.; color measurements, Á.A.; writing—original draft preparation, A.N., Á.A. and Á.T.; writing and editing, A.N., Á.A. and Á.T.; visualization, A.N. and Á.A.; supervision, Á.T.; funding acquisition, Á.T. All authors have read and agreed to the published version of the manuscript.

Funding

The financial support of the National Research Development and Innovation Office of Hungary (ref. no. K 116532) is acknowledged.

Institutional Review Board Statement

Not applicable.

Informed Consent Statement

Not applicable.

Acknowledgments

We would like to thank the employees of RHK Kft. for offering a collection of samples and related documents for this and further research. Furthermore, we would like to thank the Department of Highway and Railway Engineering for using their electric oven.

Conflicts of Interest

The authors declare no conflict of interest.

References

  1. Neumann, P.A. The geological disposal of nuclear waste. J. Environ. Radioact. 1988, 6, 92–94. [Google Scholar] [CrossRef] [Green Version]
  2. Freiesleben, H. Final disposal of radioactive waste. In Proceedings of the EPJ Web Conference, Varenna, Italy, 30 July–4 August 2012; Volume 54, p. 1006. [Google Scholar] [CrossRef] [Green Version]
  3. Chapman, N.; Hooper, A. The Disposal of Radioactive Wastes Underground. In Proceedings of the Geologists’ Association 2012. Volume 123, pp. 46–63. Available online: https://www.sciencedirect.com/science/article/abs/pii/S0016787811000940 (accessed on 17 September 2021). [CrossRef]
  4. Geological Society of London. Geological Disposal of Radioactive Waste. A Policy Briefing Note from the Geological Society of London. The Briefing Note. 2020. Available online: https://www.geolsoc.org.uk/~/media/shared/documents/policy/briefing%20notes/geological%20disposal%20radioactive%20waste%20policy%20briefing%20note.pdf?la=en (accessed on 15 September 2021).
  5. Istovics, K.; Tóth, M.T. Fracture network modeling around the Radioactive Waste Repository in Bátaapáti, based on BN2-1 pre-boring. In Mérnökgeológia-Kőzetmechanika; Török, Á., Görög, P., Vásárhelyi, B., Eds.; Hantken Kiadó: Budapest, Hungary, 2016; pp. 119–128. [Google Scholar]
  6. Balla, Z.; Gyalog, L.A. Mórágyi-Rög Eszakkeleti Részének Földtana. Magyarázó a Mórágyi-rög ÉK-i Részének Földtani TérképsoRozatához (1:10 000); (in Hungarian, translated title: Geology of the north-eastern part of the Mórágy Block: Explanatory notes to the geological map-series of the north-eastern part of the Mórágy Block (1:10 000)); Magyar Állami Földtani Intézet: Budapest, Hungary, 2009; Volume 15–17, pp. 58–69. [Google Scholar]
  7. Martinho, E.; Dionisio, A. Assessment Techniques for Studying the Effects of Fire on Stone Materials: A Literature Review. Int. J. Archit. Herit. 2020, 14, 275–299. [Google Scholar] [CrossRef]
  8. Ozguven, A.; Ozcelik, Y. Effects of high temperature on physico-mechanical properties of Turkish natural building stones. Eng. Geol. 2014, 183, 127–136. [Google Scholar] [CrossRef]
  9. Brotóns, V.; Tomás, R.; Ivorra, S.; Alarcón, J.C. Temperature influence on the physical and mechanical properties of a porous rock: San Julian’s calcarenite. Eng. Geol. 2013, 167, 117–127. [Google Scholar] [CrossRef]
  10. Tian, H.; Kempka, T.; Yu, S.; Ziegler, M. Mechanical Properties of Sandstones Exposed to High Temperature. Rock Mech. Rock Eng. 2016, 49, 321–327. [Google Scholar] [CrossRef]
  11. Sirdesai, N.N.; Singh, T.N.; Pathegama Gamage, R. Thermal alterations in the poro-mechanical characteristic of an Indian sandstone—A comparative study. Eng. Geol. 2017, 226, 208–220. [Google Scholar] [CrossRef]
  12. Li, Y.; Zhai, Y.; Wang, C.; Meng, F.; Lu, M. Mechanical properties of Beishan granite under complex dynamic loads after thermal treatment. Eng. Geol. 2020, 267, 105481. [Google Scholar] [CrossRef]
  13. Heuze, F.E. High-temperature mechanical, physical and Thermal properties of granitic rocks—A review. Int. J. Rock Mech. Min. Sci. Geomech. Abstr. 1983, 20, 3–10. [Google Scholar] [CrossRef]
  14. Fan, L.F.; Wu, Z.J.; Wan, Z.; Gao, J.W. Experimental investigation of thermal effects on dynamic behavior of granite. Appl. Therm. Eng. 2017, 125, 94–103. [Google Scholar] [CrossRef]
  15. Siegesmund, S.; Sousa, L.; Knell, C. Thermal expansion of granitoids. Environ. Earth Sci. 2018, 77. [Google Scholar] [CrossRef]
  16. Shang, X.; Zhang, Z.; Xu, X.; Liu, T.; Xing, Y. Mineral Composition, Pore Structure, and Mechanical Characteristics of Pyroxene Granite Exposed to Heat Treatments. Minerals 2019, 9, 553. [Google Scholar] [CrossRef] [Green Version]
  17. Martínez-Ibáñez, V.; Garrido, M.E.; Hidalgo Signes, C.; Tomás, R. Micro and macro-structural effects of high temperatures in Prada limestone: Key factors for future fire-intervention protocols in Tres Ponts Tunnel (Spain). Constr. Build. Mater. 2021, 286, 122960. [Google Scholar] [CrossRef]
  18. Martínez-Ibáñez, V.; Garrido, M.E.; Hidalgo Signes, C.; Basco, A.; Miranda, T.; Tomás, R. Thermal Effects on the Drilling Performance of a Limestone: Relationships with Physical and Mechanical Properties. Appl. Sci. 2021, 11, 3286. [Google Scholar] [CrossRef]
  19. Martínez-Ibáñez, V.; Benavente, D.; Hidalgo, S.C.; Tomás, R.; Garrido, M.E. Temperature-Induced Explosive Behaviour and Thermo-Chemical Damage on Pyrite-Bearing Limestones: Causes and Mechanisms. Rock Mech. Rock Eng. 2021, 54, 219–234. [Google Scholar] [CrossRef]
  20. Isaka, B.; Gamage, R.; Rathnaweera, T.; Perera, M.; Chandrasekharam, D.; Kumari, W. An Influence of Thermally-Induced Micro-Cracking under Cooling Treatments: Mechanical Characteristics of Australian Granite. Energies 2018, 11, 1338. [Google Scholar] [CrossRef] [Green Version]
  21. Gomez-Heras, M.; Bernard, J.S.; Fort, R. Influence of surface heterogeneities of building granite on its thermal response and its potential for the generation of thermoclasty. Environ. Geol. 2008, 56, 547–560. [Google Scholar] [CrossRef]
  22. Shao, S.; Wasantha, P.L.P.P.G.; Chen, R.B.K. Effect of cooling rate on the mechanical behavior of heated Strathbogie granite with different grain sizes. Int. J. Rock Mech. Min. Sci. 2014, 70, 381–387. [Google Scholar] [CrossRef]
  23. Freire-Lista, D.; Gomez-Villalba, L.; Fort, R. Microcracking of granite feldspar during thermal artificial processes. Period. Mineral. 2015, 84, 519–537. [Google Scholar] [CrossRef]
  24. Freire-Lista, D.M.; Fort, R.; Varas-Muriel, M.J. Thermal stress-induced microcracking in building granite. Eng. Geol. 2016, 206, 83–93. [Google Scholar] [CrossRef] [Green Version]
  25. Vázquez, P.; Shushakova, V.; Gómez-Heras, M. Influence of mineralogy on granite decay induced by temperature increase: Experimental observations and stress simulation. Eng. Geol. 2015, 189, 58–67. [Google Scholar] [CrossRef]
  26. Přikryl, R. Some microstructural aspects of strength variation in rocks. Int. J. Rock Mech. Min. Sci. 2001, 38, 671–682. [Google Scholar] [CrossRef]
  27. Forestieri, G.; Freire-Lista, D.; Francesco, A.; Fort, R.; Ponte, M. Strength anisotropy in building granites. Int. J. Archit. Herit. 2017. [Google Scholar] [CrossRef]
  28. NEA. Interim Report on Fire Risk Management. Radioactive Waste Management, NEA/RWM/R(2015)6. Nuclear Energy Agency. 2015, p. 32. Available online: https://www.oecd-nea.org/jcms/pl_55414/interim-report-on-fire-risk-management?details=true (accessed on 15 September 2021).
  29. MBFSZ Mining and Geological Survey of Hungary. Geological Base Sections of Hungary on the 1:100.000 Scale Surface Geology Base Map of Hungary. Mining and Geological Survey of Hungary: Budapest, Hungary. 2021. Available online: https://map.mbfsz.gov.hu/fdt_alapszelvenyek/ (accessed on 15 September 2021).
  30. Maros Gy Borsody, J.; Füri, J.; Koroknai, B.; Palotás, K.; Rálischné, F.E. A Mórágyi-rög ÉK-i Részének Szerkezetföldtani Ertékelése a Töréses Szerkezetekre; Magyar Állami Földtani Intézet: Budapest, Hungary, 2011; [Structural Geological Evaluation of the North-Eastern Part of the Mórágyi Block for Fractured Structures]; Magyar Állami Földtani Intézet: Budapest, Hungary, 2009; pp. 338–359. (In Hungarian) [Google Scholar]
  31. Peregi, Z.; Gulácsi, Z. Mórágyi Gránit Formáció, alsó-karbon. (in Hungarian, translated title: Mórágy Granite Formation, Lower Carboniferous). In Geology of the North-Eastern Part of the Mórágy Block: Explanatory Notes to the Geological Map-Series of the North-Eastern Part of the Mórágy Block (1:10 000); Balla, Z., Gyalog, L., Eds.; Magyar Állami Földtani Intézet: Budapest, Hungary, 2009; Chapter 3.1.1.3; pp. 338–359. [Google Scholar]
  32. Király, E.; Gulácsi, Z. Mórágyi Gránit Formáció, alsó-karbon (in Hungarian, translated title: Mórágy Granite Formation, Lower Carboniferous). In Geology of the North-Eastern Part of the Mórágy Block: Explanatory Notes to the Geological Map-Series of the North-Eastern Part of the Mórágy Block (1:10 000); Balla, Z., Gyalog, L., Eds.; Magyar Állami Földtani Intézet: Budapest, Hungary, 2009; Chapter 3.1.1.3; pp. 386–445, In Hungarian: A Mórágyi-rög északkeleti részének földtana. Magyarázó a Mórágyi-rög ÉK-i részének földtani térképsorozatához (1:10 000). [Google Scholar]
  33. Gulácsi, Z.; Király, E. Alsó-karbon, Mórágyi Gránit Formáció. In Geology of the North-Eastern Part of the Mórágy Block: Explanatory Notes to the Geological Map-Series of the North-Eastern Part of the Mórágy Block (1:10 000); Balla, Z., Gyalog, L., Eds.; Magyar Állami Földtani Intézet: Budapest, Hungary, 2009; Volume 15–17, 58–68, In Hungarian: A Mórágyi-rög északkeleti részének földtana. Magyarázó a Mórágyi-rög ÉK-i részének földtani térképsorozatához (1:10 000). [Google Scholar]
  34. Szebényi, G.; Török, P.; András, E.; Szamos, I.; Gyalog, L.; Borsody, J.; Füri, J.; Gulácsi, Z.; Maros, G.; Deák, F.; et al. Az NRHT I-K1 és I-K2 Tárolókamra Kivitelezés Vágatdokumentációs Zelentése; (in Hungarian, translatated title: Section documentation report for the NRHT I-K1 and I-K2 storage chamber construction). Mecsekérc Zrt., RHK Kft. Irattár, RHK-K-075/11; RHK Kft.: Budaörs, Hungary, 2011; pp. 109–162. [Google Scholar]
  35. Annerel, E.; Taerwe, L. Methods to quantify the color development of concrete exposed to fire. Constr. Build. Mater. 2011, 25, 3989–3997. [Google Scholar] [CrossRef]
  36. Short, N.R.; Purkiss, J.A.; Guise, S.E. Assessment of fire damaged concrete using color image analysis. Constr. Build. Mater. 2001, 15, 9–15. [Google Scholar] [CrossRef]
  37. MacAdam, D.L. Color-Matching Functions. In Color. Measurement, Springer Series in Optical Sciences; Springer: Berlin/Heidelberg, Germany, 1981; Volume 27. [Google Scholar] [CrossRef]
  38. Hunt, R.W. Measuring Color, 3rd ed.; Fountain Press: Kingston-upon-Thames, UK, 1998; Volume 493, pp. 33–38. [Google Scholar]
  39. Carter, E.C.; Ohno, Y.; Pointer, M.R.; Robertson, A.R.; Seve, R.; Schanda, J.D.; Witt, K. CIE 15: Technical Report: Colorimetry, 3rd ed.; International Commission on Illumination: Vienna, Austria, 2004. [Google Scholar]
  40. Wyszecki, G.; Stiles, W.S. Color Science: Concepts and Methods, Quantitative Data and Formulae; Wiley-Interscience: Hoboken, NJ, USA, 2000. [Google Scholar] [CrossRef]
  41. ISO 11664-4:2008(E)/CIE S 014-4/E:2007. Superseded by CIE Colorimetry-Part 4: 1976 L*a*b* Color Space, 2nd ed.; CIE Central Bureau: Vienna, Austria, 2007. [Google Scholar]
  42. Schwiegerling, J. Field Guide to Visual and Ophthalmic Optics, Volume: FG04; SPIE Press: Bellingham, WA, USA, 2004; Volume 124. [Google Scholar] [CrossRef] [Green Version]
  43. EN 1936:2006. Natural Stone Test Methods. Determination of Real Density and Apparent Density, and of Total and Open Porosity. Available online: https://cdn.standards.iteh.ai/samples/25272/d65343542525484cbe5d0f3c0e776345/SIST-EN-1936-2007.pdf (accessed on 20 September 2021).
  44. EN 14579:2005-01-17. Natural Stone Test Methods-Determination of Sound Speed Propagation. Available online: https://cdn.standards.iteh.ai/samples/11489/020e8caa1e6b4acaba88f15af259ef55/SIST-EN-14579-2004.pdf (accessed on 20 September 2021).
  45. Török, Á. Surface strength and mineralogy of weathering crusts on limestone buildings in Budapest. Build. Environ. 2003, 38, 1185–1192. [Google Scholar] [CrossRef]
  46. Török, Á. In Situ Methods of Testing Stone Monuments and the Application of Nondestructive Physical Properties Testing in Masonry Diagnosis. In Materials, Technologies and Practice in Historic Heritage Structures; Dan, M.B., Přikryl, R., Török, Á., Eds.; Springer: Dordrecht, The Netherlands, 2010. [Google Scholar] [CrossRef]
  47. Török, Á. Non-destructive Surface Strength Test—Duroskop a Forgotten Tool; Comparison to Schmidt Hammer Rebound Values of Rocks. In Proceedings of the IAEG/AEG Annual Meeting, San Francisco, CA, USA, 17–21 September 2018; Volume 6, pp. 129–135. [Google Scholar] [CrossRef]
  48. Beck, K.; Janvier-Badosa, S.; Brunetaud, X.; Török, Á.; Al-Mukhtar, M. Non-destructive diagnosis by colorimetry of building stone subjected to high temperatures. Eur. J. Environ. Civ. Eng. 2016, 20, 643–655. [Google Scholar] [CrossRef]
  49. Hager, I. Color Change in Heated Concrete. Fire Technol. 2014, 50, 945–958. [Google Scholar] [CrossRef] [Green Version]
  50. Ozguven, A.; Ozcelik, Y. Investigation of some property changes of natural building stones exposed to fire and high heat. Constr. Build. Mater. 2013, 38, 813–821. [Google Scholar] [CrossRef]
  51. Gomez-Heras, M.; Figueiredo, C.; Varas-Muriel, M.; Maurício, A.; Alvarez de Buergo, M.; Aires-Barros, L.; Fort, R. Digital Image Analysis Contribution to the Evaluation of the Mechanical Decay of Granitic Stones Affected by Fire. In Fracture Failure of Natural Buildings Stones; Kourkoulis, S.K., Ed.; Springer: Dordrecht, The Netherlands, 2006. [Google Scholar] [CrossRef]
  52. Chakrabarti, B.; Yates, T.; Lewry, A. Effect of fire damage on natural stonework in buildings. Constr. Build. Mater. 1996, 10, 539–544. [Google Scholar] [CrossRef]
  53. Yang, S.; Ranjith, P.; Jing, H.; Tian, W.; Ju, Y. An experimental investigation on thermal damage and failure mechanical behavior of granite after exposure to different high-temperature treatments. Geothermics 2017, 65, 180–197. [Google Scholar] [CrossRef]
  54. Zhu, Z.; Ranjith, P.G.; Tian, H.; Jiang, G.; Dou, B.; Mei, G. Relationships between P-wave velocity and mechanical properties of granite after exposure to different cyclic heating and water-cooling treatments. Renew. Energy 2021, 168, 375–392. [Google Scholar] [CrossRef]
  55. Török, A.; Török, Á. The effect of temperature on the strength of two different granites. Cent. Eur. Geol. 2015, 58, 356–369. [Google Scholar] [CrossRef] [Green Version]
  56. Liu, S.; Xu, J. An experimental study on the physico-mechanical properties of two post-high-temperature rocks. Eng. Geol. 2015, 185, 63–70. [Google Scholar] [CrossRef]
  57. Jin, P.; Hu, Y.; Shao, J.; Zhao, G.; Zhu, X.; Li, C. Influence of different thermal cycling treatments on the physical, mechanical and transport properties of granite. Geothermics 2019, 78, 118–128. [Google Scholar] [CrossRef]
  58. Wang, F.; Frühwirt, T.; Konietzky, H. Influence of repeated heating on physical-mechanical properties and damage evolution of granite. Int. J. Rock Mech. Min. Sci. 2020, 136, 104514. [Google Scholar] [CrossRef]
  59. Németh, A.; Török, Á. Thermal shock-induced physical changes of granitic rocks of a radioactive waste disposal site. In Proceedings of the IOP Conference Series: Earth and Environmental Science, Mechanics and Rock Engineering, from Theory to Practice, Turin, Italy, 20–25 September 2021; Volume 833, p. 12035. [Google Scholar] [CrossRef]
  60. Németh, A.; Török, Á. Heat-related Changes of Density, P-wave Velocity, and Surface Hardness of Granite. Period. Polytech. Civ. Eng. 2021, 7. [Google Scholar] [CrossRef]
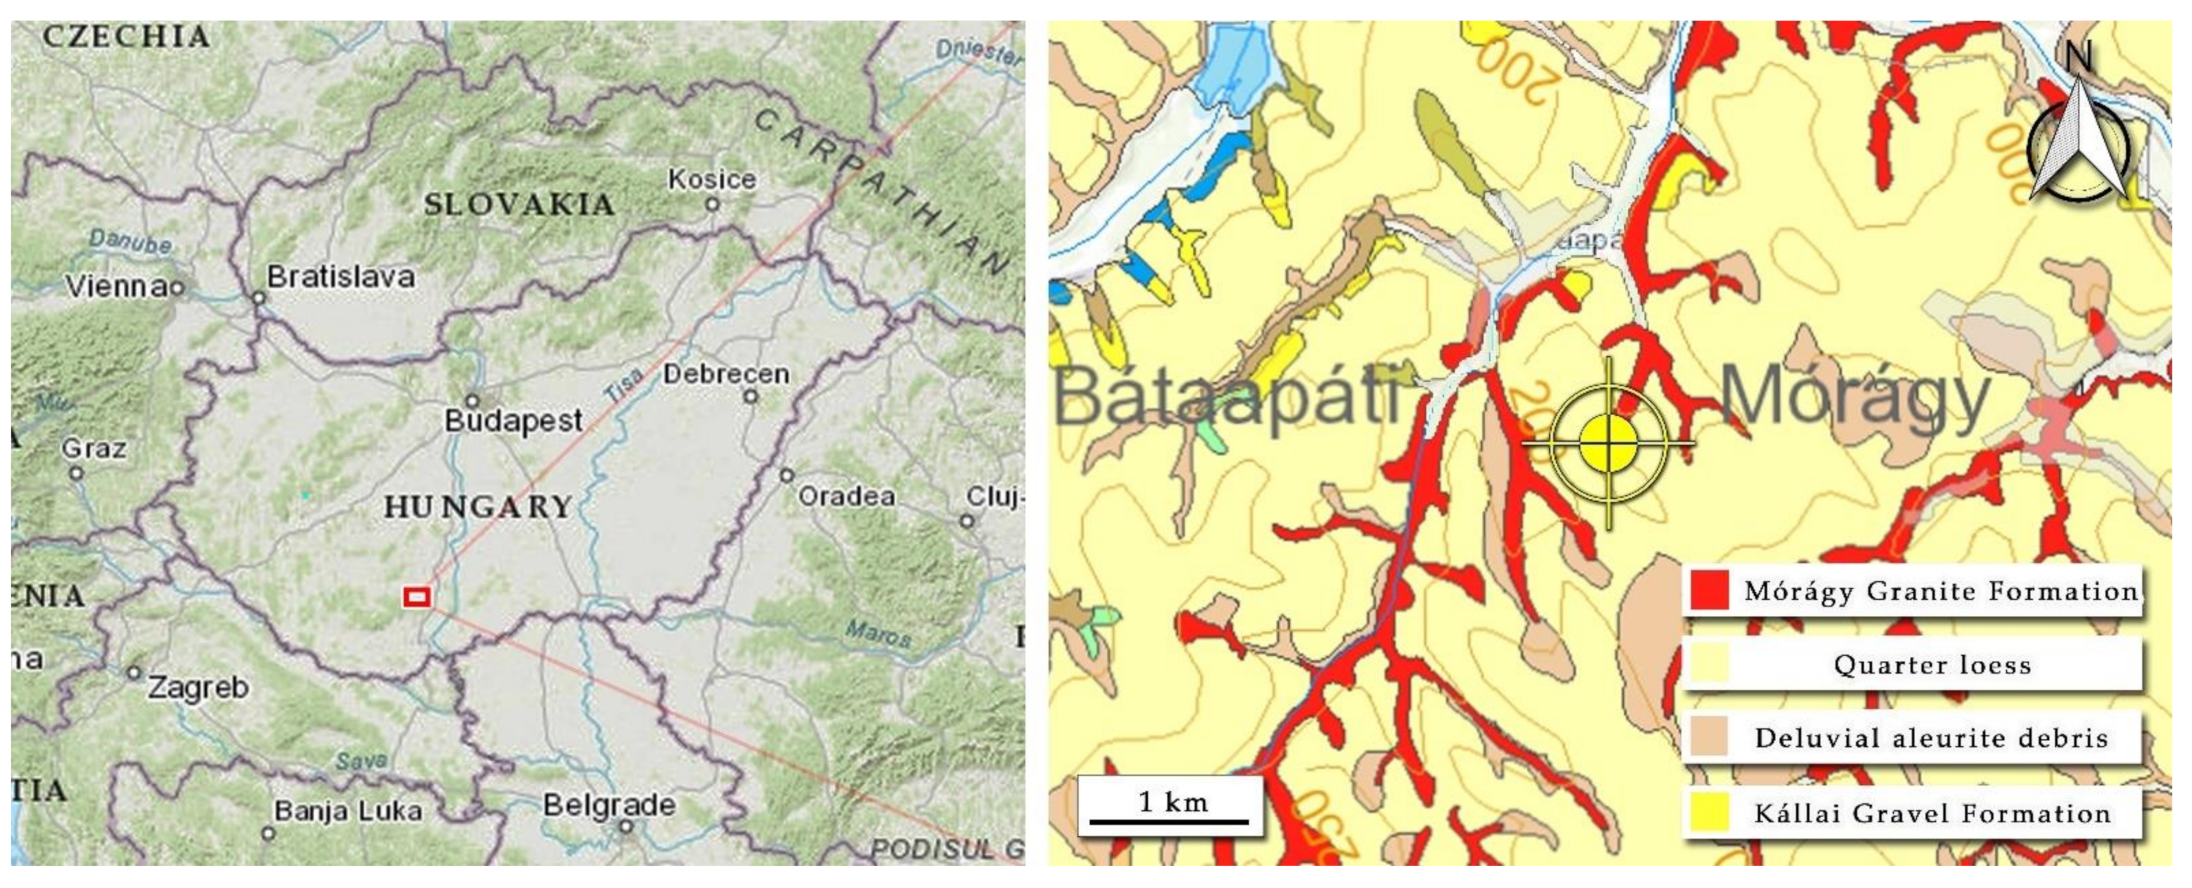
Figure 1. The location of the Bátaapáti Nuclear Waste Repository site in Hungary (left). Surface geological environment of the area of the repository (right) [29].
Applsci 11 08792 g001
Figure 2. Cylindrical samples are showing color changes from 22 °C, 250 °C, 500 °C, and 750 °C. Note the macro cracks in sample 750 °C.
Applsci 11 08792 g002
Figure 3. Texture and color change of heat-treated granite specimens. Samples representing the same temperature are shown in rows. Sample ID-s from left to right increase from 1 to 6.
Applsci 11 08792 g003
Figure 4. Spectral reflectance of the reference sample and heat-treated samples.
Applsci 11 08792 g004
Figure 5. Colorimetric characteristics of granite samples at 22 °C/250 °C/500 °C/750 °C in the CIE L*a*b*system. L represents lightness (white to black), ‘a’ shows colors from red to green, while ‘b’ stands for yellow to blue (left). Red to green (a*) and yellow to blue (b*) color alteration of granite samples at 22 °C/250 °C/500 °C/750 °C (right).
Applsci 11 08792 g005
Figure 6. Box Plot diagrams of CIE L*a*b* color space values (L*—Lightness, a*—Red/Green value, b*—Blue/Yellow value) as a function of temperature.
Applsci 11 08792 g006
Figure 7. Histogram of bulk density values.
Applsci 11 08792 g007
Figure 8. Overview images of a (22 °C) room temperature (left) and a heat-treated (750 °C) sample (middle). Examine the crack development on the magnified surface of the 750 °C heat-treated specimen (right).
Applsci 11 08792 g008
Figure 9. Scatter plot of bulk density values of heat-treated granite samples of this paper compared to previous works.
Applsci 11 08792 g009
Figure 10. Histogram of Duroskop rebound values, the surface hardness of specimens.
Applsci 11 08792 g010
Figure 11. Relative frequency histograms of measured ultrasound velocity properties among heat-treated groups: Histogram of P-wave velocity (PUNDIT device) values (left). Histogram of P-wave velocity (GEOTRON device) values (middle). Histogram of S-wave velocity (GEOTRON device) values (right).
Applsci 11 08792 g011
Figure 12. Scatter plots of different ultrasound velocities among heat-treated groups. Scatter plot of P-wave velocity values between PUNDIT and GEOTRON devices (left). Scatter plot of P-wave and S-wave velocity (GEOTRON device) values (right).
Applsci 11 08792 g012
Figure 13. Comparison of P-wave velocity values of heat-treated granite samples in the literature and this paper.
Applsci 11 08792 g013
Figure 14. Scatter plot of Duroskop value vs. P-wave velocity.
Applsci 11 08792 g014
Figure 15. Bar plot of mass-, volume-, bulk density-, P-wave velocity (PUNDIT), P-wave velocity (GEOTRON) between groups, S-wave velocity (GEOTRON) between groups and Duroskop percental changes between untreated room temperature and heat-treated values.
Applsci 11 08792 g015
Figure 16. 3D scatter plot of bulk density-, P-wave velocity- and Duroskop value percental changes (left). 2D class scatter of P-wave velocity- and Duroskop value percental changes (A). 2D class scatter of P-wave velocity- and bulk density value percental changes (B). 2D class scatter of Duroskop value and bulk density percental changes (C).
Applsci 11 08792 g016
Table 1. Carried out measurements with test numbers and used standards.
GroupBulk
Density
P-Wave Vel.
(PUNDIT)
P-Wave Vel.
(GEOTRON)
S-Wave Vel.
(GEOTRON)
Duroskop Value Color Index
[EN 1936:2007][EN 14579:2005][-][-]
22 °C67236367220
250 °C12144363614320
500 °C1278363614420
750 °C121440014420
4243810810850380
Table 2. CIE L*a*b* colorimetric data of granite samples at 22 °C and 250 °C, 500 °C, 750 °C of heat-treatment.
Thermal Treatment GroupL*a*b*
(Std)(Std)(Std)
22 °C53.96 (4.10)4.19 (0.32)1.96 (0.74)
250 °C55.88 (3.93)4.45 (0.27)3.03 (1.23)
500 °C62.05 (4.60)7.85 (1.36)11.30 (2.94)
750 °C62.92 (3.82)7.94 (0.33)9.40 (0.86)
Table 3. Bulk density, Duroskop rebound value, P-wave velocity (PUNDIT and GEOTRON), and S-wave velocity (GEOTRON) results in heat-treated groups.
Thermal Treatment
Group
Bulk
Density
(Std)
Duroskop
Value
(Std)
P-Wave Vel.
[PUNDIT]
(Std)
P-Wave Vel.
[GEOTRON]
(Std)
S-Wave Vel.
[GEOTRON]
(Std)
(kg/m3)(-)(km/s)(km/s)(km/s)
22 °C2716.0 (23.6)51 (1.5)5.29 (0.24)5.28 (0.32)3.23 (0.22)
250 °C2678.1 (34.0)49 (1.7)4.49 (0.15)4.56 (0.18)3.00 (0.12)
500 °C2694.7 (27.1)47 (2.4)3.32 (0.19)3.39 (0.12)2.40 (0.15)
750 °C2493.3 (125.0)19 (5.7)0.76 (0.23)--
Publisher’s Note: MDPI stays neutral with regard to jurisdictional claims in published maps and institutional affiliations.