1. Introduction
The recent COVID-19 outbreak has spread worldwide in 237 countries, areas, and territories as of 18 August 2020 [
1]. Global stock market linkages have displayed clear distinct patterns before and after the pandemic announcement [
2]. The pandemic initiated a stock market crash during the outbreak [
3]. There were periods of mildly explosive rises and collapses in the stock markets of 18 major countries in 2020 [
4]. The studies carried out also showed that the return on relevant indices was higher in the pre-COVID period than during COVID [
5]. The global stock market struck out about USD 6 trillion within the period of 1 week from 24 to 28 February in 2020 [
6]; In the US, the market value of Standard & Poor (S&P) 500 indexes fell to 30% of its pre-COVID market price since the COVID outbreak [
5]; in Europe, the Financial Times Stock Exchange 100 index experienced the worst day on 12 March 2020 since 1987 [
7]; additionally, evidence of significant contagion effects has been discovered from the US and China stock markets during the pandemic [
8]. In general, COVID caused a negative effect on the global stock markets [
9], but stocks in different areas acted contrastingly [
3]; the US stock market experienced positive abnormal returns from the Fed stimulus compared to other developed countries and emerging markets [
9].
Relevant information and communications technologies (ICT) such as machine learning, big data, and data visualisation have been implemented in analysing COVID data to gain insights for decision making. For example, data visualisation’s capability to generate visually appealing raw data representations makes it a valuable tool in COVID-19 data analysis [
10]. It has been utilised to analyse pandemic risk [
11] and Severe Acute Respiratory Syndrome (SARS) outbreak data [
12], but an improved visualisation of infection is required for the fast detection of patients with COVID [
13]. Big data visualisations and visual analytics tools were introduced in COVID data analytics to assist users in obtaining a better understanding of information about the confirmed cases of COVID [
14].
Some studies have explored this interaction regarding the relationship analytics between COVID and other fields such as the stock market. The relationship between COVID-19 and Local Community Features was visually analysed [
15]. Dynamic financial networks were used to assess the impacts of COVID and to compare the impacts in the previous financial crises based on correlations and partial correlations of stock returns [
16]. Big data was used to explore the initial impact of COVID-19 on the US stock market [
17]. Machine learning algorithms were also adopted to discover the relationship between COVID-19 case details and high-frequency data for 31 stock markets [
18]. A machine-learning algorithm was also applied to investigate the stock market returns–inflation nexus by controlling for the effect of the COVID pandemic in Nigeria. The results showed that COVID-19 increases volatility and distorts the positive relationship between inflation and stock market returns [
19]. A study examined the relationship between the Japanese Yen and the country’s stock returns during the COVID pandemic, and the interaction was more robust over the outbreak period (January 2020 to August 2020) compared to the pre-crisis period [
20]. A relationship analysis between independent variables and the dependent ones was studied to help manage the spread of COVID [
21]. A model was implemented to reveal the dynamics in a positive relationship between human mobility and COVID-19 infections [
22]. A finding suggested that Google/the internet caused anxiety about the COVID contagion’s effects, leading to elevated risk-aversion in stock markets [
23]. A study aimed to reveal the possible impacts of the Coronavirus epidemic on stock markets, suggesting investors to turn to derivative markets and to the stock markets of countries where the pandemic is relatively rare to avoid risk [
24]. In addition, the connections between significant events and the stock market have been learned from war, financial, and revolution perspectives [
25].
In our research, stock market indices in China were gathered for the experiment due to their importance in the global economy. China plays a vital role in the global financial system as it contributes more than 16% of global GDP industries today, and manufacturing and services now represent 93% of China’s GDP [
26]. Thus, the impact of the COVID-19 pandemic on the Chinese stock market may present a crash risk [
27]. Since 2020, due to the pandemic, China’s reduction in production and present restricted transports have slowed global economic activities [
28]. The outbreak has also led to heightened uncertainties and substantial increases in volatility in the global economy [
2,
29]. There is also statistical evidence of instability being transmitted to all other markets from the Chinese stock market [
4].
Here, one thing that needs to be noted is that the US stock seems to act individually. A study investigated the impact of COVID-19 cases and related deaths on the US stock market (Dow Jones and S&P500 indices), and it suggested that changes in the number of cases and deaths in the US and six other countries majorly affected by the COVID crisis do not have an impact on the US stock market returns, apart from the number of reported cases for China [
30]. Hence, we expected that VXFXI would behave not the same as other indices from the beginning of our research, even though it is still China-related stocks.
Additionally, we collected relevant stock market indices related to China, including CSI Smallcap 500 Index (CSI500), Shanghai Securities Composite Index (SSEC), Compositional Index of Shenzhen Stock Market (SZI), Hang Seng Index (HSI), Taiwan Weighted Index (TWII), and CBOE China ETF Volatility (VXFXI). In this article, date descriptions without the year indicate 2020; for the description of countries and regions, China refers to Mainland China; Hong Kong represents Hong Kong, China; Taiwan indicates Taiwan, China; the US indicates the United States. HSI is located in Hong Kong; TWII is in Taiwan, and VXFXI is situated in the US; all others are in China.
To the best of our knowledge, most existing studies related to the COVID outbreak and the stock market were processed by focusing on stock data analysis during the pandemic; few of them have been completed from a social perspective or provide a connection between them. This work aimed to analyse the association between COVID events and the stock market index from a noneconomic perspective, and target relationship analytics; it also addressed whether the major social events during the pandemic affected the stock market’s fluctuation, hence bridging those two sets of data and extracting deeper insights from the datasets.
Our hypotheses are as follows.
Hypothesis 1 (H1). There are connections between COVID-19-related social events and the stock market index. The stock indices may be affected by similar events.
Hypothesis 2 (H2). Relevant public health social events may affect different stock market indices to various degrees. Specifically, the influence of social events might vary based on the stock market’s geographical location.
Hypothesis 3 (H3). Authoritative announcements may play a critical role in affecting the stock market, but the impacts might be restricted according to the authority’s jurisdiction scope.
Hypothesis 4 (H4). It is possible to rank related public health social events of their effects on the stock market based on the connections between events and historical stock index’s fluctuations.
Hypothesis 5 (H5). A visual approach can help readers gain insights effectively and help stakeholders discover patterns.
The rest of this article is organised into several parts. In
Section 2, relevant data and its processing details are given; we also introduce related methods and features involved in experiments. In
Section 3, we offer visual results, as well as some overviews. We summarise statistical data and discuss issues found in
Section 4. We conclude our work and discuss potential future research in
Section 5.
2. Materials and Methods
We downloaded and collected two different types of raw data for analysis, all of which range from 1 January 2020 to 31 December 2020.
- (1)
Public Health Social Event Data
The public health social event data contain major events that occurred due to COVID-19 in China, which includes attributes such as event details, date of occurrence, place of occurrence, duration, date of the announcement, date of collection, URL online, and occurrence in public holiday; raw data were downloaded and collected from several government official websites: National Health Commission of the People’s Republic of China [
31], Wuhan Municipal Health Commission [
32], and Southern Metropolis Daily [
33]. In total, 233 data entries were collected.
- (2)
Stock Market Index Data
This type of data involves six sources: CSI500, SSEC, SZI, HSI, TWII, and VXFXI, which are key in reflecting the China stock market. Relevant attributes include Open Value, Close Value, Trade Volume, and Stock Rise and Fall. Raw data were downloaded from Investing.com until 16 August 2021 [
34]. There were 1476 data entries downloaded.
2.1. Data Processing
All raw data collected were cleansed and formatted. The workflow is as follows.
- (1)
Finalising the changing rates of stock index data every two consecutive trading days, and addressing six data sources in
Section 2.
Suppose there are two consecutive trading days,
id1 is the stock index with the closest value on the first day,
id2 is the value on the second day, and
ci represents the changing rate of the stock index of those two values accordingly; then,
- (2)
Settling the stock index value changing rate data table.
C indicates the collection of {c1, c2, …, cm, …, cn}, in which cn is the changing rate of the last two consecutive trading days in 2020, and cm stands for the median value as a result.
- (3)
Managing the inflation of the changing rate data table.
To dig into values that represent ‘significant’ differences, we defined that changing values more prominent than the median values have ‘obvious’ differences. However, for showing clear comparisons, a set of specific values of R = {r1, r2, r3, r4, r5, r6} has been defined to inflate the discrepancies, that is, we only kept the changing rate values larger than specific values for further analytics in experiments.
Say
cm1 indicates the median changing rate value of SSEC, and
r1 is the chosen inflation assessment of SSEC, then only values more significant than (
cm1 ∗ r1) are kept for analysing the relationship between the pandemic and the stock market index of SSEC. Please refer to
Table 1 for relevant
R-values, which were determined through experiments for showing the apparent discrepancy.
- (4)
Discovering the connection between COVID-19 events and stock market data.
Based on data finalised from step (3), we generated graphs that correspond to COVID-related social events and stock market shifting. Here, we used dates to build connections accordingly. We then integrated two data types from
Section 2, which involves event details, dates, and changing stock market trends from SSEC, HSI, SZI, CSI500, TWII, and VXFXI. There were 19 records kept for analysis purposes.
2.2. Methods
This subsection introduces appropriate methods, including significant stock indices, visualisation methods, similarity comparison, and this study’s procedure.
2.2.1. Feature Selection
A stock market index is a market-capitalisation-weighted average of a specific and relatively static list of securities, and it acts as an indicator of time-varying risk versus reward mechanics and as a benchmark for performance evaluation, attribution, and enhancements [
35]. Therefore, the stock market index was preferred to measure the stock market’s performance. Here, SSEC, HSI, SZI, CSI500, TWII, and VXFXI are major indices concerning the China stock market.
Moreover, we gathered relevant social events concerning COVID in China, combined with some announcements from the WHO as well, to measure their impacts on the stock market.
2.2.2. Graph Visualisation Method
In this approach, we applied line charts, bar charts, stacked bar charts, and timeline and parallel coordinates to present experimental results. The line/bar/stacked chart component is capable of displaying multiple series of data on a chart. Parallel coordinates have been widely used in multivariate data and high-dimensional geometry visualisation; it is equipped to assist in finding differences among the events’ impact [
36]. Timeline visualisation is an approach used to visualise temporal data; it provides insights into the joint work by presenting all features and relative temporal information, and it reduces crossings and overlaps of saccade lines [
37,
38,
39]. In detail, Tableau and HiPlot were adopted in experiments for visualisation purposes. Tableau is a powerful tool that has been widely used in the data analytics field due to its capability of visualising complex datasets [
40,
41]; HiPlot excels at discovering correlations and patterns in high-dimensional data using parallel coordinates [
42], which is a perfect match in this work to bring out insights of multiple facts may affect the stock market.
2.2.3. Similarity Comparison
The correlation coefficient
r is a measure of the linear relationship between two variables. The coefficient of determination
R2 is the proportion of variation of one variable (objective variable or response) explained by other variables (explanatory variables) in regression. This is a widely used measure of similarity [
43,
44]. In our study, the
R2 was employed to identify statistics (the value for
R2 ranges from 0 to 1; a higher value indicates better similarity), along with graphs’ observations, and to bring insights into the outbreak impacts on stock market indices.
2.2.4. Procedure
Based on the raw data finalised from the data processing steps, the proposed approach generated graphs from three features: date, event, and stock index’s fluctuation rate, combined with a dashboard; then, it compared the results of the reactions from six stock indices, to bring insights into the relationship within, which is to find if the social events result in the change in the stock index, and how much the index changes, etc. The steps included in the workflow of this study are shown below.
- (1)
Introducing hypotheses and collecting relevant raw data from multiple sources.
- (2)
Data filtering and formatting, such as removing data with less effects, and then formatting and importing into data files.
- (3)
Comparing visual results via data values and observation of statistics.
- (4)
Concluding data for critical events.
- (5)
Discussion of findings via observation and similarity comparison.
3. Results
The following results are presented with features such as the date of the event, event detail, and the changing stock index values. A timeline (only dates of crucial events in experiments) is applied to show connections in-between.
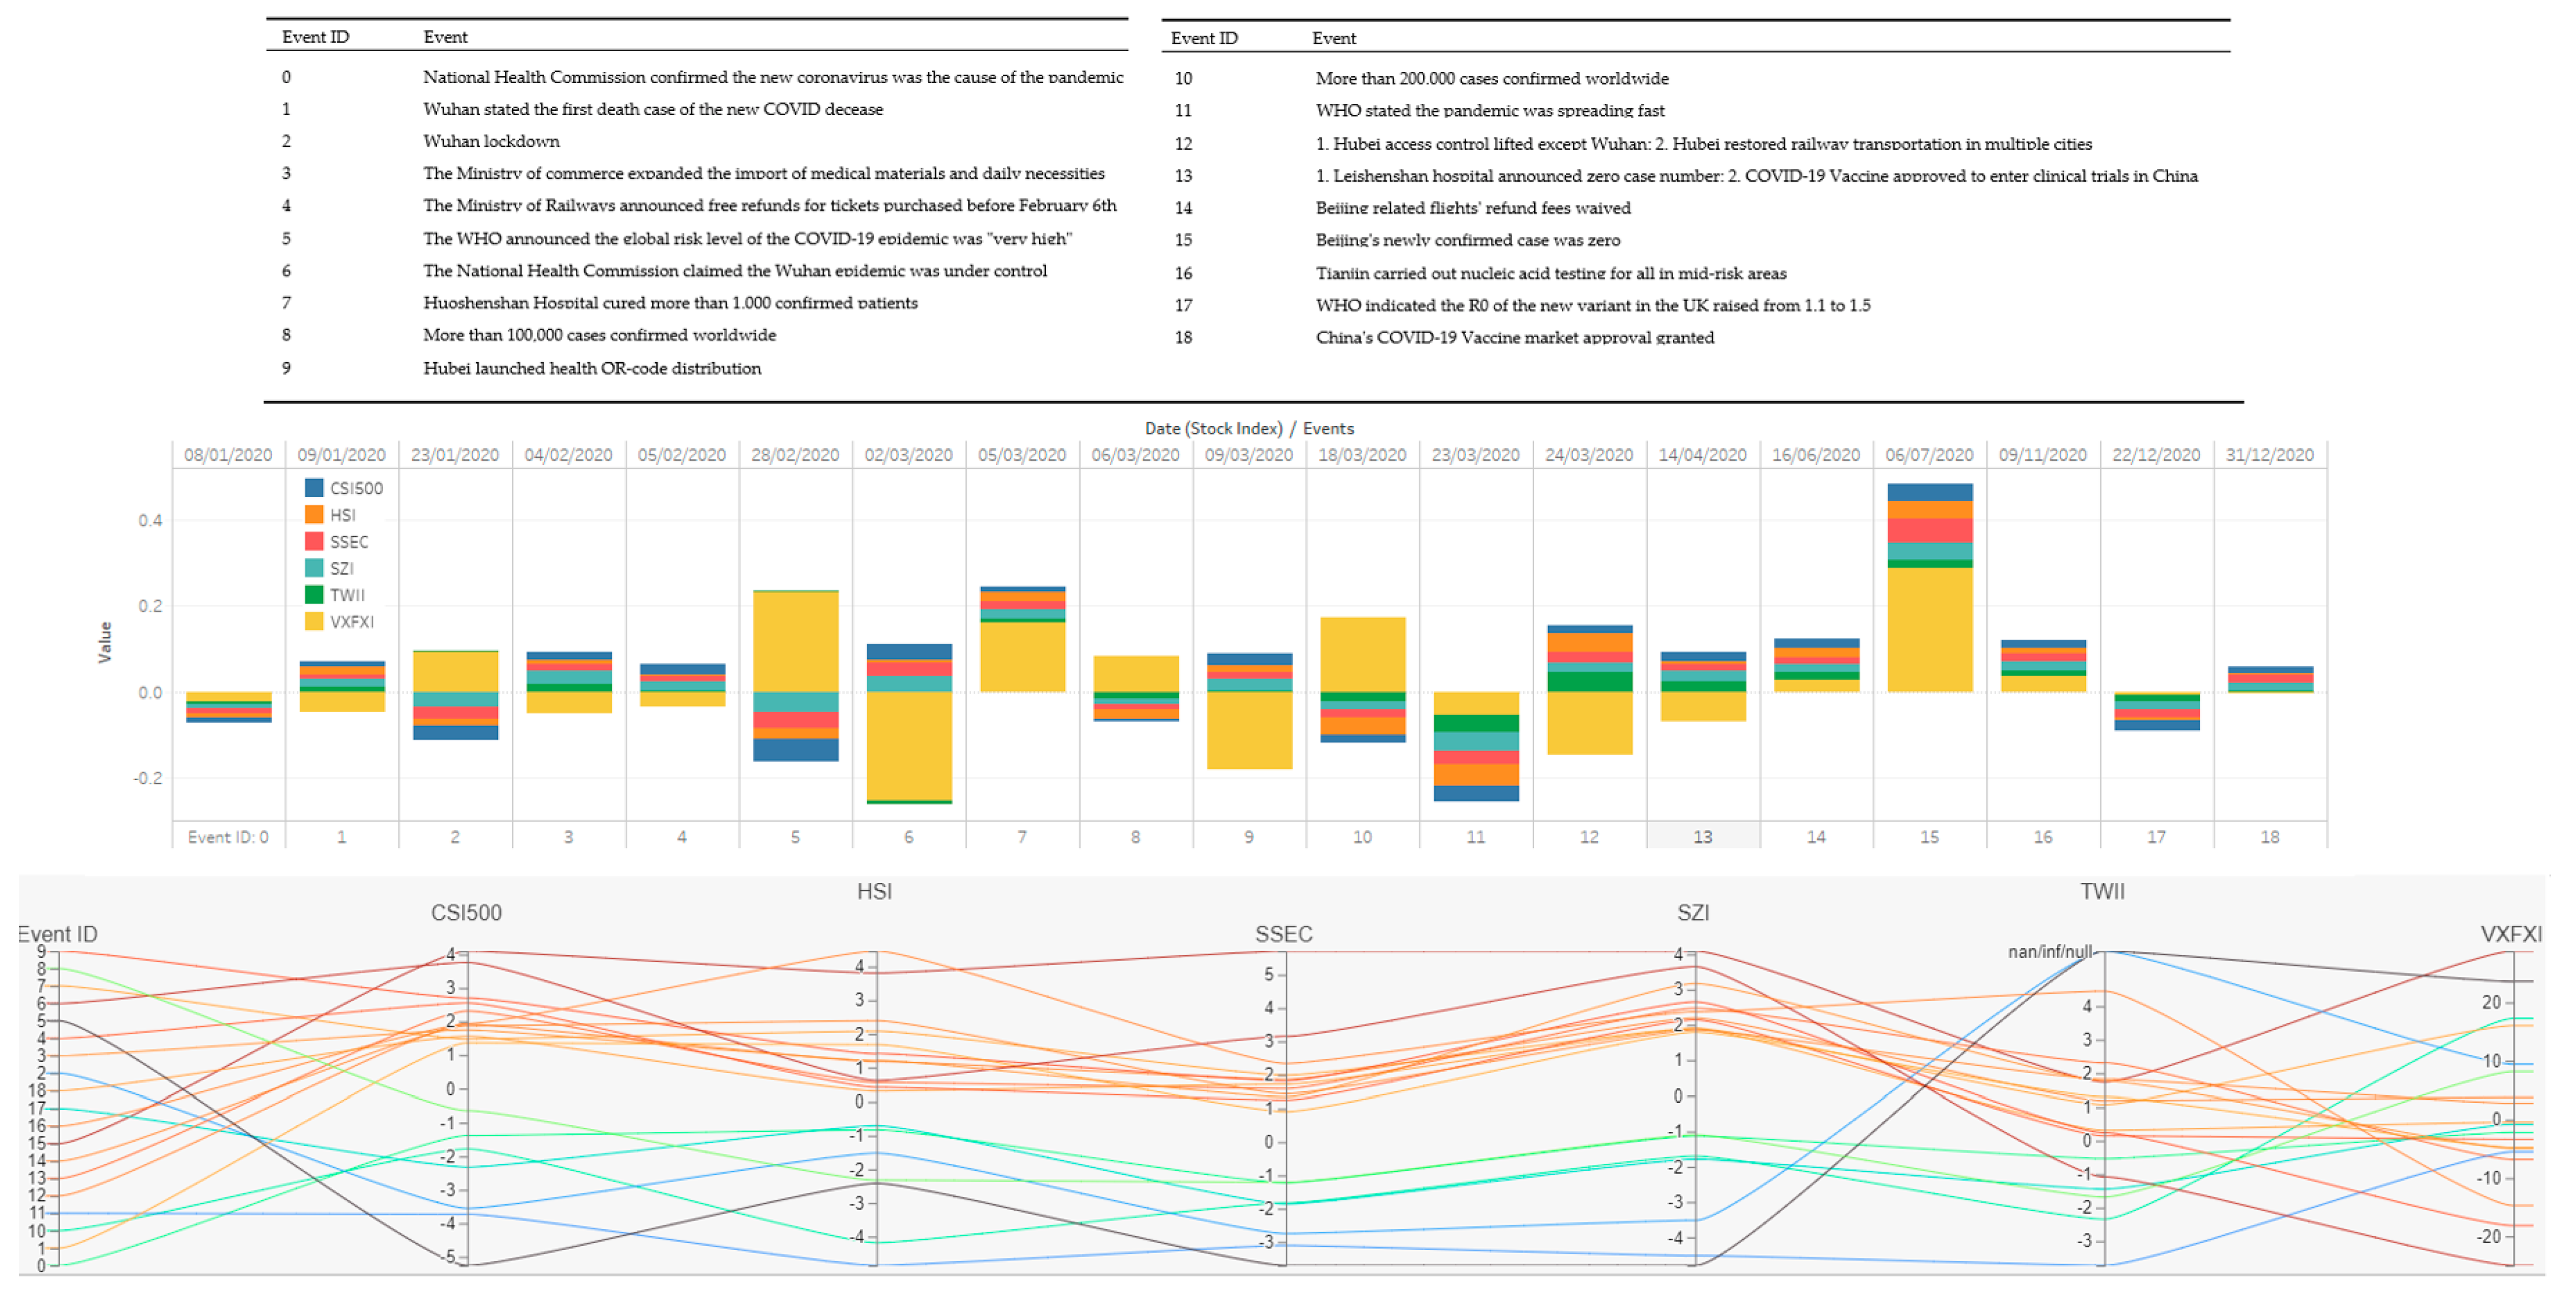
In experiments, we defined event types into two categories: positive and negative. Events such as city lockdown and more cases confirmed are negative; on the contrary, the outbreak is under control, etc. are positive. Please refer to
Table 2 for specifics. Also, the stock market index and its related major event IDs are explained in
Table 3, which reflect the most important events accordingly.
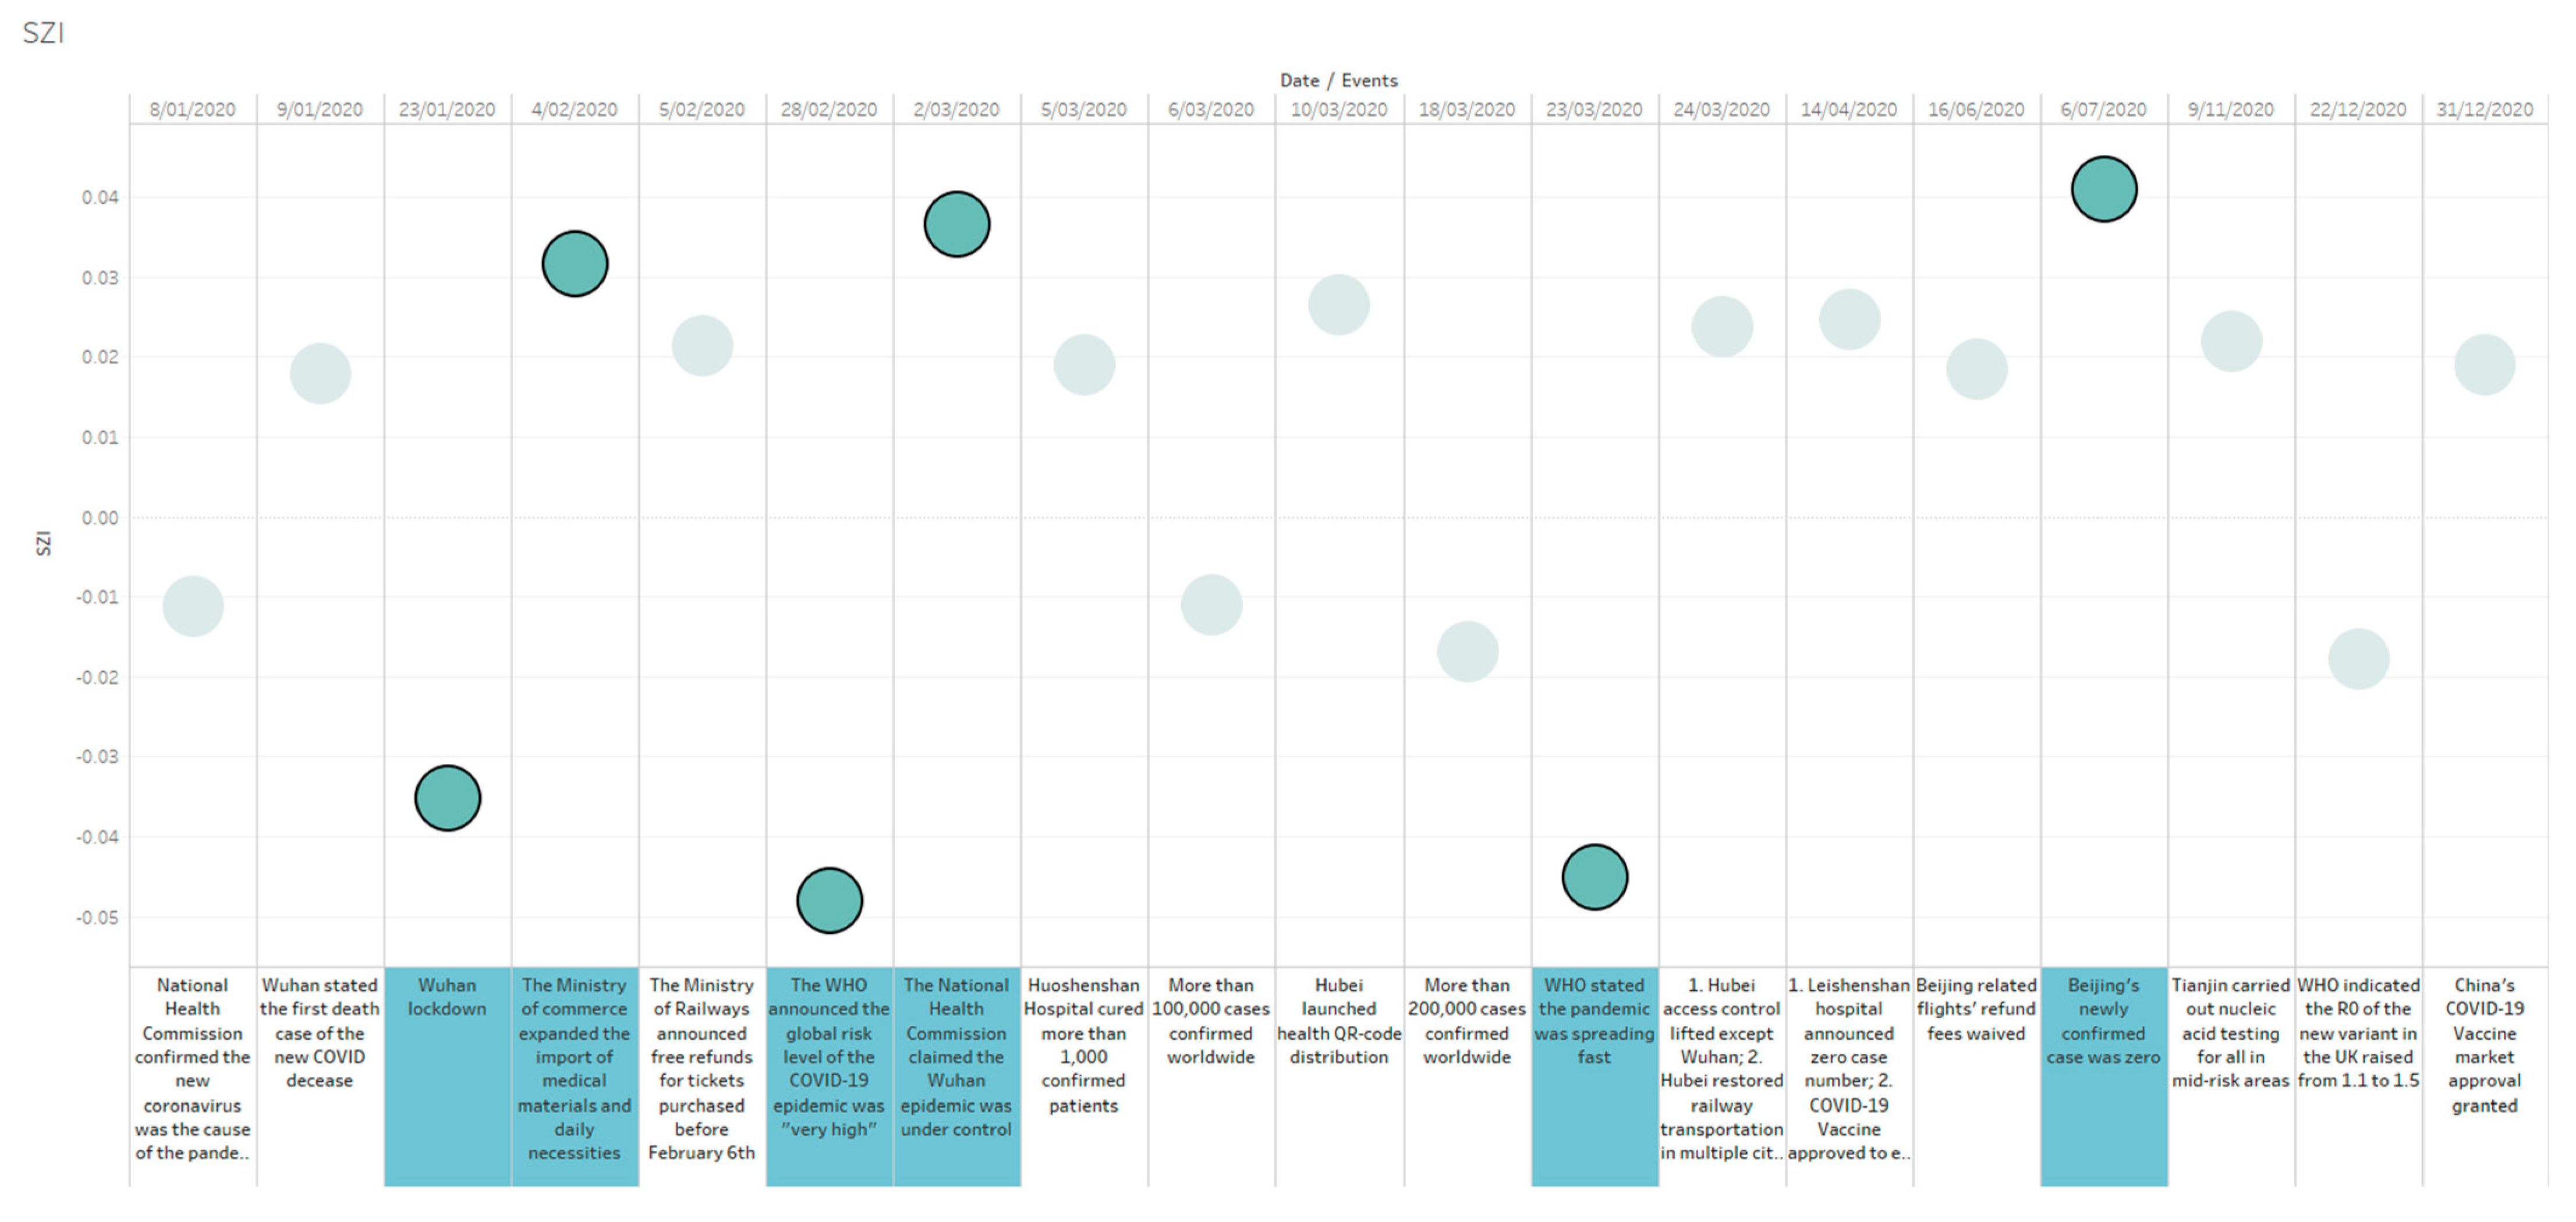
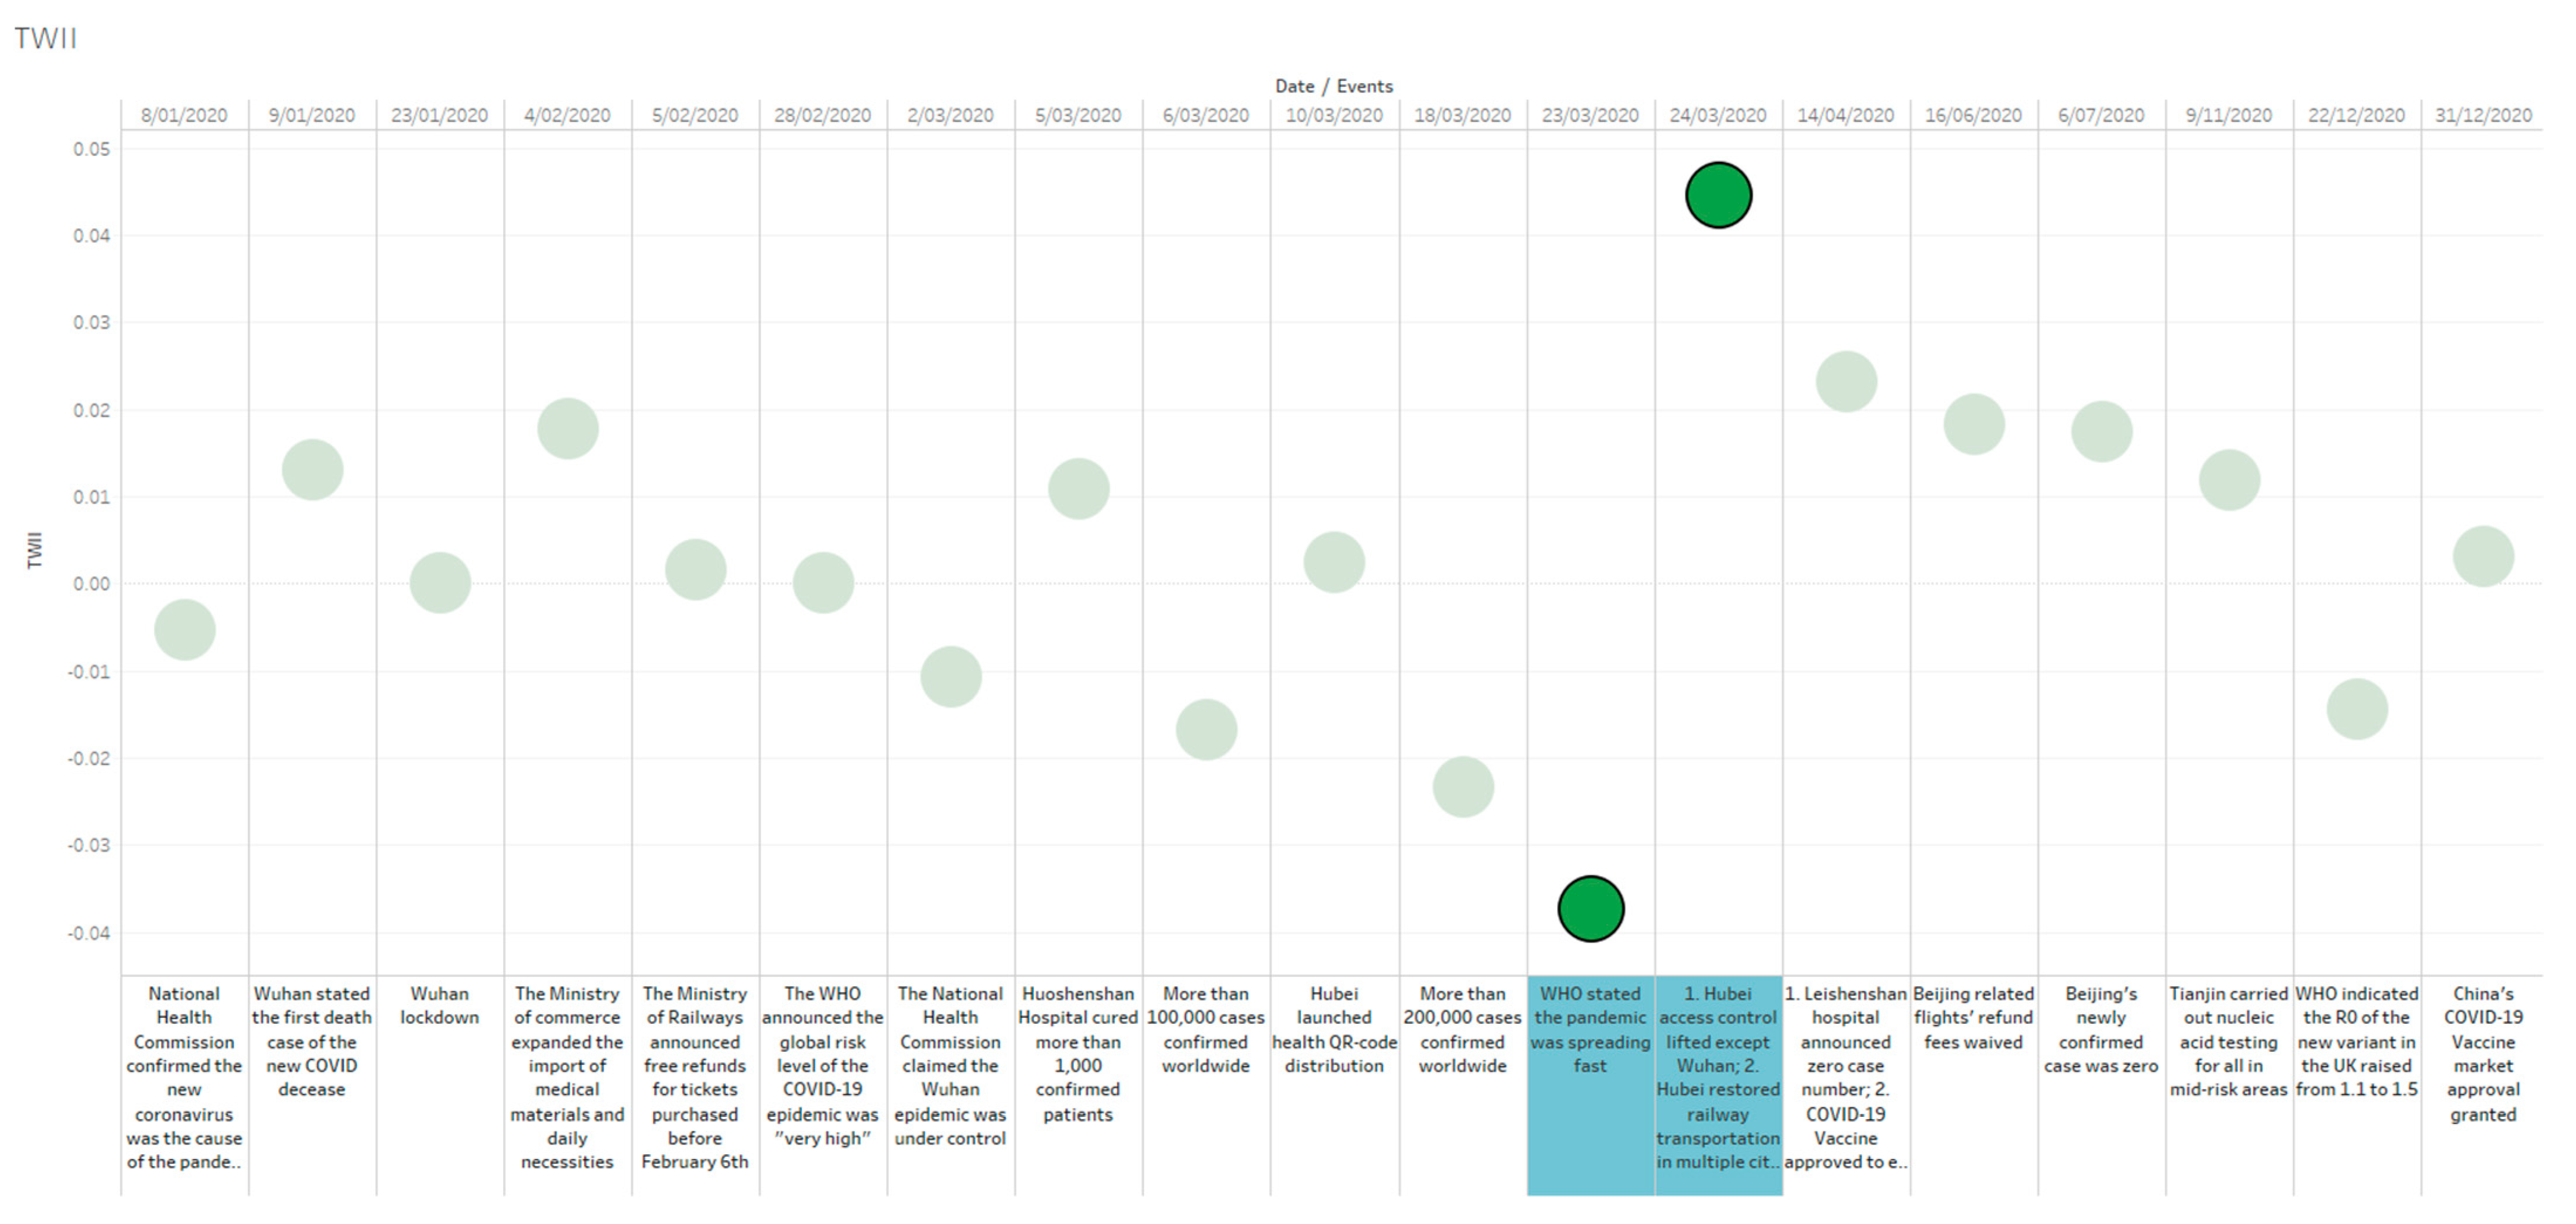
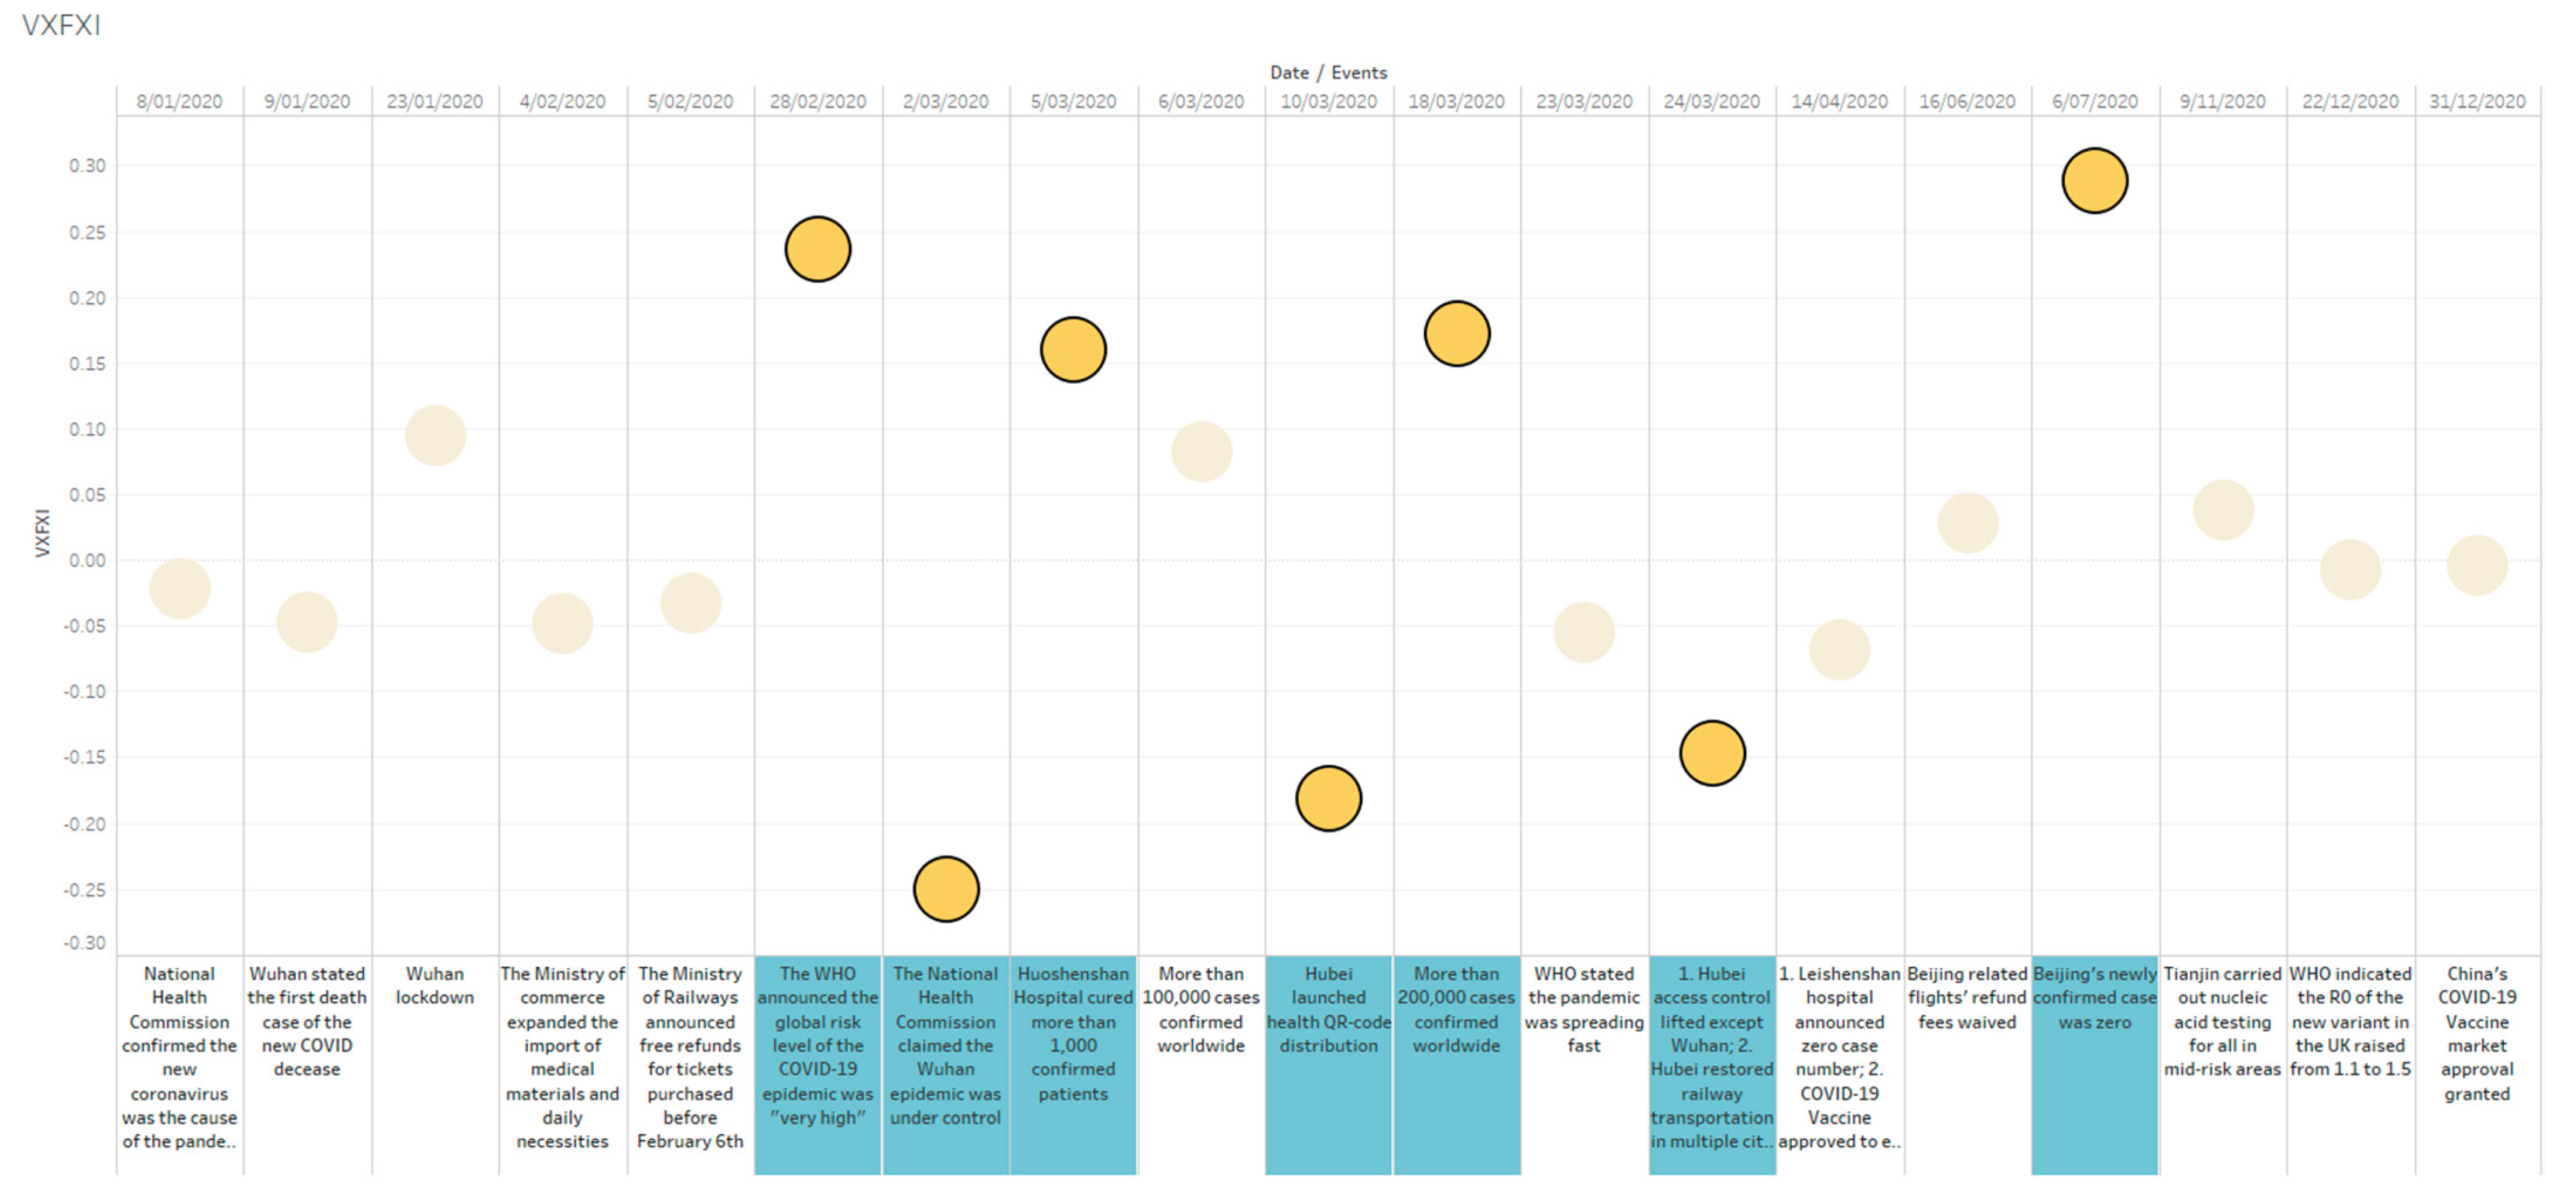
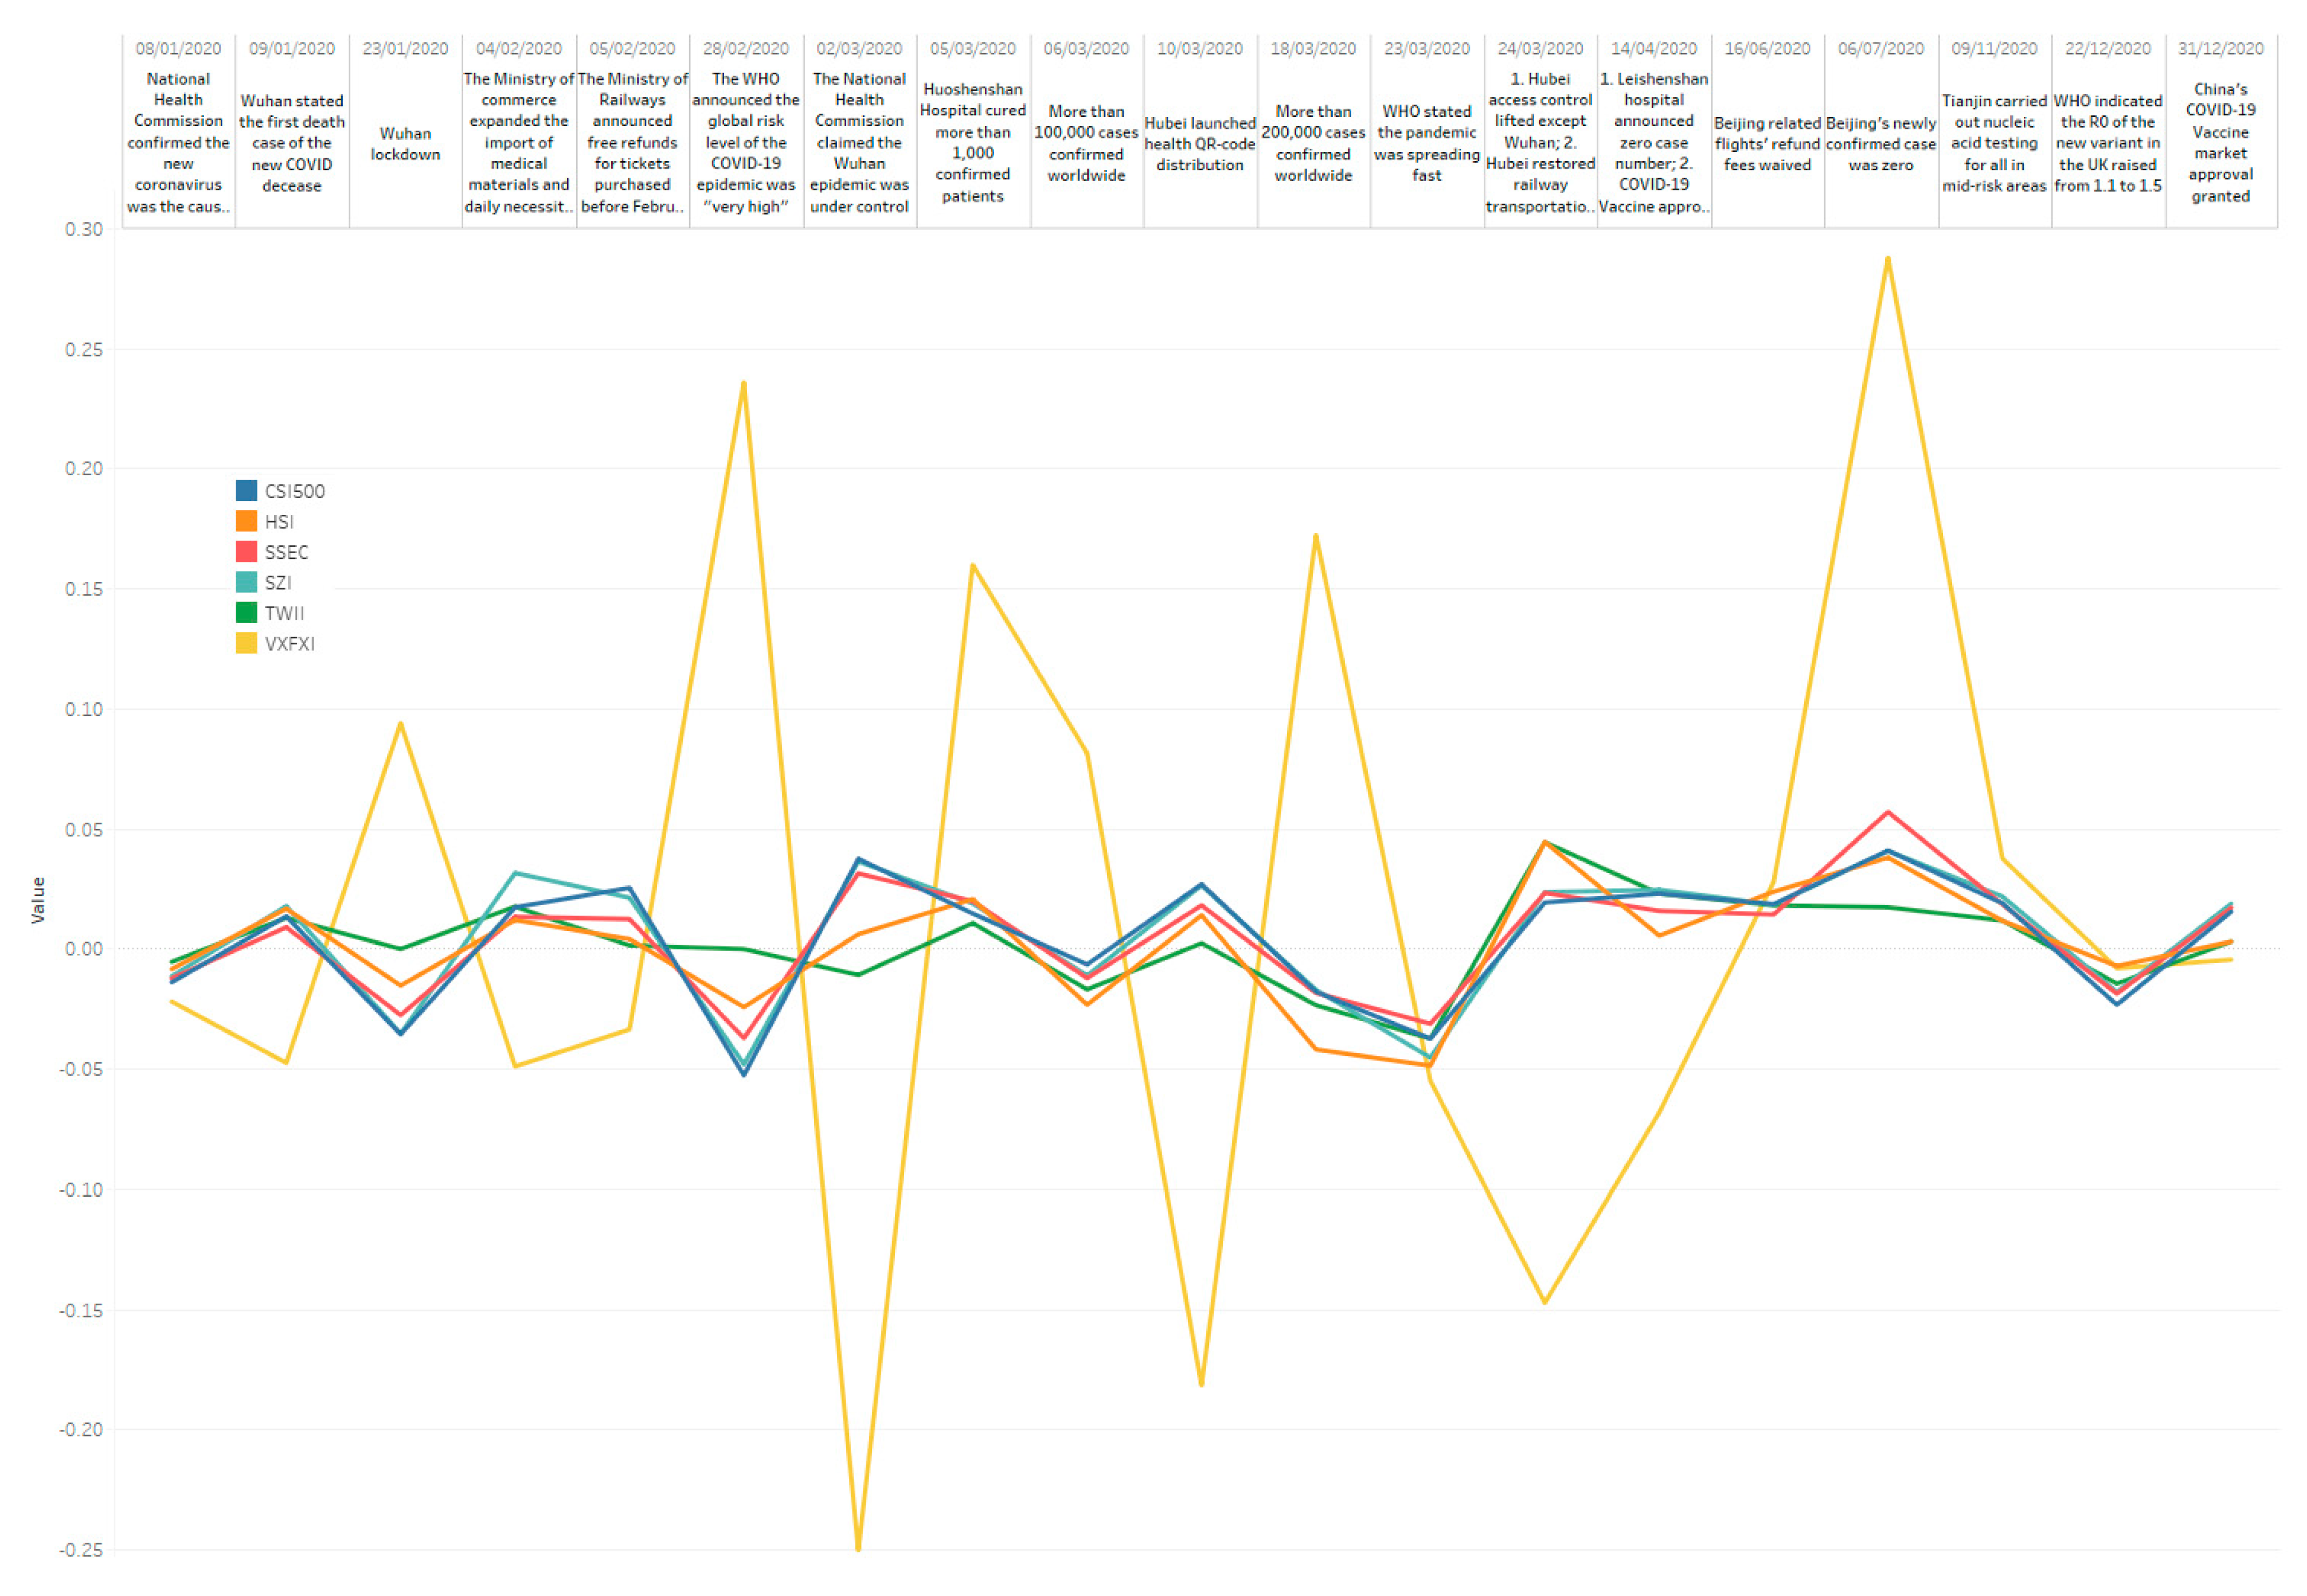
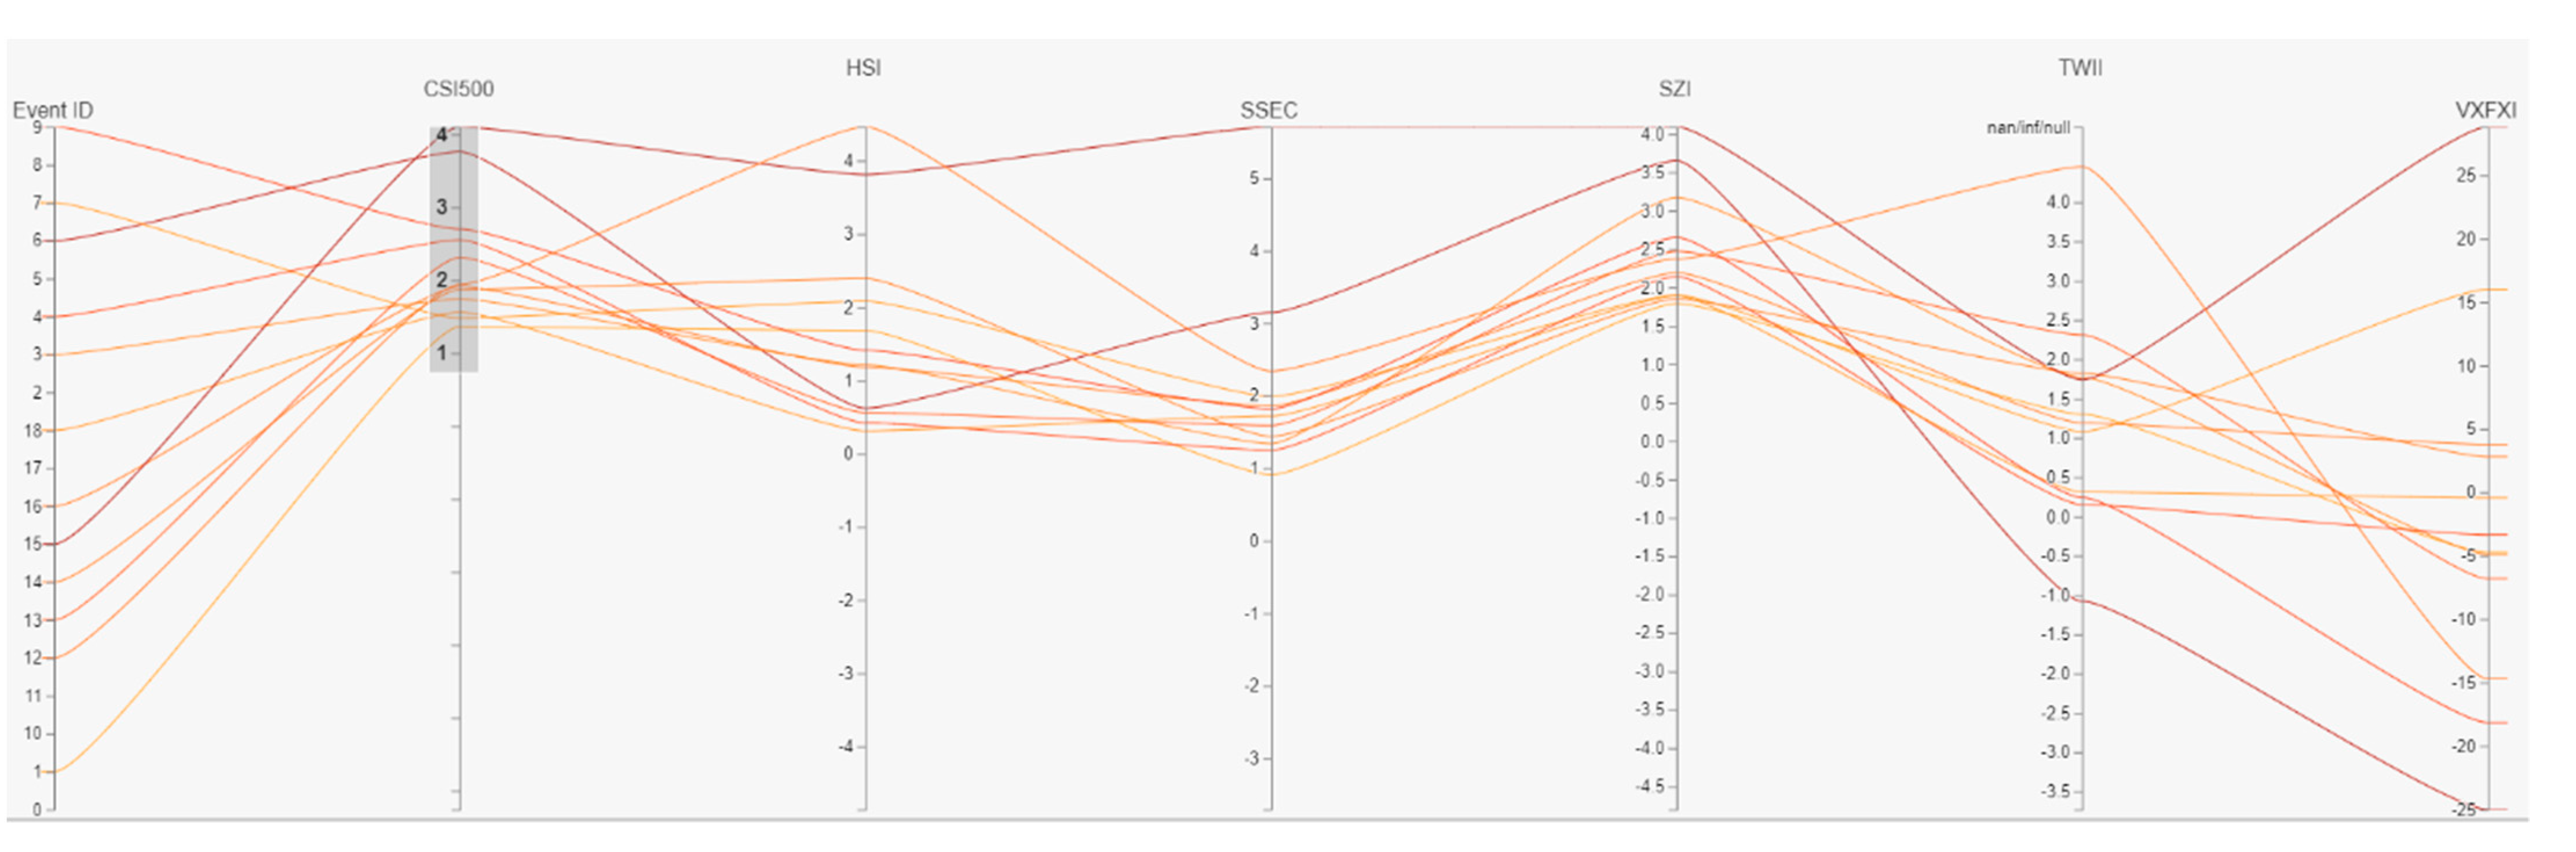
Figure 1 shows the dashboard of the key COVID-19 events and major stock market indices trends in China, and a stacked bar and a parallel coordinate chart have been applied to represent the insights, accordingly, based on a timeline of major dates of events that occurred. In
Figure 2,
Figure 3,
Figure 4,
Figure 5,
Figure 6 and
Figure 7, the trends of each stock market index are provided based on the dates of key social events from the results in
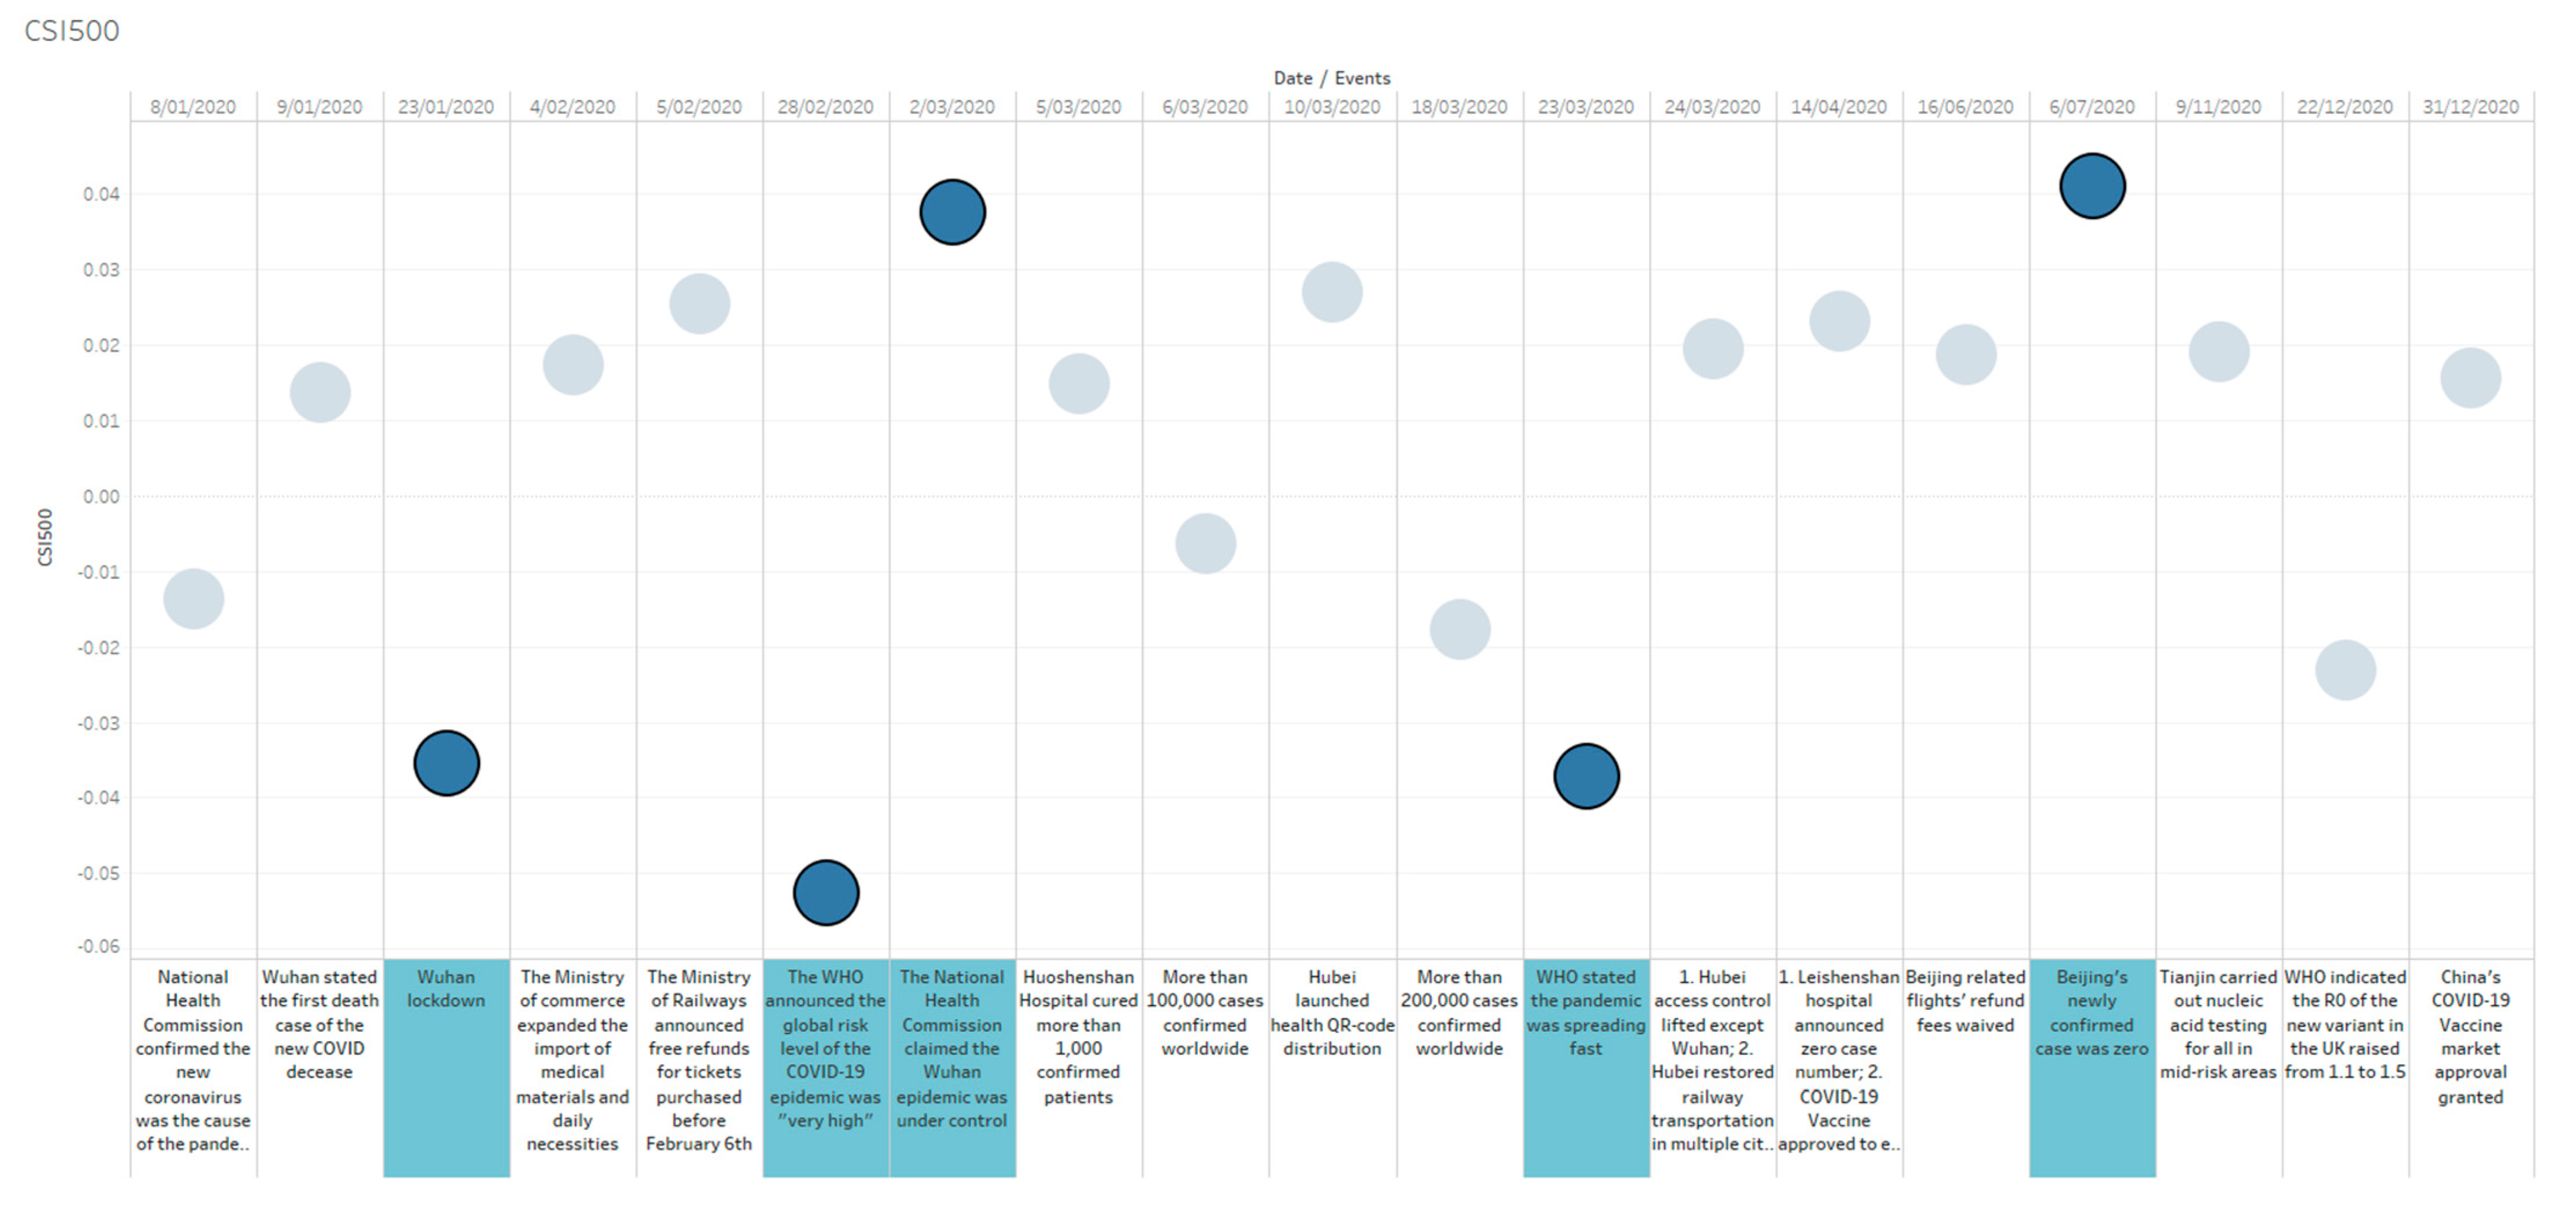
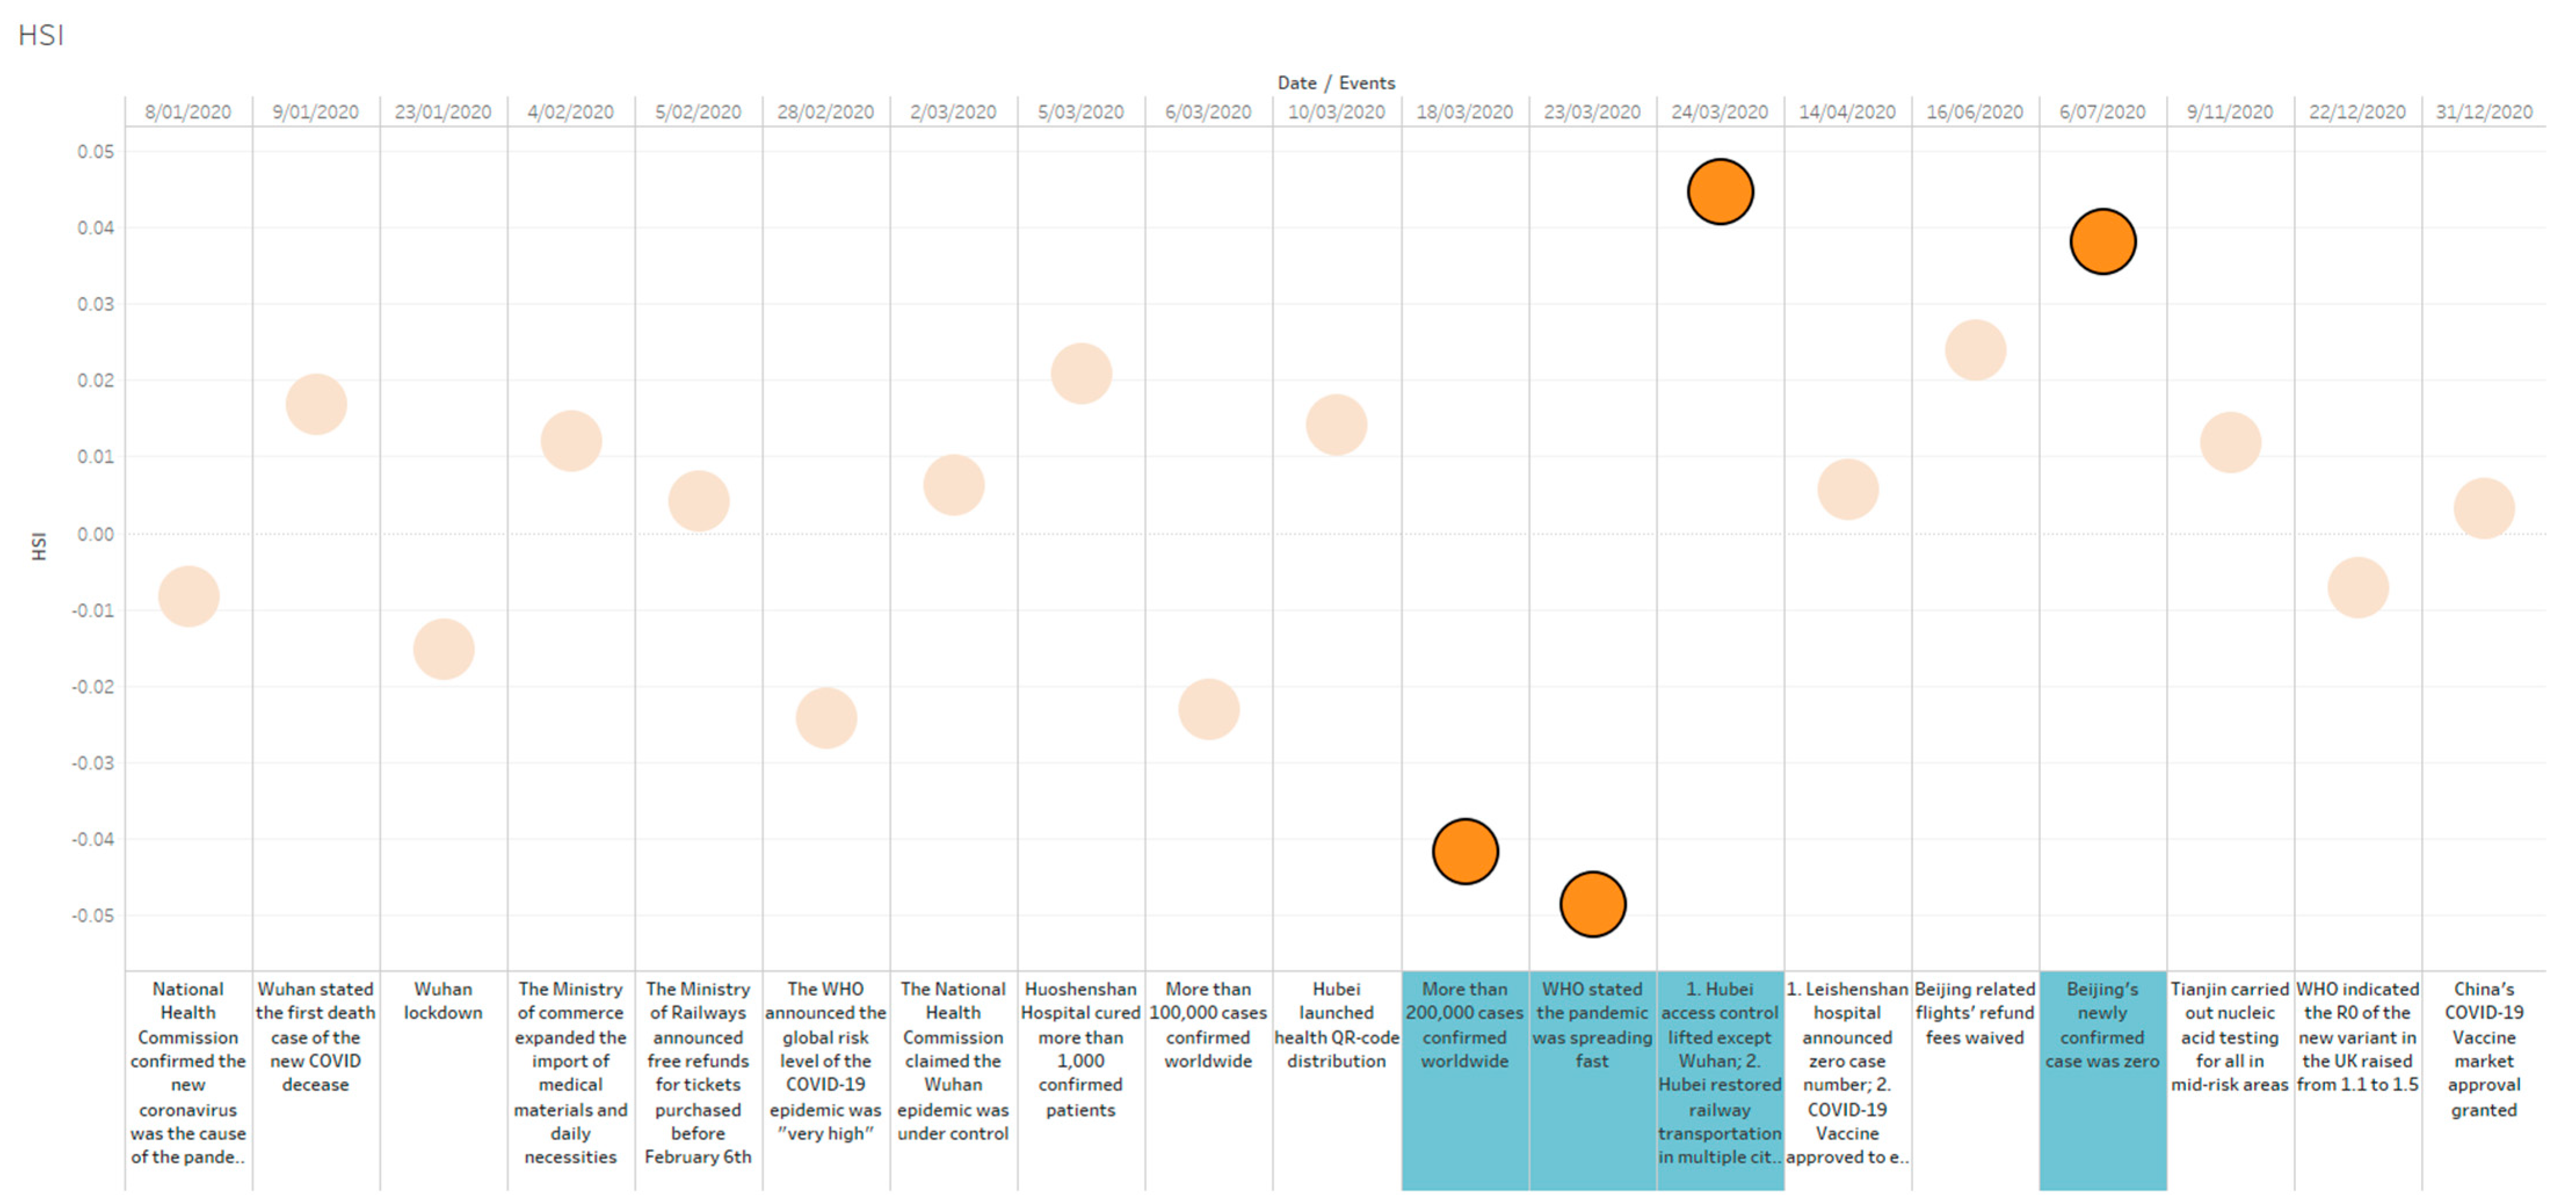
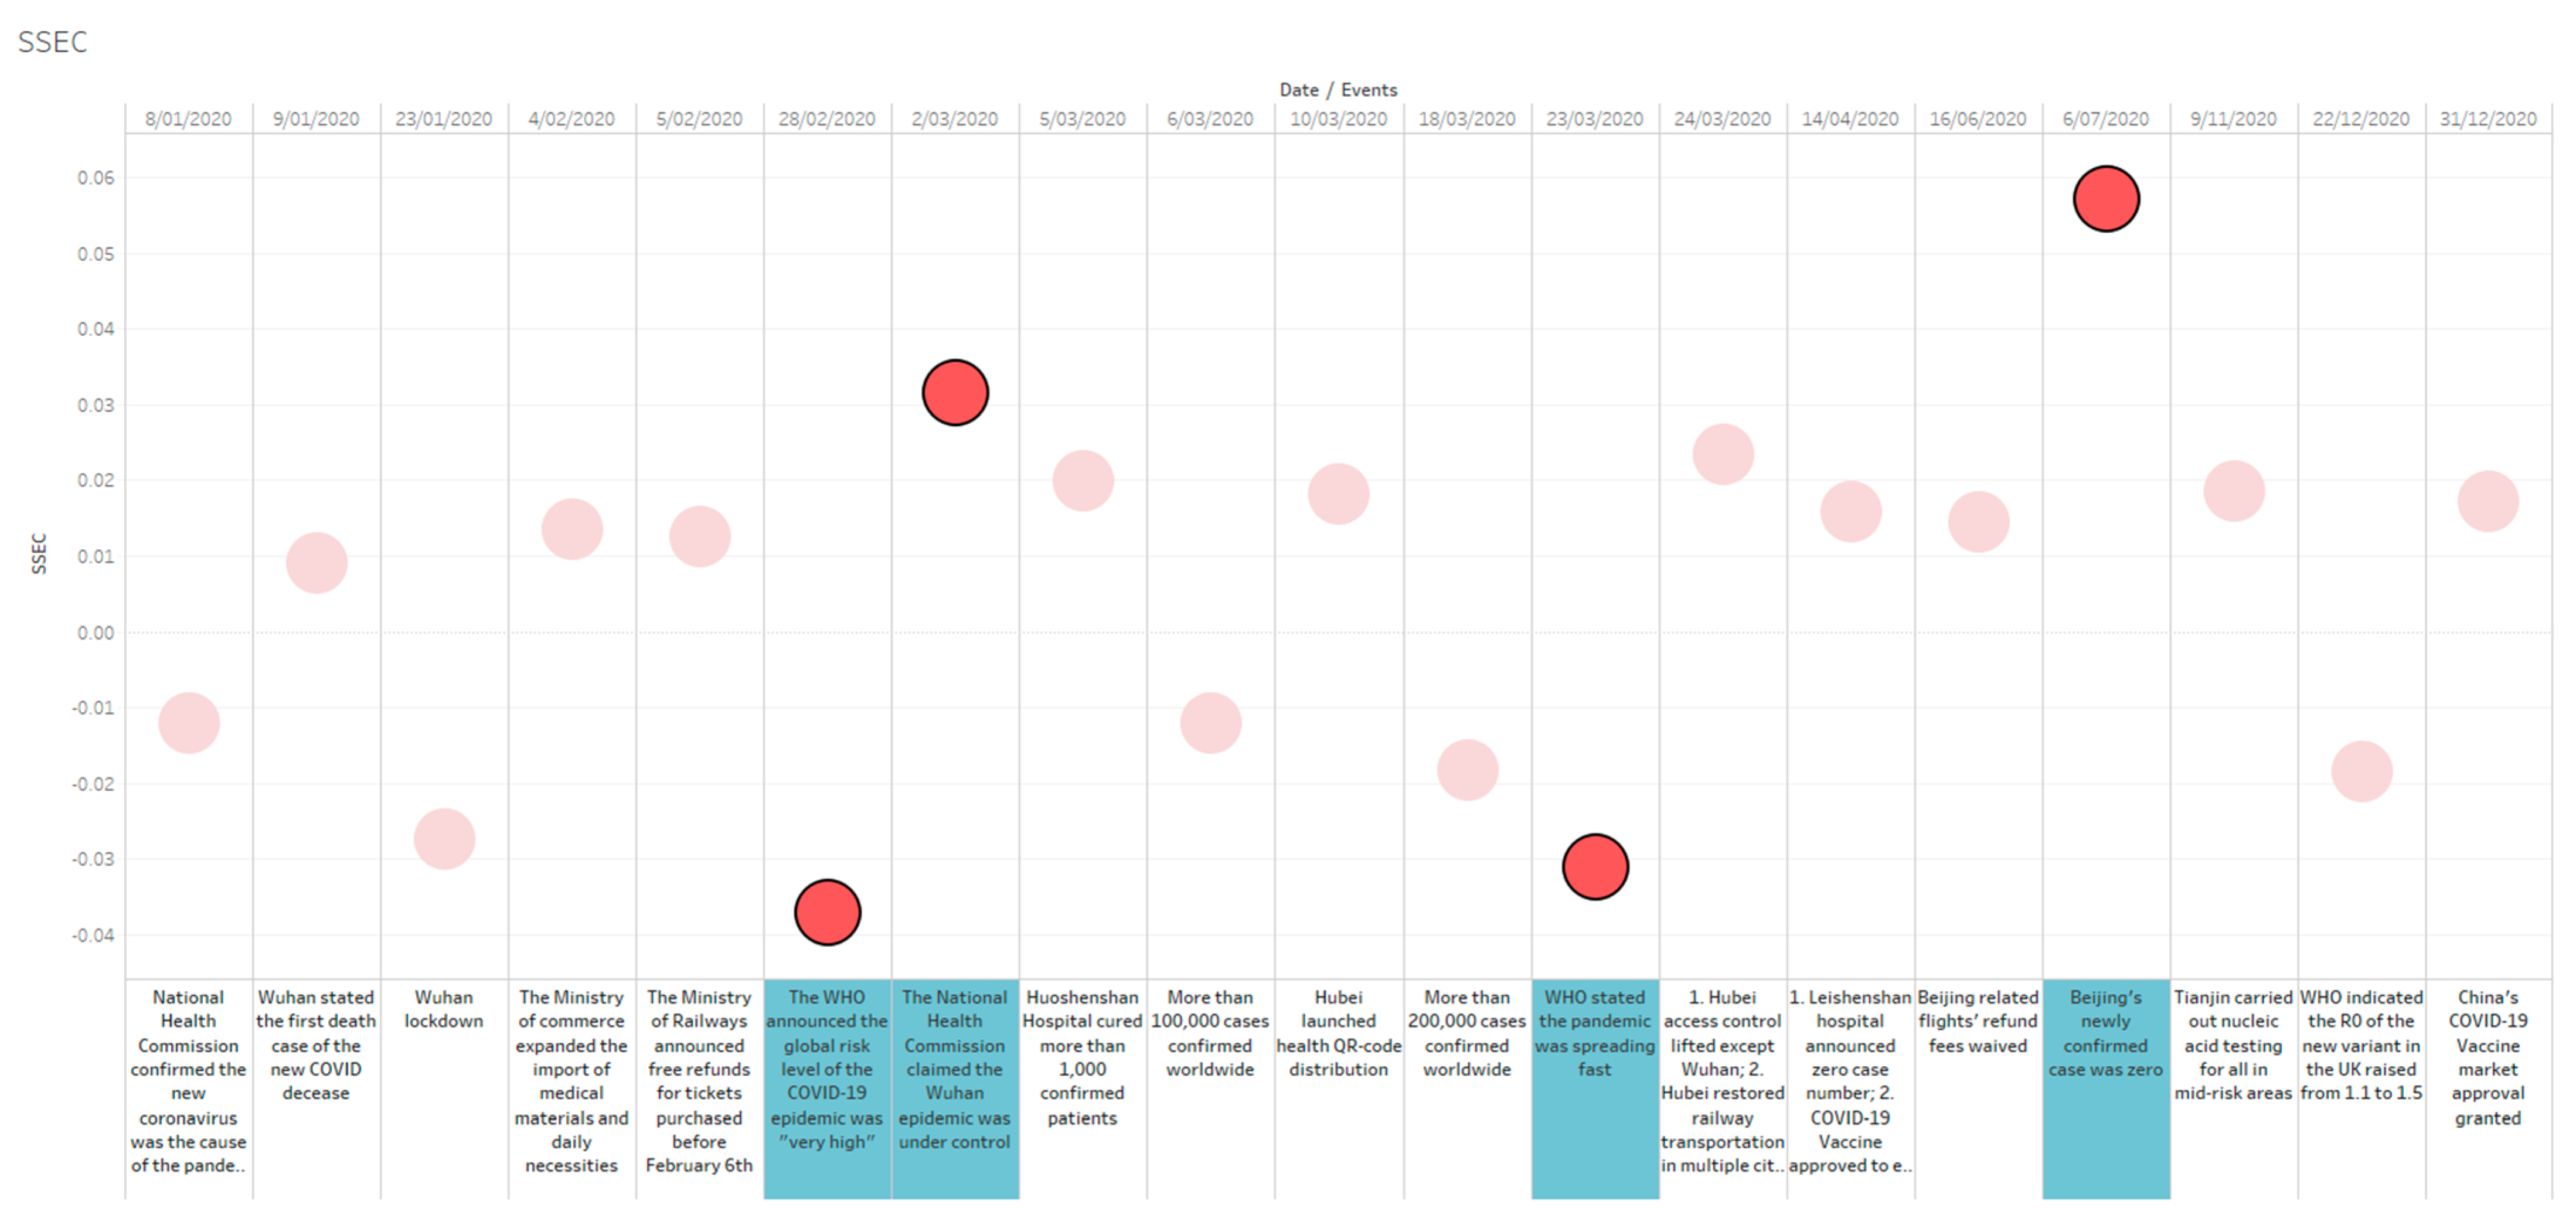
Section 2.1. Here, for SSEC, HSI, SZI, CSI500, and TWII, the absolute values that are more significant than 0.03% have been highlighted in
Figure 2,
Figure 3,
Figure 4,
Figure 5 and
Figure 6, and in
Figure 7, we highlight the values that are greater than 0.15% for VXFXI. Some details can be found below in those figures as a result.
CSI500: the highest rise was 4.1% and the max fall was −5.26%; 87.5% of negative events led to a fall in the stock market, and 100% of positive events caused a rise in the stock.
HSI: the max rise was 4.46% and the greatest fall was −4.86%; 87.5% of negative events caused a fall in the stock market, and 100% of positive events affected the rise in the stock.
SSEC: the highest rise was 3.71% and the greatest fall was −5.71%; 87.5% of negative events produced a fall in the stock market, and 100% of positive events caused a rise in the stock.
SZI: the peak rise was 4.09% and the highest fall was −4.8%; 87.5% of negative events resulted in a fall in the stock market, and 100% of positive events triggered a rise in the stock.
TWII: the peak rise was 4.45% and the highest fall was −3.73%; 66.7% of negative events affected the fall in the stock market, and 100% of positive events resulted in a rise in the stock. (The stock market closed on 23 January 2021 and 28 February 2021.)
VXFXI: the greatest rise was 28.8% and the greatest fall was −25.01%; 62.5% of negative events caused a fall in the stock market, and 36.4% of positive events triggered a rise in the stock.
CSI500, HSI, SSEC, and SZI tended to have similar effects from COVID-related events, that when the authority announced the pandemic was under control or some areas’ case number was zero, the stock market rose; on the other hand, it fell when cities were locked down, the authority stated high risks of COVID-19, or more cases were confirmed.
TWII also had comparable influences; however, the impacts were less than the above four indices from mainland China and Hong Kong.
The interesting fact is that VXFXI was seemingly not affected by those social events at all. It could rise when there were negative events and fall when positive events occurred. For example, when the WHO publicised that COVID-19’s risk was ‘very high’, VXFXI rose, and it fell instead when Wuhan’s pandemic was under control. Its ‘independent’ behaviours were impacted by WHO’s statement at the early stage of the pandemic, also affected by some events that occurred in specific cities such as Wuhan and Beijing as well, and how it reacted during the outbreak might be linked to events in the US; however, related data have not been collected yet, and we are planning to import those significant events related at the next stage, hence bringing out insights of this particular stock index, which is China-related but acts as a US local stock index.
Table 4 shows only five events that caused the greatest positive/negative changes of each stock index, and it can be observed that VXFXI presents extremely opposed shifts in three out of five events.
4. Discussion
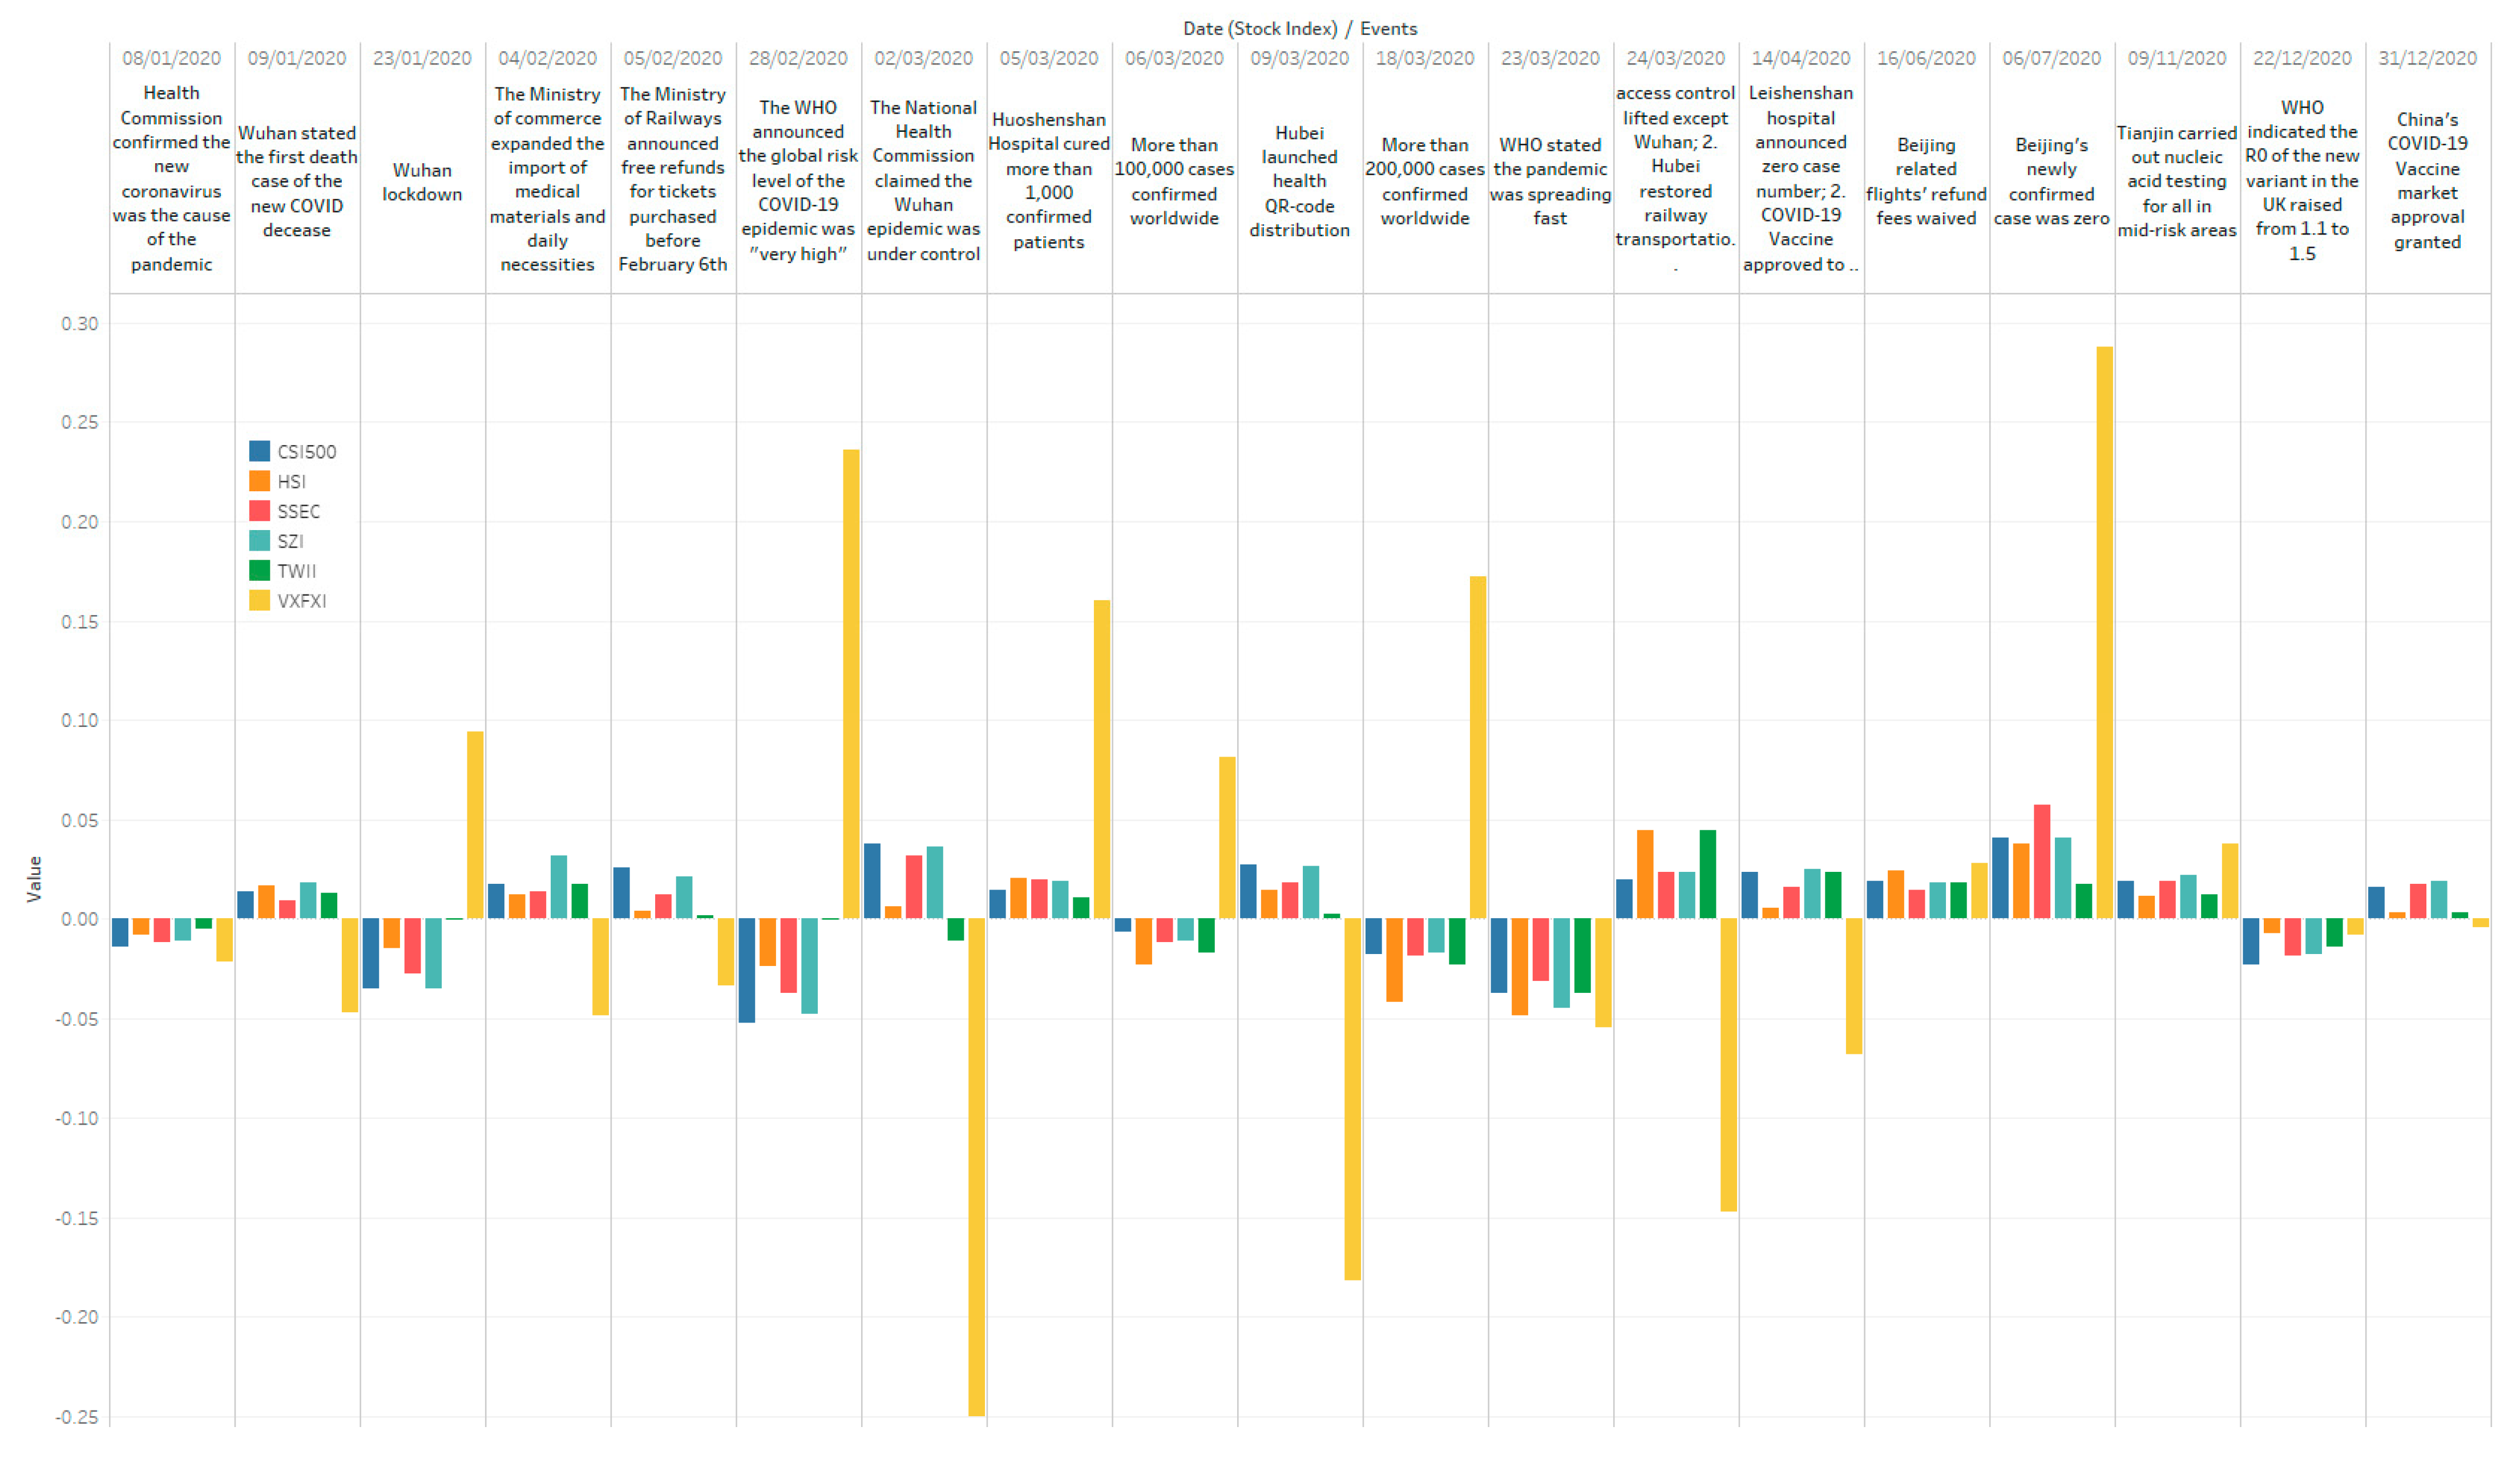
Overviews are presented in
Figure 8 and
Figure 9, using bar and line charts along with event dates. It can be observed that CSI500, HSI, SSEC, SZI, and TWII had similar trends following the major social events. However, VXFXI jumped up and down during the pandemic, and it seems that VXFXI was not affected by social events. Similar outcomes can be found in
Figure 10 and
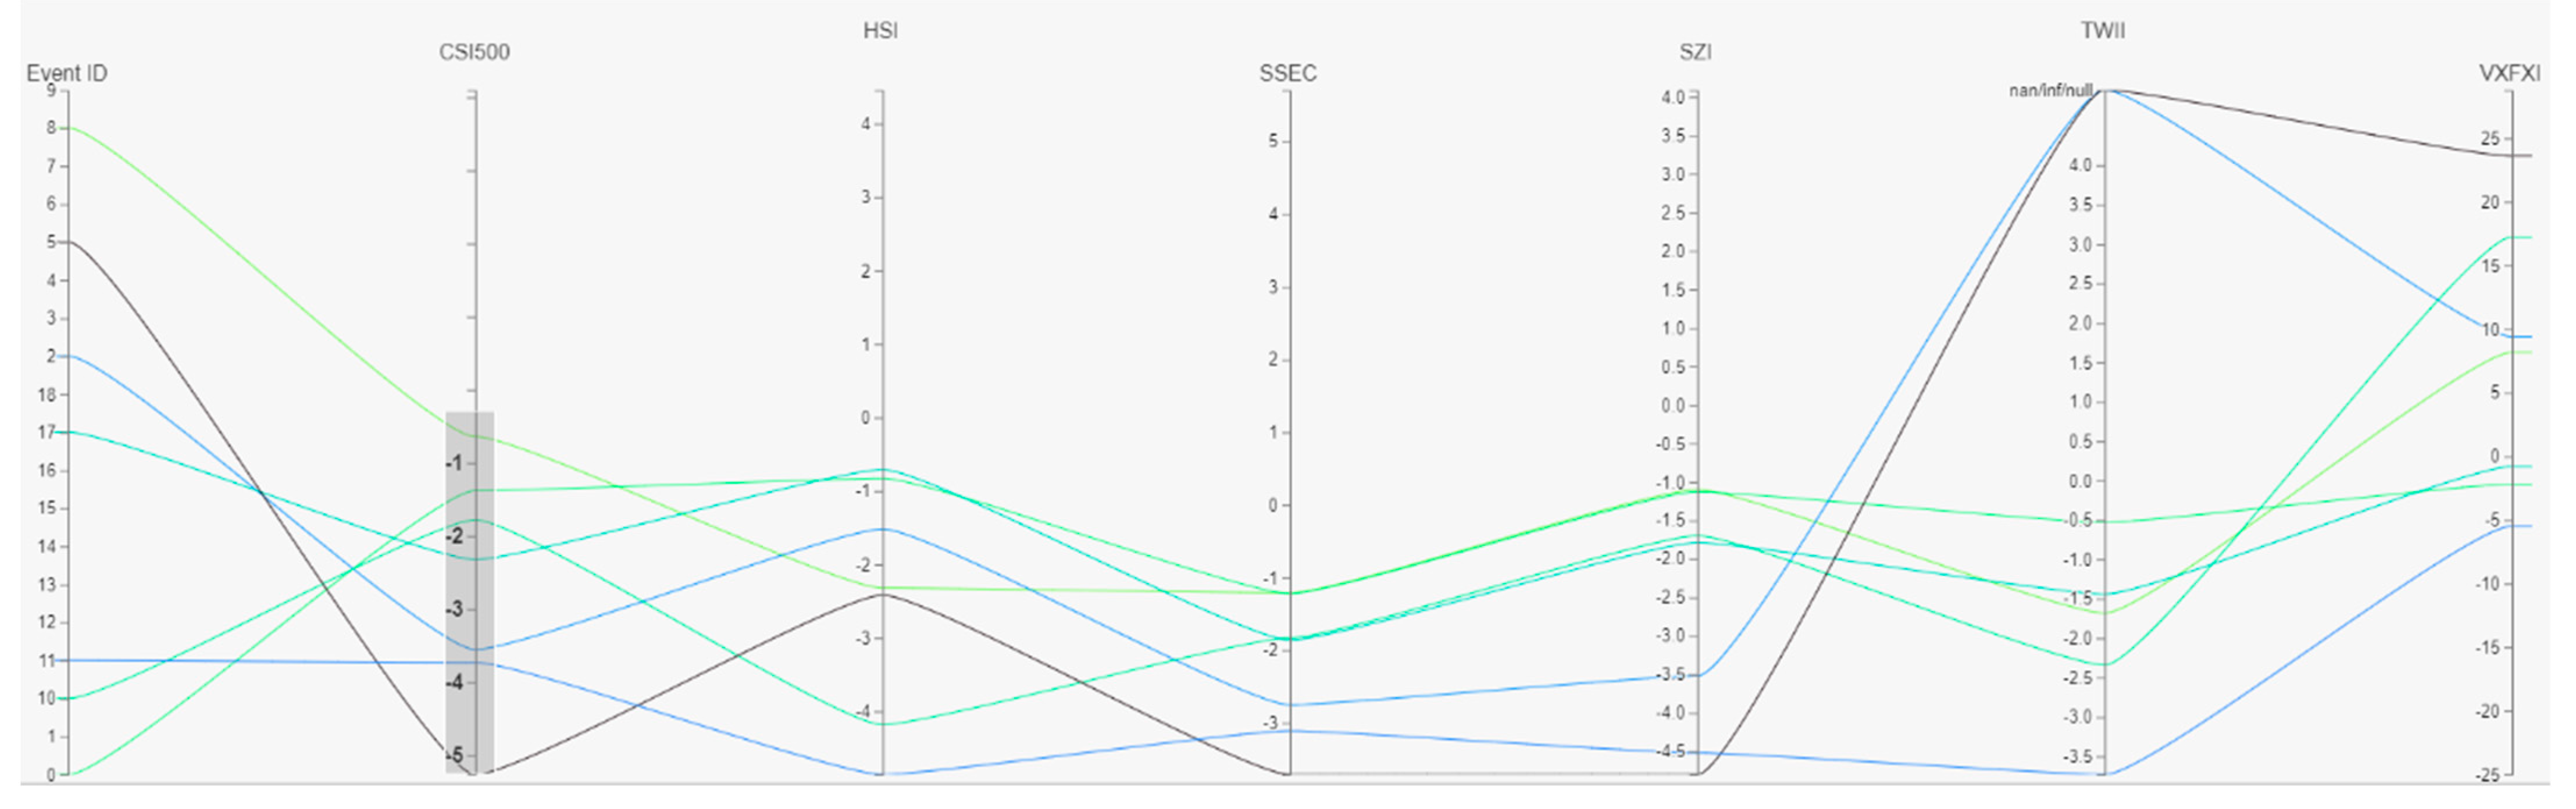
Figure 11 as well.
In
Figure 10, when the authority proclaimed that the pandemic in Wuhan was under control on 2 March 2021, all stock market indices went up except TWII and VXFXI; in addition, in
Figure 11, when the WHO stated that COVID-19 was spreading fast on 23 March 2021, all stock market indices declined; however, when more COVID cases were confirmed, VXFXI rose while others dropped. Only 57.1% of events were positive when VXFXI went up here. Based on the limited results in our experiments, it can be observed that CSI500, HSI, SSEC, and SZI were affected by COVID-related social events in mainland China the most, and TWII was also inflicted in most cases as well, but VXFXI was not concerned at all. These outcomes may be reasonable, as CSI500, HSI, SSEC, and SZI are wholly or partly regulated by the Chinese government, and TWII is located in Taiwan, which has a close connection to mainland China; the US has a close link to China as well on the economy based on the figures of trade in goods [
45]. However, the influences from China on the Chinese stocks in the US are minor from our experimental outcomes.
R2 values are given in
Table 5, in which it can be witnessed that SSEC, SZI, and CSI500 act similarly (their values are close to 1); HSI and TWII have a tendency to behave comparably (
R2 is 0.815579), while HSI’s trends also remain analogous to SSEC’s, SZI’s, and CSI500’s; conversely, VXFXI’s actions are separate from all others (all values are less than 0.124431), CSI500 has a bit more influence on it, and it is independent of TWII. These statistics additionally support the observation outcomes.
There were 11 positive events and 8 negative events, especially after 24 March 2021 when Wuhan’s access control was lifted, which could be considered a milestone of the pandemic outbreak in China. In addition, in
Table 6, we can notice that positive events caused less impact than negative events on the stock market. Investors might have less confidence during the pandemic.
Concerning our hypotheses, we can conclude:
For H1, in most cases, all those stock market indices were influenced by the COVID-related social events in similar trends except for VXFXI. There are clear connections between COVID-19-related social events and the stock market index, and the indices may be affected by similar trends, but in our experiments, this can only be applied to five indices, and not VXFXI; its fluctuation appeared in opposed directions in many cases.
For H2, CSI500, HSI, SSEC, SZI, and TWII have similar trends in experiments; the impacts were not the same, though. Hence, different stock market indices may be affected to various degrees by relevant social events. Again, this finding cannot be applied to VXFXI, and one of the conspicuous differences between VXFXI and others is the stock market’s geographic location in this study; all five other stock markets are within or close to mainland China. García and Norli stated that geographic dispersion has an effect on stock returns; however, their outcomes were driven by only domestic dispersion [
46], and the geographic matter remained uncertain at this stage in this study.
For H3, the event ‘WHO stated the pandemic was spreading fast’ caused all stock indices to fall, and they are all in the top three drops for all stock markets except VXFXI; in addition, the event ‘Beijing’s newly confirmed cases were zero’ made all stock indices rise; four indices experienced the most growth, HSI’s increase was the second-highest, but TWII remained similar; additionally, WHO’s statements in the early stage of the outbreak triggered a large fluctuation in all stock markets except TWII; however, its announcements—‘the R0 of the new variant in the UK raised from 1.1 to 1.5’ at the end of 2020 did not distress the stock market in China much. Therefore, in most cases except VXFXI, Chinese authority announcements played a more critical role in affecting the stock market, but events’ impacts tended to be weakened based on if they occurred within the authority’s jurisdiction scope. However, events not involving China, even from the WHO, did not influence the Chinese stock market.
For H4, related social events did affect the stock market indices in similar ways for most indices except VXFXI. Due to their similar trends, we believe there could be a ranking system for the events based on historical stock indices’ fluctuations. However, as there are many other factors involved, we are not capable of implementing it at this stage, so this hypothesis remains unproven.
For H5, these visual results assisted us in gaining understandings from the two types of data, such as VXFXI’s reactions to most of the same events at opposite extremes, CSI500, SSEC, and SZI’s high similarity, HSI and TWII’s likeness, and their slight differences, but they maintained an overall similarity to the indices in mainland China. Consequently, we can determine that the visual approach assisted us in gaining insights and patterns effectively in this case.
Generally, except for partly H2, H4, and excluding VXFXI, the hypotheses have been confirmed, and separate behaviours of the China-related stocks in the US might be caused by many factors such as geographical, political, and economic reasons [
47,
48], and those are beyond our research at the stage.
5. Conclusions
We generated graphs and statistics to analyse the connection between the stock market index and COVID-19-related social events through experiments. Our hypotheses were partly validated, with relevant events influencing the stock trends, most likely but not constantly. A positive event makes the stock rise, and an adverse event causes it to drop in most cases. However, the effects of social events might be weakened due to the local authority’s jurisdiction, the stock market’s geographic location, and other facts that have not been confirmed at the stage.
The significant Chinese stock market fluctuations were before/on Wuhan’s access restriction lift, and these account for 68.4% of crucial events’ impacts. Additionally, the close geographical and economic ties might reflect the degree of the result of significant events on the local stock market. The China-related stocks in the US tend to have no connections to the other five stock indices. To the best of our knowledge, this study has not been carried out in another existing research. The outcomes might be potentially helpful for stakeholders such as investors and authority decision-makers; besides, it might be beneficial to analyse public health data from another angle as well, such as the interaction between those two types of data, not only how the pandemic affects the stock market, but also the impacts on public health events from the stock market. The relationship analytics may assist stakeholders in analysing public health data and financial data at one go.
This work is an initial step to analyse the connection between the social event and the stock index. The limitations of this work include: the stock market data are complex, and we only imported the local event’s impact for analysis, which might be a critical factor during the pandemic, but not enough to provide comprehensive insights; in addition, we have not taken into account major social events worldwide, particularly relevant events in the US, which might have led to the unique features of the China-related stocks in the US market in the experimental results. In addition, political matters might be a vital factor on VXFXI, which has not been considered.
In our future work, we will be collecting more factors (political reason, events linked to public health) related to the stock market index, and importing those into our methodology; in addition, a novel interactive visualisation method will be processed to present the relationship between social event and stock index based on a timeline, hence digging deeper into the relationship in-between, and eventually providing a more comprehensive understanding into this topic based on pure data analytics.


