Article

Effect of Stirrup on Bond Strength Degradation in Concrete Cracked by Expansion Agent Filled Pipes

by
Amadou Sakhir Syll
1,*,
Hiroki Shimokobe
1 and
Toshiyuki Kanakubo
2
1
Graduate School of Systems and Information Engineering, University of Tsukuba, Tsukuba 305-8577, Japan
2
Division of Engineering Mechanics and Energy, University of Tsukuba, Tsukuba 305-8577, Japan
*
Author to whom correspondence should be addressed.
Appl. Sci. 2021, 11(19), 8874; https://doi.org/10.3390/app11198874
Submission received: 21 August 2021 / Revised: 19 September 2021 / Accepted: 20 September 2021 / Published: 24 September 2021

Abstract

:
The corrosion of rebars in reinforced concrete structures cracks the concrete, which leads to the degradation of the bond strength between the rebar and concrete. Since bond deterioration can menace structural safety, bond strength evaluation is essential for proper maintenance. In this study, the authors investigated bond strength degradation by conducting pull-out tests on concrete specimens, with induced crack width and stirrups ratio being the principal parameters. An expansion agent-filled pipe (EAFP) simulates cracks due to the volumetric expansion of the corroded rebar. One advantage of this method is that it allows one to focus on the single effect of an induced crack. The pull-out tests on 36 specimens show that stirrups’ confinement significantly influences the bond degradation due to induced cracks. The authors proposed an empirical model for the degradation of bond strength, considering the impact of induced crack width. The result shows that the induced crack by EAFP can quantify the exclusive consequence of corrosion on bonds. Furthermore, the coefficient of variation is 12% for specimens without stirrup from Law et al. For specimen without and with stirrup from Lin et al., the coefficients of variation are 14% and 17%. The proposed model can predict the corroded specimen from the literature with reasonable accuracy.

1. Introduction

There is an urgent need to address the safety problems and economic burden caused by the deterioration of reinforced concrete (RC) structures. The corrosion of reinforcing bars (rebars) has been recognized as one of the most significant causes of deterioration for RC structures. The corrosion products expand the volume of corroded steel reinforcement, leading to tensile stresses that can cause the cover concrete cracking of these RC structures. Prominent publications demonstrated that these induced cracks could affect the structural performance of RC members [1,2,3,4]. For effective maintenance with low cost, it is necessary to evaluate the effects of deterioration accurately.
‘Bond’ refers to the interaction between rebars and the surrounding concrete, which allows transferring tensile stress from the steel into the concrete. It is a fundamental property of RC structures. For instance, in shear resistance through truss mechanisms, bonds have a crucial role in maintaining internal force equilibrium [5]. However, as can be seen in Figure 1, the corrosion-induced crack along the main rebars can deteriorate the bond quality. With the lack of a strong bond, the tensile force from the main rebar cannot be correctly transferred to the concrete. Consequently, the internal equilibrium force is disturbed, leading to global structural performance degradation. The impact of corrosion on bond performance has been studied extensively in the past. The fib Bulletin 10 [6] provides significant analysis and discussion on the topic. Lin et al. and Mancini et al. [7,8] also presented recent and considerable literature reviews. Electrical corrosion is widely adopted to simulate the phenomenon in a relatively short time. Furthermore, most researchers have estimated bond degradation as a function of the level of corrosion [9,10,11,12,13,14]. Others have attempted to correlate the surface crack width to the level of corrosion of the rebars or the bond deterioration [15,16,17,18].
The data from the electrically corroded specimens are rather controversial, and there is no general agreement about the results characterized by scattering and variability. This variation is caused by the difference in the material properties, typology of specimens, or the flow of rust amount in the concrete [17,19,20]. Consequently, a widely accepted model for bond degradation is unavailable. The induced crack, the rebar profile change, and the rust accumulation can also altogether affect the bond strength of the corroded specimen. However, combining these effects complicates the fundamental analysis and reduces the bond evaluation’s overall accuracy. Further, the authors proved that induced crack width is the more dominant factor than the corroded rebar shape and rust accumulation in the bond deterioration mechanism [21,22]. Previous studies have proposed a new approach to produce a more accurate model that consists of finding a direct link between bond degradation and surface crack width without corrosion products [23,24,25].
For an alternative to electrical corrosion, the previous study [26] presented a novel method for simulating concrete cracking due to the corrosion of the rebar. An aluminum pipe embedded in concrete and filled with an expansion agent (hereafter, expansion agent filled pipe, EAFP) simulates rebar’s volume expansion due to corrosion. This expansion generates cracks in the concrete surrounding the rebar. One advantage of EAFP is that it allows for focusing on the single effect of an induced crack. The results of the pull-out test of a cracked specimen without a stirrup suggests that the direct link between crack width and bond deterioration can improve the accuracy of the results. It can therefore be assumed that the induced crack width may express the exclusive consequence of corrosion on the bond deterioration. Furthermore, the test results show that the deterioration of the bond strength was more severe in the “Side-split” cracked specimen than in the “Single-split” one, as can be seen in Figure 2.
On the other hand, the pattern of the induced crack in tested specimens should represent as closely as possible the conditions found in structural RC members. Therefore, to appropriately model the damage, in the previous study [27], a specimen was built to monitor the internal cracking condition due to the volumetric expansion of the rebar. Figure 3 shows the RC beam when EAFPs replaced the corner longitudinal rebars to simulate the induced corrosion cracks. Hours after filling the expansion agent, longitudinal cracks running parallel to the reinforcing bars are marked in blue, and the value on the figure shows the maximum crack width measured in each section, as shown in Figure 4a,c. To observe the internal cracking condition, the monitor specimens were sawed in half. Figure 4b,d show the detail of internal cracking. Side-splitting cracks mainly occurred around the main rebar due to the expansion of EAFP. With EAFP, it is possible to control induced crack patterns to reproduce closely the damage in actual structural members.
Furthermore, stirrups are capital for better structural performance in engineering practice. While most previous studies employed specimens without stirrups, researchers highlighted their positive role in inhibiting bond strength degradation [21,28,29,30,31]. This indicates a need to understand the effect of stirrup on bond degradation of cracked concrete. Therefore, this study quantitively investigated the effect of stirrup on bond deterioration due to side split induced corrosion cracks. The corrosion damage (induced cracks) simulated by an EAFP focuses on the more fundamental effect of the cracking itself. Then, three series of the cracked specimen with different stirrup ratios are subjected to a pull-out test. Finally, an empirical model built from the result is compared with corroded specimen data in the literature.

2. Materials and Methods

2.1. Test Series

Table 1 presents the specimen list. This study was based on testing concrete specimens with different induced cracks width. According to possible internal cracks in the RC beam (Figure 4), side-splitting cracks induced by EAFPs were modeled in this research. Thirty-six test specimens were used in three series (i.e., S0, S1, and S2). In Serie S0, the specimen was unconfined, while different stirrup spacing was used in Series S1 and S2 to assess the effect that confinement provided by stirrup has on bond deterioration. The stirrup ratio was calculated using Equation (1).
p w = a w b   ·   s
where pw is the stirrup ratio, aw is the cross-sectional area of the stirrup legs, b is the width of the specimen, and s is the stirrup spacing.

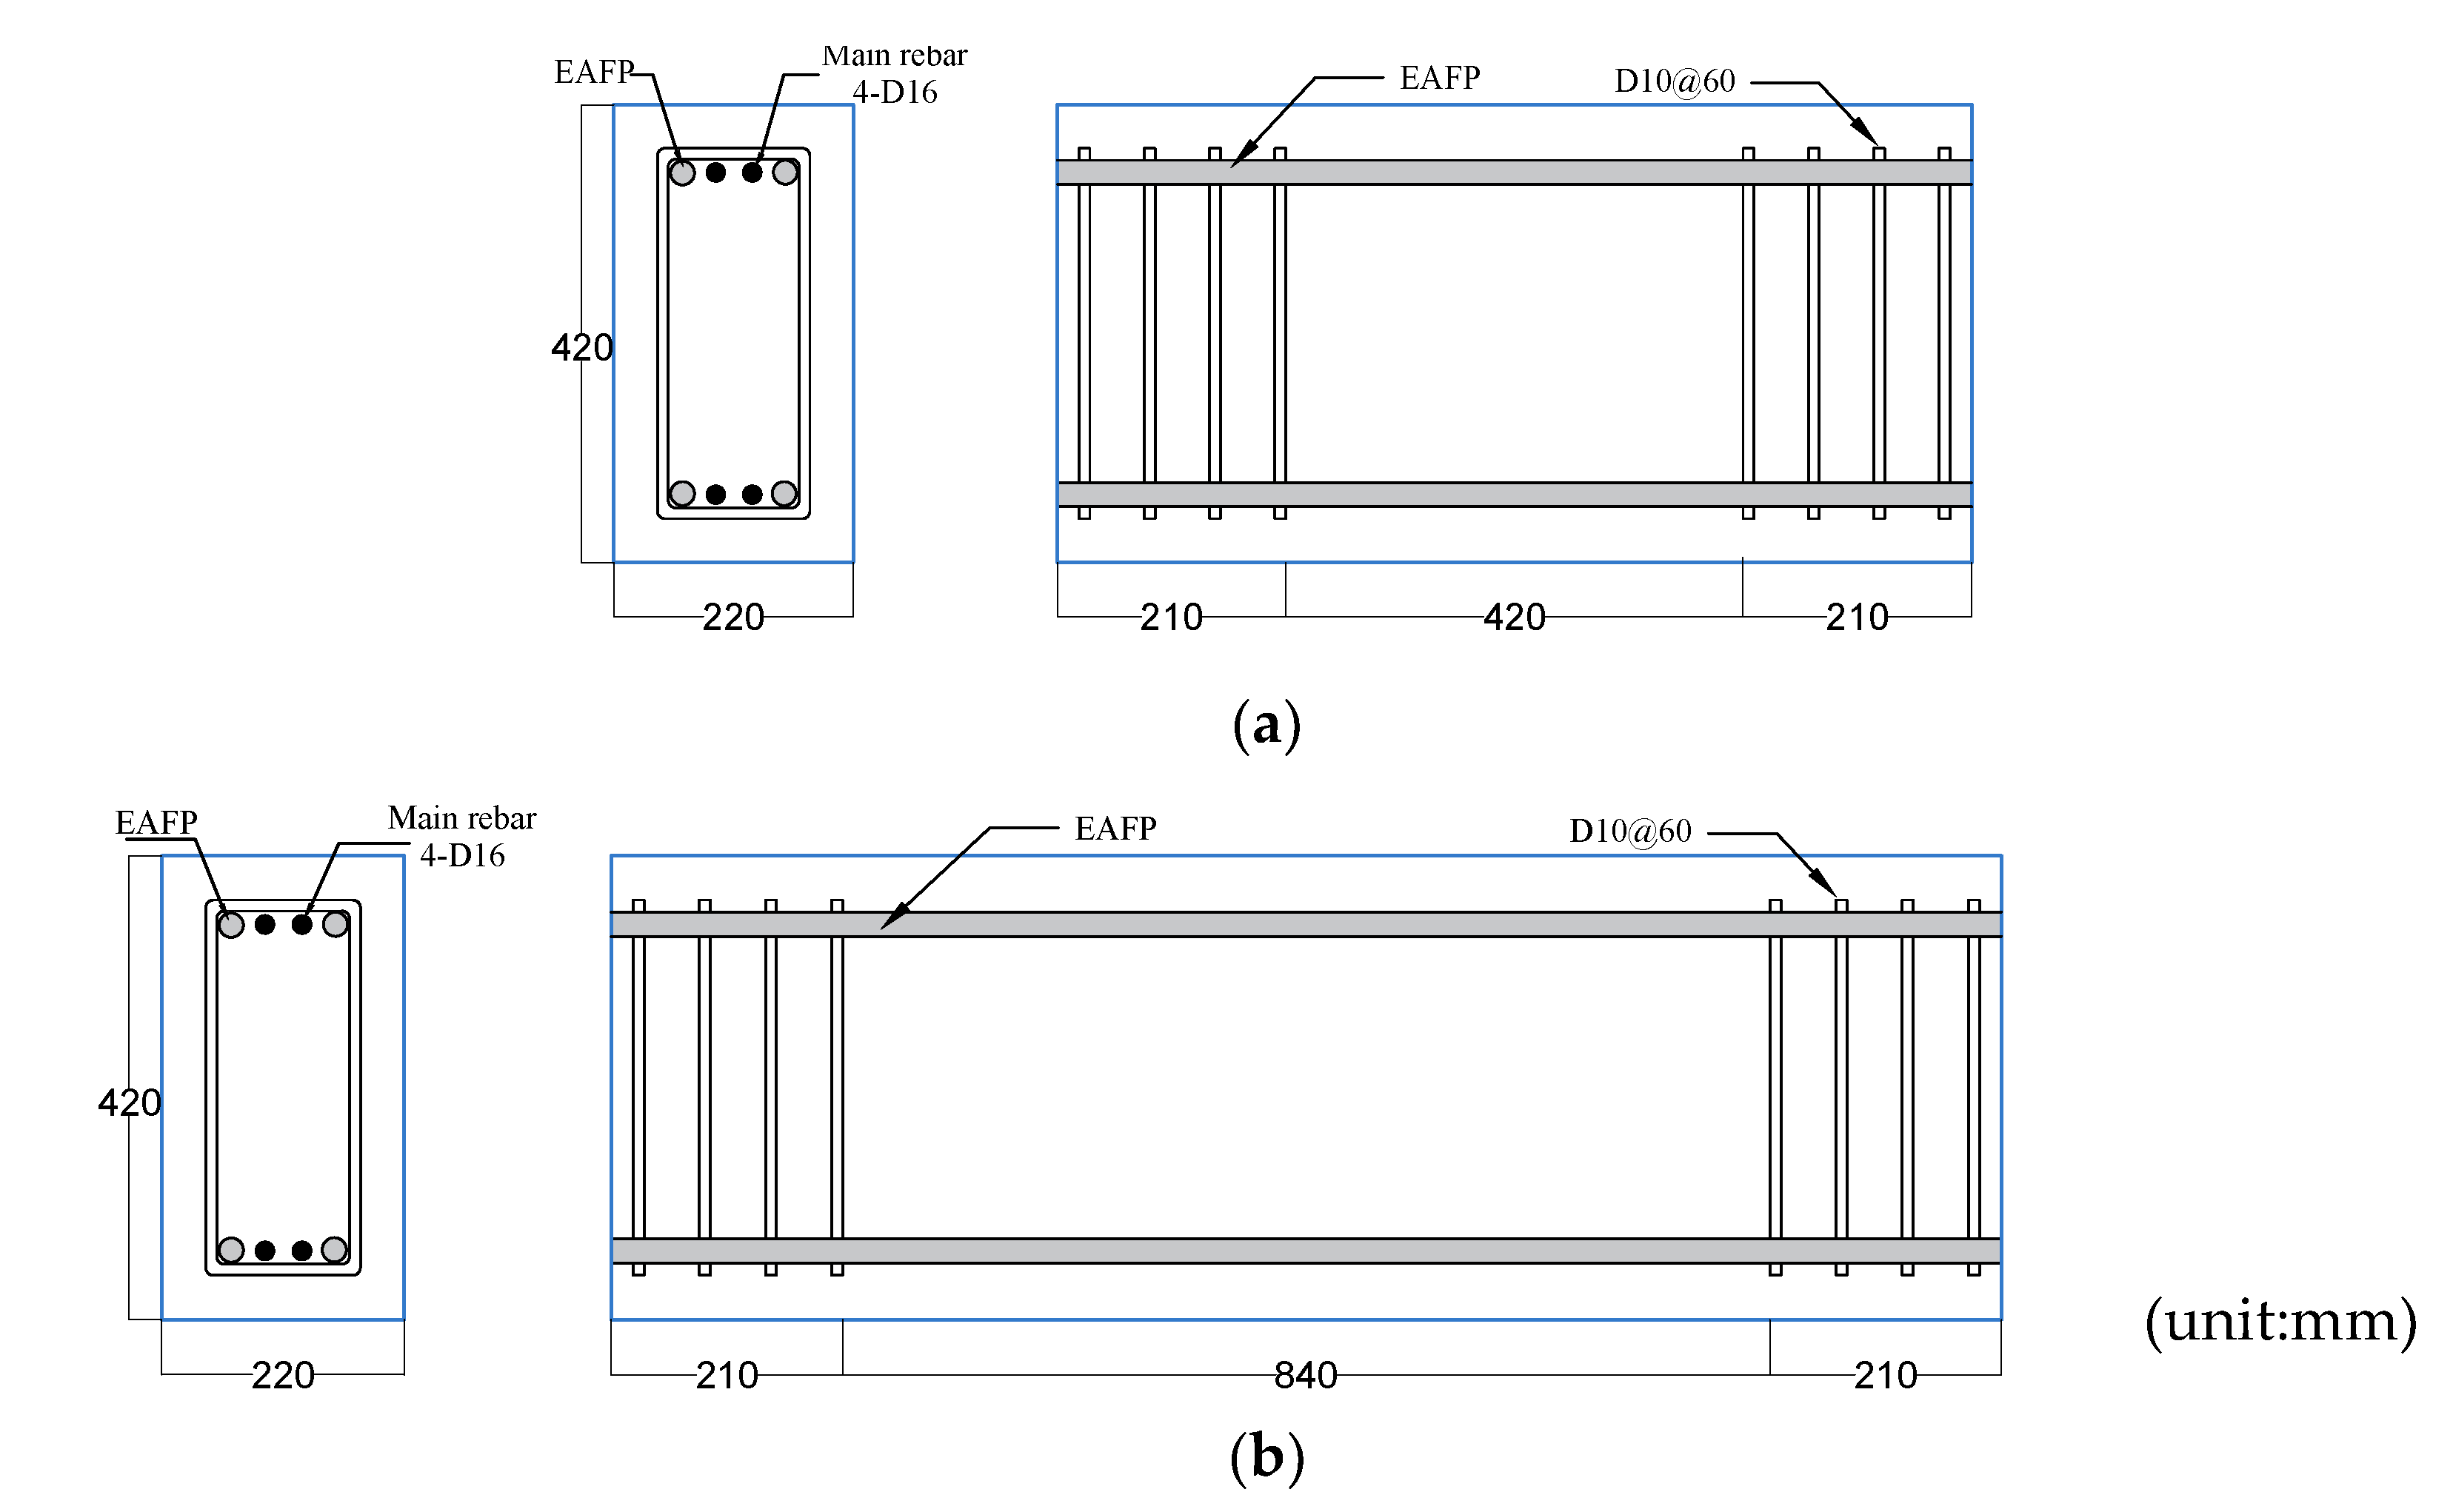
2.2. Specimen Overview

Figure 5 shows the detail of the specimen in Serie S2. Only a short length (76 mm: 4 times the bar diameter) of D19 rebar was embedded in the concrete block. This bond length is short enough to assume a uniform distribution of bond stress along the rebar. The bonded length was in the middle of the specimen, and an unbonded part of 47 mm at either side was set by inserting PVC tubes. The induced side-splitting crack was simulated by placing two EAFPs around the tested rebar. Moreover, stirrups of 10 mm diameter were employed in Series S1 and S2. Figure 6 shows the framework of all series. To minimize disparity, all specimens were built using the same sequence and materials.

2.3. Used Materials

The concrete, provided by a local ready-mixed concrete factory, was made with an ordinary Portland cement containing 248 kg/m3, a water-cement ratio of 78.5%, and a maximum aggregate grain size of 20 mm. The mean compressive and tensile of the concrete measured during loading days on ϕ100 mm × 200 mm cylinder was 20.9 MPa and 2.23 MPa, respectively. The tested rebar is a grade SD345 with 19 mm in diameter (D19), and the stirrup is an SD295 with 10 mm in diameter (D10). An aluminum pipe with an outer diameter of 22mm and a thickness of 1mm was used as EAFP.

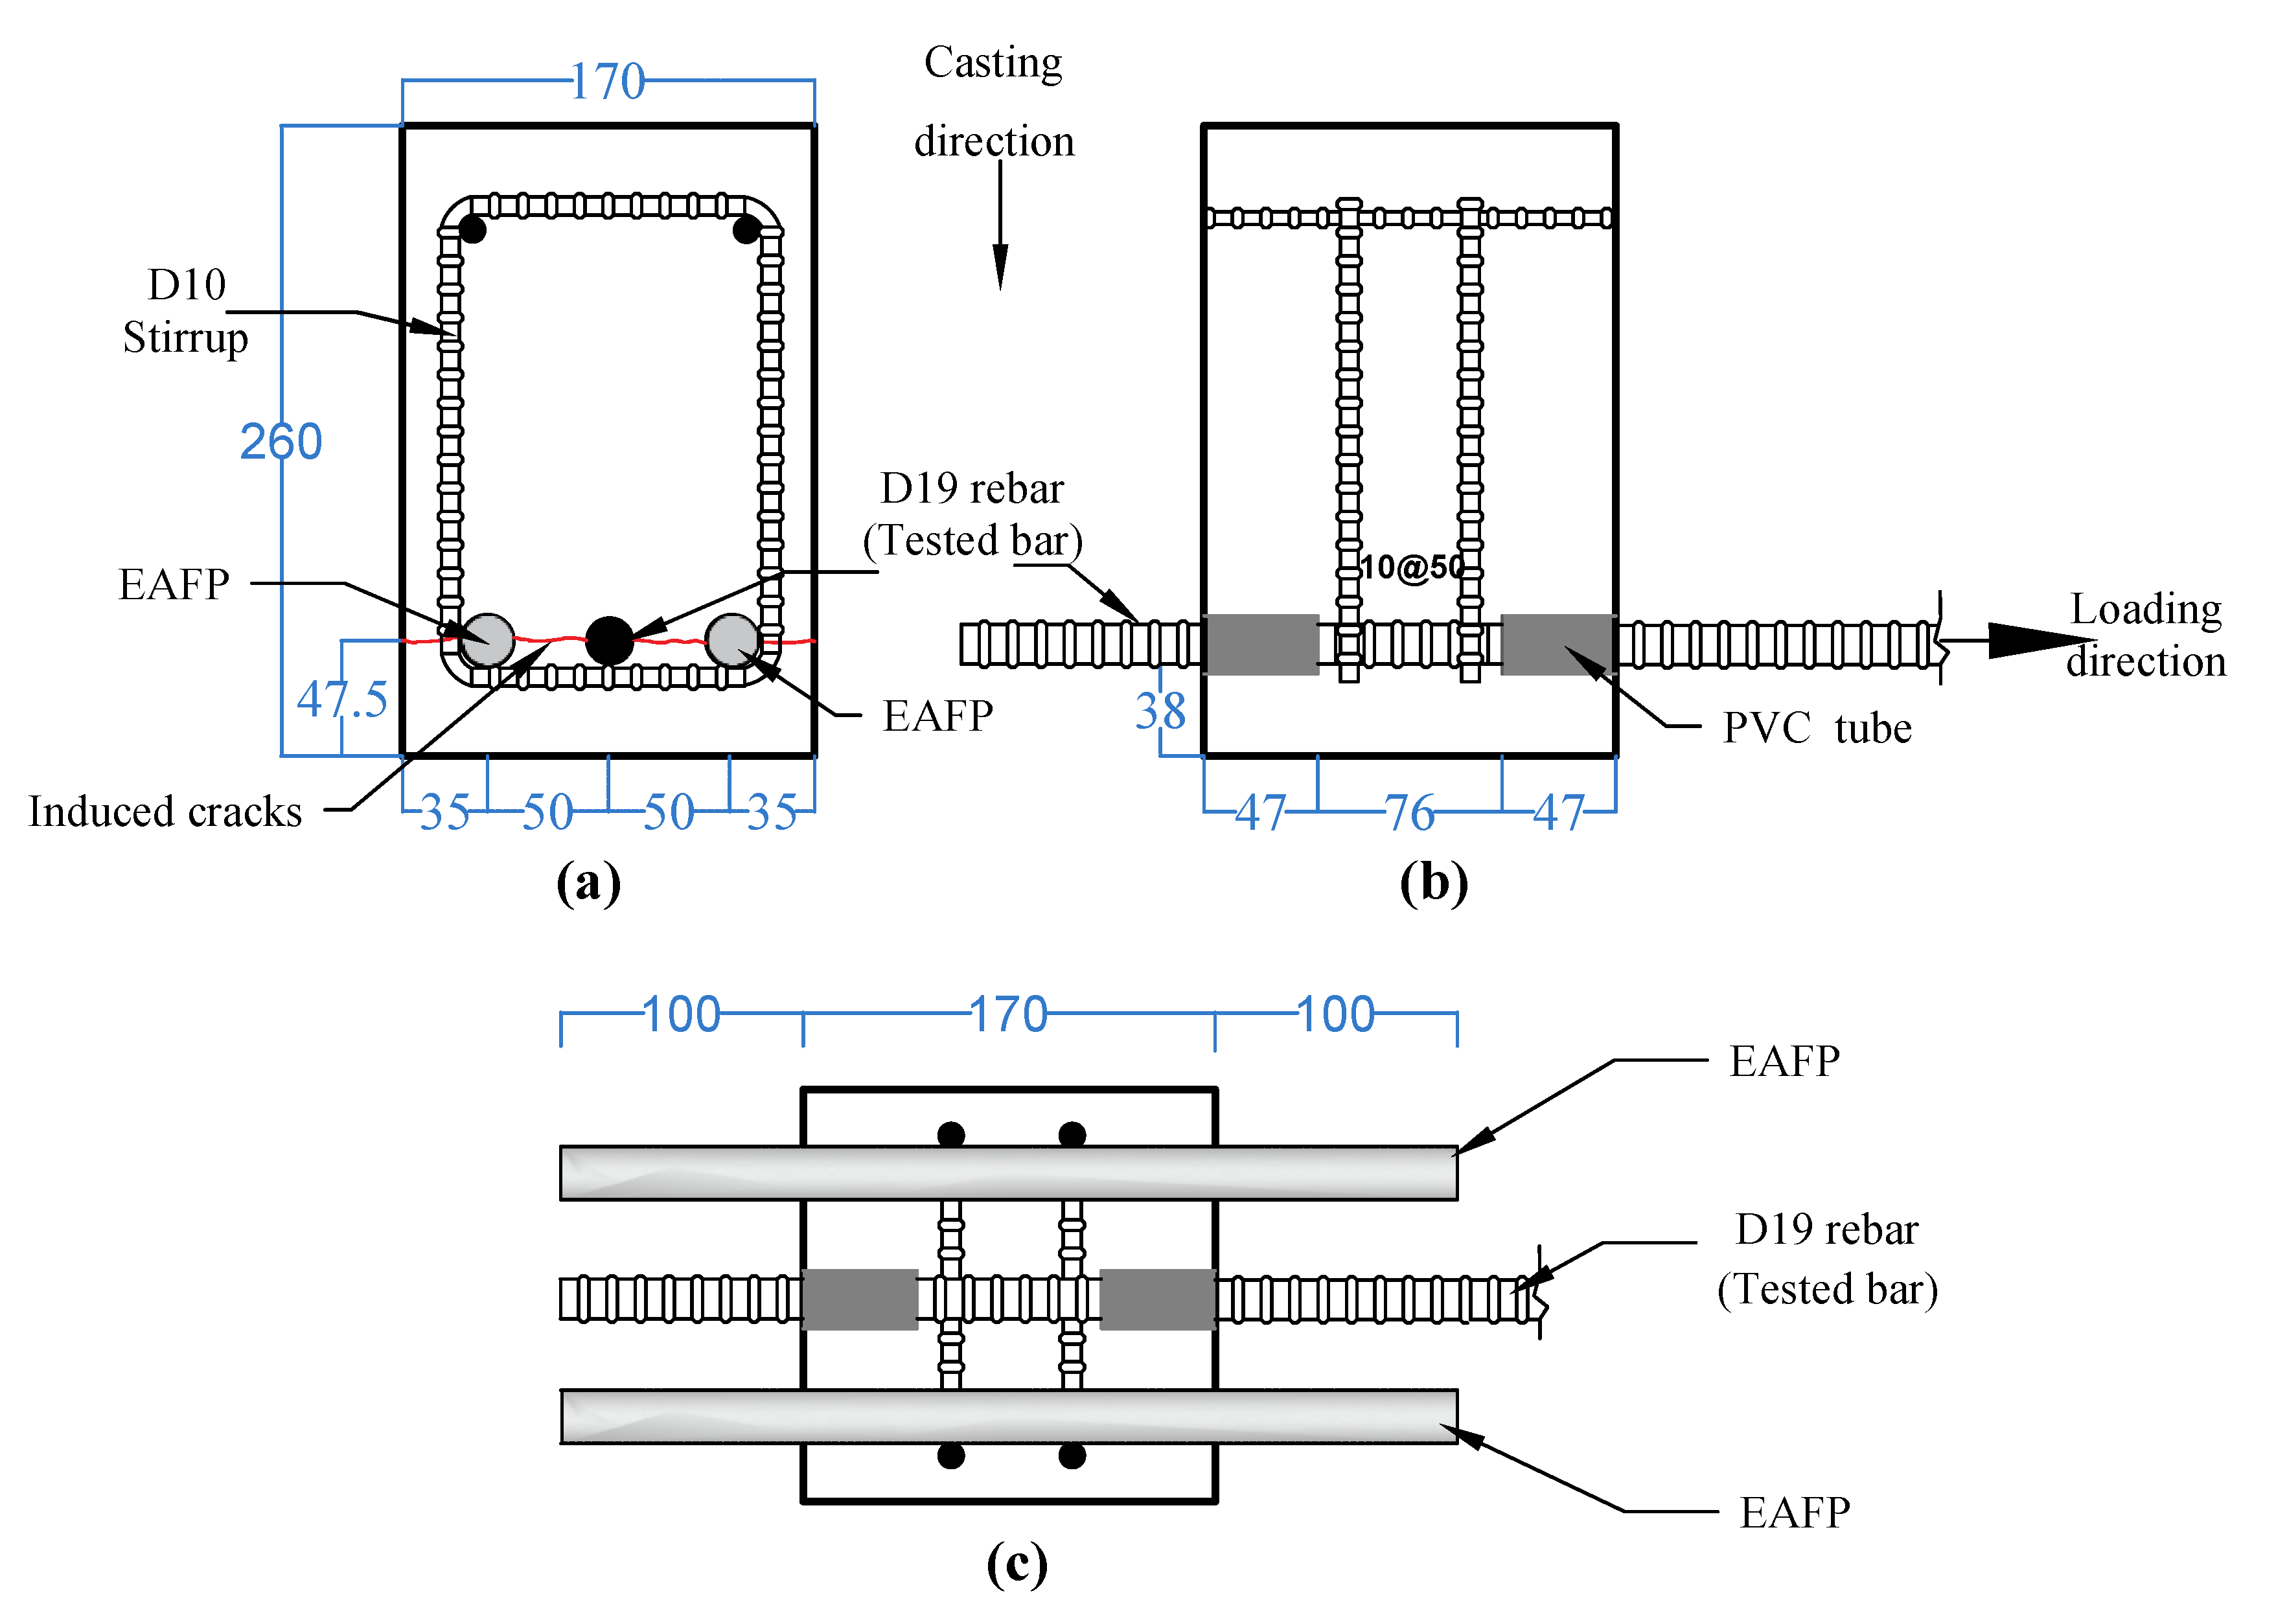
2.4. Crack Simulation by EAFP

A non-explosive demolition agent (expansion agent) is mainly used to demolish rocks and RC structures. In powder form, it expands when humified. To simulate rebar volume expansion due to corrosion, an aluminum pipe embedded in concrete is filled with an expansion agent. Due to this expansion, cracks are generated in the concrete, as shown in Figure 7a. The water-expansion agent ratio was 30%. The specimen was placed to set the axis of the pipe vertically. In Figure 7b, the expansion agent was filled from the top of the pipe. The induced crack width increases over elapsed time after filling. Thus, this time is controlled to obtain the target crack width. Our previous study [26] provides more details for this method.

2.5. Loading and Measurement Method

After the target-induced crack width is obtained, the specimen is subjected to pull-out loading. Figure 8 shows the general setup for the pull-out test. Before loading, the excess part of the aluminum pipe located at the loading end was cut off. Then the specimen was placed on the fixed head cross of the universal testing machine and subjected to monotonic pull-out loading at a speed of 0.5 mm/min. A Teflon sheet was placed between the specimen and the bed steel plate to reduce the influence of a possible restraint of concrete lateral deformation by friction at the bed steel plate. During the test, the pull-out load on the tested rebar and the slip measured at the free end rebar were recorded. Moreover, the opening of induced crack was monitored by two π type LVDT placed on the specimen top.

3. Experimental Results

All experimental results are summarized in Table 2. The detail will be presented in the following subsections.

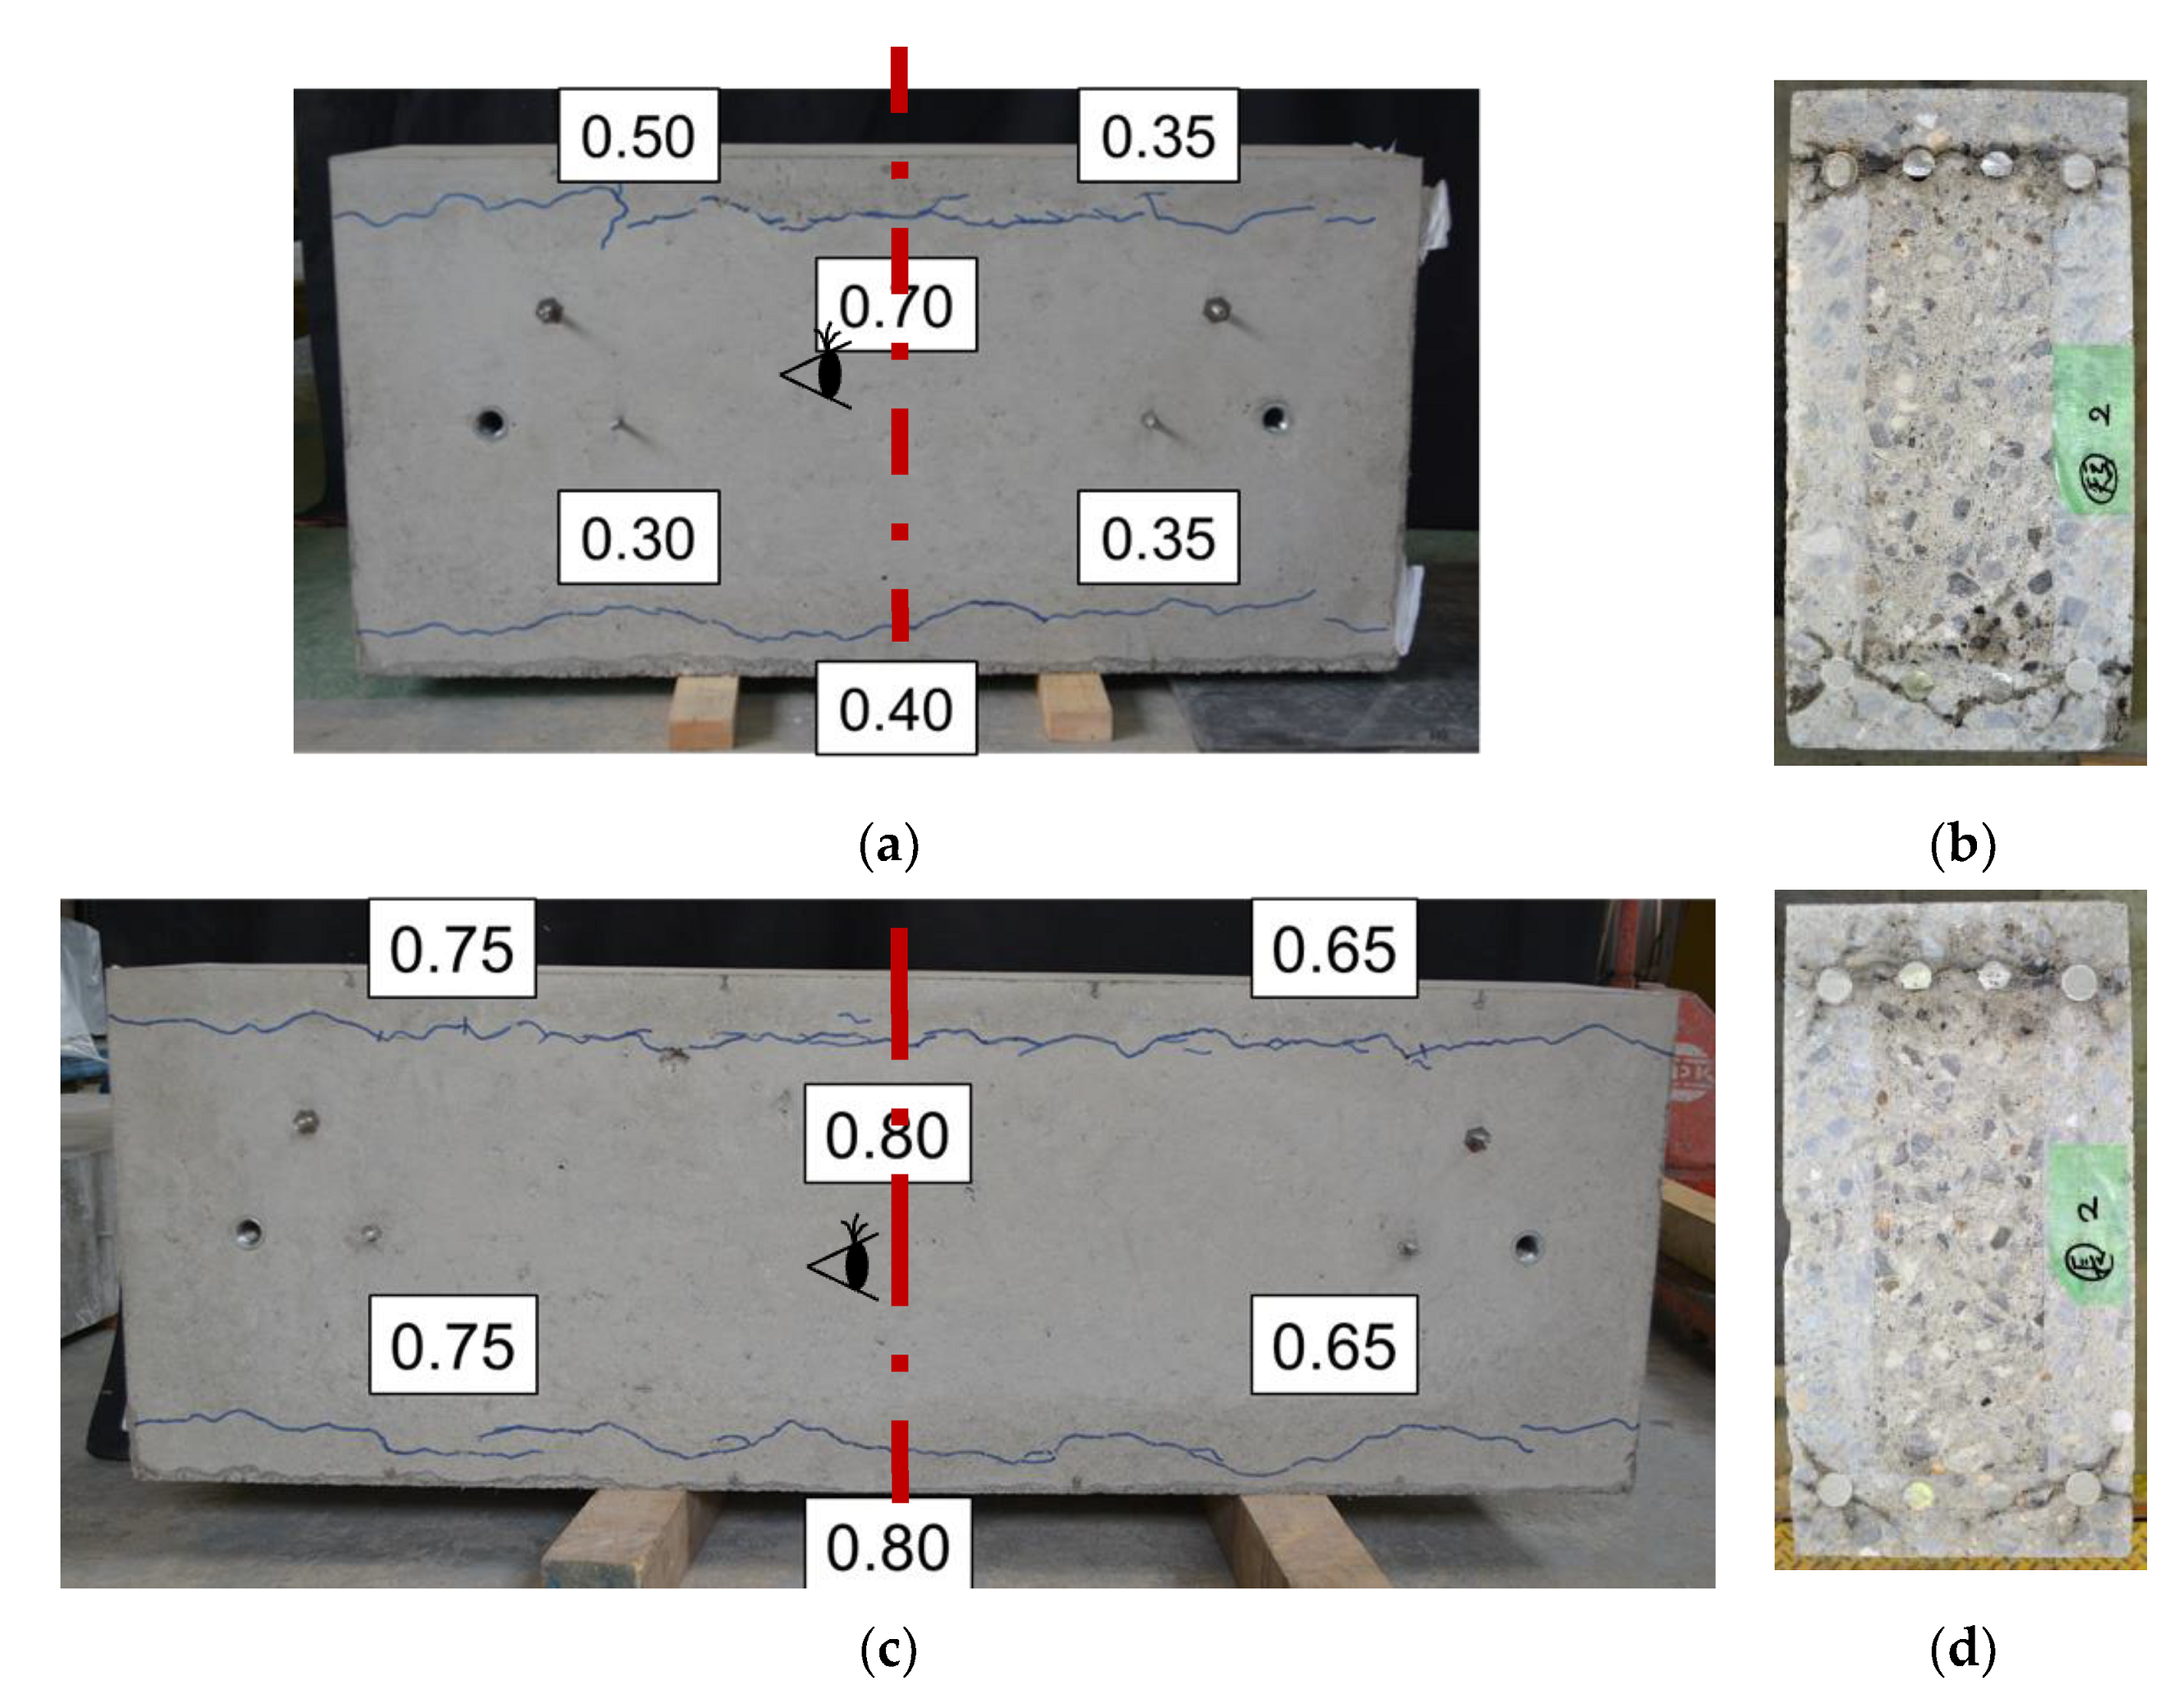
3.1. Crack Simulation by EAFP

Figure 9 shows an example of crack patterns simulated by EAFP. The side-splitting cracks took place in all specimens. After filling the expansion agent, the crack width keeps growing over elapsed time. Using a crack scale, we measured the crack width located around the free end of the rebar (Figure 9b). This face represents the top of the specimen when placed on the loading machine. The crack on the top was identical to one on the opposite side (bottom of the specimen); however, the width of the cracks on the other sides (Figure 9a,c) almost double. Once the target crack width is obtained, the specimen is immediately loaded. To assess the impact of induced crack on the bond, this study considered the maximum crack width on the top of the specimen. Their widths range from 0.15 to 0.95 mm in S0 specimens, from 0.15 to 1.40 mm in S1 specimens, and from 0.15 to 0.70 mm in S2 specimens. Table 2 also shows the maximum induced crack width before pull-out loading in every specimen.

3.2. Results of the Pull-Out Test
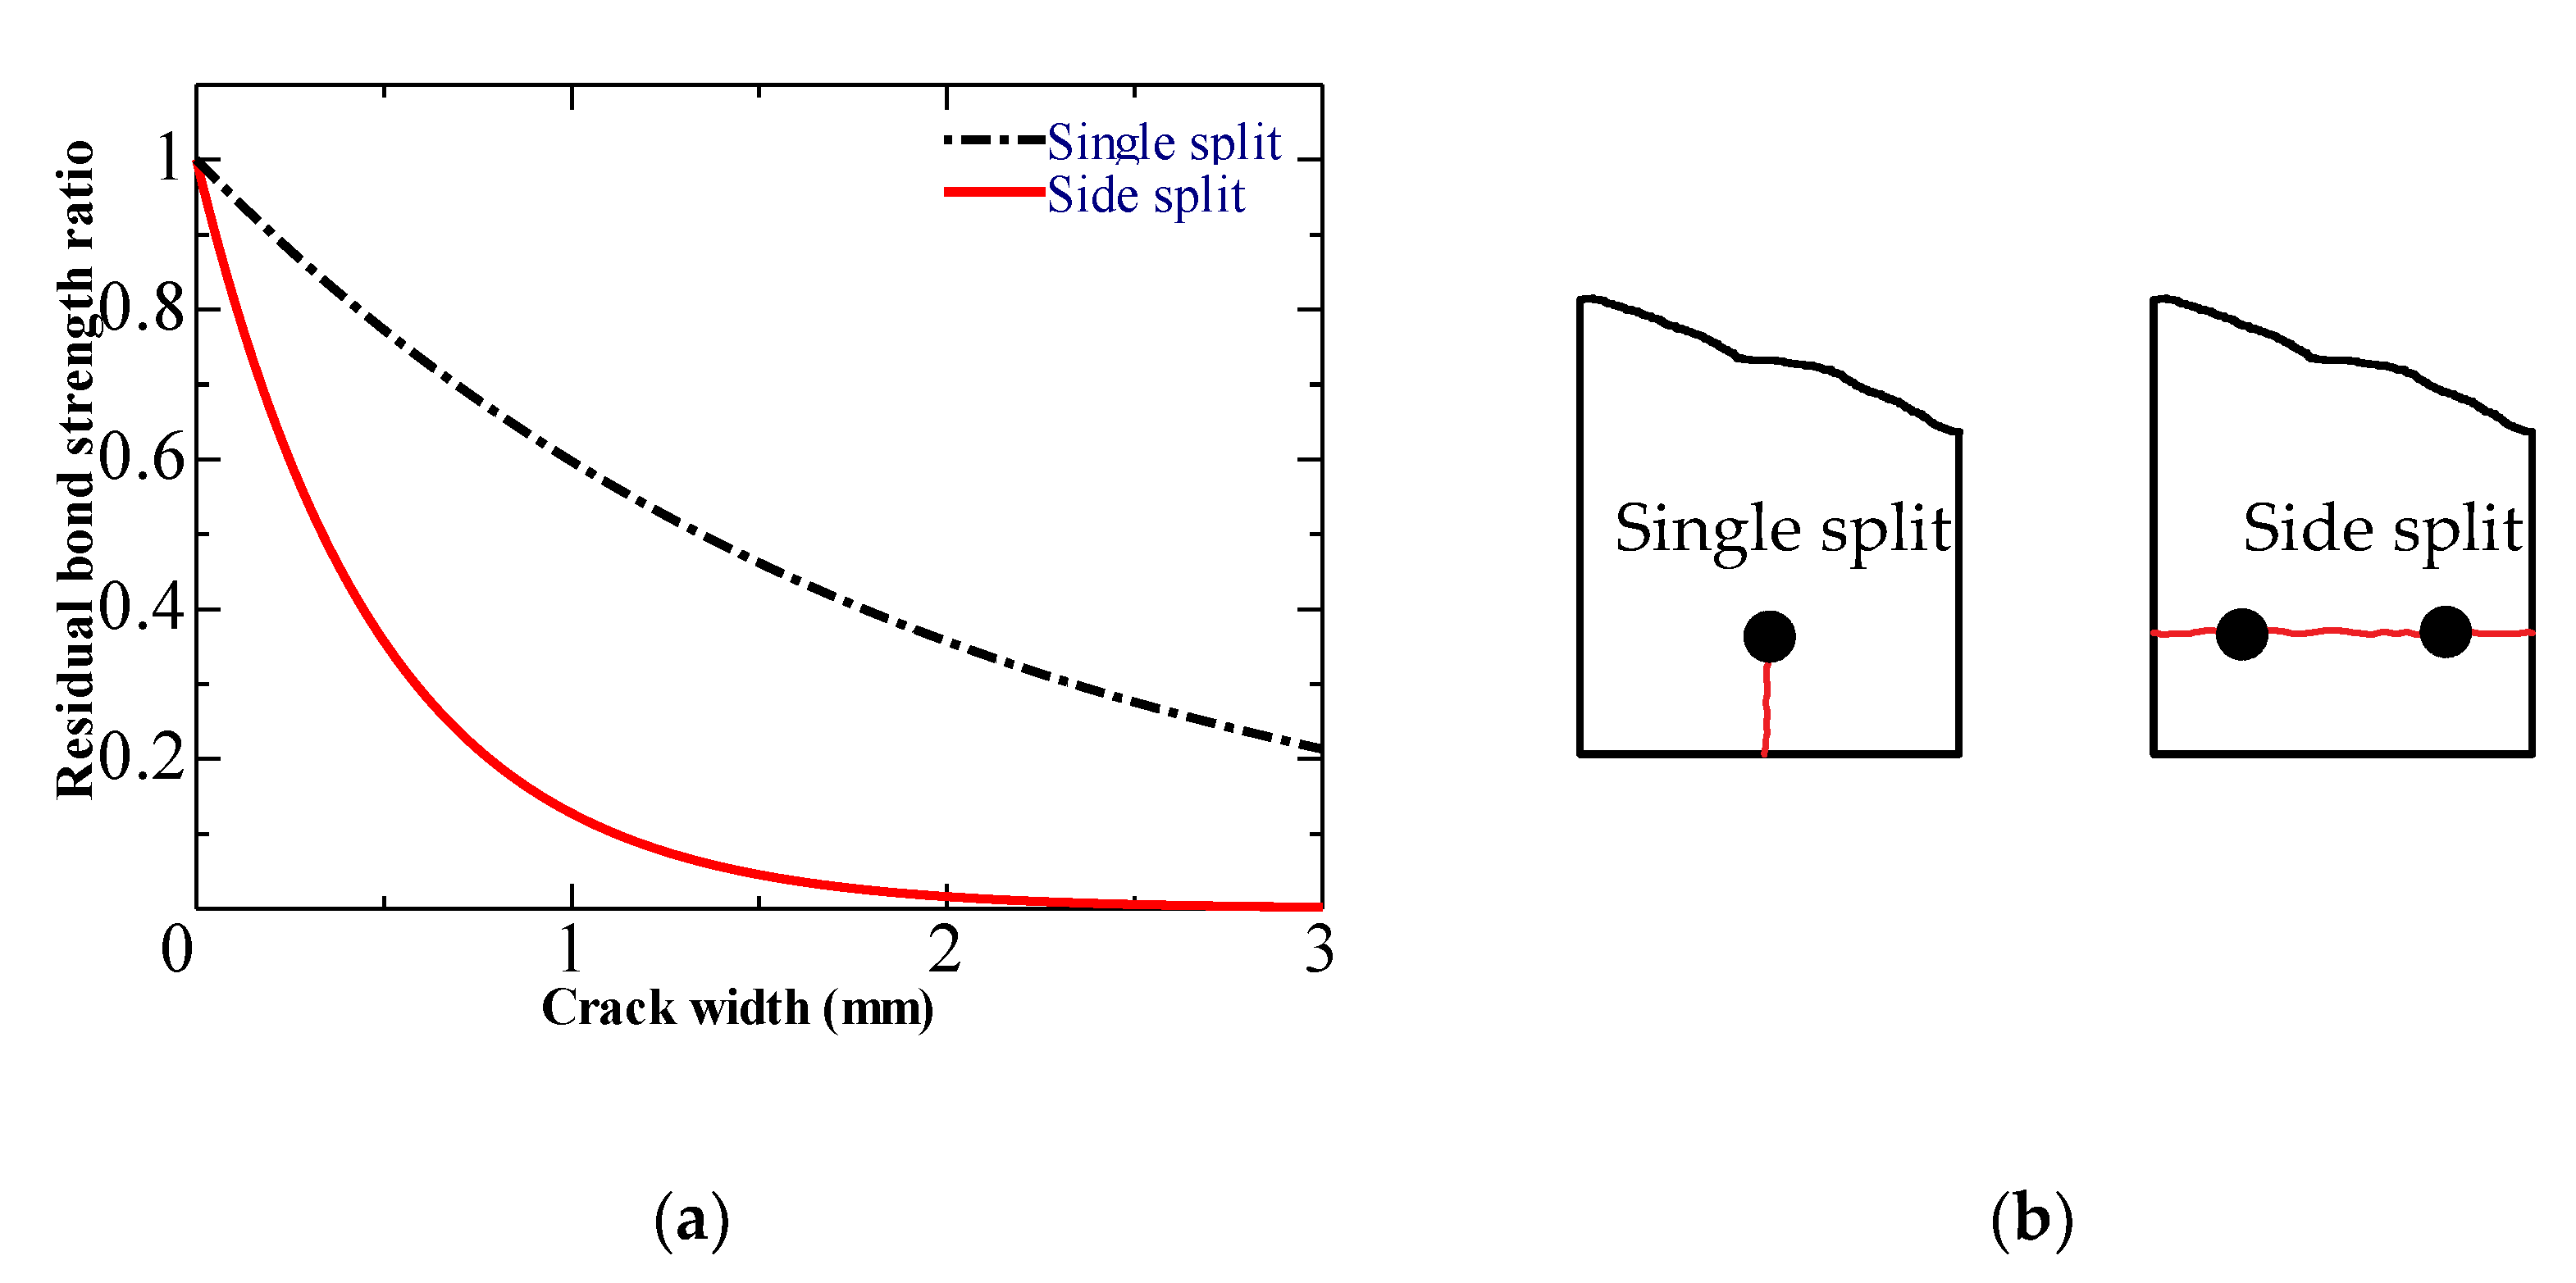
3.2.1. Failure Mode

Figure 10 shows the examples of specimens before and after loading. All specimens experienced failure due to the splitting of the concrete. A group failed by a newly splitting crack generated before failure in the plane of the longitudinal axis of the bar toward the cover side (namely, “face split”). Furthermore, others failed by widening side split induced crack by EAFP (namely, “side split”). After developing a splitting crack, the load quickly decreased in specimens without stirrup (Serie S0). However, in specimens with stirrup (Series S1 and S2), the drop is smoother load with the increase of slip. This can be simply explained by the fact that the stirrup restrained the development of cracks.

3.2.2. Bond Stress and Slippage

According to the employed short bond length, we can first assume that the bond stress is uniformly distributed along the bonded section. Therefore, Equation (2) estimates those stresses with the pull-out load. Secondly, the tested rebar remains in its elastic domain due to a relatively small pull-out load. Consequently, the measured slip estimated the local slip in the focus bond length because the slip at the free-end and loaded-end are almost identical.
τ = P π d l
where P is the pull-out load, d is the diameter of the rebar, and l is the bond length.
Figure 11 shows a comparison of bond stress-slip relationships for specimens with the similar induced crack width. The results indicated almost linear relationships between load and slip till the bond strength. Then, the load continuously drops with the increase of slip. In addition, no significant correlation was found between the slip at maximum load and the induced crack width. However, in the same induced crack width, the confined specimen gives higher slip at bond strength.
Moreover, stirrup can reduce bond strength degradation due to induced cracks and impact post-peak behavior. The bond stress in specimens without a stirrup (S0) suddenly drops after its peak because of the abrupt splitting of the concrete cover. However, in a specimen with a stirrup, this splitting crack was controlled. Thus, those specimens show ductile behavior.

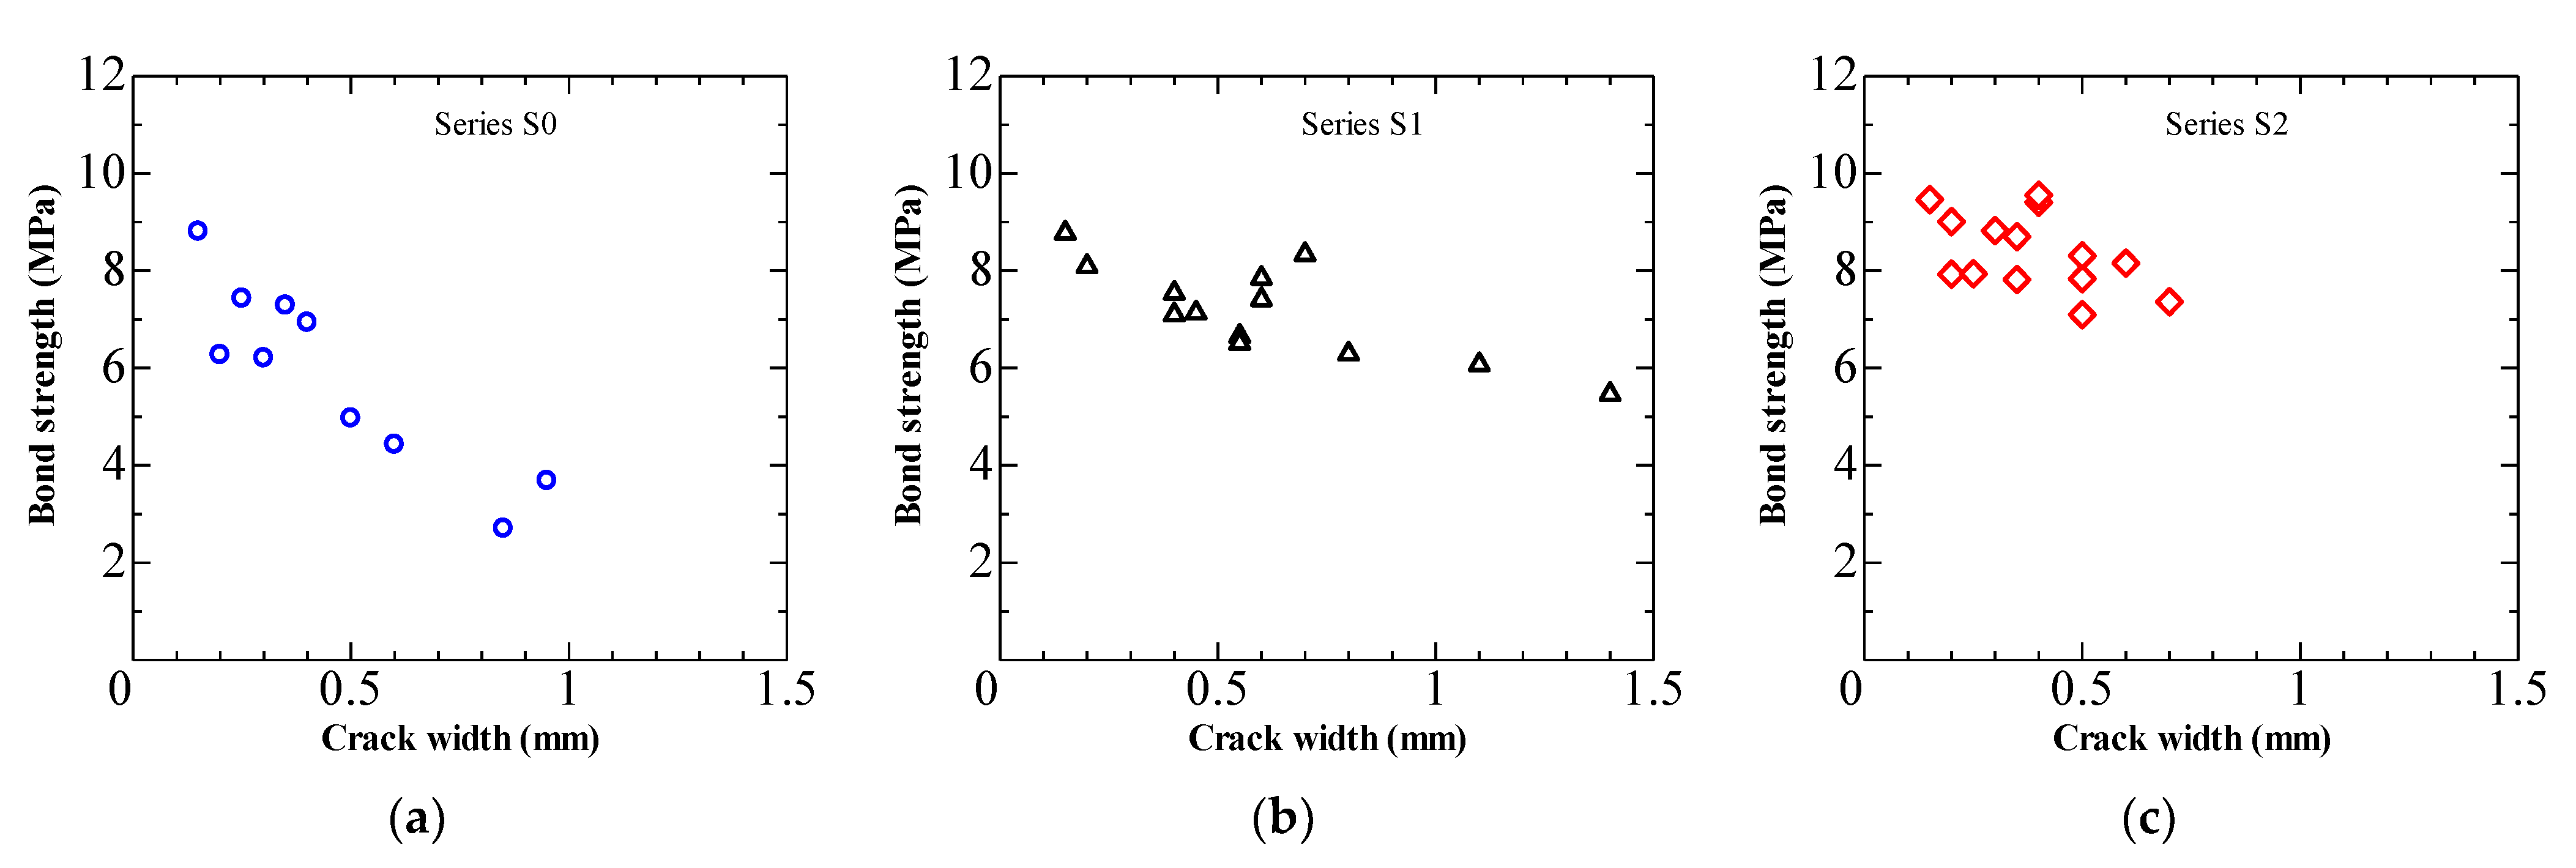
3.2.3. Bond Strength in Cracked Specimens

Figure 12 summarizes the relationships between the bond strength (bond stress at maximum pull-out load) and induced crack width. The bond strength tends to decrease when the crack width increases. As expected, a significant correlation between bond strength and induced crack width can be seen from this result. The bond strength degradation caused by induced cracks is more severe in specimens without stirrups than with stirrup. For specimens with stirrups, the stirrups restrain the bond deterioration, limiting the bearing action between the rebar rib and concrete. Moreover, the bond strength can be atypically greater for S1 cracked specimen than for S2. A possible explanation for this might be that the internal induced crack condition (pattern or width) can differ to the measured surface crack.

4. Evaluation of Bond Strength Degradation in Cracked Specimen with Stirrup

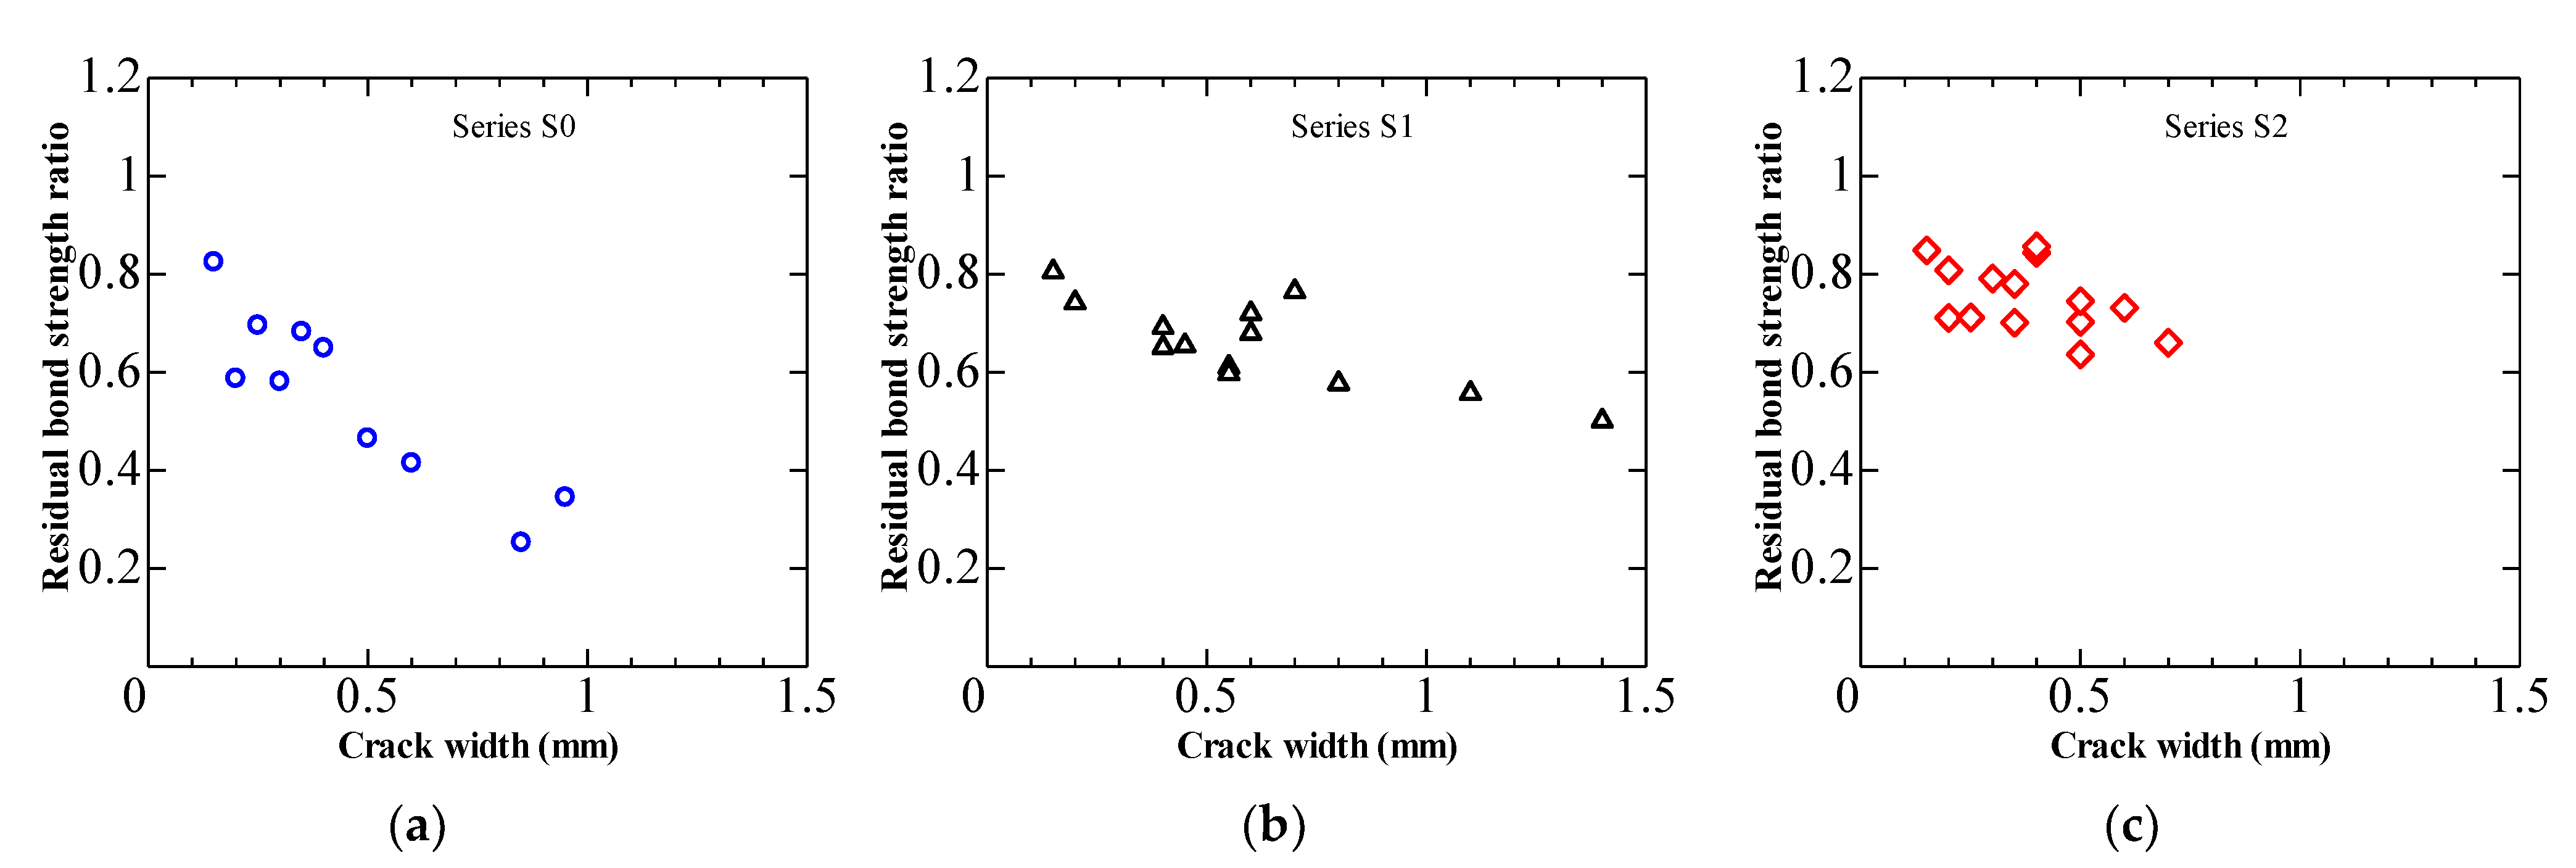
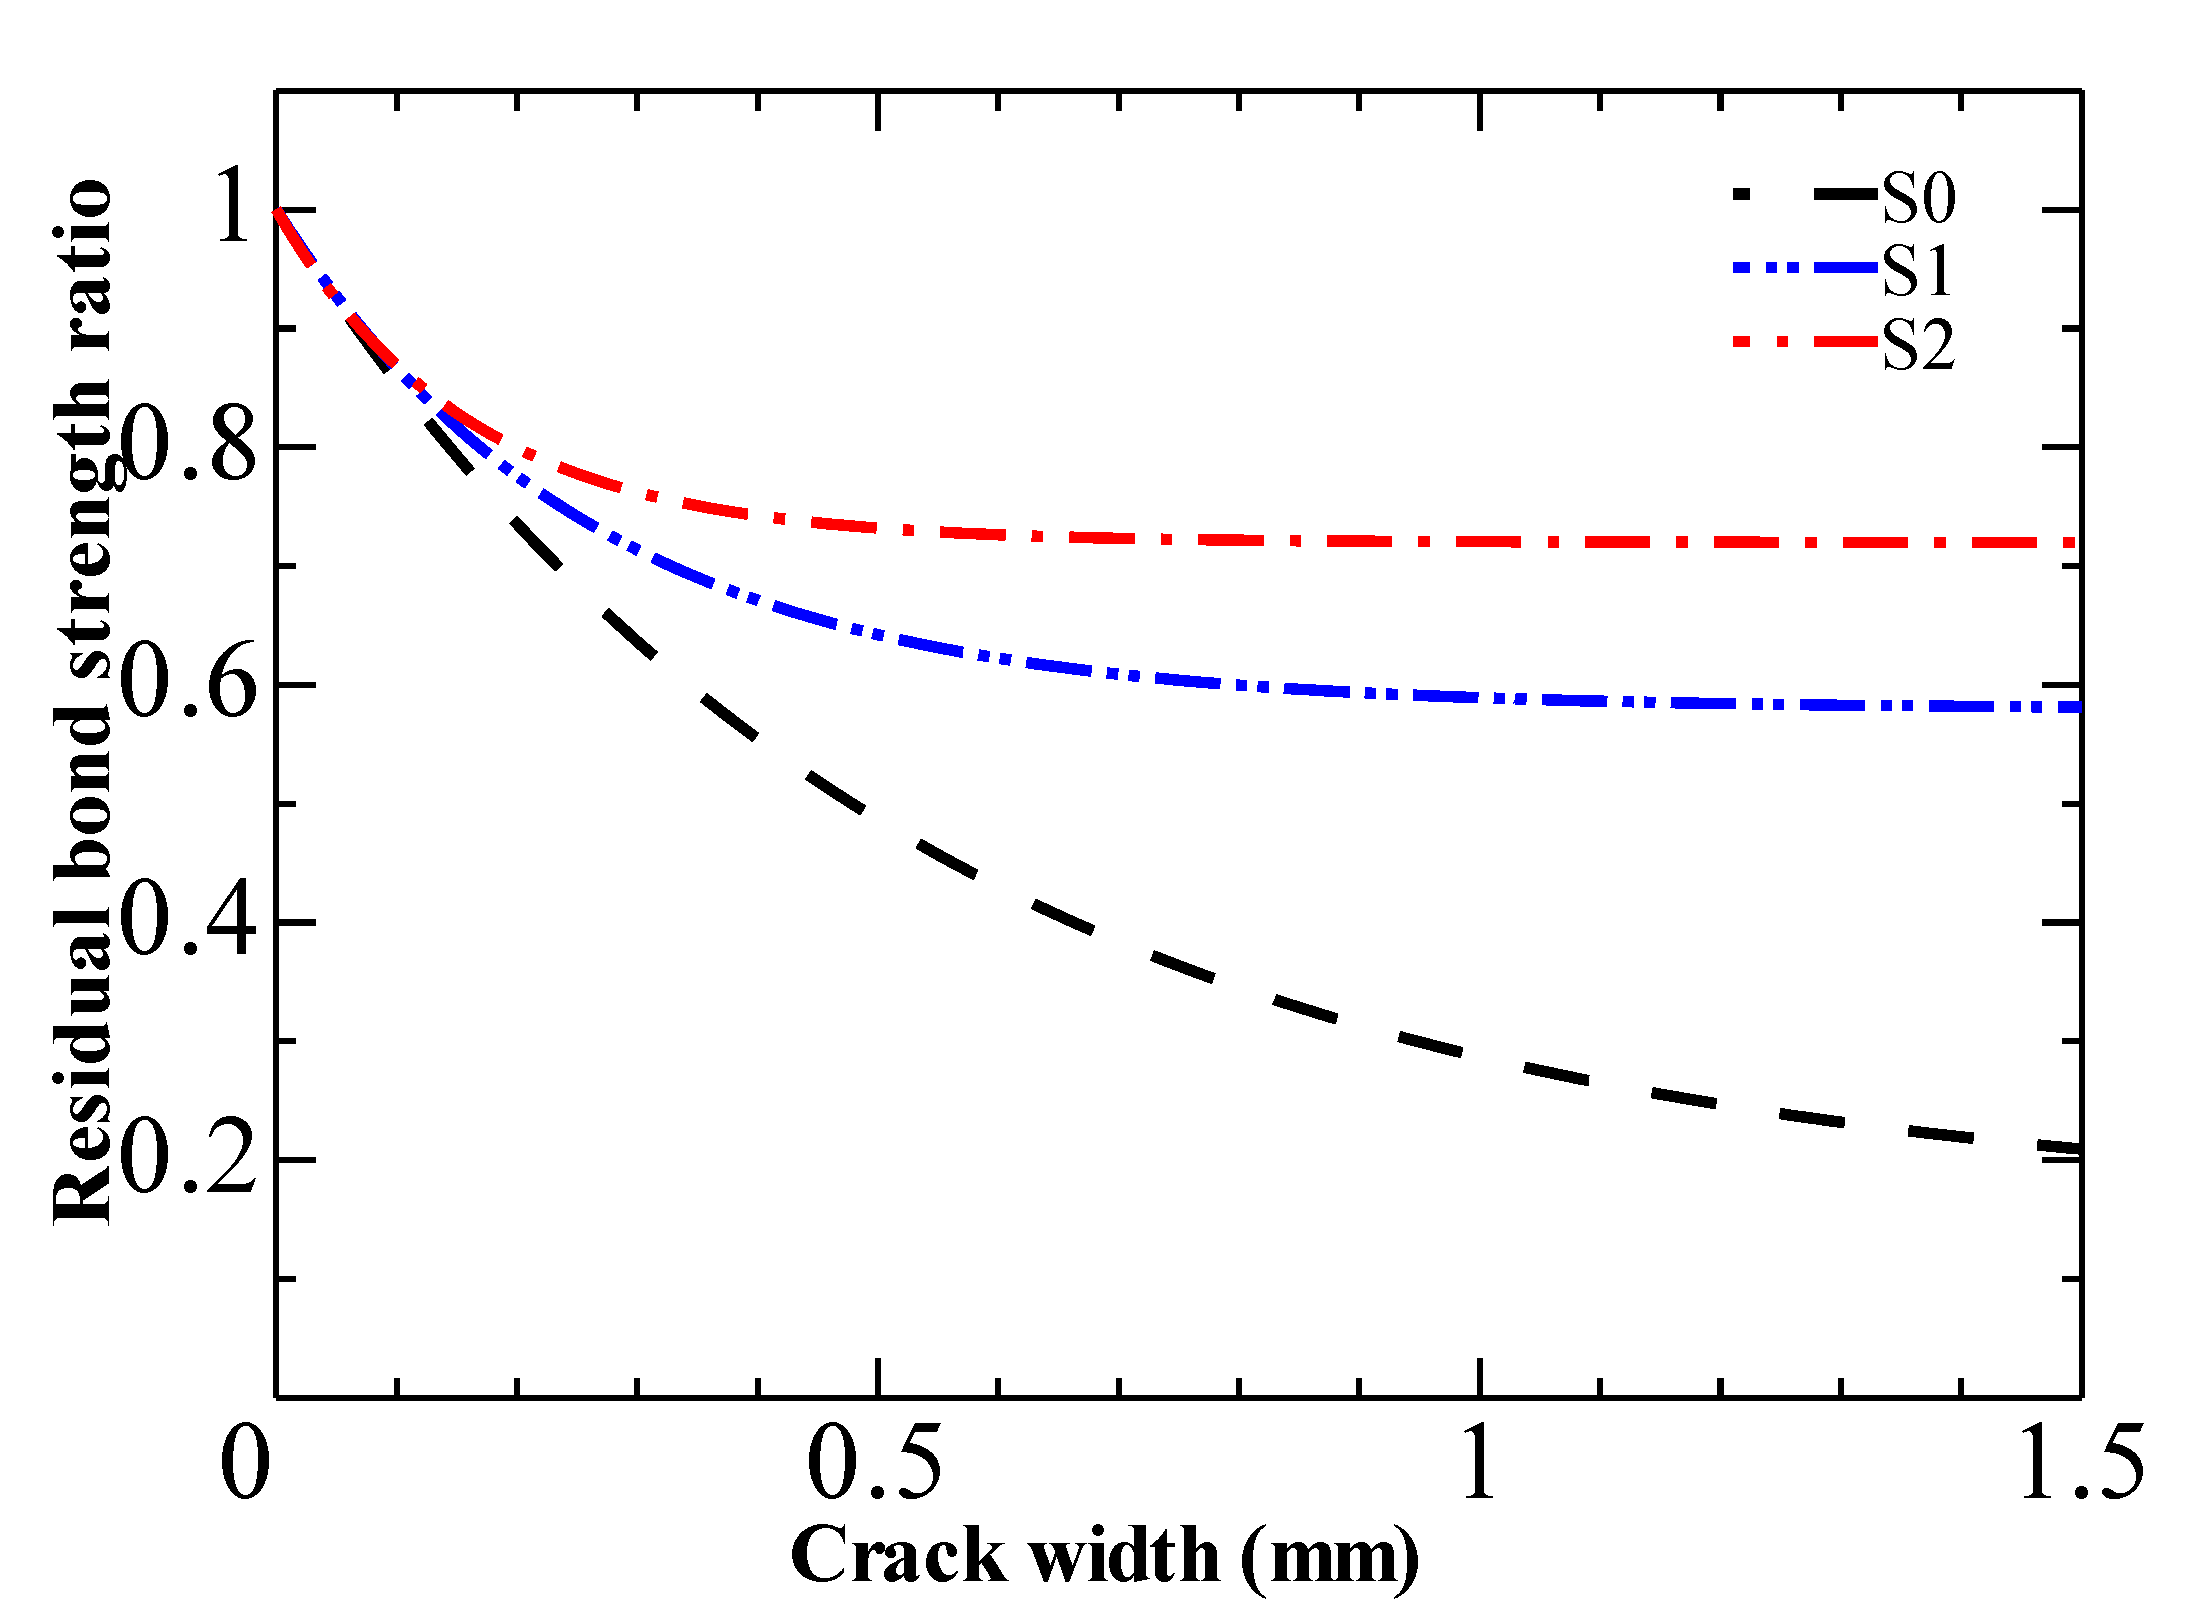
4.1. Bond Degradation and Surface Crack Width Relationship

In this paper, we used the residual bond strength ratio (RB) to evaluate bond degradation. It is the ratio of the bond strength of a cracked specimen to that of the uncracked specimen. Assuming that the splitting surface is in the entire embedded bar length, Equation (3) [32] is used to calculate the bond strength of uncracked specimen without stirrup (S0):
τ b , m a x = 0.601 σ t r u d b cot α
where, τb,max: bond strength, σt: tensile strength of concrete, ru: C + db/2, db: diameter of the rebar (19 mm), C: the thickness of cover concrete, α: the angle between the longitudinal axis and splitting force (=30 degrees).
On the other hand, the bond strength for uncracked specimens with stirrup (S1 and S2) is calculated by the Equations (4) and (5) reported in a previous study [33]:
τ b , m a x = σ l cot θ
σ l = 0.018 b p w N d b h l w e E S t σ B
where, τb, max: bond strength, σl: lateral confinement stress, θ: angle between the longitudinal axis and principal bond stress, db: the diameter of the rebar (19 mm), b: width of specimen, pw: stirrup ratio, h: rib height of the rebar, N: number of rebar (=1), lwe: bond effective length of stirrup (9 times diameter of stirrup = 90 mm), Est: elastic modulus of stirrup, and σB: compressive strength of concrete.
The calculated bond strengths of uncracked concrete are 9.86 MPa, 10.92 MPa, and 11.78 MPa for S0, S1 and S2 specimens, respectively. Figure 13 displays the relationships between residual bond strength ratio and crack width. One aim of this study is to explore the relationship between bond degradation and induced crack width. To build this model, various studies have assessed the efficacy of exponential fitting to provide better correlation [15,18,34].
The following equation form evaluates the degradation of the bond by regression analysis:
R B = 1 a 1 e b w c r
where, a and b are empirical coefficients, wcr is the induced crack width in mm.
Table 3 shows the result of regression analysis, and Figure 14 compares the three obtained formulas for S0, S1, and S2. Until a crack width of 0.15 mm, the stirrup does not much influence bond degradation due to induced crack. This fine crack was still able to transmit the load from the bar to the surrounding concrete. However, when the crack width is more than 0.15 mm, the stirrup can restrain the opening of the induced crack and limit the bond deterioration in S1 and S2. After cracking, the stirrups provide valuable confinement of the concrete. The opening of the crack was inhibited by stirrups, which can increase the residual tensile strength of concrete. The advantageous impact of stirrups on the bond strength degradation due to induced crack is well reflected.

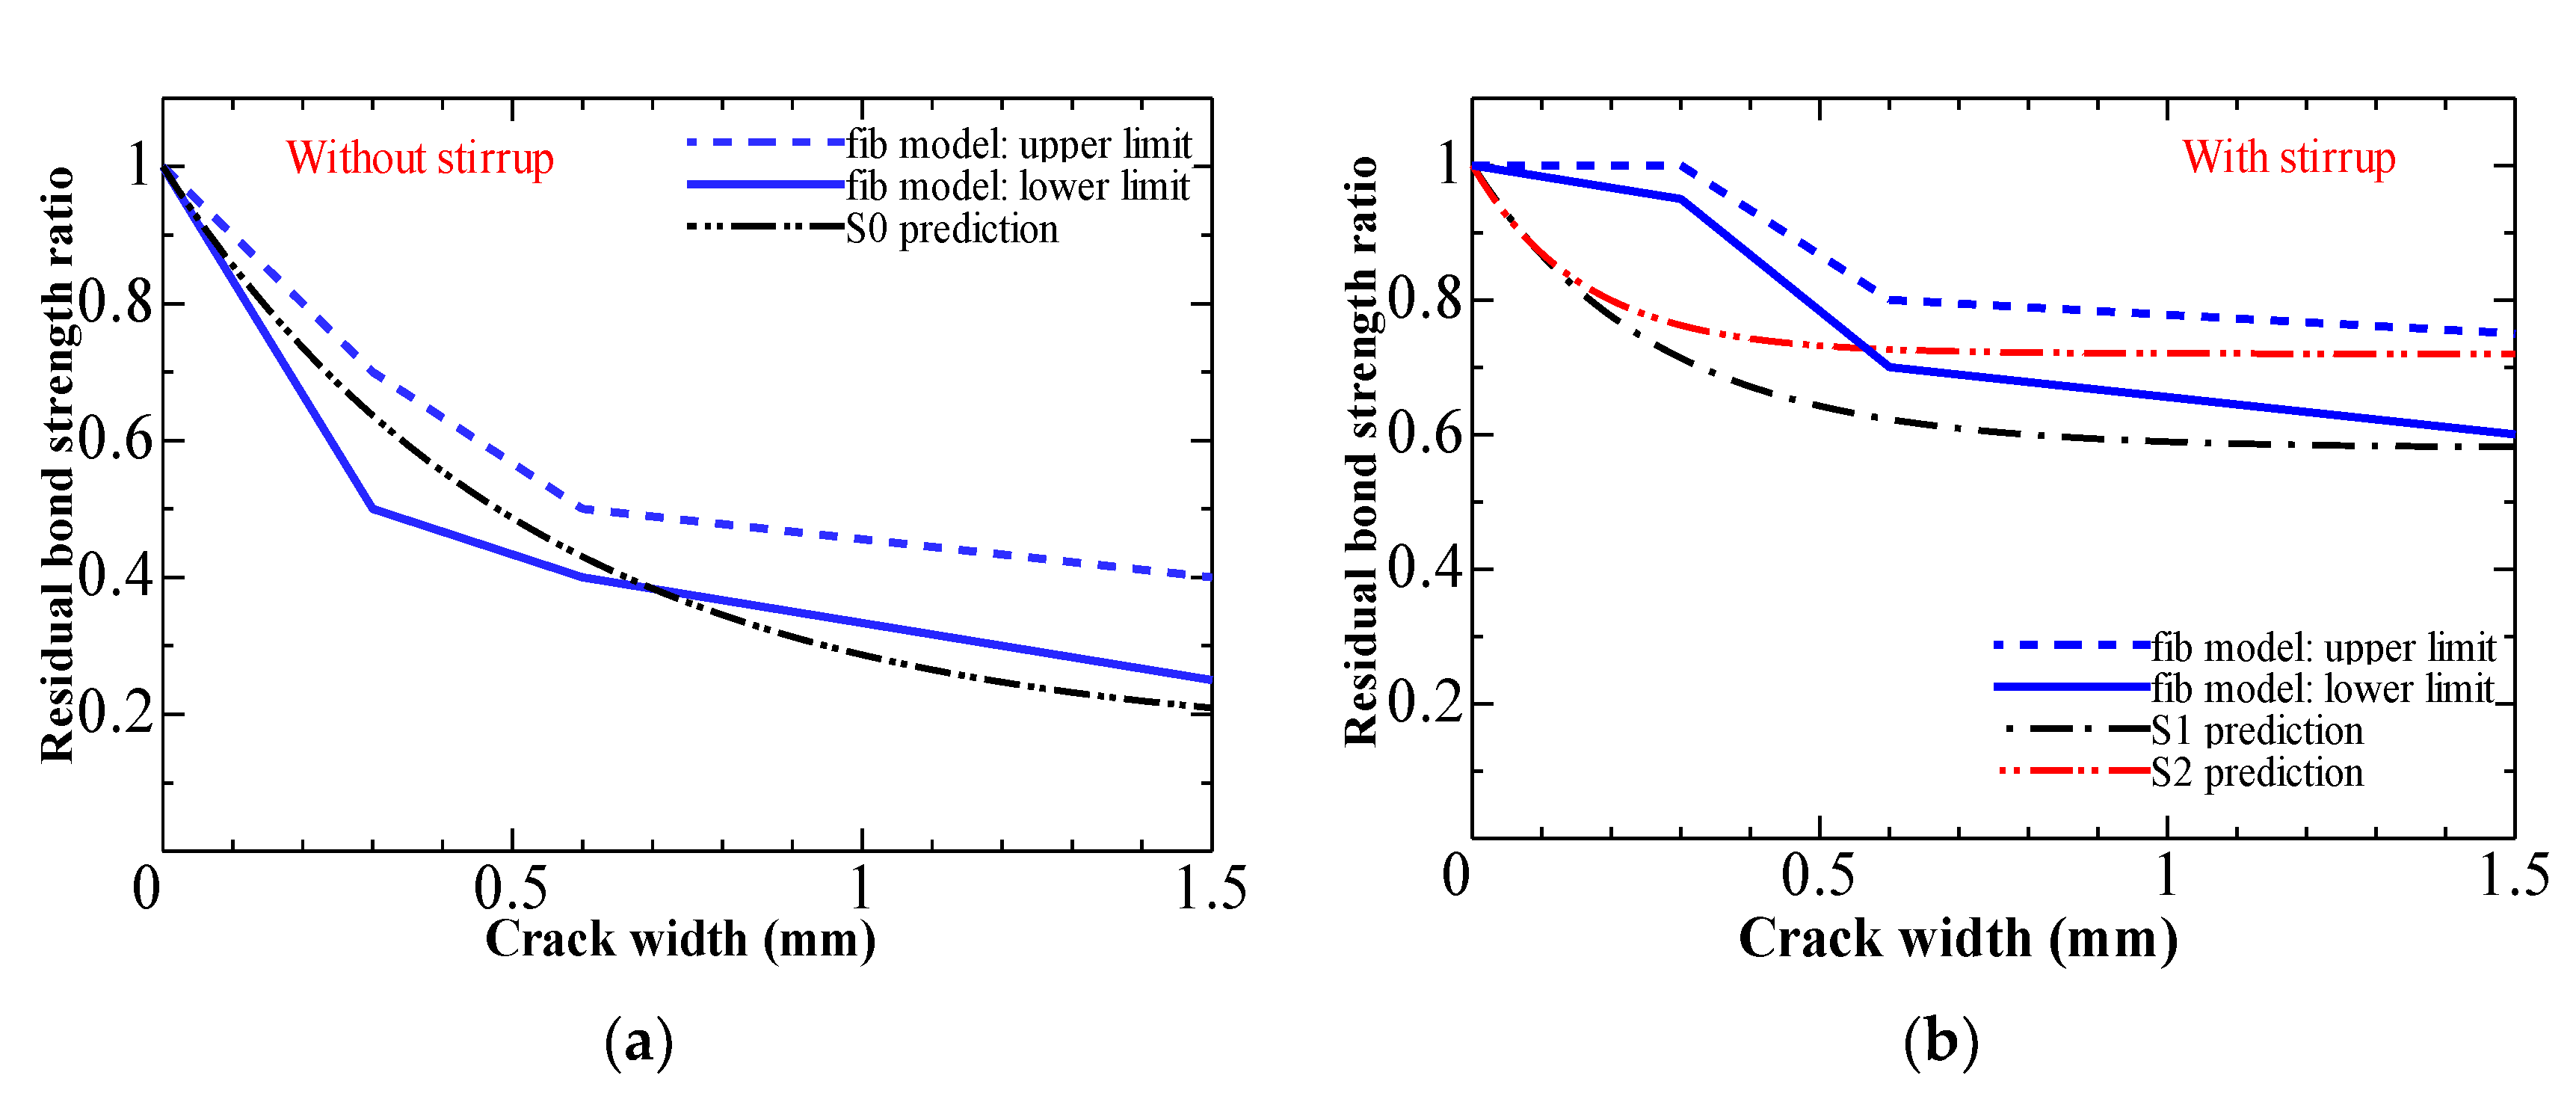
4.2. Comparison of the Test Results with Fib Model

The fib Model Code 2010 [35] has introduced the reduction in bond strength depending on the surface crack width (hereafter, called the fib model). It suggests the variation of the residual bond strength for a specific range of surface crack width. We plot the degradation range versus the median values of the crack width range to illustrate the upper and lower limit of the bond degradation shown in Figure 15 with the three proposed formulas for S0, S1, and S2.
In specimens without stirrup Series S0, the fib model is in good agreement with our prediction when the induced crack width is smaller than 0.7 mm. However, the fib model gives minor overestimations for the specimens with crack widths bigger than 0.7 mm.
The fib model overestimates our model in specimens with stirrup when the induced crack width is inferior to 0.6 mm. Several reports have shown that bond strength increases in corroded specimens without induced crack [9,12,22,28]. In cracked concrete with a stirrup, it can thus be suggested that the bond strength is higher for corroded rebar (with rust) than sound rebar. On the other hand, when the crack is bigger than 0.6 mm, the Series S2 model agrees well with the fib model. However, our prediction for Series S1 is slightly underestimated. The recommendations of fib model indicate only the presence or absence of stirrups (links), without pointing out the impact of their ratio on bond degradation. Therefore, these variations are likely related to the fact that the fib model does not take the stirrup ratio into account.
Our results also seem consistent with other research, which found that in unconfined concrete, the corrosion-induced crack is more dominant than rebar profile change [21,22]. However, this may not be applicable in corroded specimens with stirrup.

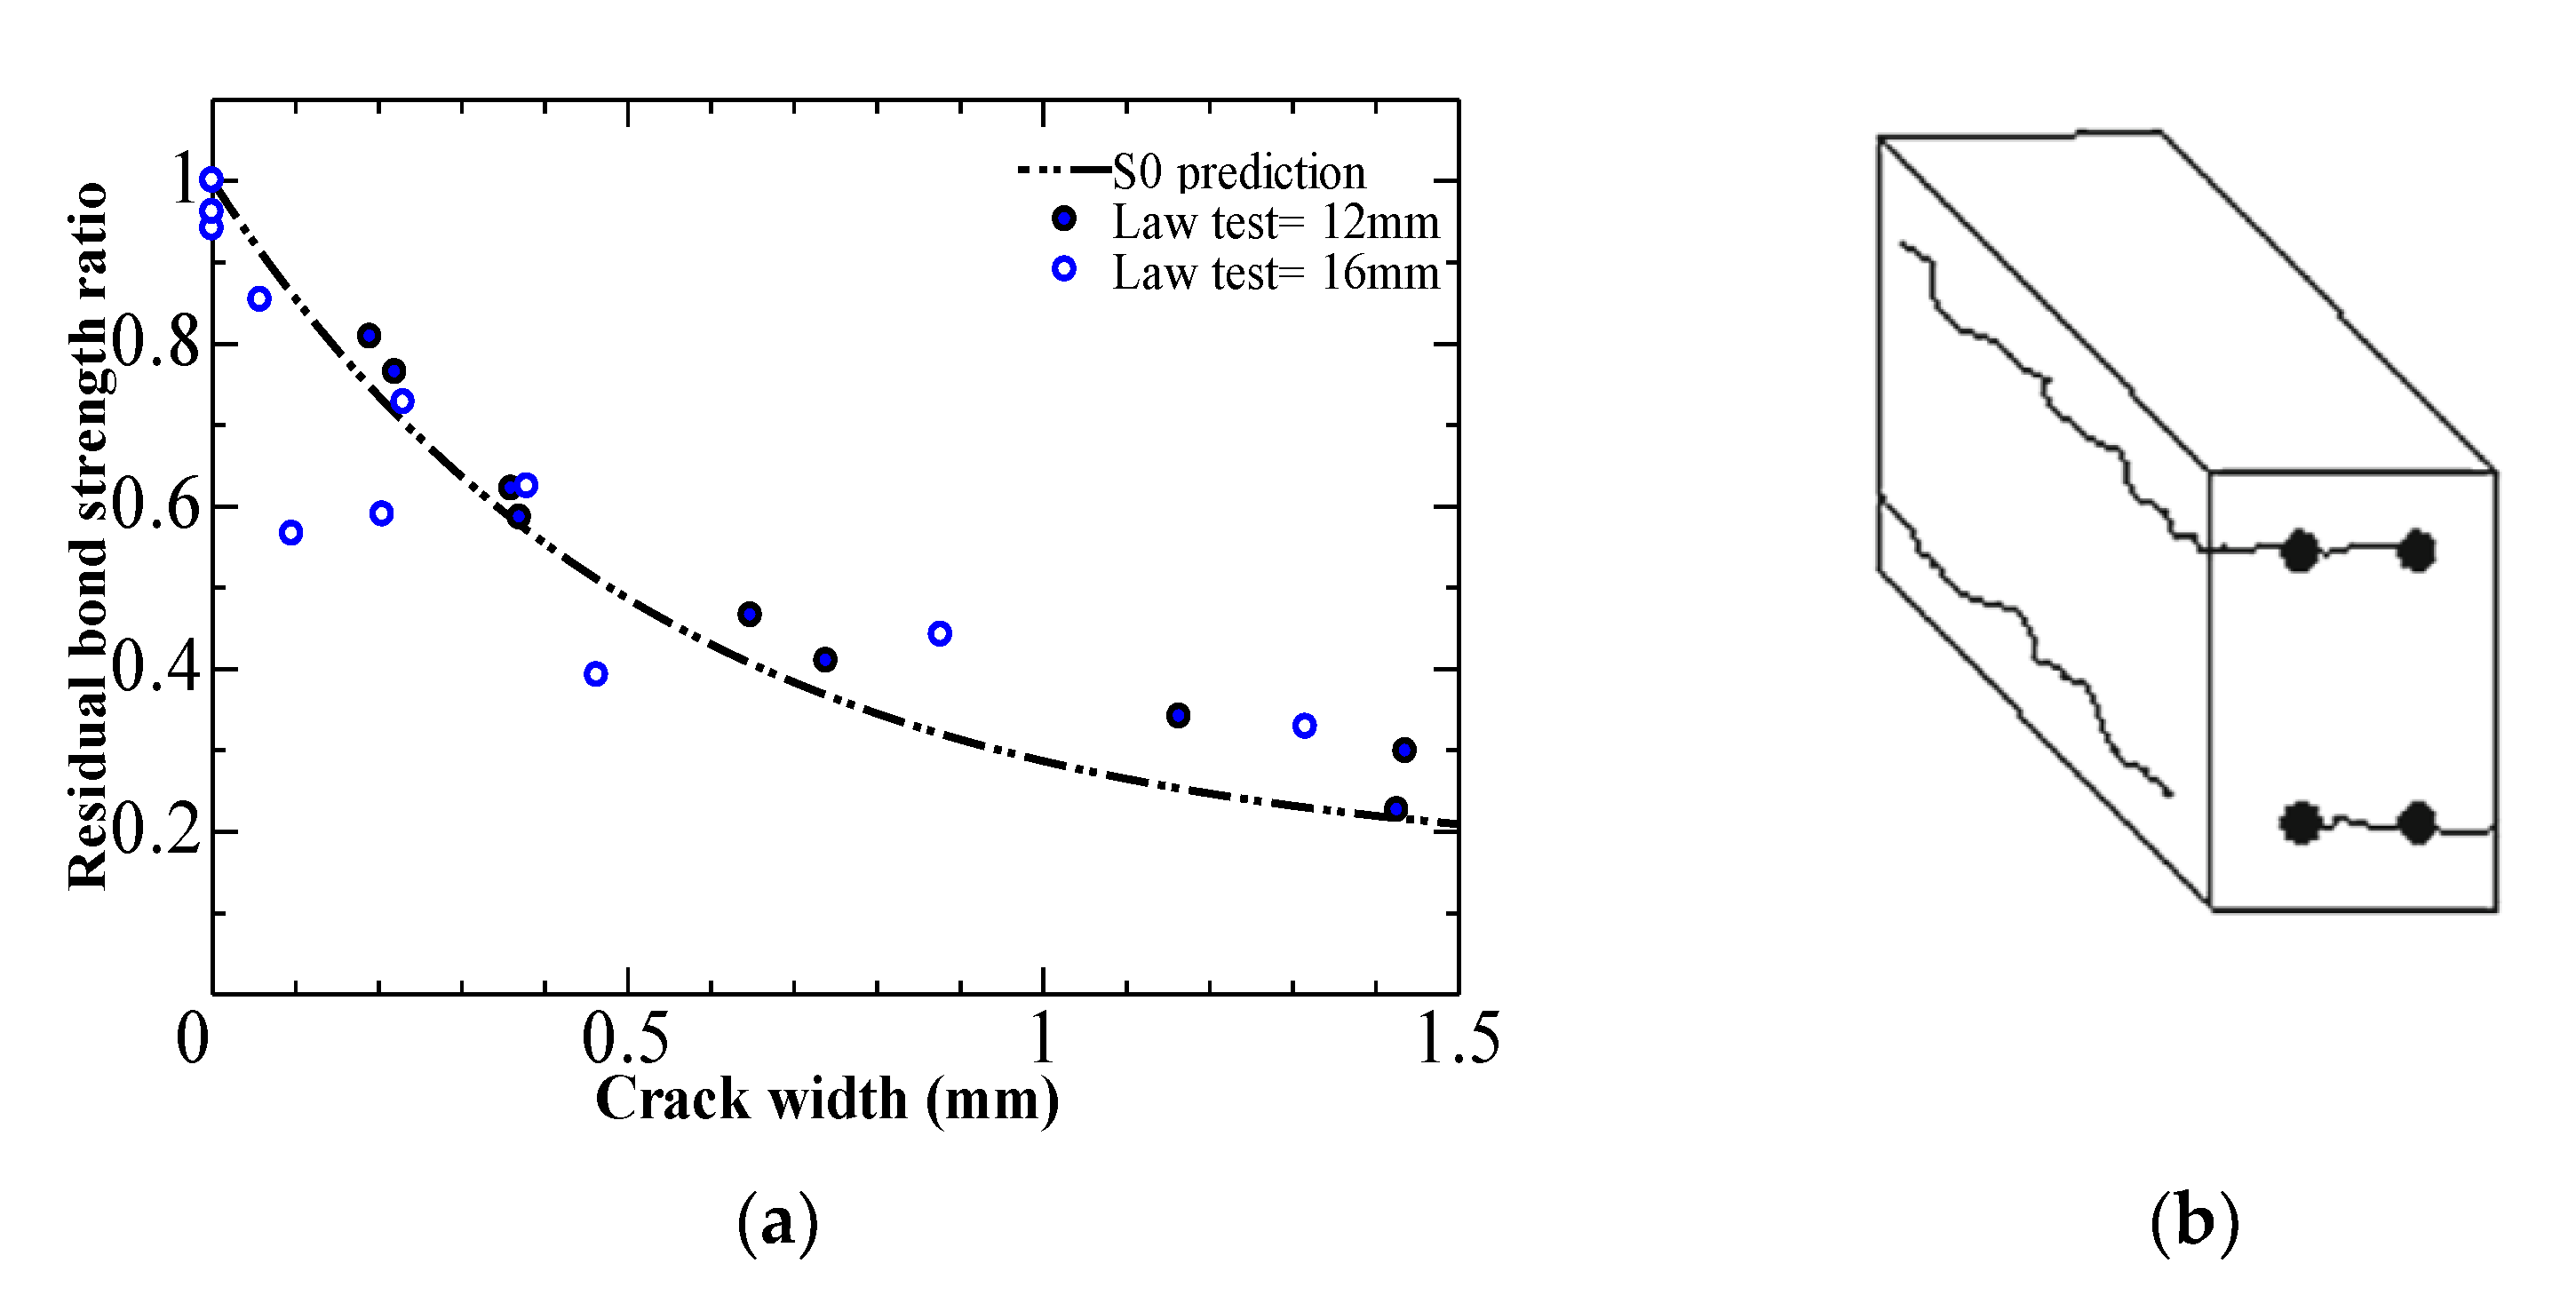
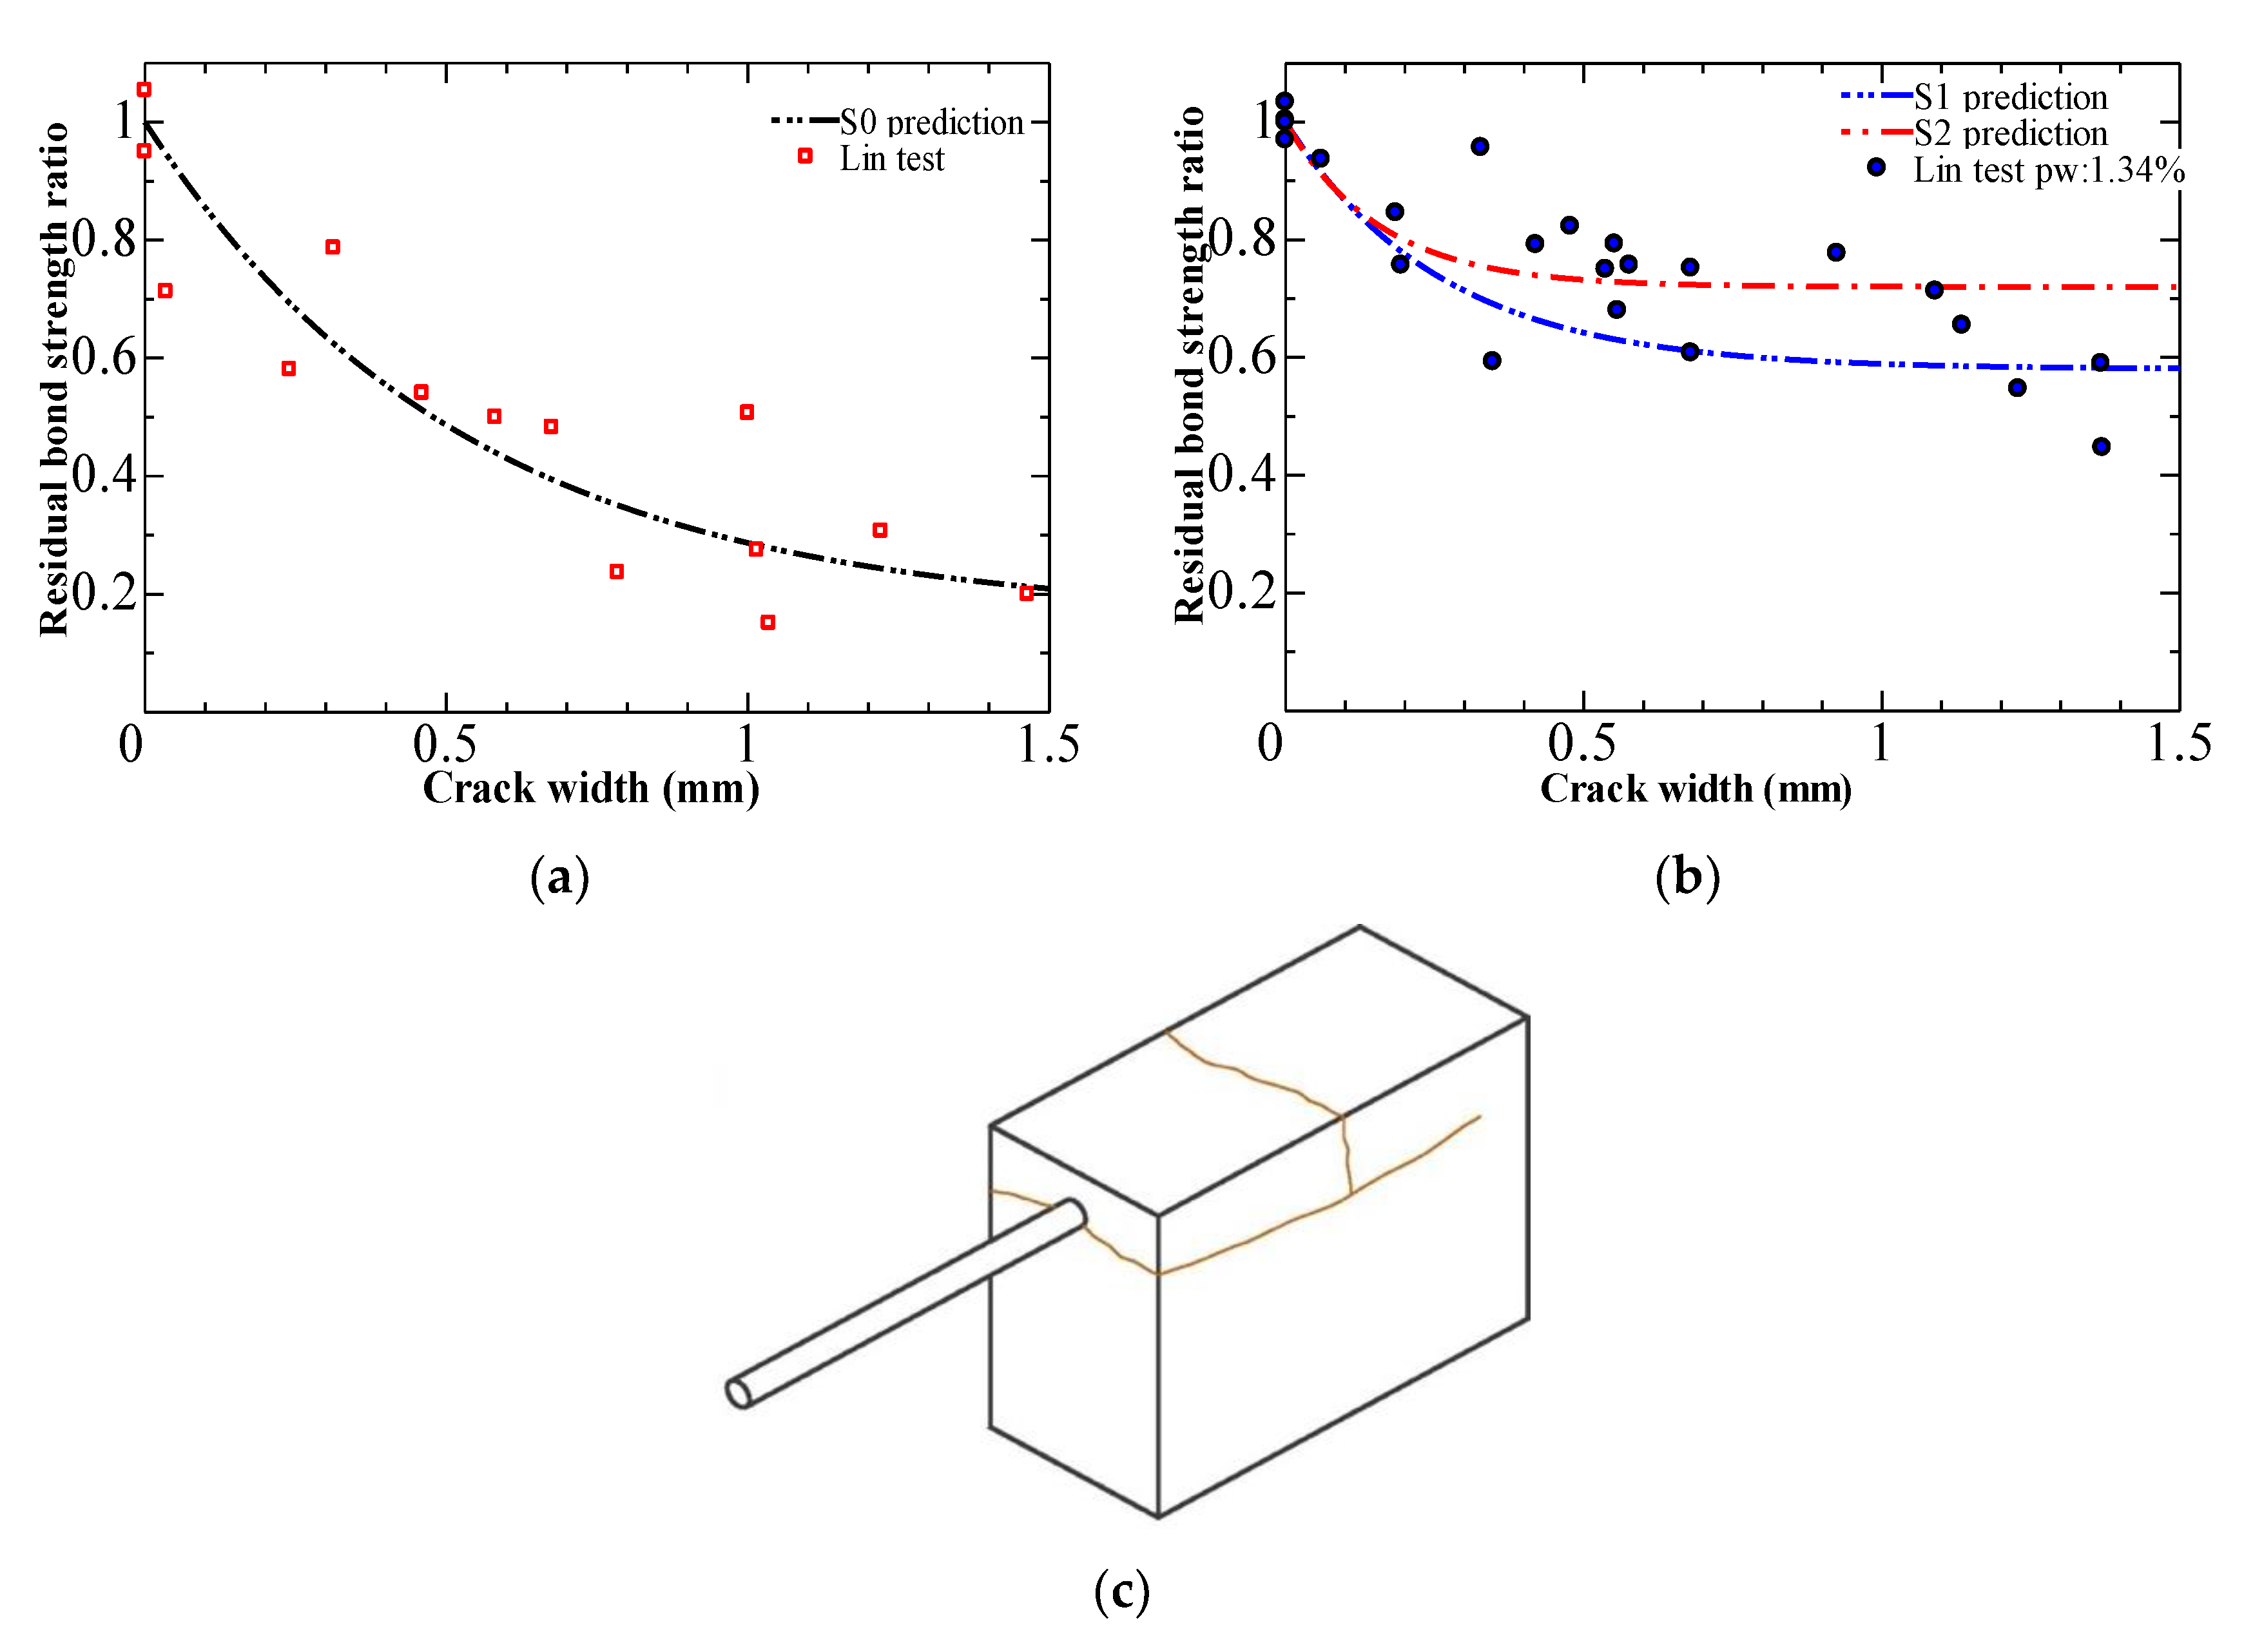
4.3. Comparison of the Proposed Formulas with Experimental Results in the Literature

To validate the effectiveness of the proposed formula, the predicted bond strength in cracked concrete is compared with the experimental data available in the literature.
Figure 16a shows the comparison of our prediction for specimen without stirrup (S0) with test results by Law et al. [16]. Beam end specimens which had a dimension of 200 mm × 200 mm × 300 mm, were used in pull-out test. Two types of rebars with a diameter of 12 mm and 16 mm were employed, and the concrete cover (3D) was 36 mm and 48 mm respectively. An example of corrosion-induced crack patterns from Law et al. can be seen in Figure 16b. The coefficient of variation of the ratio of the predicted bond strength to the tested bond strength is calculated. With a coefficient of variation equal to 12%, it can be clearly noted that the predicted curves are close to the experimental results in most cases.
In the studies by Lin et al. [13,15,29], pull-out tests were carried out in corroded specimens with an induced crack pattern similar to those modeled in the present study. Figure 16b shows an example of corrosion-induced crack patterns from Lin et al. The test is performed on eccentric pull-out specimens with a 20 mm diameter rebar and different concrete cover. Only the main rebars were electrically corroded in these specimens without and with stirrup (stirrup ratio of 1.34%). Also, the residual bond strength and the induced crack width were reported. In Figure 17a,b, the models are compared with Lin et al. In Lin’s specimens with stirrups, the number of stirrups is equal or superior to two. Therefore, the S2 prediction is adopted for expressing the coefficient of variation. Our proposed formulas in this study generally agree well with the tested bond strength in the literature with a coefficient of variation equal to 14% and 17% in specimens without stirrup and with stirrup, respectively. The bond degradation trend in specimens with corrosion-induced cracks can be well approximated. Also, the beneficial influence of stirrups on the bond strength in cracked concrete can be well reflected.
Our bond degradation formulas remained primarily on the safe side compared with the fib model and previous studies. It also demonstrated that the crack induced by EAFP could express the net quantity of damage due to corrosion. Since the surface crack width is the most visible manifestation of damage due to corrosion, it is convenient to directly link with a damage indicator that can be easily measured. Despite these promising results, questions remain on the influence of the rebar section change or rust accumulation due to corrosion. In future investigations, it might be possible to evaluate the effect of corroded rebar in concrete cracked by EAFP.

5. Conclusions

This study was designed to determine the effect of stirrup on the bond strength between cracked concrete and rebars. From the pull-out test of 36 specimens, the combined effects of induced crack width and stirrups ratio on bond strength were investigated. Finally, to evaluate bond strength in cracked concrete, empirical formulas based on induced crack width were proposed. The following conclusions can be drawn:
(1)
By restraining the induced crack widening, stirrups can significantly limit the bond strength degradation in cracked concrete.
(2)
While ignoring the ambiguity related to corrosion product or rate, crack induced by EAFP can quantify the net amount of damage due to corrosion.
(3)
The coefficient of variation is 12% for specimens without stirrup from Law et al. And for specimen without and with stirrup from Lin et al., the coefficients of variation are 14% and 17%, respectively. The proposed formulas for bond degradation in cracked concrete can provide a satisfactory prediction
(4)
More bond tests based on cracked specimens with smaller stirrup ratios are needed, and the effect on the bond of rebar profile change due to corrosion should be investigated further.

Author Contributions

Conceptualization, A.S.S., H.S., and T.K.; methodology, A.S.S., H.S. and T.K.; validation, A.S.S., H.S. and T.K.; formal analysis, A.S.S. and H.S.; investigation, A.S.S. and H.S.; resources, T.K.; writing—original draft preparation, A.S.S.; writing—review and editing, T.K.; supervision, T.K.; funding acquisition, T.K. All authors have read and agreed to the published version of the manuscript.

Funding

This research received no external funding.

Institutional Review Board Statement

Not applicable.

Informed Consent Statement

Not applicable.

Data Availability Statement

The data that support the findings of this study are available from the corresponding author upon reasonable request.

Conflicts of Interest

The authors declare no conflict of interest.

References

  1. Oyado, M.; Kanakubo, T.; Yamamoto, Y.; Kuroiwa, T. Bending Performance of Corroded RC Beams Used for Many Years. In Proceedings of the 2nd Asian Concrete Federation International Conference, Bali, Indonesia, 20–21 November 2006. [Google Scholar]
  2. Castel, A.; François, R.; Arliguie, G. Mechanical Behaviour of Corroded Reinforced Concrete Beams—Part 1: Experimental Study of Corroded Beams. Mater. Struct. 2000, 33, 539–544. [Google Scholar] [CrossRef]
  3. Dong, W.; Ye, J.; Murakami, Y.; Oshita, H.; Suzuki, S.; Tsutsumi, T. Residual Load Capacity of Corroded Reinforced Concrete Beam Undergoing Bond Failure. Eng. Struct. 2016, 127, 159–171. [Google Scholar] [CrossRef]
  4. Cairns, J.; Plizzari, G.A.; Du, Y.; Law, D.W.; Franzoni, C. Mechanical Properties of Corrosion-Damaged Reinforcement. ACI Mater. J. 2005, 102, 256. [Google Scholar]
  5. Park, R.; Pauley, T. Strength and Deformation of Members with Shear. In Reinforced Concrete Structures; John Wiley & Sons, Ltd.: Hoboken, NJ, USA, 1975; pp. 270–345. ISBN 978-0-470-17283-4. [Google Scholar]
  6. Tepfers, R.; Achillides, Z.; Azizinamini, A.; Balázs, G.; Bigaj-van-Vliet, A.; Cabrera, J.; Cairns, J.; Cosenza, E.; den Uijl, J.; Eligehausen, R.; et al. Fib Bulletin 10: Bond of Reinforcement in Concrete; Fib Bulletins; International Federation for Structural Concrete (fib): Lausanne, Switzerland, 2000; ISBN 978-2-88394-050-5. [Google Scholar]
  7. Lin, H.; Zhao, Y.; Feng, P.; Ye, H.; Ozbolt, J.; Jiang, C.; Yang, J.-Q. State-of-the-Art Review on the Bond Properties of Corroded Reinforcing Steel Bar. Constr. Build. Mater. 2019, 213, 216–233. [Google Scholar] [CrossRef]
  8. Mancini, G.; Tondolo, F. Effect of Bond Degradation Due to Corrosion—a Literature Survey. Struct. Concr. 2014, 15, 408–418. [Google Scholar] [CrossRef]
  9. Auyeung, Y.; Balaguru, P.; Lan, C. Bond Behavior of Corroded Reinforcement Bars. ACI Mater. J. 2000, 97. [Google Scholar] [CrossRef]
  10. Tondolo, F. Bond Behaviour with Reinforcement Corrosion. Constr. Build. Mater. 2015, 93, 926–932. [Google Scholar] [CrossRef]
  11. Hanjari, K.Z.; Coronelli, D.; Lundgren, K. Bond Capacity of Severely Corroded Bars with Corroded Stirrups. Mag. Concr. Res. 2011, 63, 953–968. [Google Scholar] [CrossRef] [Green Version]
  12. Fang, C.; Lundgren, K.; Chen, L.; Zhu, C. Corrosion Influence on Bond in Reinforced Concrete. Cem. Concr. Res. 2004, 34, 2159–2167. [Google Scholar] [CrossRef]
  13. Lin, H.; Zhao, Y.; Yang, J.-Q.; Feng, P.; Ozbolt, J.; Ye, H. Effects of the Corrosion of Main Bar and Stirrups on the Bond Behavior of Reinforcing Steel Bar. Constr. Build. Mater. 2019, 225, 13–28. [Google Scholar] [CrossRef]
  14. Blomfors, M.; Zandi, K.; Lundgren, K.; Coronelli, D. Engineering Bond Model for Corroded Reinforcement. Eng. Struct. 2018, 156, 394–410. [Google Scholar] [CrossRef]
  15. Lin, H.; Zhao, Y.; Ožbolt, J.; Reinhardt, H.-W. Bond Strength Evaluation of Corroded Steel Bars via the Surface Crack Width Induced by Reinforcement Corrosion. Eng. Struct. 2017, 152, 506–522. [Google Scholar] [CrossRef]
  16. Law, D.W.; Tang, D.; Molyneaux, T.K.C.; Gravina, R. Impact of Crack Width on Bond: Confined and Unconfined Rebar. Mater. Struct. 2011, 44, 1287–1296. [Google Scholar] [CrossRef]
  17. Fischer, C.; Ožbolt, J. An Appropriate Indicator for Bond Strength Degradation Due to Reinforcement Corrosion. In Proceedings of the 8th International Conference on Fracture Mechanics of Concrete and Concrete Structures, Toledo, Spain, 10–14 March 2013. [Google Scholar]
  18. Koulouris, K.; Apostolopoulos, C. An Experimental Study on Effects of Corrosion and Stirrups Spacing on Bond Behavior of Reinforced Concrete. Metals 2020, 10, 1327. [Google Scholar] [CrossRef]
  19. Mak, M.W.T.; Lees, J. Assessment of Corrosion-Induced Bond Deterioration in Reinforced Concrete: Towards a Splitting Crack-Based Approach. In Proceedings of the IABSE Congress—Resilient Technologies for Sustainable Infrastructure, Christchurch, New Zealand, 3–5 February 2021. [Google Scholar]
  20. Mak, M.W.T.; Desnerck, P.; Lees, J.M. Corrosion-Induced Cracking and Bond Strength in Reinforced Concrete. Constr. Build. Mater. 2019, 208, 228–241. [Google Scholar] [CrossRef]
  21. Wang, Y.; Geem, Z.W.; Nagai, K. Bond Strength Assessment of Concrete-Corroded Rebar Interface Using Artificial Neutral Network. Appl. Sci. 2020, 10, 4724. [Google Scholar] [CrossRef]
  22. Yang, Y.; Nakamura, H.; Miura, T.; Yamamoto, Y. Effect of Corrosion-Induced Crack and Corroded Rebar Shape on Bond Behavior. Struct. Concr. 2019, 20, 2171–2182. [Google Scholar] [CrossRef]
  23. Desnerck, P.; Lees, J.M.; Morley, C.T. Bond Behaviour of Reinforcing Bars in Cracked Concrete. Constr. Build. Mater. 2015, 94, 126–136. [Google Scholar] [CrossRef]
  24. Brantschen, F.; Faria, D.M.V.; Fernández Ruiz, M.; Muttoni, A. Bond Behaviour of Straight, Hooked, U-Shaped and Headed Bars in Cracked Concrete. Struct. Concr. 2016, 17, 799–810. [Google Scholar] [CrossRef]
  25. Mousavi, S.S.; Guizani, L.; Ouellet-Plamondon, C.M. On Bond-Slip Response and Development Length of Steel Bars in Pre-Cracked Concrete. Constr. Build. Mater. 2019, 199, 560–573. [Google Scholar] [CrossRef]
  26. Syll, A.S.; Aburano, T.; Kanakubo, T. Bond Strength Degradation in Concrete Cracked by Expansion Agent Filled Pipes. Struct. Concr. 2021, 1–17. [Google Scholar] [CrossRef]
  27. Aburano, T.; Syll, A.S.; Kanakubo, T. Structural Performance of RC Beams with Induced Corrosion Cracks by Aluminum Pipe Filled with an Expansion Agent. In Proceedings of the 17th World Conference on Earthquake Engineering, Sendai, Japan, 13–18 September 2020. [Google Scholar]
  28. Bhargava, K.; Ghosh, A.K.; Mori, Y.; Ramanujam, S. Corrosion-Induced Bond Strength Degradation in Reinforced Concrete—Analytical and Empirical Models. Nucl. Eng. Des. 2007, 237, 1140–1157. [Google Scholar] [CrossRef]
  29. Lin, H.; Zhao, Y. Effects of Confinements on the Bond Strength between Concrete and Corroded Steel Bars. Constr. Build. Mater. 2016, 118, 127–138. [Google Scholar] [CrossRef]
  30. Zhou, H.; Lu, J.; Xv, X.; Dong, B.; Xing, F. Effects of Stirrup Corrosion on Bond–Slip Performance of Reinforcing Steel in Concrete: An Experimental Study. Constr. Build. Mater. 2015, 93, 257–266. [Google Scholar] [CrossRef]
  31. Giuriani, E.; Plizzari, G.; Schumm, C. Role of Stirrups and Residual Tensile Strength of Cracked Concrete on Bond. J. Struct. Eng. 1991, 117, 1–18. [Google Scholar] [CrossRef]
  32. Yasojima, A.; Kanakubo, T. Bond Splitting Strength of RC Members Based on Local Bond Stress and Slip Behavior. In Proceedings of the 11th International Conference on Fracture, Turin, Italy, 20–25 March 2005. No. 4486. [Google Scholar]
  33. Yasojima, A.; Kanakubo, T. Local Bond Splitting Behavior of RC Members with Lateral Reinforcement. In Proceedings of the 14th World Conference on Earthquake Engineering, Beijing, China, 12–17 October 2008. Paper ID 05-03-0033. [Google Scholar]
  34. Apostolopoulos, C.A.; Koulouris, K.F.; Apostolopoulos, A.C. Correlation of Surface Cracks of Concrete Due to Corrosion and Bond Strength (between Steel Bar and Concrete). Adv. Civ. Eng. 2019, 2019, 1–12. [Google Scholar] [CrossRef]
  35. Walraven, J. Model Code 2010—First Complete Draft, Volume 2; International Federation for Structural Concrete (fib): Lausanne, Switzerland, 2010; ISBN 978-2-88394-095-6. [Google Scholar]
Figure 1. Importance of bond in truss mechanism: (a) truss mechanism; (b) equilibrium force at the circled point in (a); (c) equilibrium affected by bond degradation due to induced corrosion crack.
Applsci 11 08874 g001
Figure 2. Effect of induced cracked pattern on bond deterioration [26]: (a) degradation of bond due to induced cracks; (b) induced crack pattern.
Applsci 11 08874 g002
Figure 3. Rebar arrangement of monitor specimen: (a) short specimen; (b) long specimen.
Applsci 11 08874 g003
Figure 4. Crack simulated on beam with EAFP: (a) longitudinal surface crack in short specimen; (b) Internal crack in short specimen; (c) longitudinal surface crack in long specimen; (d) internal crack in long specimen.
Applsci 11 08874 g004
Figure 5. Specimen detail (example Series S2): (a) front view; (b) side view; and (c) upper view.
Applsci 11 08874 g005
Figure 6. Specimen framework: (a) series S0; (b) series S1; (c) series S2.
Applsci 11 08874 g006
Figure 7. Concrete cracking with an EAFP: (a) cracking process; (b) expansion agent filling.
Applsci 11 08874 g007
Figure 8. Pull-out setup and measurement method: (a) loading machine; (b) picture of specimen at loading.
Applsci 11 08874 g008
Figure 9. Specimen cracked by EAFP: (a) crack on specimen side; (b) crack on specimen top (considered crack with); (c) crack on other specimen sides.
Applsci 11 08874 g009
Figure 10. Failure mode: (a) side split failure; (b) face split failure.
Applsci 11 08874 g010
Figure 11. Examples of bond stress versus slippage curves.
Applsci 11 08874 g011
Figure 12. Bond strength-induced crack width relationship: (a) Serie S0; (b) Serie S1; (c) Serie S2.
Applsci 11 08874 g012
Figure 13. Residual bond strength ratio versus crack width: (a) series S0; (b) series S1; (c) series S2.
Applsci 11 08874 g013
Figure 14. Proposed formulas comparison.
Applsci 11 08874 g014
Figure 15. Comparison of the test results with the fib model: (a) specimen without stirrup; (b) specimen with stirrup.
Applsci 11 08874 g015
Figure 16. Comparison of the proposed formulas with study by Law et al.: (a) S0 prediction compared with specimen by Law et al.; (b) typical corrosion-induced cracks in specimen by Law et al. [16].
Applsci 11 08874 g016
Figure 17. Comparison of the proposed formulas with study by Lin et al.: (a) S0 prediction compared with specimen without stirrup by Lin et al.; (b) S1 and S2 prediction compared with specimen with stirrup by Lin et al.; (c) typical corrosion-induced cracks in specimen by Lin et al. [13,15,29].
Applsci 11 08874 g017
Table 1. Specimen list.
SeriesSpecimen NameInduced Crack TargetStirrup Spacing (mm)Stirrup Ratio (%)
S0S0-C- (crack in mm)0.15 mm to 1.0 mm00
S1S1-C- (crack in mm)0.15 mm to 1.5 mm76 *1.10
S2S2-C- (crack in mm)0.15 mm to 1.5 mm501.68
* Only one stirrup was used within the bond length.
Table 2. List of test results.
Series
(Number of Specimens)
Specimen NameInduced Crack Width
(mm)
At maximum LoadFailure
Mode
Bond Stress (MPa)Slip
(mm)
S0 (10)S0-C-0.150.158.810.58Face split
S0-C-0.200.206.270.60Face split
S0-C-0.250.257.430.43Side split
S0-C-0.300.306.210.46Side split
S0-C-0.350.357.290.56Side split
S0-C-0.400.406.930.68Side split
S0-C-0.500.504.970.65Side split
S0-C-0.600.604.430.69Side split
S0-C-0.850.852.701.11Side split
S0-C-0.950.953.691.04Side split
S1 (13)S1-C-0.150.158.771.00Face split
S1-C-0.200.208.091.15Face split
S1-C-0.40(1)0.407.540.69Face split
S1-C-0.40(2)0.407.101.36Face split
S1-C-0.450.457.131.69Face split
S1-C-0.55(1)0.556.661.49Side split
S1-C-0.55(2)0.556.512.41Side split
S1-C-0.60(1)0.607.400.92Side split
S1-C-0.60(2)0.607.840.85Side split
S1-C-0.700.708.331.47Side split
S1-C-0.800.806.292.33Side split
S1-C-1.101.106.072.27Side split
S1-C-1.401.405.462.09Side split
S2 (13)S2-C-0.150.159.461.09Face split
S2-C-0.20(1)0.207.932.09Face split
S2-C-0.20(2)0.209.011.03Face split
S2-C-0.250.257.941.56Face split
S2-C-0.300.308.821.94Face split
S2-C-0.350.357.821.34Face split
S2-C-0.40(1)0.409.401.26Face split
S2-C-0.40(2)0.409.551.88Face split
S2-C-0.50(1)0.507.841.37Face split
S2-C-0.50(2)0.507.101.88Side split
S2-C-0.50(3)0.508.311.69Side split
S2-C-0.600.608.161.68Side split
S2-C-0.700.707.361.29Side split
Table 3. Regression analysis result.
Seriespw (%)ab
S000.84−1.89
S11.100.42−3.05
S21.680.28−6.32
Publisher’s Note: MDPI stays neutral with regard to jurisdictional claims in published maps and institutional affiliations.

