Article

A New Method to Determine the Steel Fibre Content of Existing Structures—Evaluation and Validation

Institute of Building Materials Research, RWTH Aachen University, Schinkelstr. 3, 52062 Aachen, Germany
*
Author to whom correspondence should be addressed.
Appl. Sci. 2022, 12(1), 454; https://doi.org/10.3390/app12010454
Submission received: 3 December 2021 / Revised: 27 December 2021 / Accepted: 29 December 2021 / Published: 4 January 2022

Abstract

:
The in-situ measurement of the content and orientation of steel fibres in concrete structures is of great importance for the assessment of their specific mechanical properties, especially in the case of repair. For existing structures, the actual fibre content as well as the orientation of the fibres, which is based on many factors such as casting or compacting direction, is typically unknown. For structural maintenance or rehabilitation, those factors have to be determined in order to apply meaningful structural design calculations and plan necessary strengthening methods. For this reason, a new method based on the analysis of drilling cores of concrete structures has been established. The newly developed non-destructive test setup used in this research consists of a framework for cylindrical specimens in combination with an LCR meter to determine the electrical resistance of the fibre reinforced concrete. In combination with a suitable FEM model, concretes with fibre contents up 80 kg/m3 were analysed to derive a first model to assess the actual fibre content of steel fibre reinforced concretes. After a calibration of the literature’s equation by use of an adjusted aspect ratio for the analysis of drilling cores, the estimation of the fibre content is possible with high accuracy for the tested material combination. The results show that the newly developed test method is suitable for the rapid and non-destructive structural diagnosis of the fibre content of steel fibre reinforced concrete based on drilling cores using electrical resistivity measurements.

1. Introduction

Based on a recently developed easy-to-use test setup [1], a new application to assess the steel fibre content of existing structures based on the electrical resistivity analysis of drilling cores is described in this two-part study. Therefore, in the first part (see [2]), the test setup was adapted. A new numerical model was also generated to simulate the flow of the alternating current, which enables the calculation of the electrical resistivity in different specimen directions. An in-depth literature review on the methods concerning the determination of the steel fibre content is presented in [1,2].
Both parameters, fibre content and fibre orientation, are tremendously important for influencing the mechanical parameters of steel fibre reinforced concrete (SFRC) (see [3,4,5,6]). In general, a higher fibre content and fibres, oriented in direction of the tensile forces, lead to very ductile material behaviour and an increase in the tensile strength of the composite material (see [4,7,8,9,10,11,12,13]). In the case of new structures, the global fibre content can easily be determined and monitored during the mixing process by the mass of the fibres that are added to the concrete or alternatively by washing the fibres out of a fresh concrete sample. After the casting process, the determination of the fibre content and the detection of areas with locally lower fibre contents or an unfavourable fibre orientation is no longer possible via an easy method. Hence high safety factors are required for the structural design of SFRC (see [6,14,15,16]. Additionally, the repair and restoration of SFRC buildings only can only be planned and realised in a safe way when the fibre content of the existing structure is known (see [10,17]). In case it is not possible to determine the actual fibre content of concrete structures, a repair process is only possible with very pessimistic assumptions for the flexural strength of the SFRC elements. Based on this, an economical method of construction is not possible, and additionally, areas with a very low percentage of reinforcement cannot be detected and could lead to a local collapse of the whole structure. Electrical resistivity measurements are one possible non-destructive test method for this analysis. This approach is beneficial since it is easier to apply and less costly compared to other methods such as CT-scanning, cross-sectional analysis via microscope or inductive techniques (see [12,18,19,20,21,22,23,24,25,26,27,28,29]). With the help of an optimised experimental setup, this study focuses on the validation of electrical resistivity as a novel approach to assess the fibre content and orientation of drilling cores extracted from concrete plates with fibre contents up to 80 kg/m3. Correlations between the electrical resistivity and the fibre content and fibre orientation are derived, which enable a later non-destructive use of adjusted electrode configurations on structural elements and buildings.

2. Materials and Methods

2.1. Concrete Mix Design

The concrete mix design was already used in earlier studies of the authors such as [1]. The design focussed on sufficient workability for plain concrete (PC) and fibre contents up to 80 kg/m3 in steel fibre reinforced concretes (SFRC). The concrete mix design presented in Table 1 enables the analysis of both PC and SFRC without the addition of a superplasticizer. For the SFRC hooked end, macro steel fibres with a length of 60 mm and a diameter of 1 mm were added to the plain concrete after mixing. The fibres thus had an aspect ratio of 60 and were produced out of steel wire.
The mixing process was performed according to the following scheme: First, the solid components, cement and aggregates, were mixed in a compulsory mixer with a nominal volume of 170 L for 30 s to obtain a homogenous mixture. In the next step, the water was added to the solids while the mixing process was still ongoing, followed by a mixing phase of two minutes. After a visual inspection of the concrete, adhering components were removed from the mixer walls, followed by a final mixing process of one minute. On the final PC mixture, fresh concrete tests, such as the flow table test as well as the density and the air content in accordance with EN 12350-5 [30], EN 12350-6 [31], and EN 12350-7 [32], were assessed. In the case of the SFRC with fibre contents of 40 kg/m3 and 80 kg/m3, the fibres were added after the fresh concrete tests, and the concrete was mixed for another minute.
In total, three concrete batches were produced. Out of each concrete batch three cubic specimens with an edge length of 150 mm as well as one plate with dimensions of 500 × 500 × 212 mm3 were cast, each in two layers with subsequent compaction on a vibrating table. A height of 212 mm was chosen to enable grinding of both the bottom and surface of the later extracted drilling cores and gain specimens of a height of 200 mm. The specimens were covered with foil to inhibit dehydration of the surface. After 24 h, the specimens in steel formworks (cubes) were demoulded. Moreover, the upper surface was ground to ensure a flat surface with a good connection to the electrodes and afterwards stored underwater. The plates were left in the formwork to simulate a hardening of structural elements such as floor plates or walls and were stored at a climate of 20 °C and 65% relative humidity. After 14 days, nine drilling cores with diameters of 100 mm were extracted out of each concrete plate. Thereby two different edge distances were used. The first six specimens were drilled with edge distances to the formworks of 60 mm, appropriate to the length of the fibres, while the last three cores were drilled with edge distances of 30 mm, appropriate to half of the fibre length. A schematic figure of the arrangement of the drilling cores is presented in Figure 1. After drilling, the lower and upper surfaces of the cores were ground analogue to the cubic specimens and the specimens were stored underwater.

2.2. Experimental Setup

2.2.1. Basic Setup

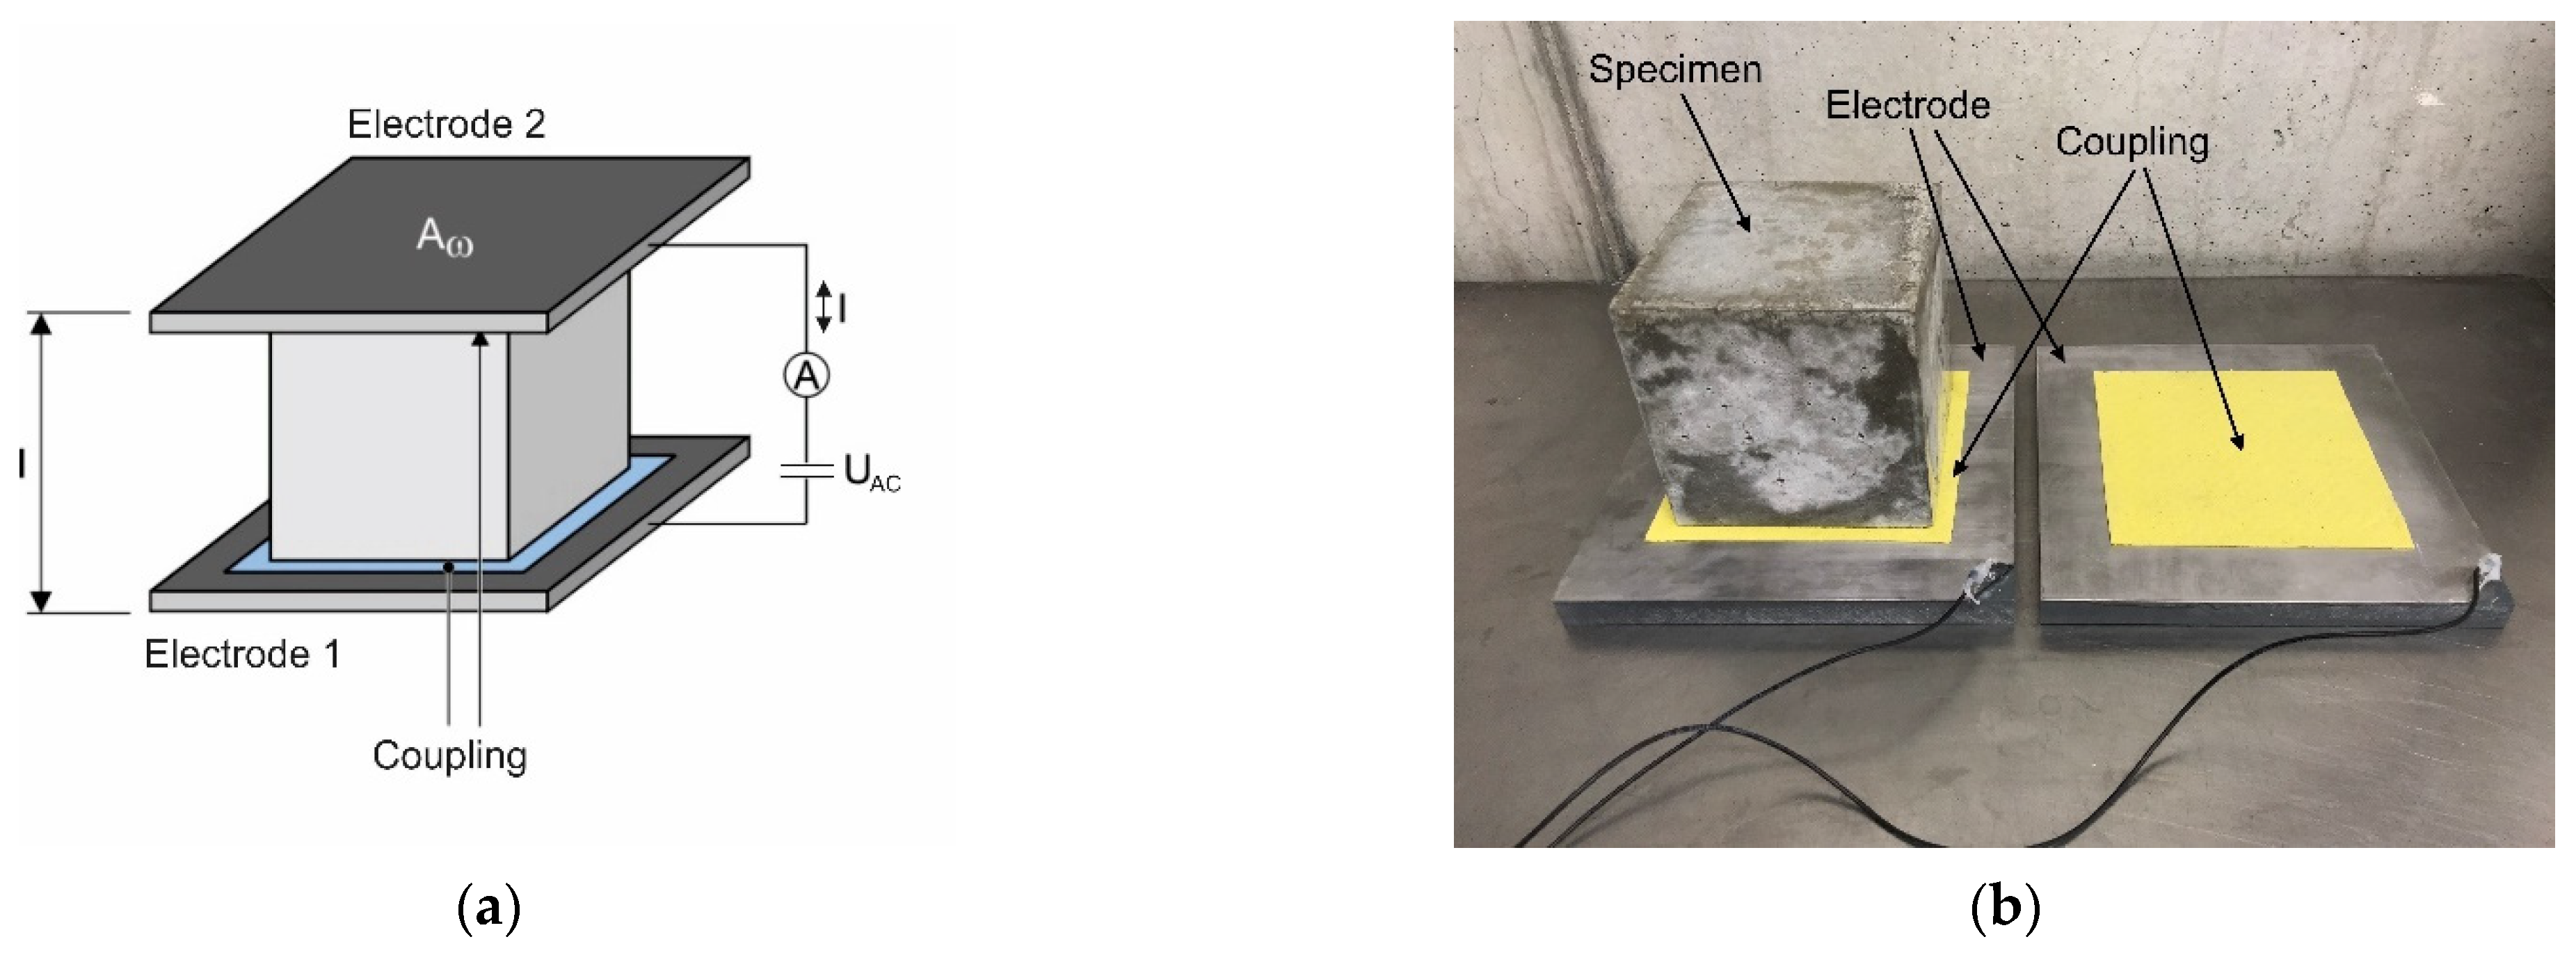
The basic setup of the measurements is described in [1] and consists of two stainless steel electrodes with dimensions of 200 × 200 mm2, which are connected to an LCR meter. The LCR meter used for the impedance measurements was Extech Instruments LCR 200 with a voltage amplitude of 600 mV rms and variable frequencies of the alternating current of 100 Hz, 120 Hz, 1 kHz, 10 kHz, and 100 kHz. The setup is presented in Figure 2.

2.2.2. Advanced Test Setup for Cylindrical Specimens

For the investigation of drilling cores, an advanced test setup was developed and tested in [2] based on the existing equipment and the extended setup. The LCR meter was connected to a breadboard (see [2]), which could be used for various electrode configurations with several numbers of electrodes.
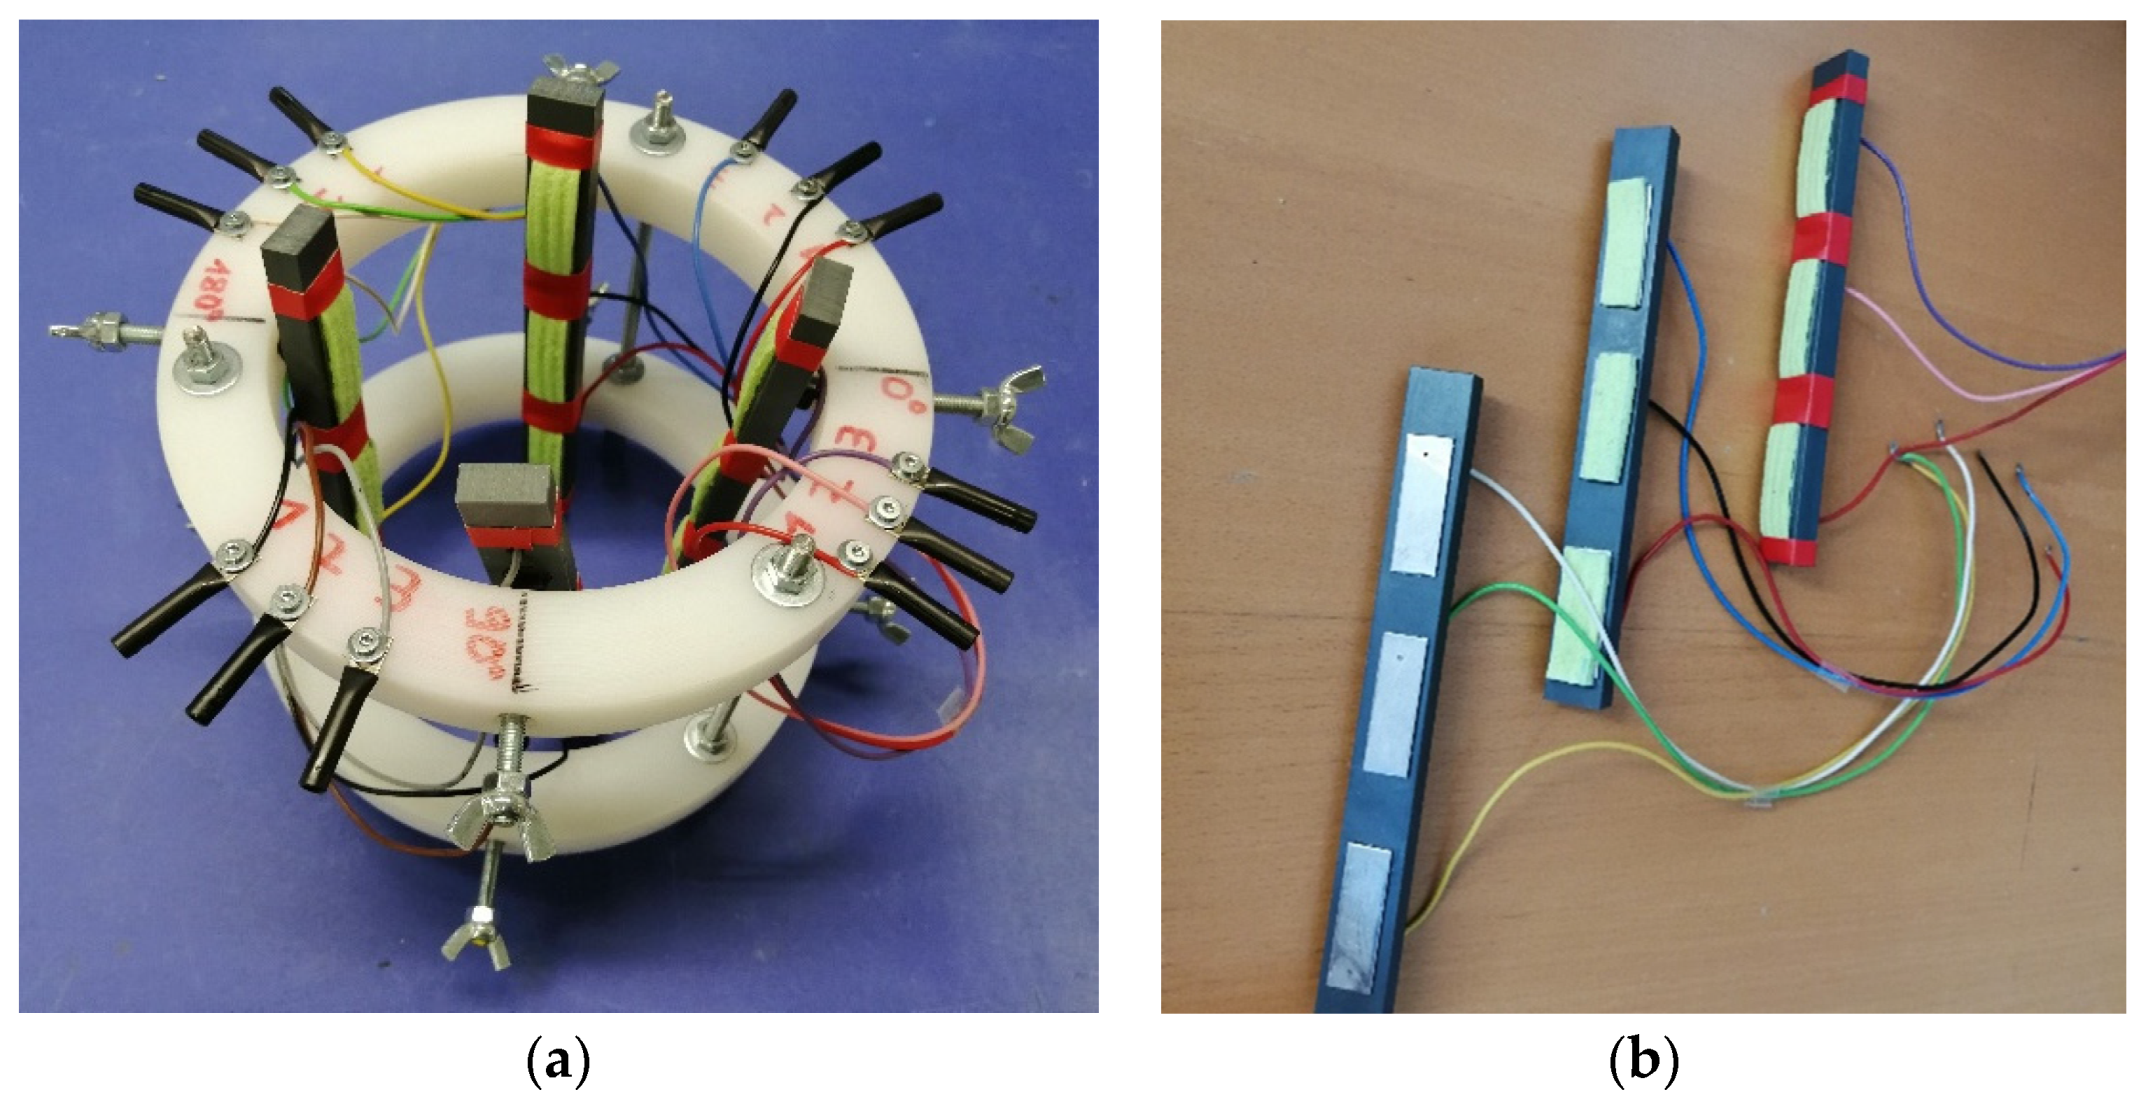
After extensive tests of the setup for cylindrical concrete specimens in combination with the breadboard [2], a cylindrical frame for the analysis of drilling cores was developed (see Figure 3a). The frame was applicable for concrete specimens with different dimensions, such as a diameter of 100 mm or less. The setup consists of stainless steel electrodes with dimensions of 40 × 10 mm2 in three heights, which are arranged in angular distances of 90°. Those electrodes were covered with sponge cloths and isolated with insulating tape to inhibit a short circuit (see Figure 3b). The electrodes were fixed with screws to a circular frame, so they could be adjusted to the specimen’s dimensions, and a reproducible contact pressure could be ensured. The whole setup can be connected to the breadboard, so measurements of various combinations of the twelve electrodes are possible.

2.3. Modelling of the Current Flow

To analyse different electrode configurations and different specimens, the LCR measurements, which give the electrical resistance, as a result, have to be further converted into electrical resistivities, which are independent of geometry. As for trivial electrode configurations (two parallel plates of basic setup, see Section 2.2.1) the geometry factors for the conversion of resistance into resistivity can be easily calculated; for the advanced test setup with a more complex structure, FEM modelling of the test setup and the current flow is needed. The software Comsol Multiphysics (version 5.3a, build version 229) enables the generation of a network model and thus the simulation of the current flow between several electrodes in various configurations.
For the analysis of the specimens in this study, the model of [2] was used, but because effects of surface pressure of the electrodes and electrical conductivity of the sponge cloths contacts cannot directly be considered, different electrical material parameters for the electrodes have been analysed to find the optimum accordance of the model and the real experiment. The drilling core inside the model was represented by a cylinder with a diameter of 100 mm and a height of 200 mm. The electrical resistance was set to 100 Ωm, which fits the experimental data. Similar to the cylindrical frame of the test setup, also in the model, twelve electrodes were added as stainless steel elements with an area of 40 × 10 mm2 and a thickness of 1 mm. The electrodes were placed on three height levels with 20 mm in between each level and angular distances of 90° as segments of a circle. This way, a good connection of the specimen’s surface and the electrode was guaranteed. The grid size of the single elements in the simulation was set to extremely fine because a high accuracy was needed for the simulation of the current flow. For the modelling, the following assumptions have been made: The behaviour of all materials, such as concrete and steel, is presumed as homogeneous and isotropic. Polarization effects on the electrodes have been disregarded because of the use of alternating current. The simplification of homogeneity of the materials, especially the concrete, was conducted to keep the numerical model as easy as possible to reduce computing time and not predictable results based on a presumed inhomogeneity which is not well known. It was decided that the inaccuracy of the model based on this simplification is better to accept than the assumption of any parameters to describe an inhomogeneity of the concrete, especially in the context of unknown fibre distribution and orientation that lead to another inhomogeneity and will not be constant for different specimens with varying fibre content.
This FEM model makes it possible to simulate the current flow and the resulting electric current of several configurations and thus calculate the geometry factors of those electrode configurations. For the simulations, the electric potential of the contacted electrodes was set to 0 V respectively 600 mV. Thus, the current flow between a pair of electrodes or a group of electrodes was simulated. The chosen values of 0 V and 600 V at this juncture represented the real experimental setup with the LCR meter, which uses a voltage amplitude of 600 mV rms. The simulations were carried out with two different electrical parameters for the electrodes. First, the electrical conductivity of the electrodes was set to the one of stainless steel with 1.4 × 10⁶ S/m to represent a perfect connection between concrete and electrodes. In this case, the not contacted electrodes show conduction effects and thus have a great influence on the current flow. The second set of simulations has been carried out with an electrical resistivity of 100 Ωm of the electrodes (corresponding to the resistivity of the concrete), which was meant to represent a bad connection of the electrodes and thus nearly neglects the influence of uncontacted electrodes. By use of Equation (1) then the k-factors can be calculated for each electrode configuration and assumption of the electrode’s electrical behaviour.
k = I ρ U
with k: geometry factor in m
I: electric current in A
ρ: electrical resistivity (set to 100 Ωm)
U: electric potential (set to 1 V)
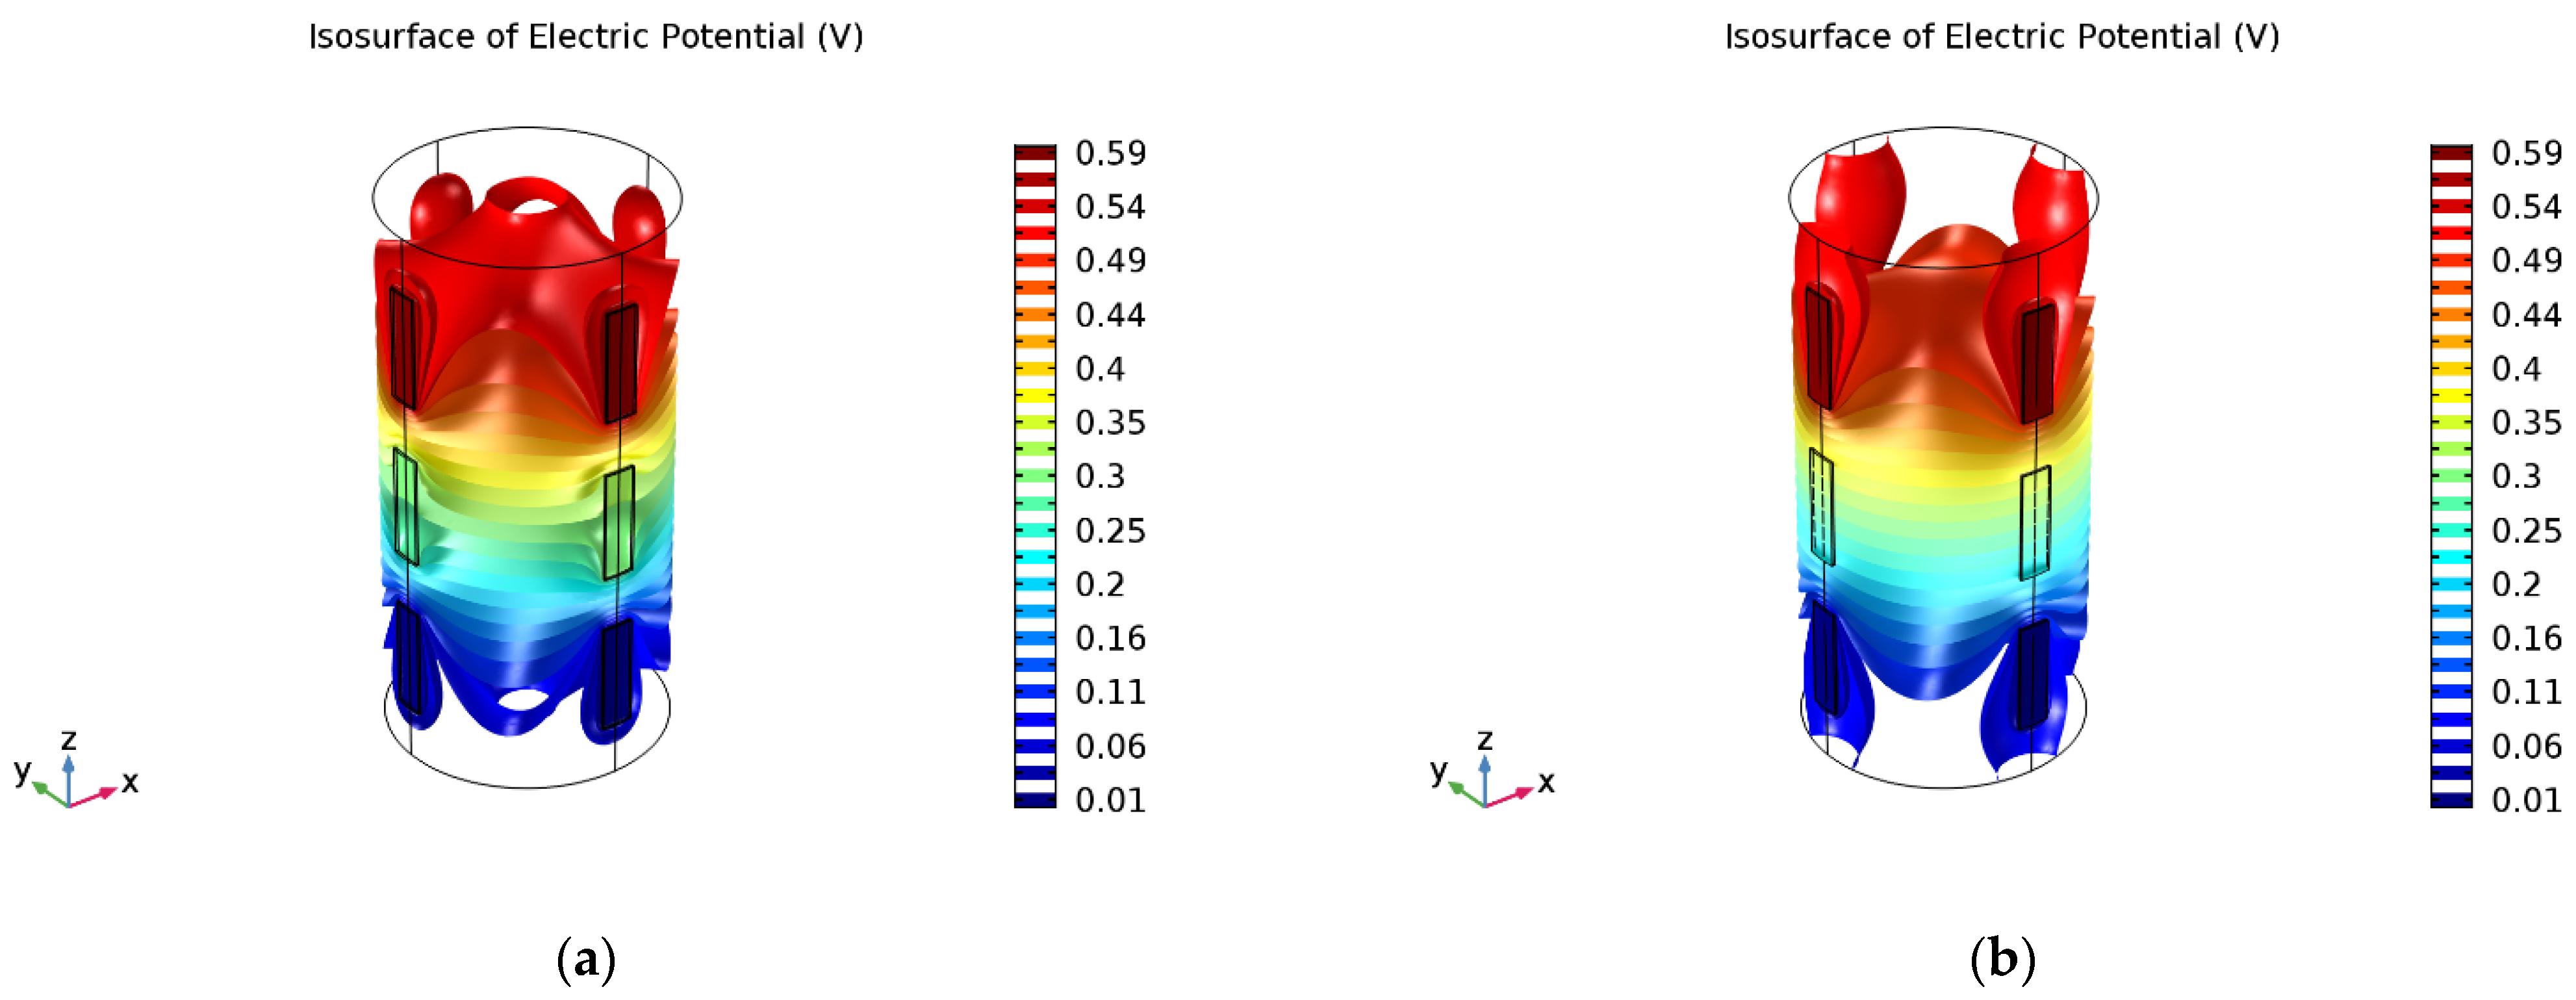
The visualisation in Figure 4a shows that not connected electrodes (in the middle height level) have an impact on the isosurfaces of the current, which represent locations with identical electric potential in case of a good electrical connection of the concrete and the electrodes. The current flow can be supposed to be orthogonal to those isosurfaces. In the case of a low conductivity between concrete and electrodes (Figure 4b), there is no influence of the current flow by unconnected electrodes, which is visible through the constant isosurfaces around the mid-level electrodes. Since those results illustrate the marginal principles, both are used for the subsequent discussions.

2.4. Evaluation of the Results

The fibre content of the specimens, as already presented in [2], was calculated from the electrical resistivity of the SFRC specimens in relation to one of the PC specimens by the equation of [11] (see Equation (2)).
σ σ m = 1 + [ σ ] Δ Φ
with: σ: electrical conductivity of the SFRC in Ωm
σm: electrical conductivity of the PC in Ωm
Φ: fibre volume fraction
[σ]: intrinsic conductivity (Equation (3))
Δ: ratio of conductivity of fibres and PC
The intrinsic conductivity in Equation (2) was calculated in dependence of the aspect ratio of the fibre by an empiric equation in accordance with [11]:
[ σ ] = 1 3 ( 2 ( A R ) 2 3 l n [ 4 ( A R ) ] 7 + 4 )
with: AR: aspect ratio of the fibres.
The aspect ratio of the fibres in this study was 60, and thus the intrinsic conductivity of 255.5 resulted. With this factor, the fibre volume fraction of each concrete specimen could be calculated by Equation (2). As several directions of the specimens were analysed, a global conductivity value had to be determined for each kind of specimen. For the cubic specimens, it was calculated as a mean value of the three pairs of parallel surfaces, while for cylindrical specimens, several configurations have been checked to find an optimum according to the real behaviour of the material.
The use of Equation (2) in different directions, such as only one pair of parallel surfaces of the cubic specimens, in relation to two orthogonal directions, enables the calculation of orientation factors for the single directions. It is summarized that the three orientation factors of one concrete specimen give 100%; therefore, each of the factors is between 0 and 100%.

3. Results and Discussion

3.1. Tests on Concrete Cubes as Additional Specimens

3.1.1. General Evaluation of the Cubic Specimens

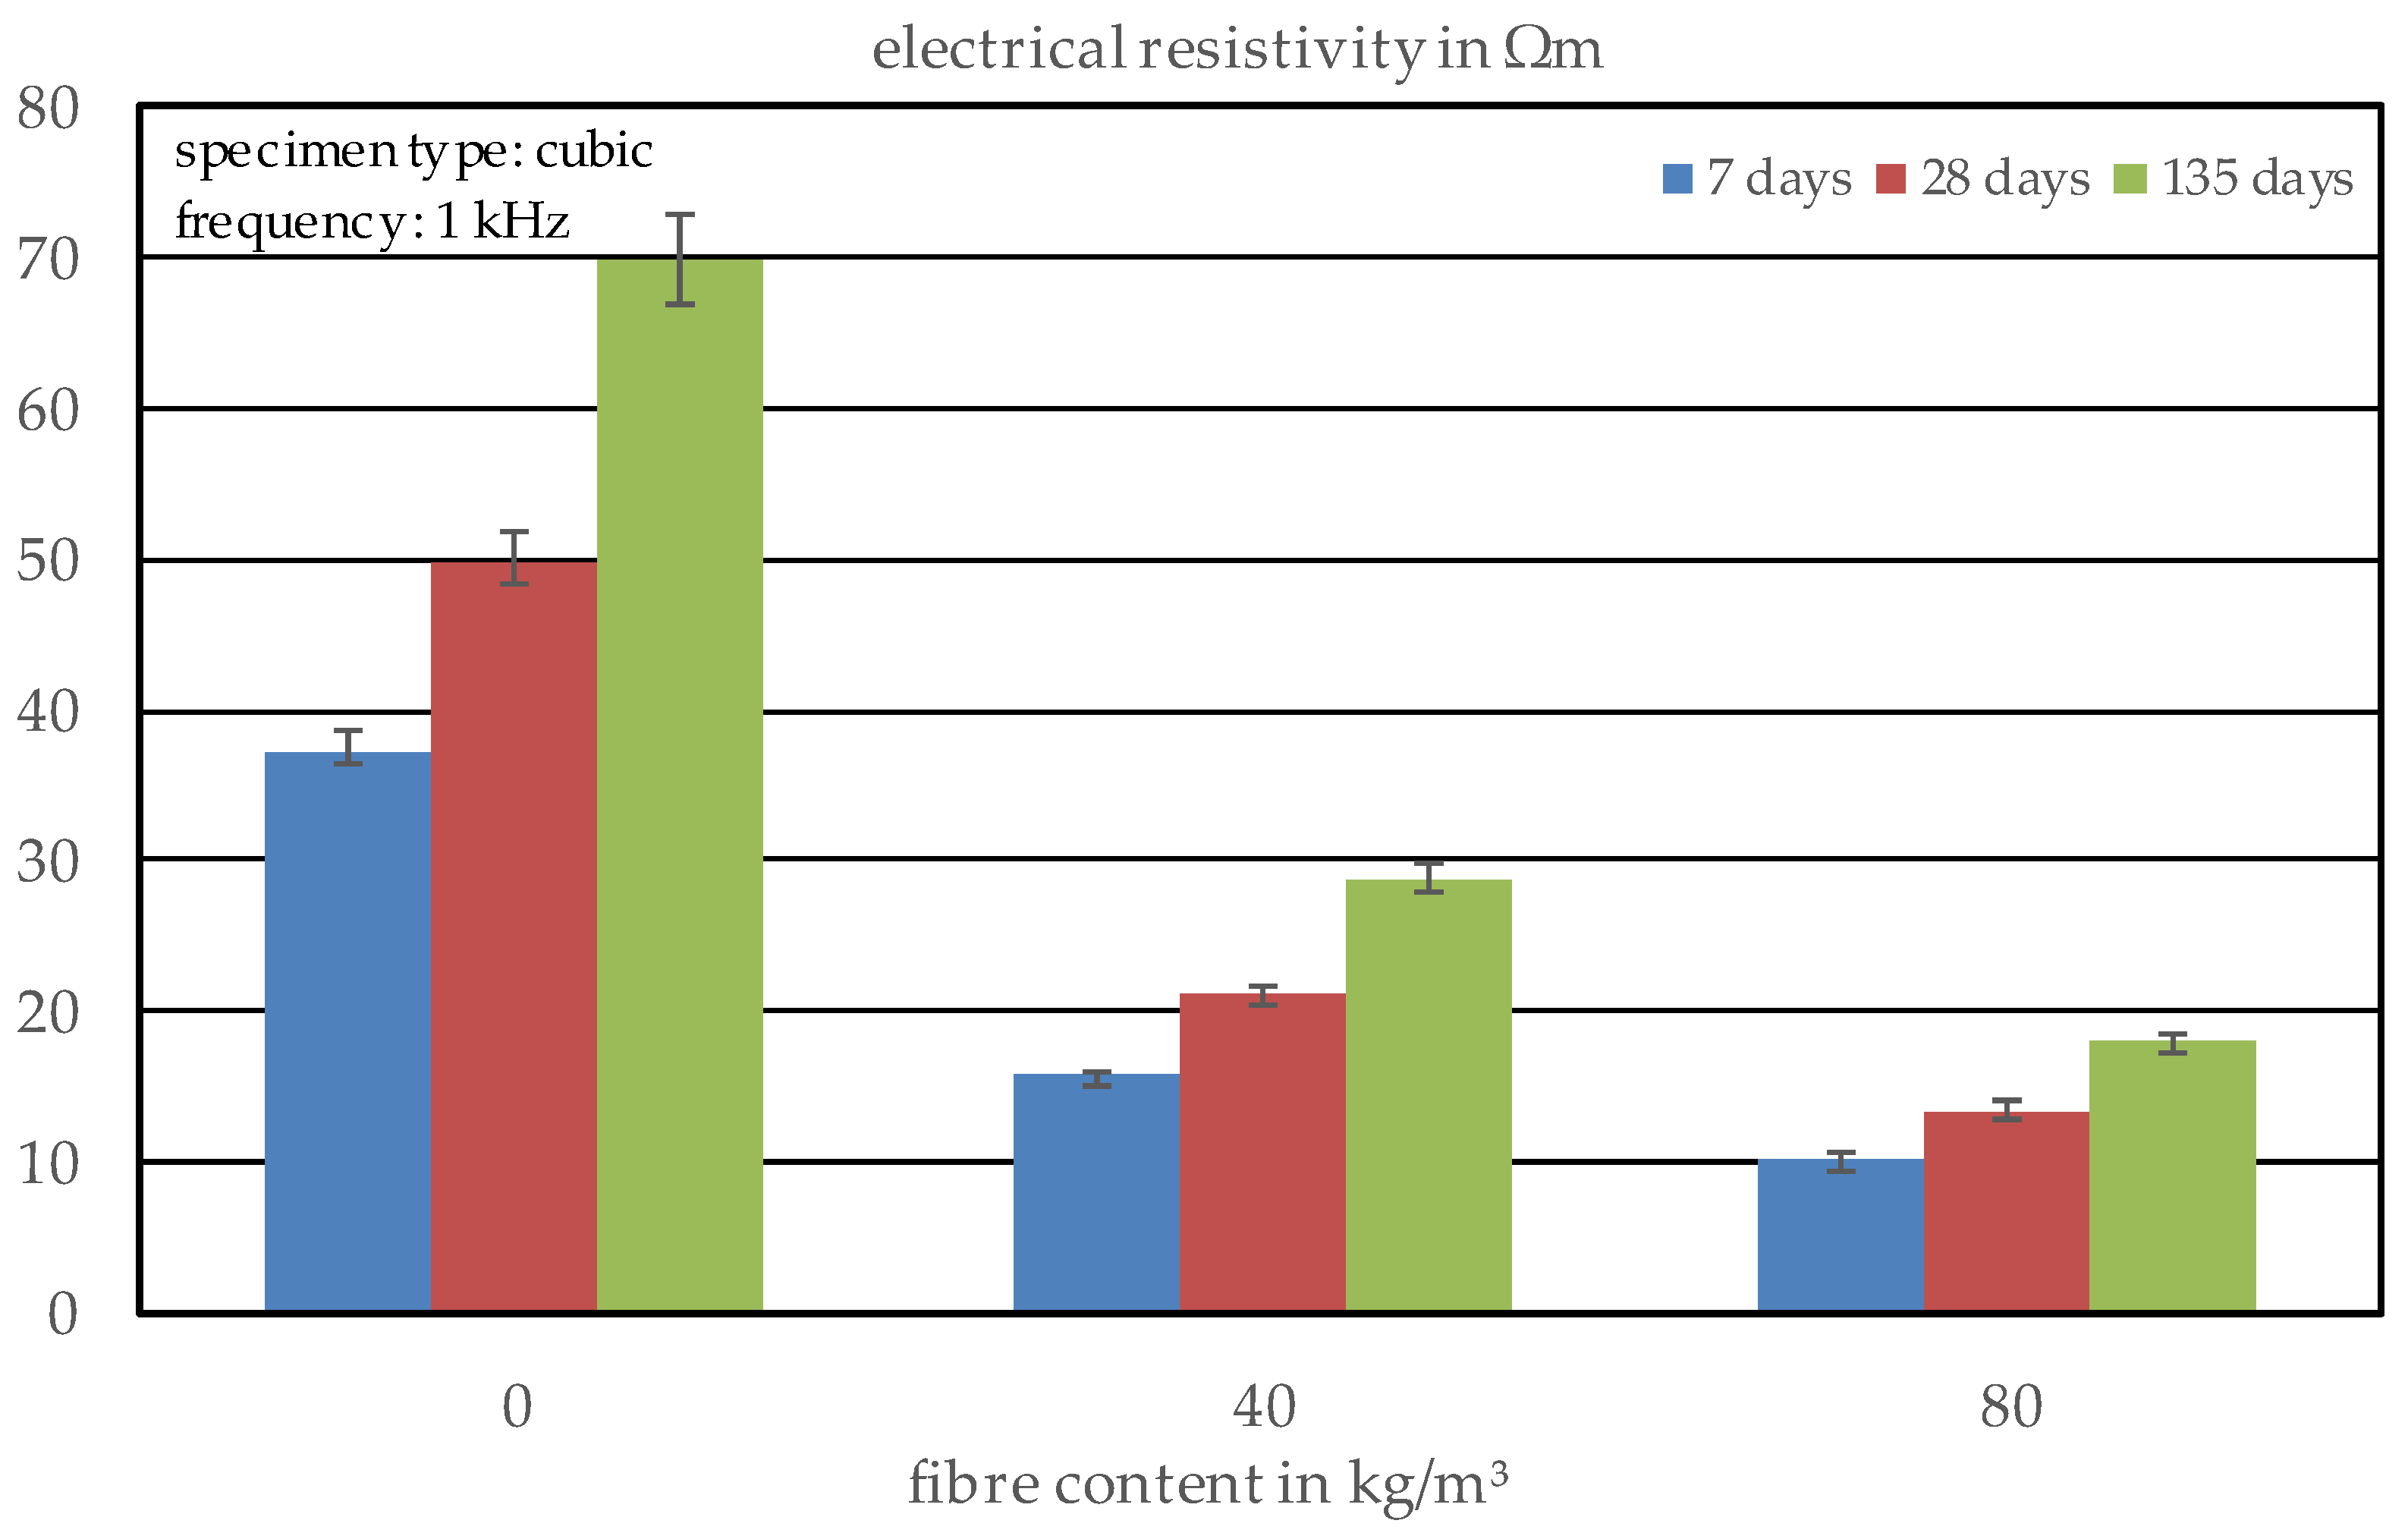
In addition to the production of the concrete plates, where the drilling cores were extracted, three cubic specimens with edge lengths of 150 mm were produced out of each concrete batch to analyse the electrical behaviour of the concrete in the early age and the changes with ongoing aging. For this purpose, the cubes were analysed via the basic test setup (Section 2.2.1) in concrete ages of 7, 28, and 135 days. The electrical resistivity was calculated, and the fibre content and fibre orientation were estimated according to Section 3.2. Since the specimens were stored underwater for the duration, a good conductivity of the concrete was reached, and thus no negative effects of the coupling of the electrodes to the concrete surface were observed. Figure 5 shows the results of the measurements. As already explained, the resistivity of the PC, as well as of the SFRC, increases with increasing concrete age and a higher fibre content results in a significantly lower resistivity due to the conductivity of the fibres inside the concrete matrix (see [1,21,33]).

3.1.2. Estimation of the Fibre Content and Orientation

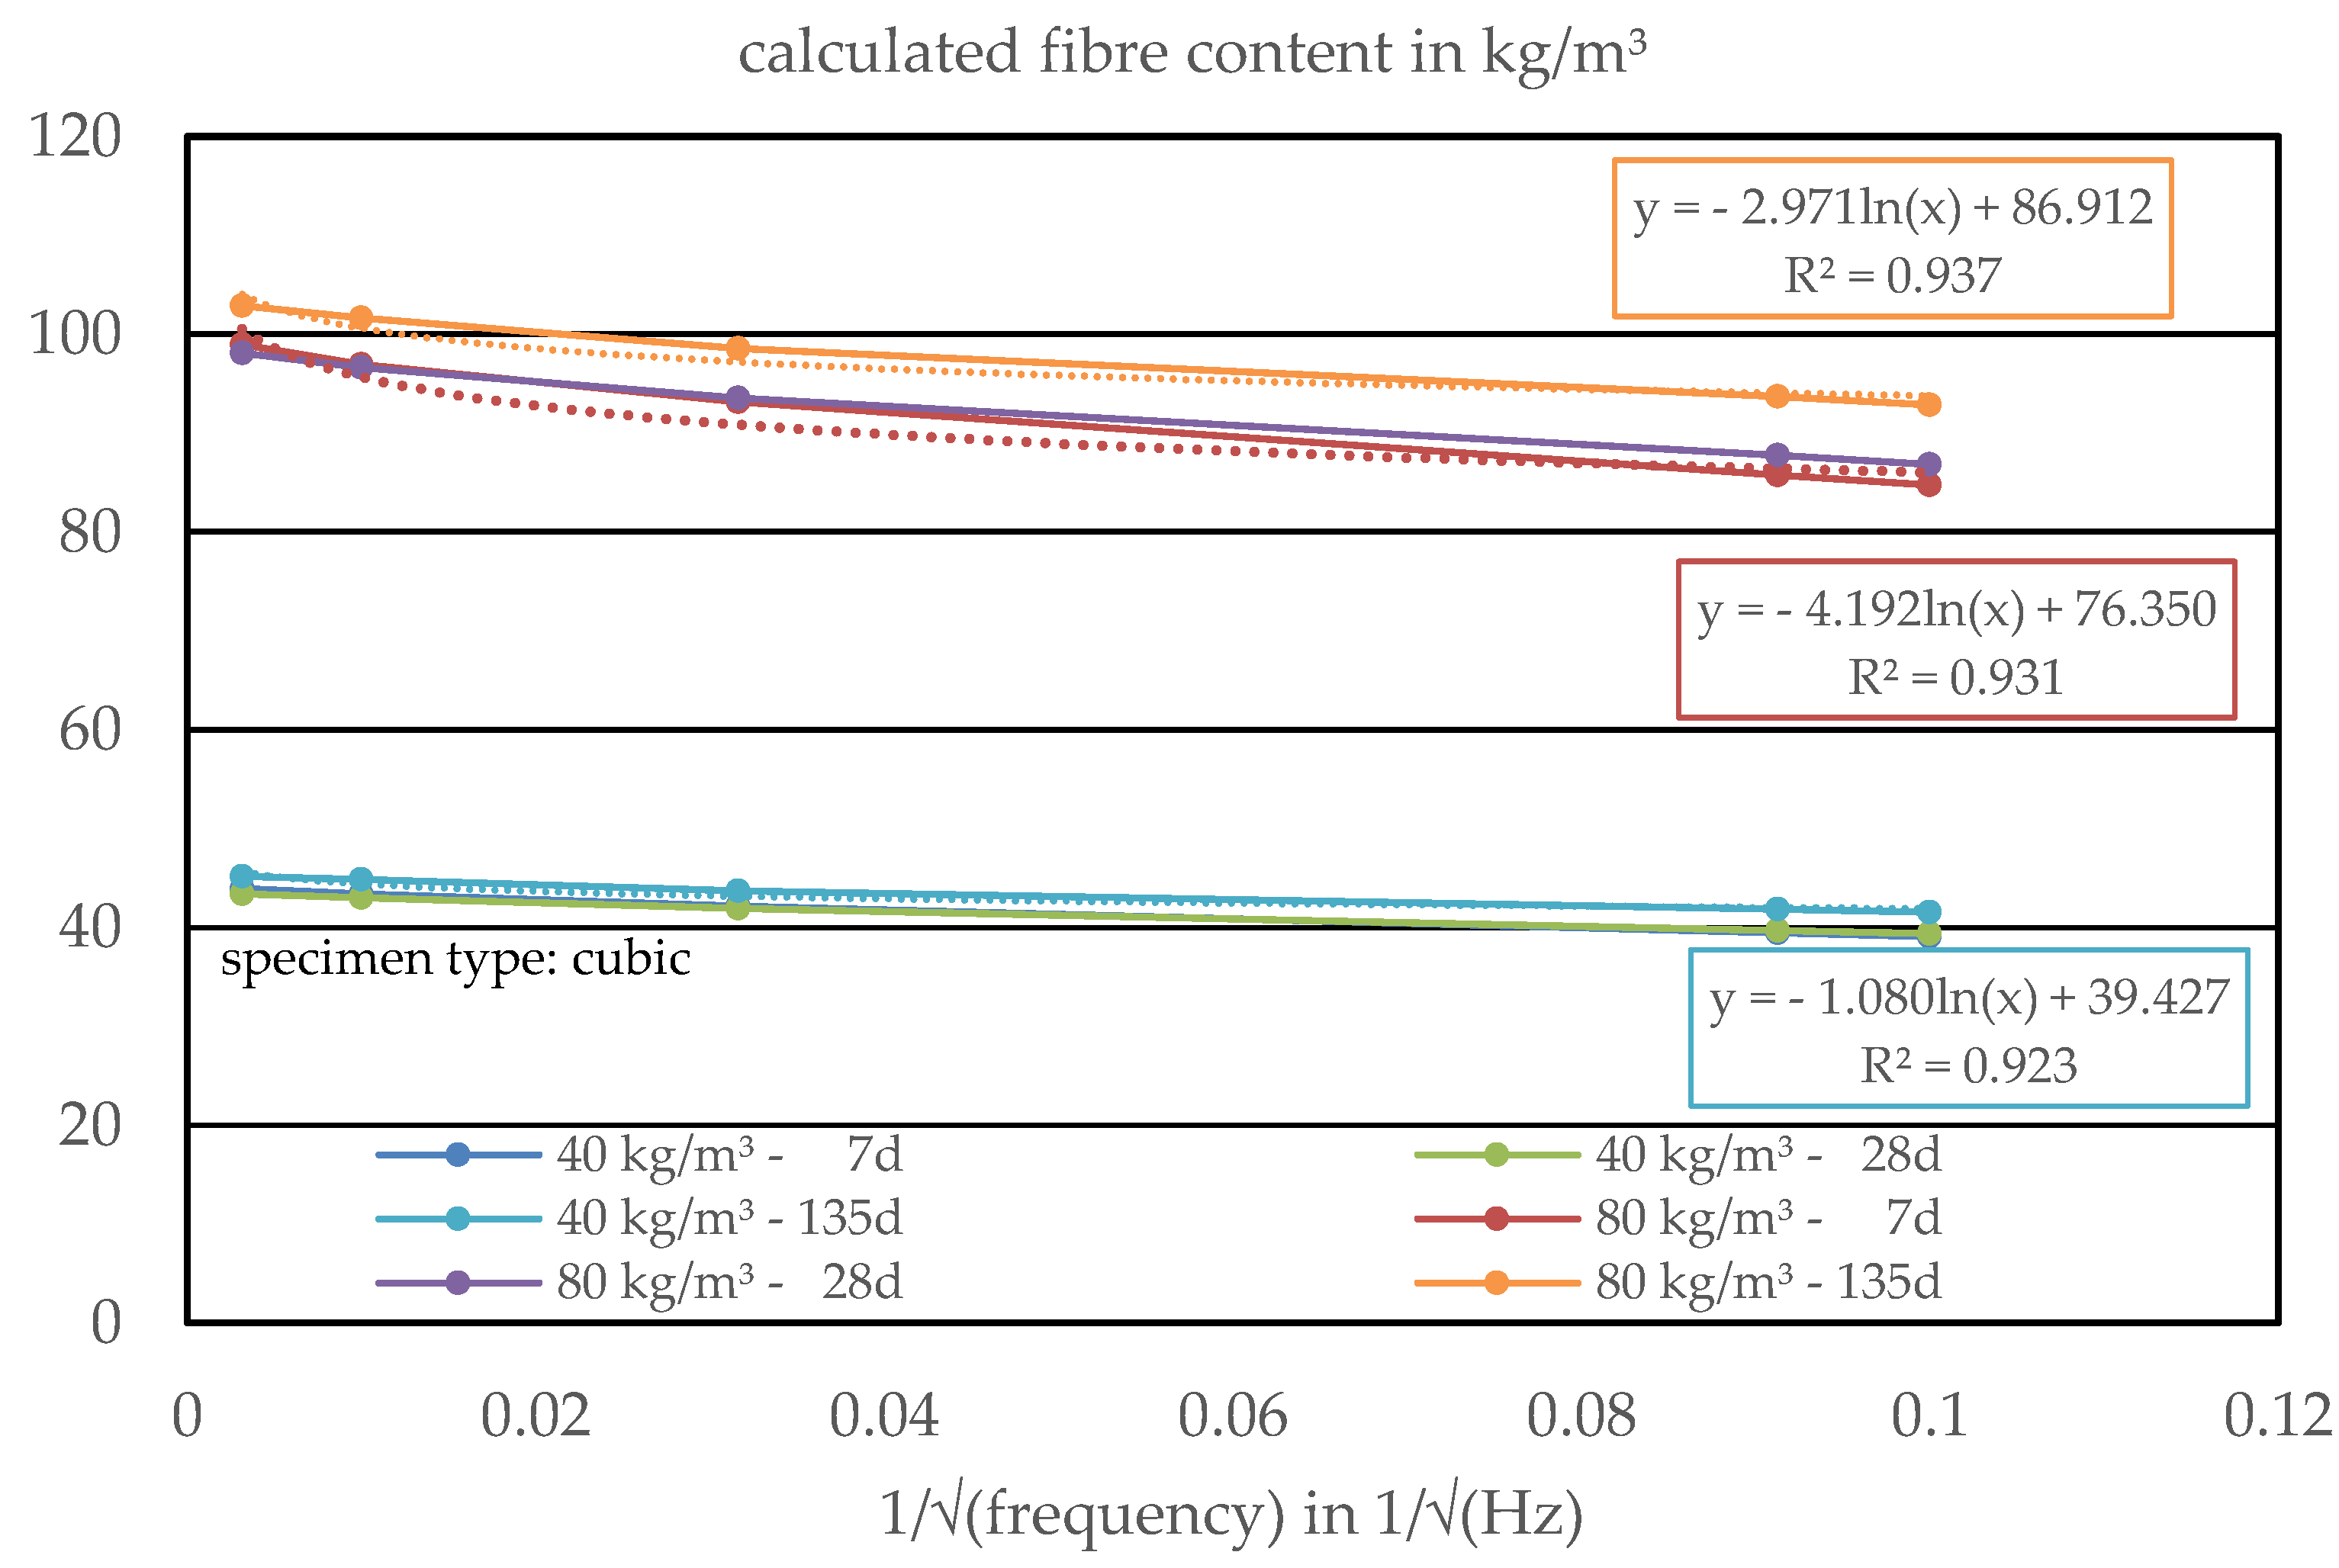
Based on these results, it was possible to calculate both the fibre content and the fibre orientation inside of each specimen, whereby it must be said that the electrical resistivity of the PC was averaged to have an ascertained reference value for the calculations. The calculated fibre content of the series of specimens is shown in Figure 6.
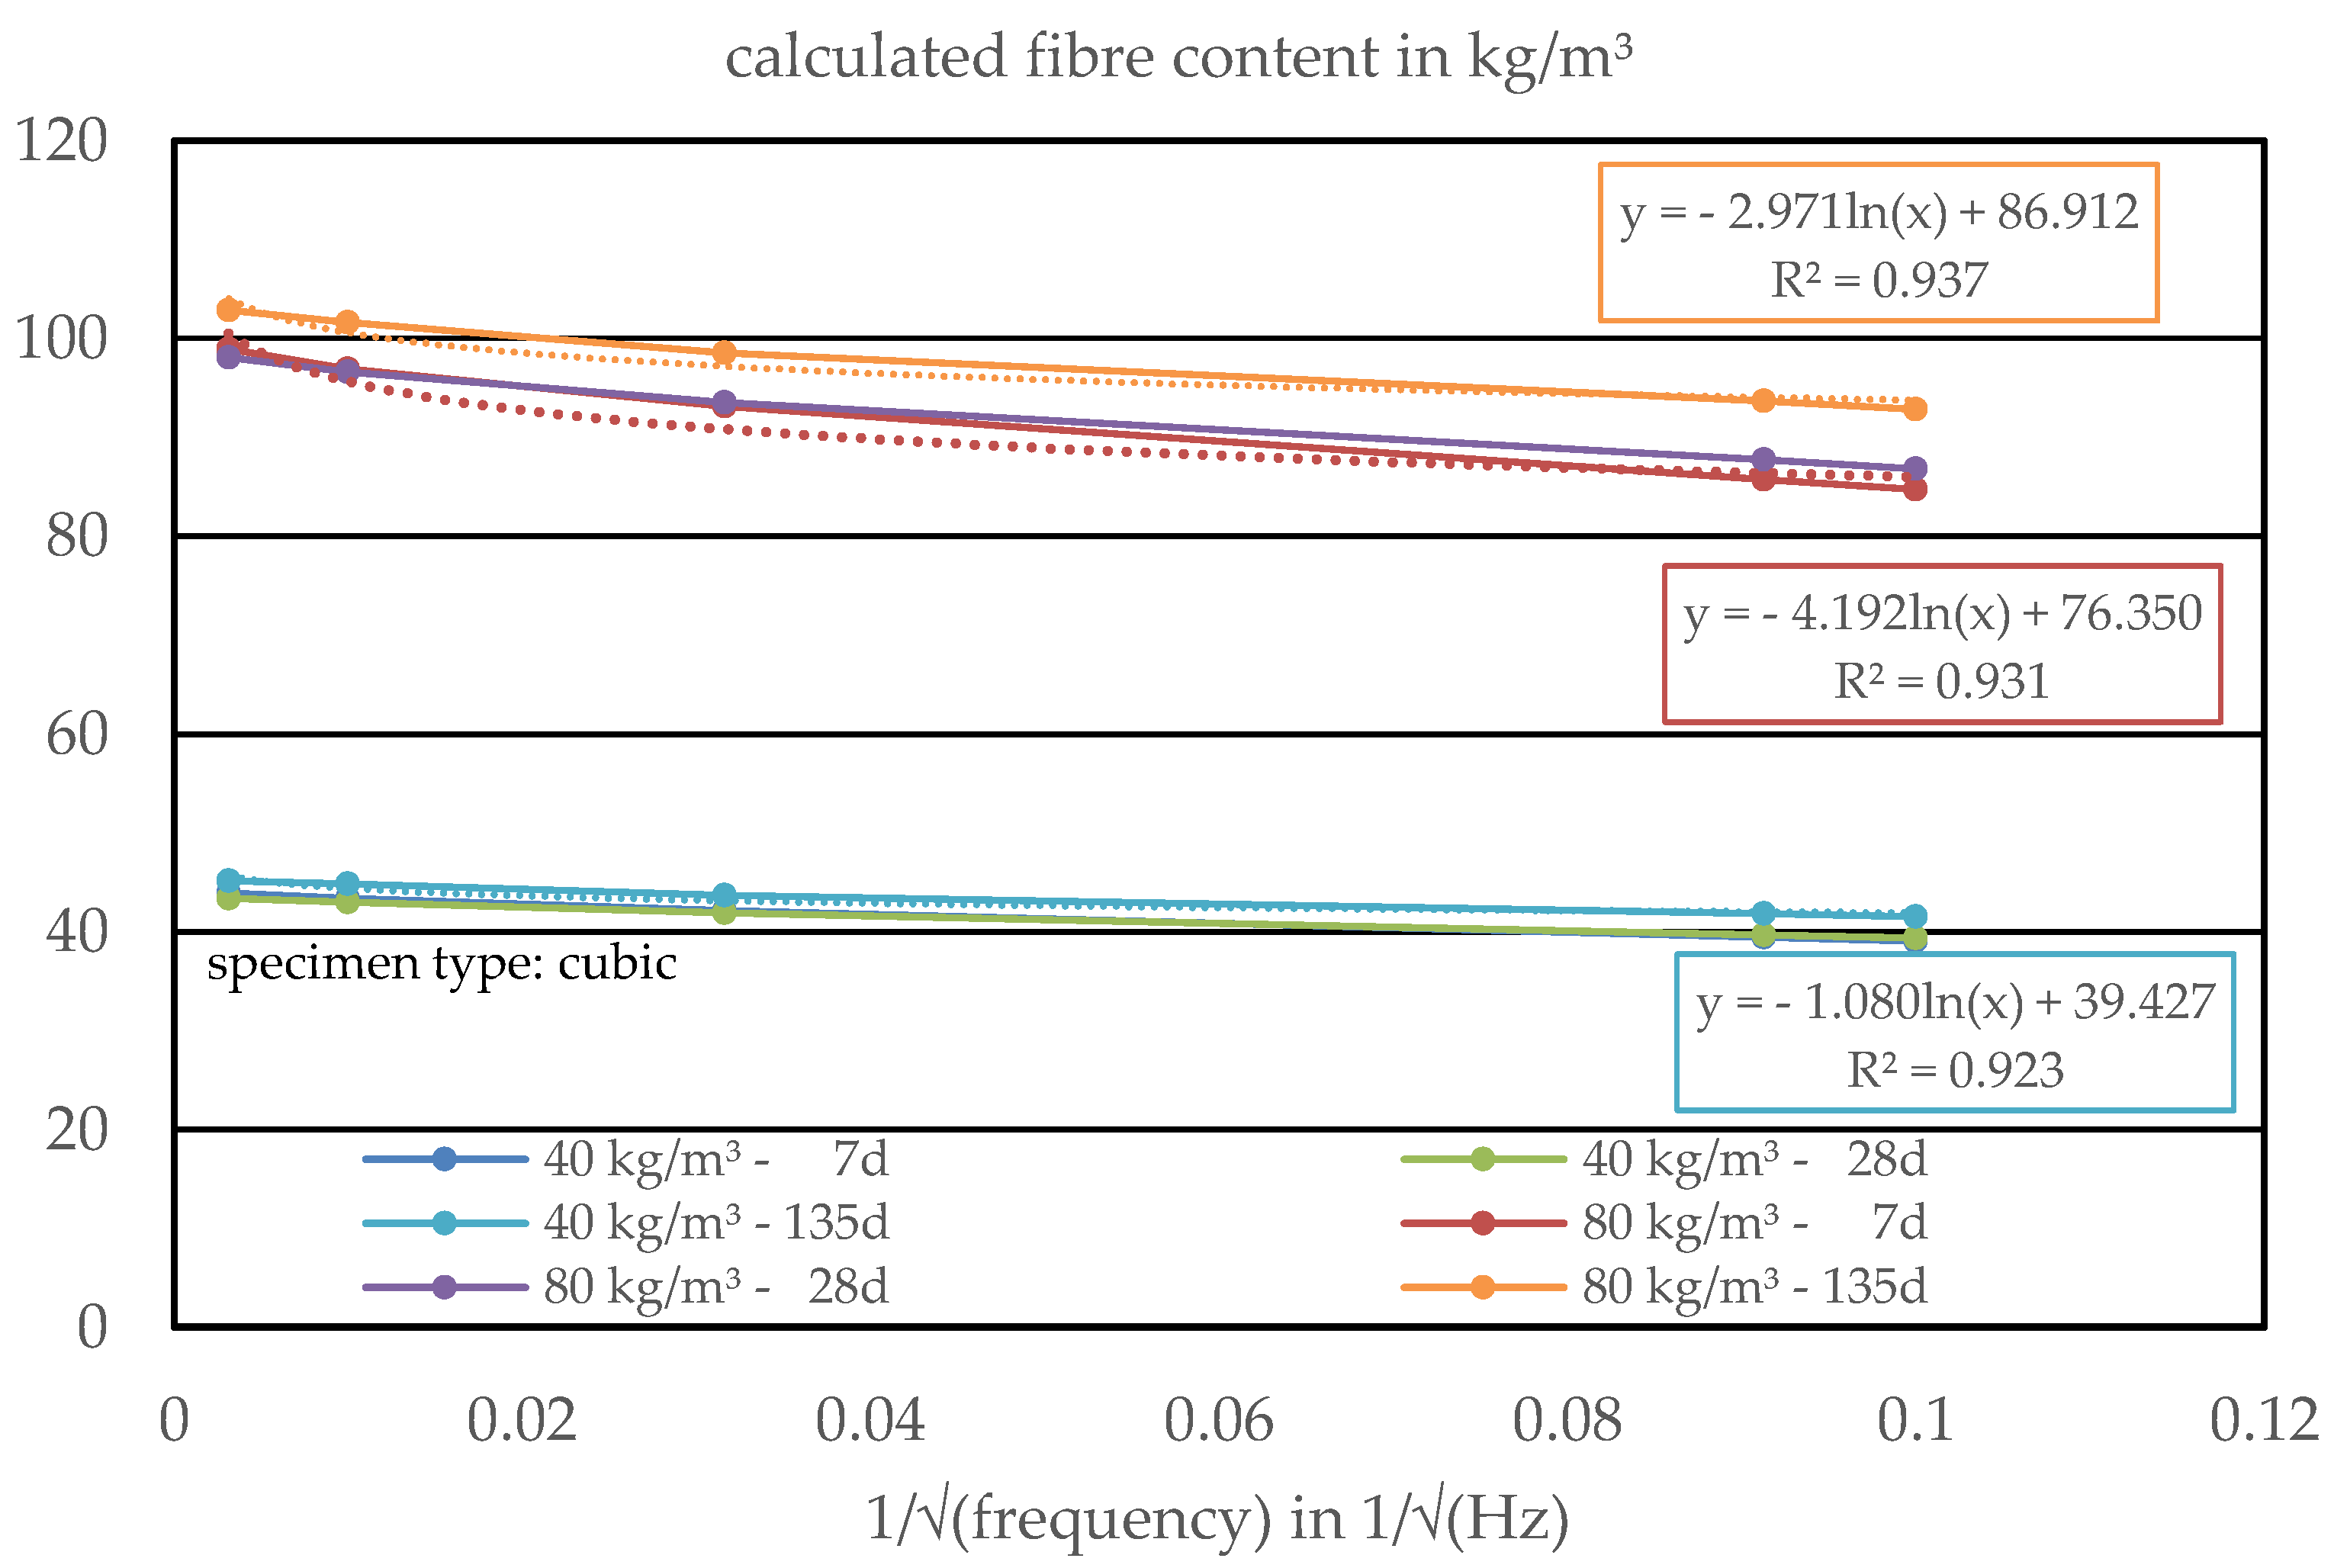
One can see that a higher concrete age results in a slightly higher value for the fibre content, as well as a higher frequency of the alternating current. These effects can be explained by the higher differences of conductivity of the concrete and the fibres in higher age, based on the hydration process and thus the refinement of the pore structure as well as changes in the pore chemistry. The differences in the results for varying frequencies are a result of the missing information for the phase angle of the current, which makes the calculation of the real part of the impedance impossible (see [1,11]). Nevertheless, it is clear to see that the graph of the fibre content versus the inverse of the square root of the frequency can be described by a logarithmic function a ∗ ln(x) + b, where the constant b can be used as an indicator for the fibre content of the material, where a higher concrete age gives a better coefficient of determination as well as a better fit of the calculated fibre content to the expectations based on the composition of the concrete. Therefore, an extrapolation of the graph infinity, which would mean a frequency of 0 Hz or direct current (DC), would lead to the corresponding fibre content of 39.427 kg/m3 and 86.912 kg/m3, respectively, for a concrete age of 135 days. For a concrete age of 28 days and a fibre content of 80 kg/m3, the calculated fibre content would be 76.350 kg/m3 and significantly lower than after 135 days. For the analysis of existing structures, a positive effect can be seen because the concrete is much older, and the hydration process has been completed. Looking at the results of the single specimens for the fibre content of 80 kg/m3 shows that specimen 1 must contain a much higher amount of fibres than the other two, and thus leads to an overestimation of the fibre content (see Figure 7). For the other two specimens, the calculated fibre content fits almost perfectly to the fibre content that was mixed in the PC. Even if the extrapolation of the curve to the infinite represents the use of DC, a test setup using DC cannot be recommended because of polarisation effects on the electrodes and thus time-depending results for the measurements.
While the frequency of the alternating current, as well as the age of the specimens, showed an influence of the calculated fibre content, for the fibre orientation, both parameters seem to be independent, as it was already occupied in the earlier tests (see [2]). Both the age of the specimen and the frequency of the alternating current led to results for the fibre orientation inside the concrete cubes with no significant variations. For a fibre content of 40 kg/m3, much more fibres are oriented in the horizontal directions with a proportional distribution of approximately 42% in each of the horizontal directions (see Figure 8). Since the concrete was compacted by a vibration table in a vertical direction, this result was expected. In addition, it can be analysed that there is a higher scatter in the horizontal directions than in the vertical one with fibre orientation coefficients of 35% to 50%.
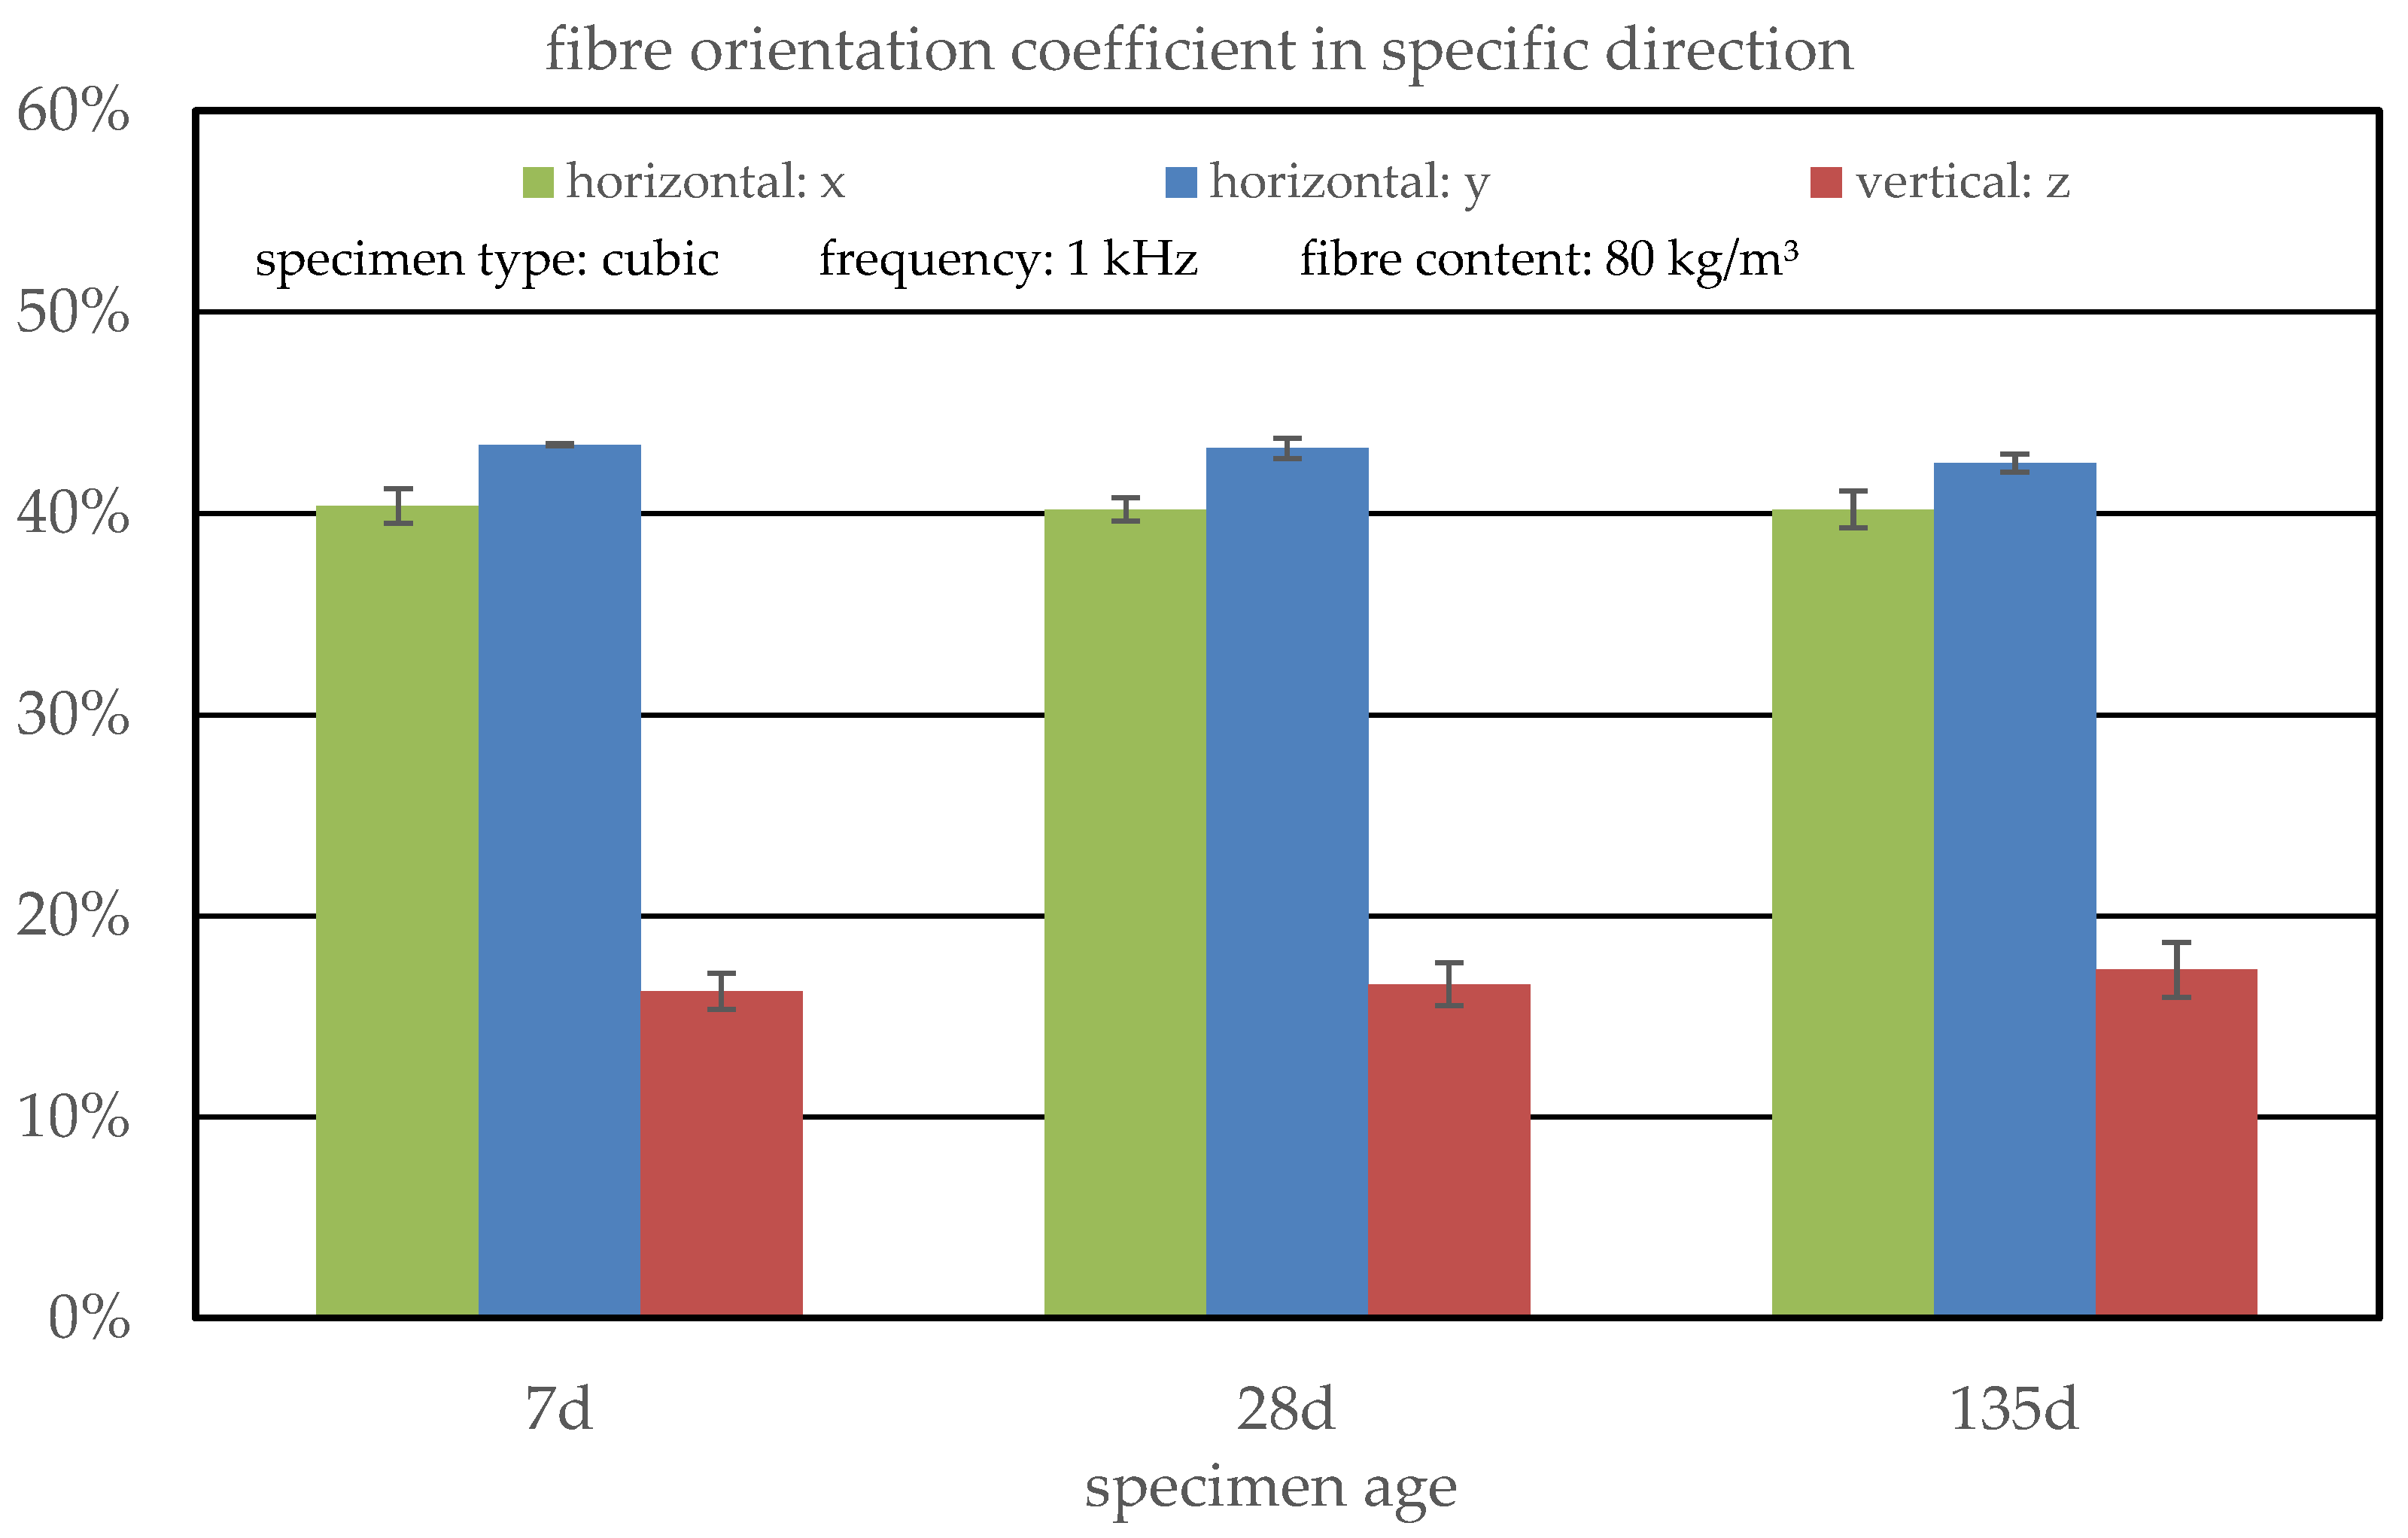
In contrast to this, the concrete with a higher fibre content of 80 kg/m3 shows lower variations even in the horizontal direction, which is based on the higher fibre content where fibres are expected to be oriented more uniformly (see Figure 9). This hypothesis can be verified by comparing to the vertically oriented fibres in both concretes, where in the SFRC, with a higher fibre content, more fibres are oriented in a vertical direction. Overall, a more 3-dimensional orientation of the fibres is detected. One explanation can be the size of the specimens. Due to the ratio of fibre length to smallest specimen dimension, in smaller specimens, a free distribution and orientation of the fibres with ongoing compaction process can be hindered by the formwork, and edge effects are the main influencing parameter for small specimens. In contrast to this, inside the cubes, there seems to be a volume in the middle, where the fibres are able to freely orientate themselves and only interact with the large grains, but no interaction with the edges of the formwork occurs.

3.2. Testing of Drilling Core Samples

3.2.1. Effect of the k-Value Based on the FEM Model

The first important step was to identify which parameters of the FEM model result in the most realistic and accurate geometry factors. On the one hand, simulating the electrodes with the electrical conductivity of stainless steel represents a good connection between concrete and electrode with no isolation. On the other hand, using the electrical resistivity of concrete represents an isolating effect by the wet sponge cloths that are soaked with pore solution and thus will have nearly the same resistivity as the concrete itself. Both possibilities have been tested, and the electrical resistivity of the PC was analysed with the help of both k-factors, given in Table A1 and Table A2. As a measurement from the bottom of the cylinder to its top was performed with the electrical conduction of the whole upper and lower surface, where the k-factor can be calculated by the surface area and the specimen length, the real values of the electrical resistivity of the concrete are well known.
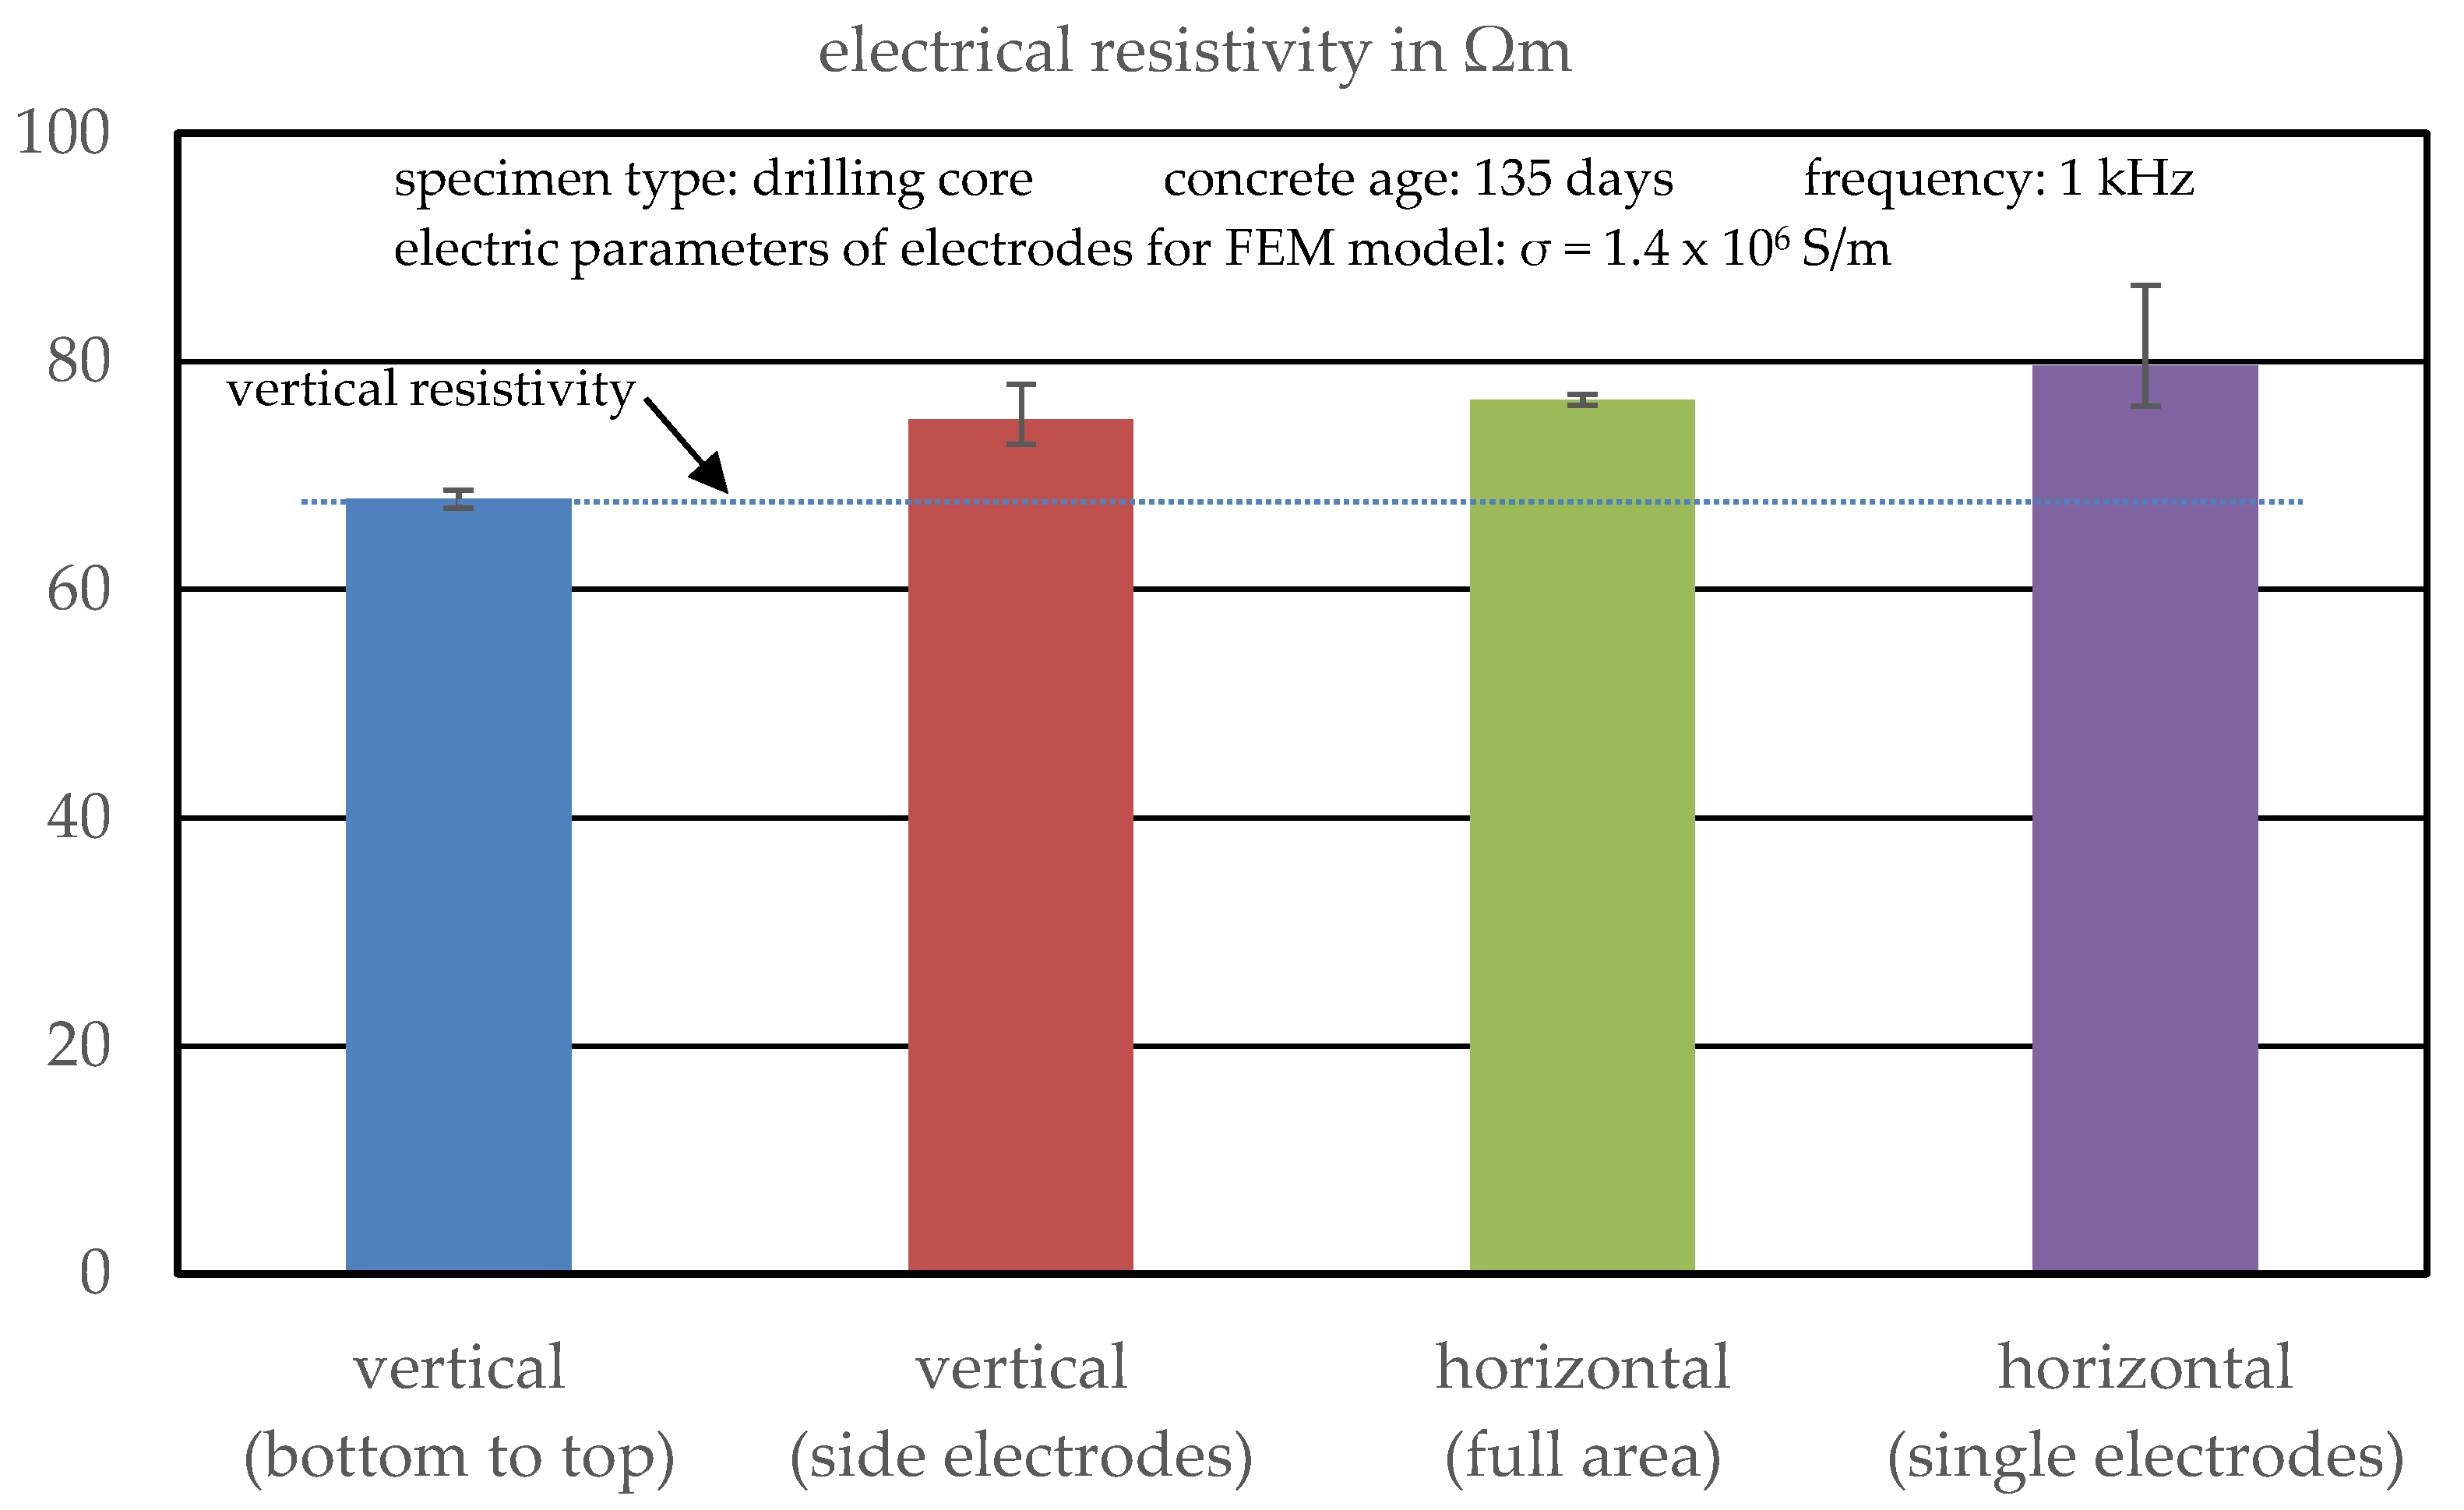
Figure 10 shows the comparison of the vertical resistivity, calculated with the easily calculated k-factor, and the vertical and horizontal resistivities of the drilling cores, calculated of the results of the FEM analysis, with the electrodes, simulated with the electric parameters of stainless steel. It is clear to see that the electrical resistivity of the nine drilling cores in a vertical direction, measured with the basic test setup, is approximately 68 Ωm with a very low deviation. The Comsol model with the electrodes’ electrical conductivity set to the one of stainless steel with 1.4 × 10⁶ S/m results in calculated resistivities that are significantly higher, and additionally have a higher scatter, based on a large number of test directions and the fact that only a part of the inhomogeneous specimen is analysed. Due to the good conductivity of the electrodes in the model, in this case, the geometry factors that are calculated are too high and do not represent the realistic behaviour of the test setup and the specimen. In particular, the vertical resistivity and the horizontal one with single electrodes show the largest deviations, which can be explained by the higher number of possible measurement directions and the lower specimen volume that is observed each time.
In contrast to this, setting the electrical resistivity of the electrodes in the FEM model to the one of concrete with 100 Ωm gives perfectly fitting results of the PC specimens in comparison to the real values of the measurement from bottom to the top of the specimen (see Figure 11). The scatter of the results is comparable to the results with the other k-factors, which means that the variation is based on the measurement results and not on the FEM modelling. Based on those results, it seems that there is only a marginal influence of the electrodes that are connected to the surface of the specimen but not electrically conducted for single measurements. Thus, the lower k-factors of the model, where the electrodes were simulated as concrete, are used for the further examination of the results. This observed behaviour of the results with the newly developed test method shows the opportunity to directly measure the electrical resistance of drilling cores instead of preparing expensive specimens by high effort to determine the fibre content. Here, the full area measurement in a horizontal direction and the vertical resistance, measured by the side electrodes, have sufficient accuracy and can later be used to build an estimation model.

3.2.2. Statistical Analysis of the Test Results

After optimising the FEM model, the electrical resistivity of the concrete specimens in different directions, as well as the variation for different specimens, were analysed.
As already seen for the cubic specimens, an increase of the fibre content results in a lower electrical resistivity (see Figure 12). In contrast to the prior results, the difference between the results of different fibre contents and the PC is much lower for the drilling cores. As one can see, a fibre dosage of 40 kg/m3 only decreases the electrical resistivity by about 20 Ωm, while another 40 kg/m3 lead to a decrease by about 10 Ωm. For the cubic specimens cast together with the plates, where the drilling cores were extracted, the electrical resistivity was determined to 29 Ωm for a fibre content of 40 kg/m3 respectively 18 Ωm for fibre content of 80 kg/m3. This fact is expected to lead to a lower accuracy of discrimination of different concretes based on resistivity measurements. Since the electrical resistivity of the PC is exactly in the same range for the drilling cores as for the cubic specimens, and the results of the basic test setup fit those of the vertical advanced setup, both factors, the test setup as well as the k-values by the Comsol model, can be eliminated as reasons for the unexpected high resistivity values. A possible reason could be the unknown fibre distribution inside the plates and so local deviations in the fibre content, which would lead to higher resistivities based on lower fibre contents for some specimens. On the other hand, in this case, there should also be some specimens with very high fibre contents and thus very low electrical resistivity what is not the case here. The second possible explanation of the high results could be the size of the specimens compared to the fibre length and thus the high probability of truncated fibres by the drilling process, while for the earlier tests, only complete fibres were present. Another thing that can be seen in the results is a differing fibre orientation, compared to the cubic specimens, that can be estimated by the similarity of the resistivity in a horizontal and vertical direction for the SFRC drilling cores.
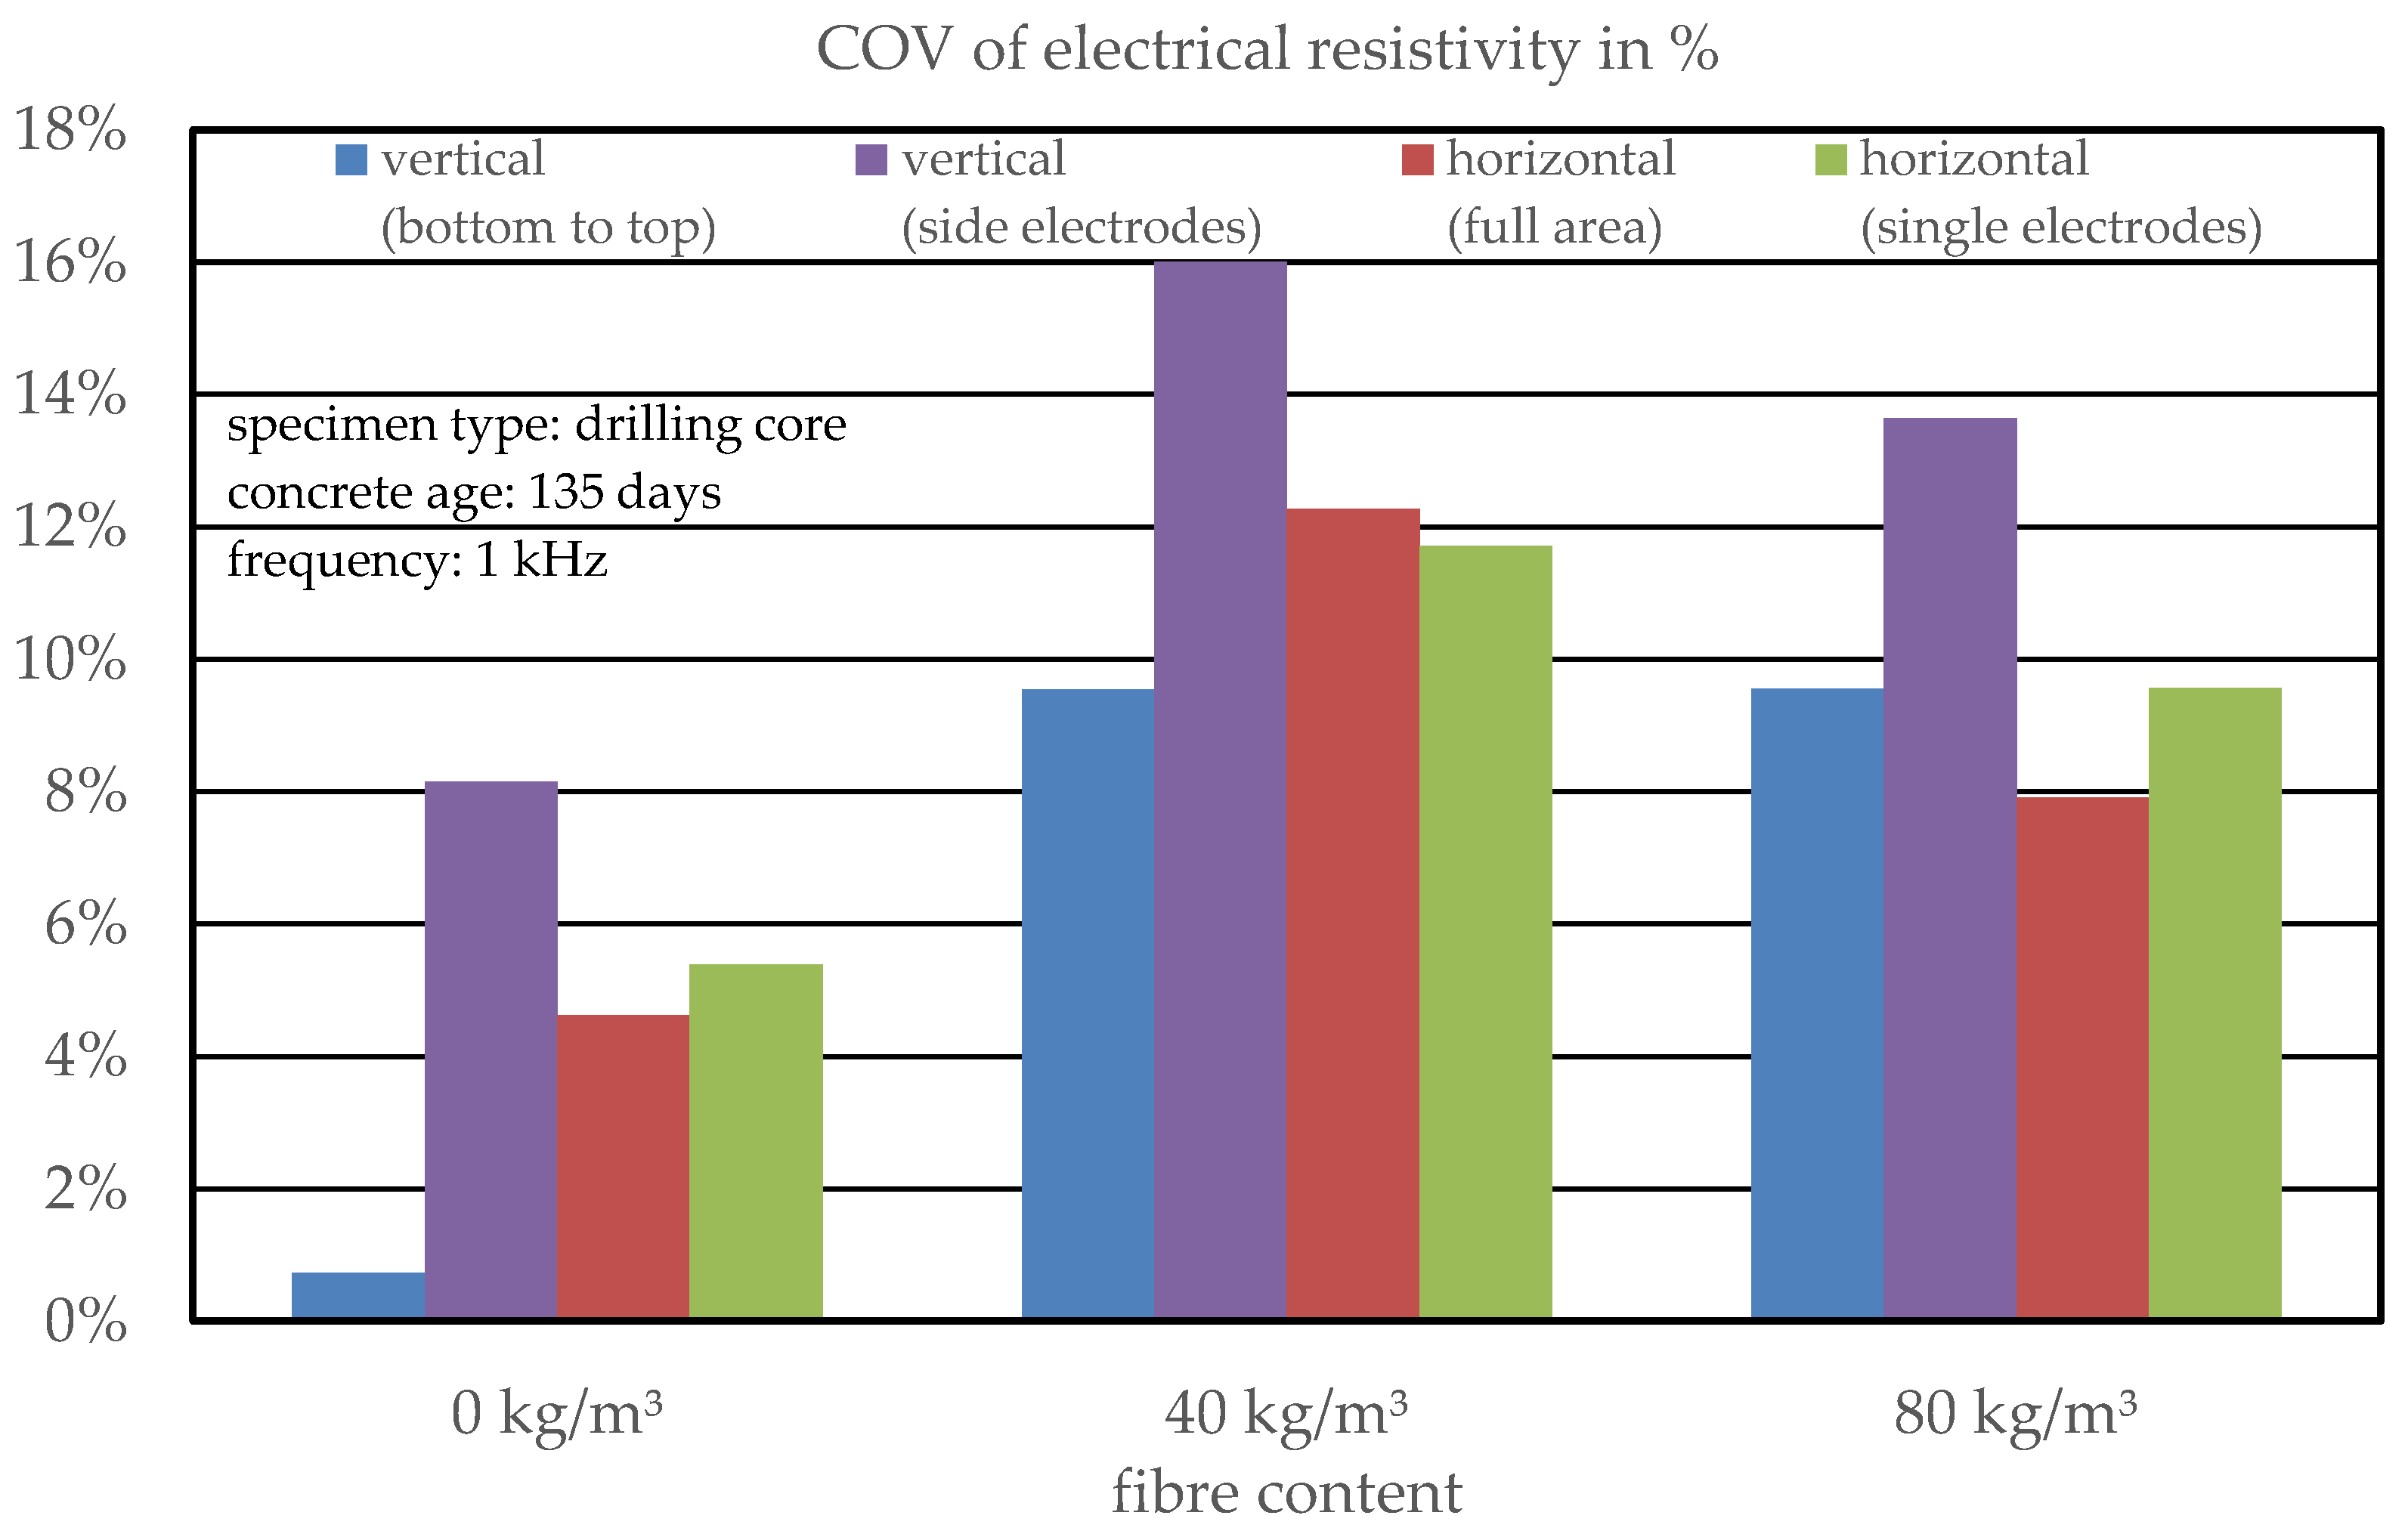
Regarding the variations of the different specimens, it was expected that the variations for PC would be the lowest because, for SFRC, the inhomogeneity and anisotropy of both concrete and fibres can be superpositioned and thus result in a higher variation. As presented in Figure 13, the expected behaviour can be observed, especially for a fibre content of 40 kg/m3, which shows the highest variations with up to 16%, while the PC samples only show COVs of less than 8%. For specimens with a higher fibre content of 80 kg/m3, the inhomogeneity of the fibres is tendentially lower than for lower fibre content, and thus the COV is also lower, but still not on the level of PC.
Comparing the variations in different directions of the specimens, it can be concluded that the variation in the vertical direction is slightly higher than for the horizontal direction. An explanation could be the possible segregation processes through the compaction even for robust concrete compositions, which result in small differences of the local water–cement ratio in different heights of the specimens as well as in a higher number of large aggregates in the lower zone of the specimen. In the horizontal direction for full area measurements and single electrode measurements, no significant differences regarding the variations can be detected, but it has to be considered that for the single electrode configuration, the number of measurements is three times higher than for the full area configuration because of the different height levels of the test setup. In summary, the results show that, especially for low fibre contents, but also for higher ones, several samples have to be analysed to gain robust results that allow the calculation of the fibre content and orientation of a concrete element, while for single specimens a comparably high inaccuracy can be expected.

3.2.3. Estimation of the Fibre Content

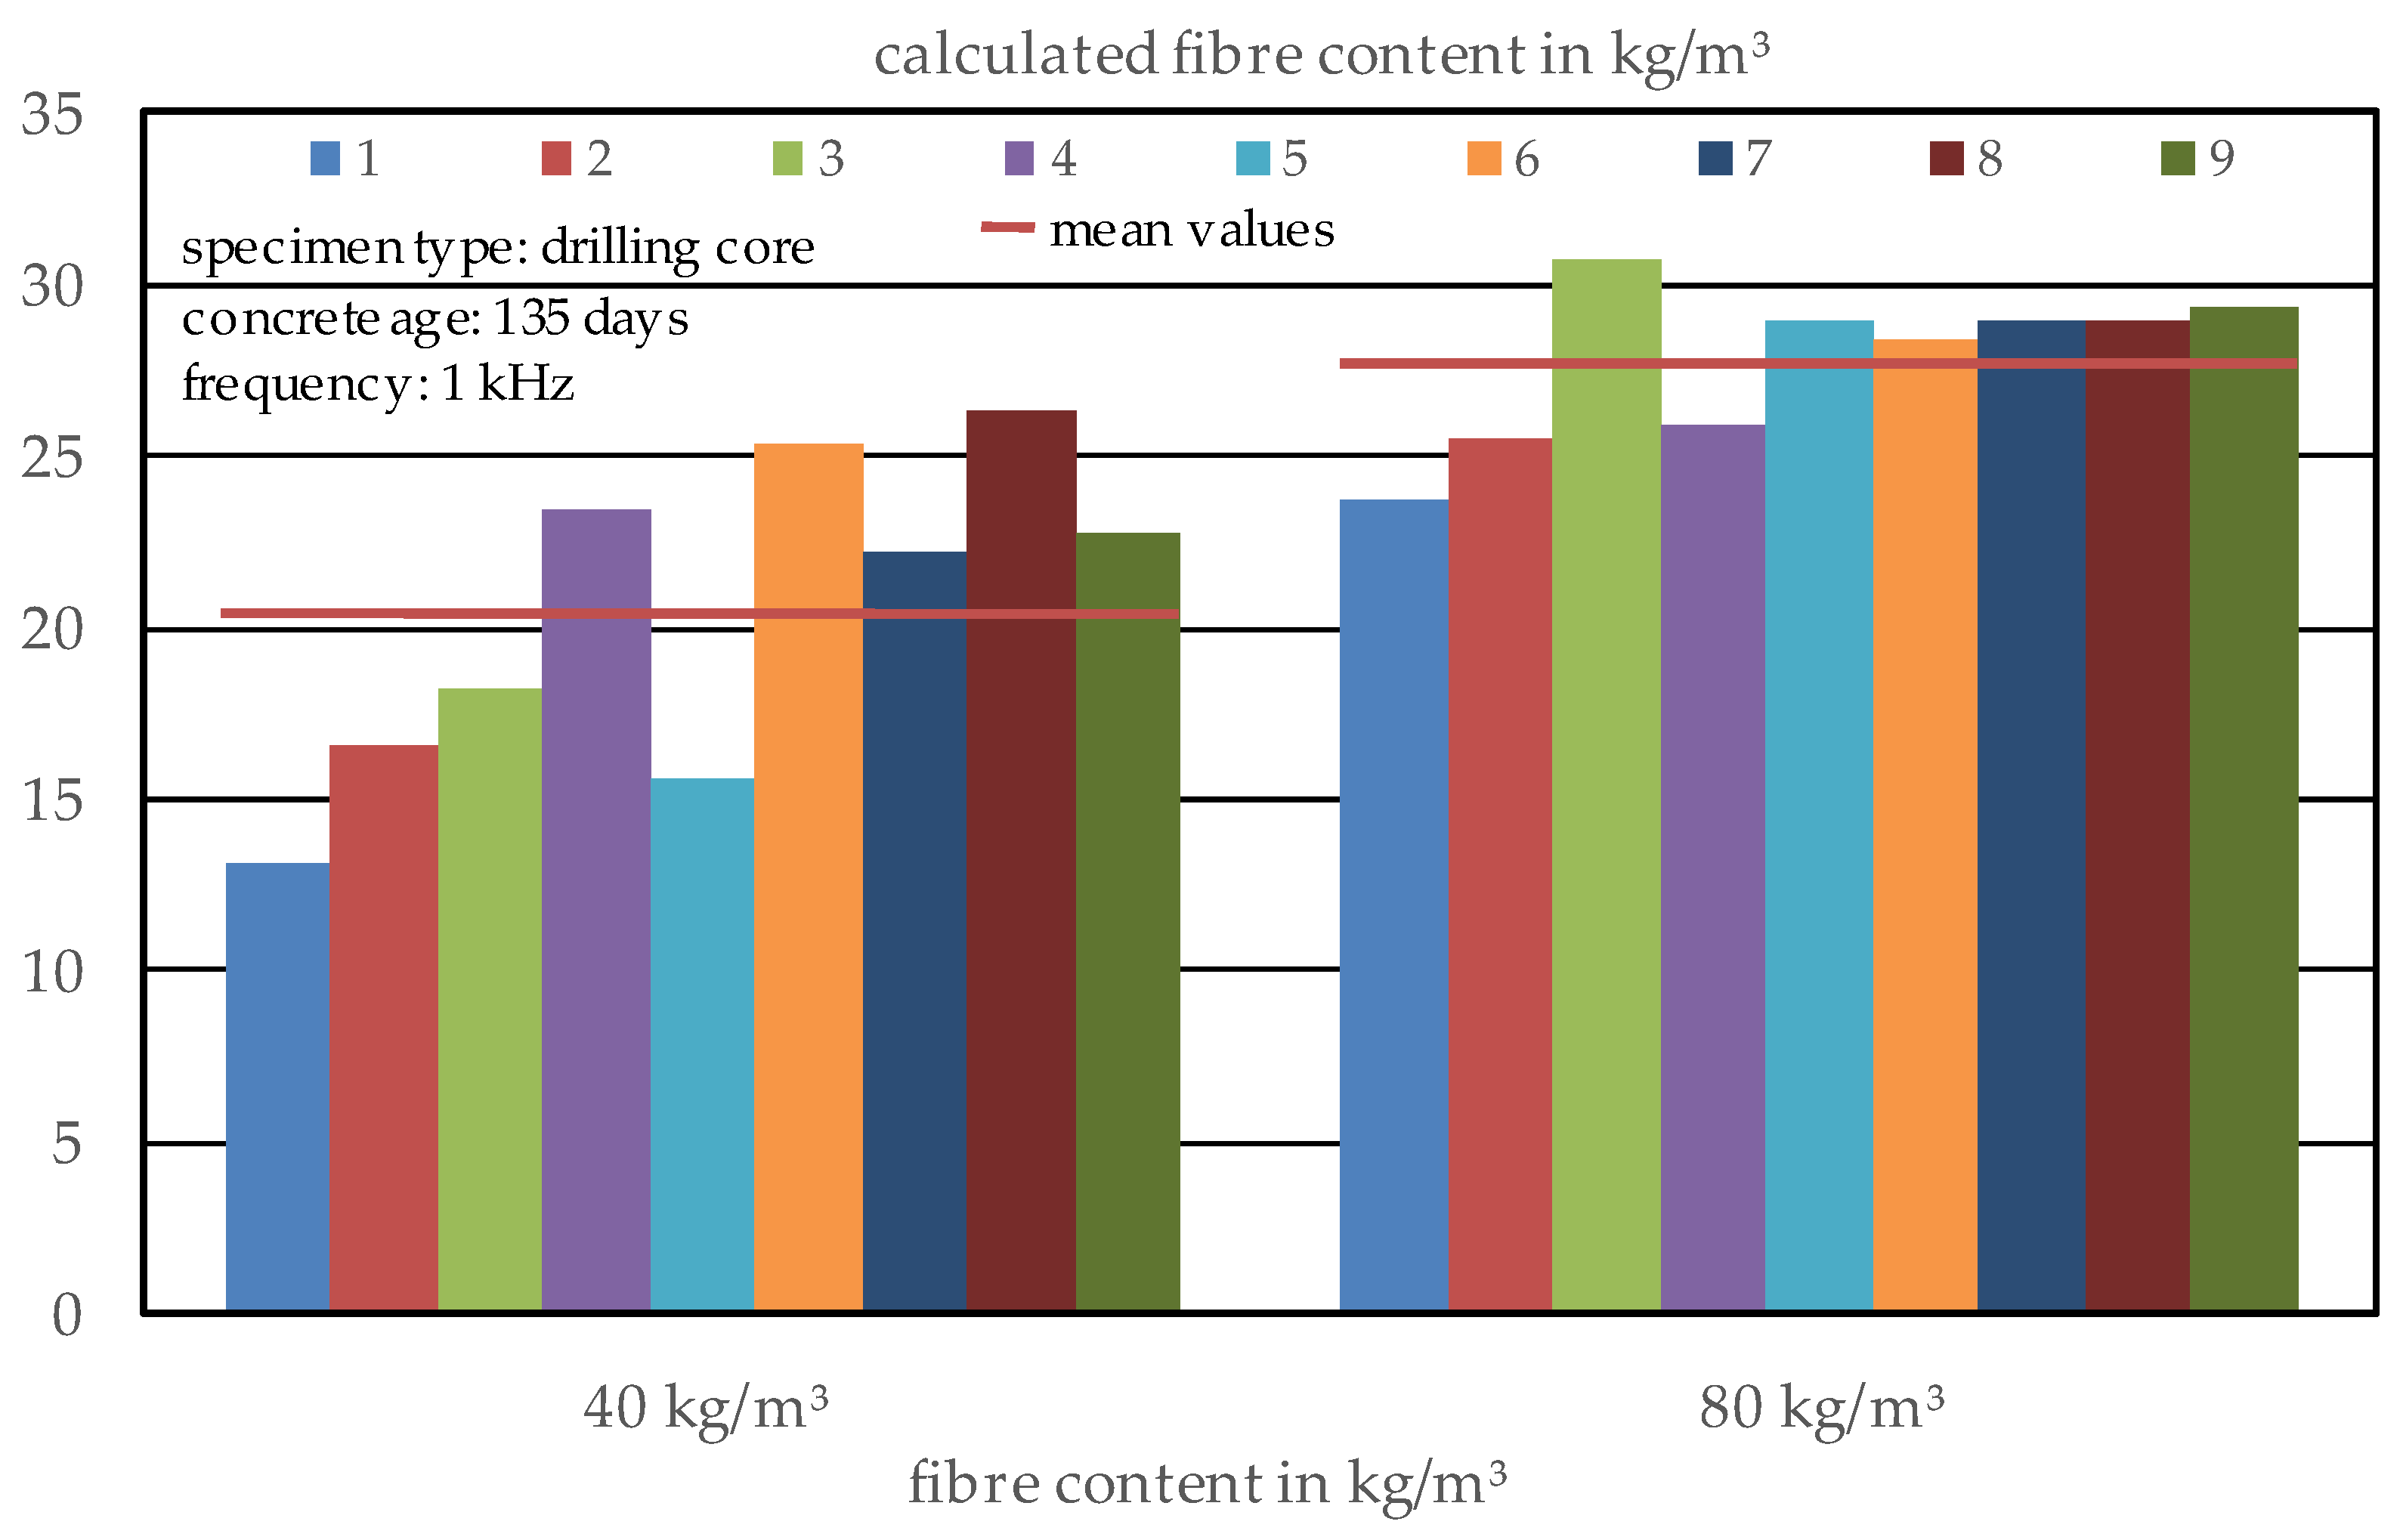
Based on the electrical resistivity, the fibre content of the concrete specimens was calculated with Equation (2). While for the cubic specimens (Section 3.1.2) for a frequency of the alternating current of 1 kHz, the fibre content was tendentially overestimated. For the drilling cores, a massive underestimation can be observed (Figure 14). For the specimens drilled of a plate with a fibre content of 40 kg/m3, a fibre content of 20.4 kg/m3 was calculated, which corresponds to 51% of the actual mixed in fibres. Furthermore, for the specimens, with a mixed fibre content of 80 kg/m3, the difference between the result and expectation is even higher with a calculated fibre content of 28.1 kg/m3, representing 35% of the expected content.
Both values are much too low, which is a result of the too high electrical resistivities of the specimens that were already described in Section 3.2.2 and could not be explained. In comparison to the results of earlier studies of the authors (see [2]) on casted cylindrical specimens, where the fibre content has been overestimated by trend, it seems that the open fibre ends and the cutting process of single fibres through the drilling process is the reason for this behaviour. The presumably best explanation could be the number of truncated fibres that lead to changes in the effective aspect ratio, which is used for the calculations. Truncated fibres thus could be calculated with a different aspect ratio, and so the estimation of the fibre content would be possible again. In this case, for the specimens with a fibre content of 40 kg/m3, a resulting aspect ratio of 39.9 can be calculated by use of Equation (3), when it is assumed that the fibre content inside the specimens is really 40 kg/m3. Concerning the fibre diameter of 1 mm, this can be interpreted as an average fibre length of 39.9 mm, which means a huge number of the fibres were cut by the drilling process. For the specimens with a fibre content of 80 kg/m3, the resulting fibre length to have a correct estimation of the fibre content is even smaller, with approximately 31.4 mm. Therefore, it can be concluded that the fibre length used for Equation (3) has to be adjusted and is a function of the fibre content itself with a decrease of the value by increasing fibre content or decreasing specimen size. As an asymptotic behaviour of this correlation can be assumed, an exponential curve was used to adjust Equation (3) based on the fibre content and the smallest dimension of the specimen. In this case, a factor could be derived from the results of the measurements that can be calculated by Equation (4) and has to be used to calculate the adjusted aspect ratio for Equation (3).
A R a d = A R   ( ( 1 l f d m i n ) + ( l f d m i n ) V f Φ ( d m i n l f ) )
with: ARad: adjusted aspect ratio of the fibres
lf: fibre length in mm
dmin: smallest specimen dimension
Vf: fibre volume, calculated by lf and dmin in mm3
Φ: expected fibre volume fraction
For the use of Equation (4), several parameters of the fibres, such as the fibre reinforced concrete, must be known or alternatively estimated. If there is no documentation of the fibre type and planned fibre content available, a small sample of concrete has to be crushed, and fibres have to be extracted to measure the actual fibre diameter and length. Additionally, the equation has to be used iteratively in combination with Equation (3) and adapted to determine the fibre content.
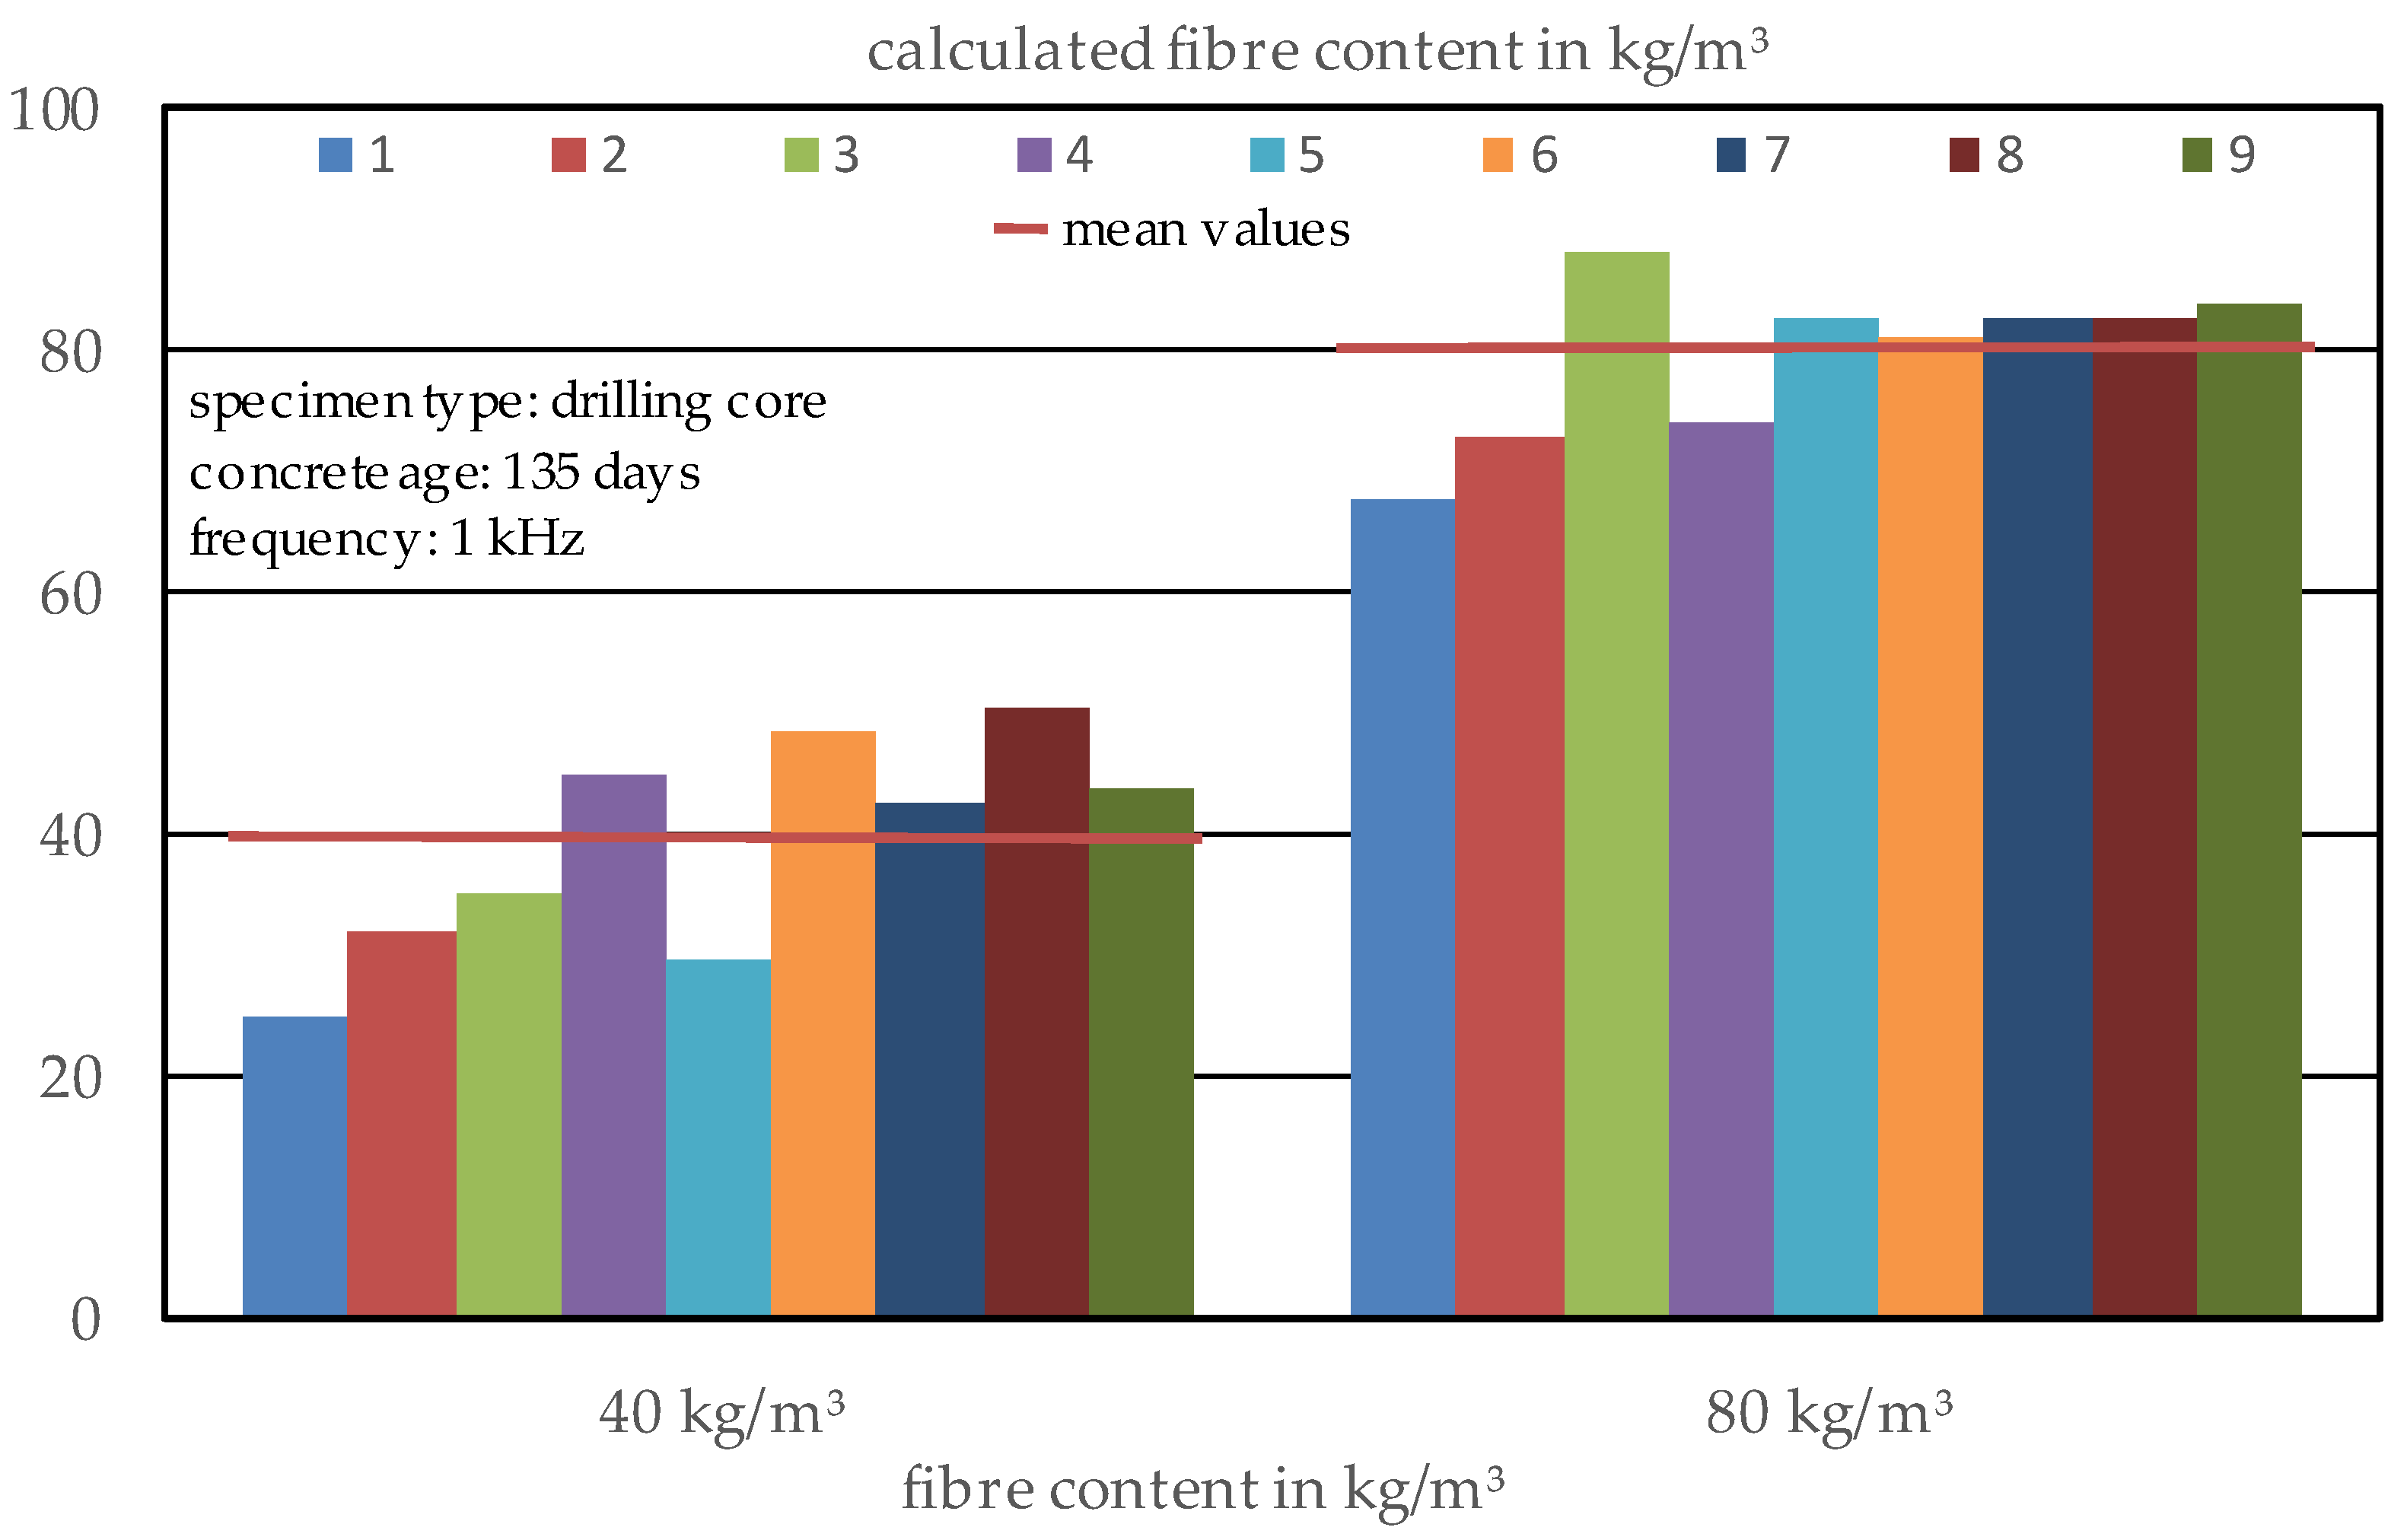
The calculation with the adjusted aspect ratio leads to significantly improved results for the fibre content (see Figure 15). For the lower fibre content of 40 kg/m3 large variations are visible with a minimum value of 25.1 kg/m3 and a maximum value of 50.5 kg/m3, which gives an accuracy of approximately ±35% for single measurements, but a very accurate value for a number of nine specimens. In contrast, for the higher fibre content of 80 kg/m3, the variations are smaller, with a minimum value of 67.8 kg/m3 and a maximum value of 88.0 kg/m3. This results in an accuracy of ±15% for single specimens.
Effects of the positions of the specimens inside the concrete plates, for example, specimen 5 in the middle and specimens 7 to 9 with low edge distances, can only marginally be detected, although the specimens 7 to 9 of both concretes show high values for the calculated fibre content, what could be a hint for fibre accumulations near the edges, which lead to a higher fibre content near the corners. However, the small number of samples and especially the inconsistent results for the other specimens makes it hard to decide if this observation is just a random phenomenon or if the position of the specimen really has an influence on the fibre content of the specimens.
One problem for future analysis is that either there must be an expected value for the fibre content to calculate the adjusted aspect ratio, or the specimen dimensions have to be chosen big enough to inhibit the problems with truncated fibres. Additionally, Equation (4) has to be reviewed with a large database of different SFRCs. After the revision of equation (4) based on an enlarged database, the test setup in combination with the FEM model will give the opportunity to estimate the fibre content of concrete structures by extracting drilling core samples, which only causes small damage to the whole structure.

3.2.4. Estimation of the Fibre Orientation

Although the determination of the fibre content seems to be problematic when no information about the concrete is available, the fibre orientation can be calculated without changes to any equations based on the electrical resistivity in different directions. As presented in Figure 16, for fibre content of 40 kg/m3, an unexpectedly high orientation factor in a vertical direction (mean value of 41%) is observed, while for each specimen, the factor in a vertical direction is above 1/3, so most of the fibres are detected in a vertical direction. In comparison to the cubic specimens, this behaviour is contrary but could be based on the large dimensions of the concrete plate where the drilling cores have been extracted from. The large dimensions lead to a high volume of concrete and thus a lower effectivity of the compaction by the vibration table, which for smaller specimens is the most influencing parameter for the fibre orientation. In addition, one can see a high scatter in orientation that reaches from 34% to 50% for the vertical and 20% to 38% for the horizontal direction. One interesting fact can be identified by comparing Figure 15 and Figure 16. Where a fibre orientation in a vertical direction of more than 40% is calculated, the calculated fibre content is significantly lower than the expected value of 40 kg/m3, which also is the mean value of all specimens. The same can be seen for specimen 8, which has the highest calculated fibre content and the lowest fibre orientation coefficient in a vertical direction. This correlation leads to the assumption that either the calculation of the global fibre content based on the three directions is slightly inaccurate, or the higher vertical orientation coefficient is a result of lacking horizontal fibres inside of single specimens. Again, a small influence of the specimen position inside the concrete plate could be assumed by looking at the results of specimens 7 to 9 with lower edge distances that show a higher horizontal orientation factor. Based on the compaction process, perhaps some fibres tend to orientate themselves on the walls of the formworks and thus are detected as horizontal fibres in the specimens near the formwork. Vertical fibres near the formwork are not detected because the distance between the drilling core and the formwork with half of the fibre length was chosen high enough not to be influenced by the walls.
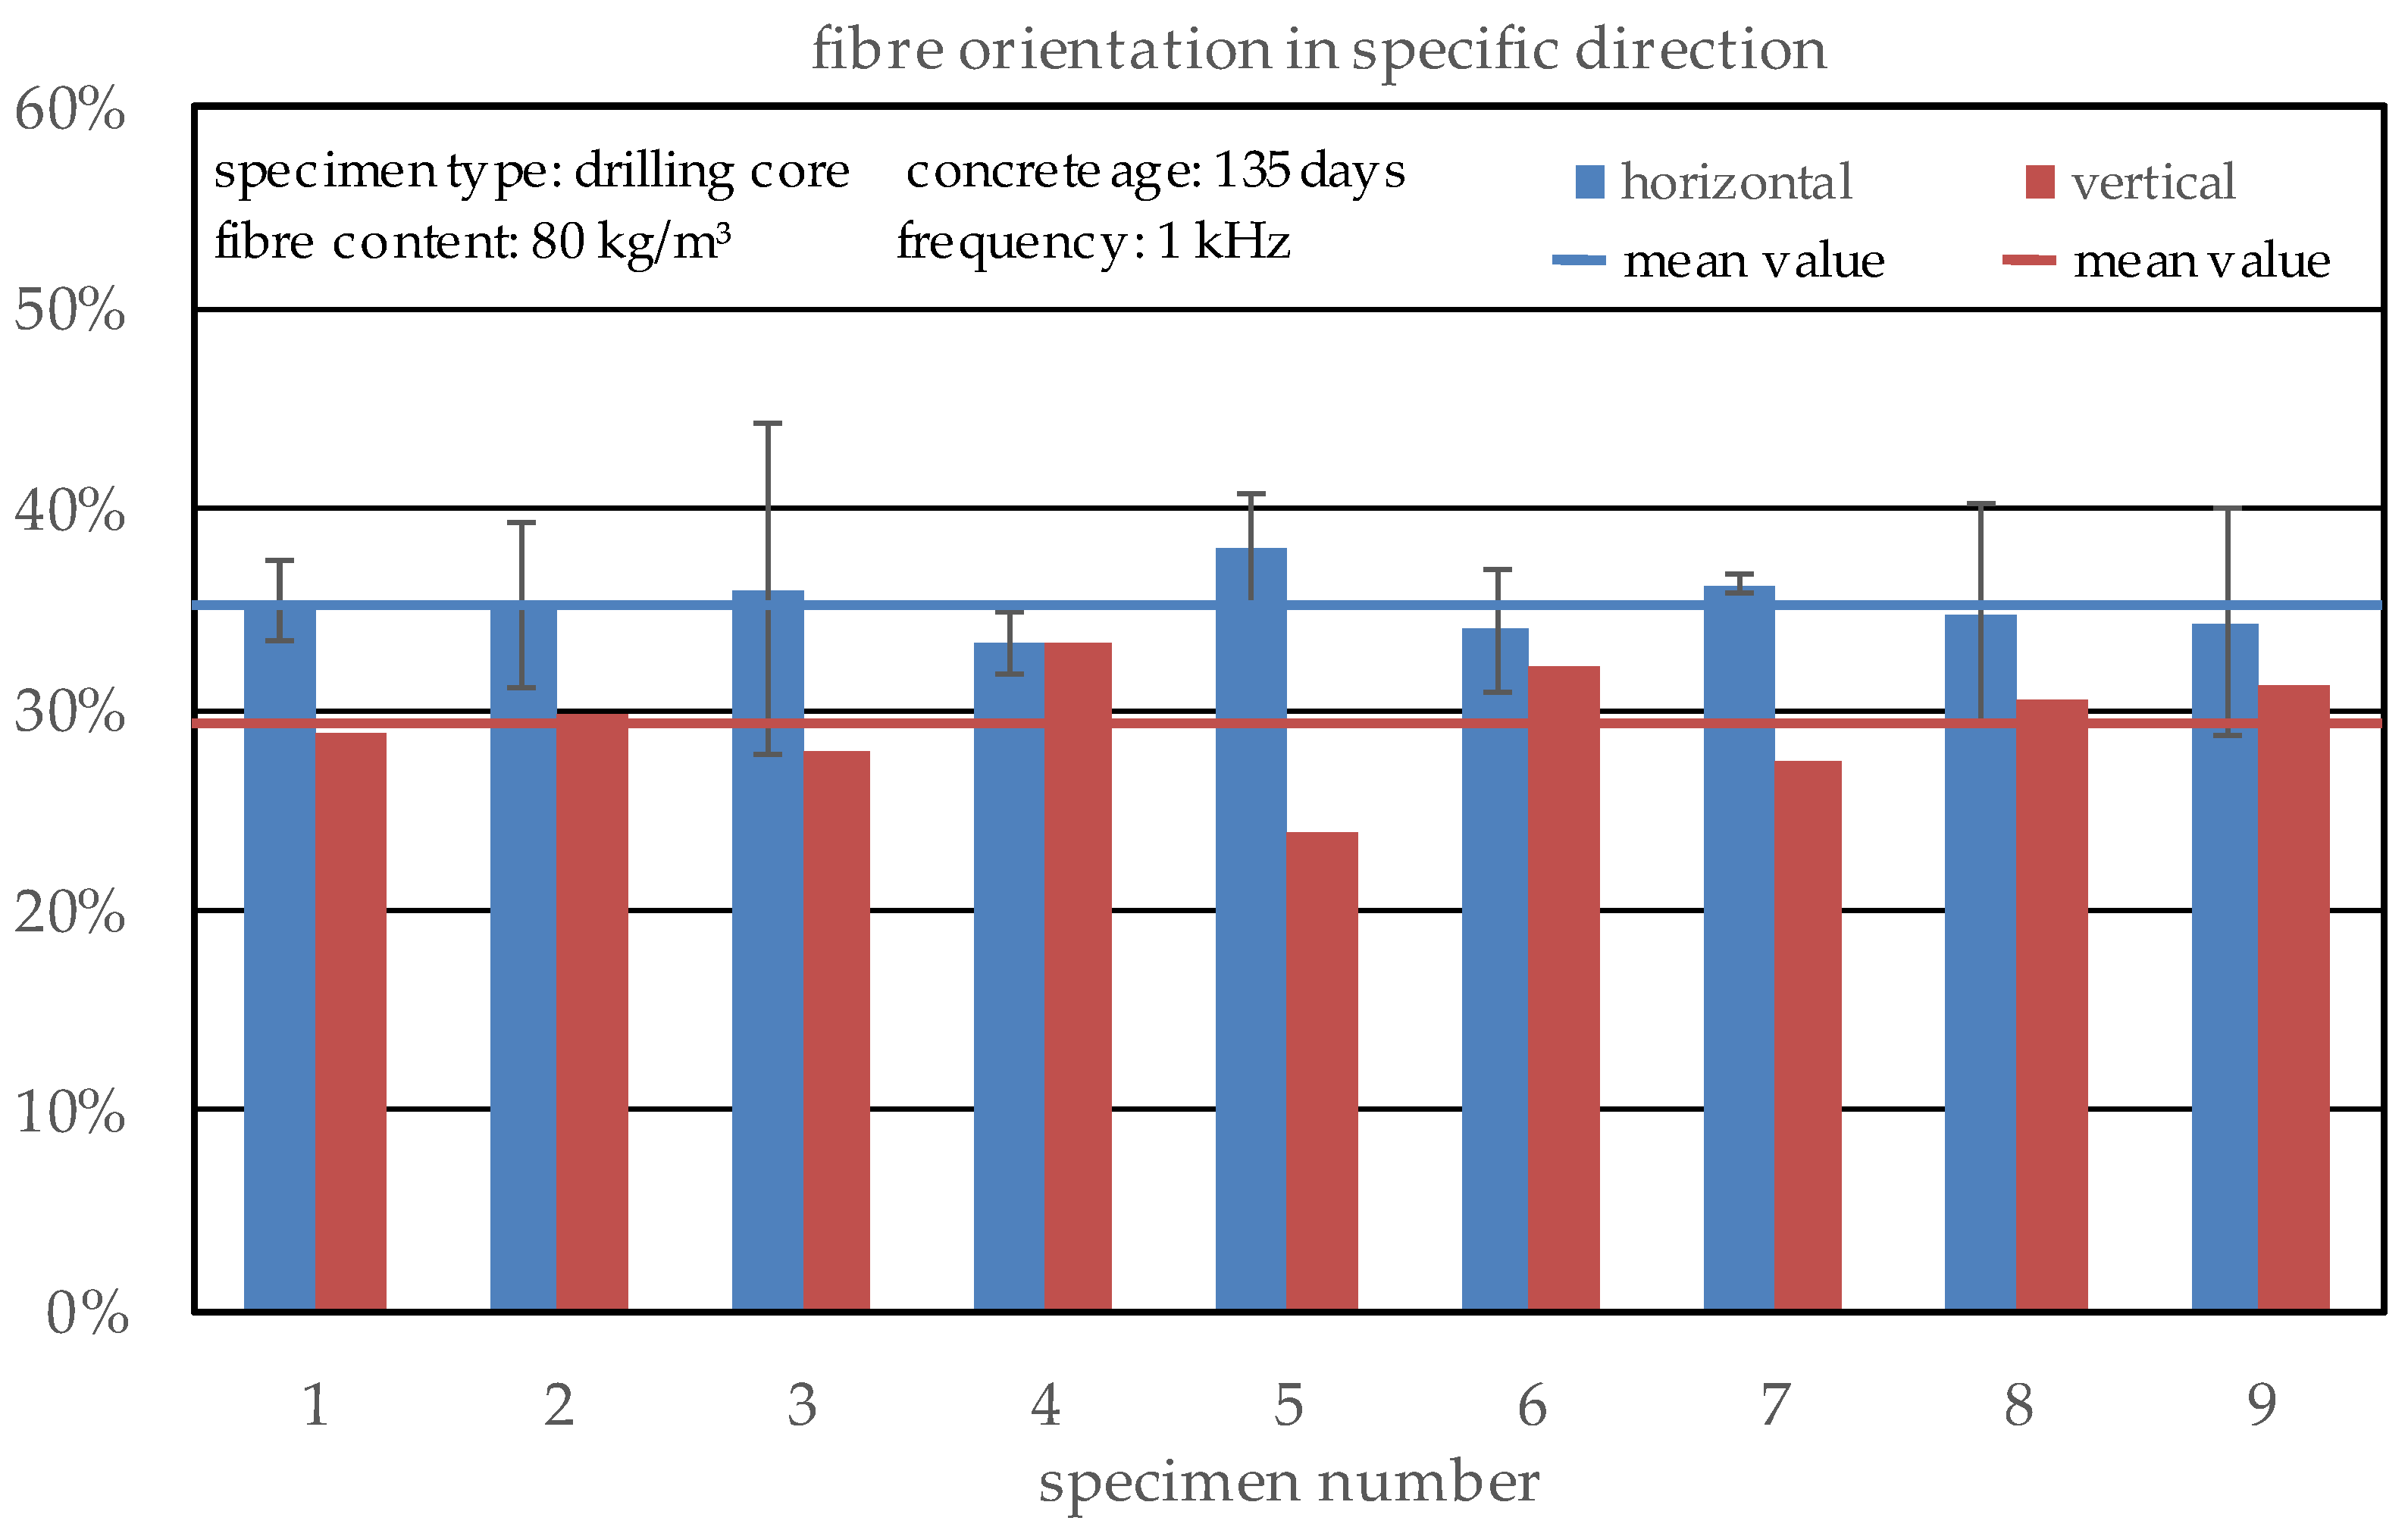
For the specimens with a higher fibre content of 80 kg/m3, the expected orientation of more than 2/3 of the fibres in the horizontal direction is detected with maximum values up to 44% and minimum values of about 28% (Figure 17). In addition, the uniformity of the specimens is much higher, and only specimen number 5 shows a significantly lower vertical orientation coefficient. A correlation of the calculated fibre content and orientation factors was observed for the lower fibre content. In this case, it cannot be seen, probably based on the more uniform fibre distribution and orientation and thus the better acceptance of the calculated global values. Compared to the orientation of separately cast SFRC specimens, the difference in the fibre orientation is clearly visible which means that the orientation of fibres inside SFRC in contrast to the fibre content cannot be determined on such specimens and a direct analysis of structural elements is necessary. Here, no big influences of the specimen’s position inside the concrete plate can be observed because of the relatively homogenous results in total. Only specimen number 5, which is in the centre of the plate, shows a significantly lower vertical fibre orientation factor, which can be explained by the flow process of the concrete through the compaction.

4. Conclusions

This paper presents the results of the evaluation phase of a newly developed non-destructive test setup for the determination of the fibre content and orientation of steel fibres in concrete based on electrical resistivity measurements by the investigation of drilling cores. The basic test setup was already developed, and the FEM model was constructed in the first part of this research project (see [2]). This part of the study contains the validation process, which was performed on drilling core samples to enable statistical analysis and, of course, conclusions regarding the accuracy of the method. The main findings of this work can be summarised as follows:
  • In contrast to AC-IS, the used method, based on electrical resistivity measurements, is much easier to use. However, similar models can be adapted to calculate both fibre content and orientation. One limitation in the application is the small amount of data that is used to calibrate the equations for the calculation of the fibre content for drilling cores which are needed to analyse structural elements or buildings.
  • Based on the data gained in this study, a coefficient dependent on the expected value was found to calculate an adjusted fibre aspect ratio as a new coefficient for the literature’s model for specimens with small dimensions where probably a huge number of fibres are truncated through the drilling process and thus the effective fibre length is much smaller than the original one.
  • With this coefficient, the fibre content of drilling cores can be estimated in a satisfying way, and thus the basis for the analysis of the fibre content of existing structures in an easy way has been provided. Independent of such a factor, the orientation of the fibres inside a specimen can be calculated comparative from the electrical resistivity in different directions, which can be measured with the cylindrical test setup very easily and fast.
  • The results show that the newly developed method is suitable for rapid and non-destructive structural diagnosis based on drilling cores using electrical resistivity measurements.
  • In further studies, the authors will focus on the verification of the correlation between the fibre content and the coefficient for adjusting the aspect ratio, especially by a variety of specimen size and fibre lengths. Additionally, different concretes with deviant compositions will be analysed to see if those calculations are applicable in a universal way or if additional adjustments are needed in some cases. Finally, the test setup and the models will be adjusted for several geometries in case of precast elements or existing structural elements.

Author Contributions

Conceptualisation, methodology, validation, formal analysis, investigation, data curation, visualisation, writing—original draft preparation: S.C. Review and editing, supervision, and advice: T.M. and M.R. All authors have read and agreed to the published version of the manuscript.

Funding

This research received no external funding.

Institutional Review Board Statement

Not applicable.

Informed Consent Statement

Not applicable.

Data Availability Statement

The data presented in this study are available on request from the corresponding author. The data are not publicly available due to ongoing project work.

Conflicts of Interest

The authors declare no conflict of interest.

Appendix A

Table A1. Geometry factors k for the drilling core analysis, calculated by Comsol with an electrode array with angular distances of 90° and electrical conductivity of the electrodes in Comsol model of stainless steel: 1.4 × 10⁶ S/m.
Electrode AElectrode Bk-Value
Height LevelAngleHeight LevelAngle
allall180°0.071866
all90°all270°
11180°0.026653
190°1270°
33180°
390°3270°
22180°0.027555
290°2270°
1all2all0.086957
2all3all
1all3all0.054714
Table A2. Geometry factors k for the drilling core analysis, calculated by Comsol with an electrode array with angular distances of 90° and electrical resistivity of the electrodes in the Comsol model of concrete: 100 Ωm.
Electrode AElectrode Bk-Value
Height LevelAngleHeight LevelAngle
allall180°0.063497
all90°all270°
11180°0.023066
190°1270°
33180°
390°3270°
22180°0.023768
290°2270°
1all2all0.076614
2all3all
1all3all0.048069

References

  1. Cleven, S.; Raupach, M.; Matschei, T. Electrical Resistivity of Steel Fibre-Reinforced Concrete—Influencing Parameters. Materials 2021, 14, 3408. [Google Scholar] [CrossRef] [PubMed]
  2. Cleven, S.; Raupach, M.; Matschei, T. A New Method to Determine the Steel Fibre Content of Existing Structures—Test Setup and Numerical Simulation. Appl. Sci. 2022, 12, 561. [Google Scholar] [CrossRef]
  3. Gettu, R.; Gardner, D.R.; Saldívar, H.; Barragán, B.E. Study of the distribution and orientation of fibers in SFRC specimens. Mater. Struct. Mater. Constr. 2005, 38, 31–37. [Google Scholar] [CrossRef]
  4. Gouri Mohan, L.; Nazeer, M.; Nizad, A.; Suresh, S. Fibre reinforced concrete—A state-of-the-art review. Int. J. Earth Sci. Eng. 2010, 3, 634–642. [Google Scholar]
  5. Martinelli, P.; Colombo, M.; Pujadas, P.; De la Fuente, A.; Cavalaro, S.; Di Prisco, M. Characterization tests for predicting the mechanical performance of SFRC floors: Identification of fibre distribution and orientation effects. Mater. Struct. Mater. Constr. 2021, 54, 1–16. [Google Scholar] [CrossRef]
  6. Molins, C.; Aguado, A.; Saludes, S. Double Punch Test to control the energy dissipation in tension of FRC (Barcelona test). Mater. Struct. 2008, 42, 415–425. [Google Scholar] [CrossRef] [Green Version]
  7. Barnett, S.J.; Lataste, J.; Parry, T.; Millard, S.G.; Soutsos, M.N. Assessment of fibre orientation in ultra high performance fibre reinforced concrete and its effect on flexural strength. Mater. Struct. Mater. Constr. 2010, 43, 1009–1023. [Google Scholar] [CrossRef]
  8. Kobaka, J.; Katzer, J.; Ponikiewski, T.A. combined electromagnetic induction and radar-based test for quality control of steel fibre reinforced concrete. Materials 2019, 12, 3507. [Google Scholar] [CrossRef] [Green Version]
  9. Luo, T.; Zhang, C.; Sun, C.; Zheng, X.; Ji, Y.; Yuan, X. Experimental investigation on the freeze–thaw resistance of steel fibers reinforced rubber concrete. Materials 2020, 13, 1260. [Google Scholar] [CrossRef] [Green Version]
  10. Rossi, B.; Wolf, S. Steel fibre reinforced concrete for the future of tunnel lining segments—A durable solution. In Proceedings of the Tunnels and Underground Cities: Engineering and Innovation Meet Archaeology, Architecture and Art; CRC Press: Boca Raton, FL, USA, 2019; Volume 1, pp. 2978–2985. [Google Scholar] [CrossRef]
  11. Woo, L.Y.; Wansom, S.; Ozyurt, N.; Mu, B.; Shah, S.P.; Mason, T.O. Characterizing fiber dispersion in cement composites using AC-Impedance Spectroscopy. Cem. Concr. Compos. 2005, 27, 627–636. [Google Scholar] [CrossRef]
  12. Zak, G.; Park, C.B.; Benhabib, B. Estimation of Three-Dimensional Fibre-Orientation Distribution in Short-Fibre Composites by a Two-Section Method. J. Compos. Mater. 2000, 35, 316–339. [Google Scholar] [CrossRef]
  13. Zhang, P.; Li, Q.; Chen, Y.; Shi, Y.; Ling, Y. Durability of steel fiber-reinforced concrete containing SiO2 nano-particles. Materials 2019, 12, 2184. [Google Scholar] [CrossRef] [Green Version]
  14. Cugat, V.; Cavalaro, S.H.P.; Bairán, J.M.; de la Fuente, A. Safety format for the flexural design of tunnel fibre reinforced concrete precast segmental linings. Tunn. Undergr. Space Technol. 2020, 103, 103500. [Google Scholar] [CrossRef]
  15. Herrmann, H.; Boris, R.; Goidyk, O.; Braunbrück, A. Variation of bending strength of fiber reinforced concrete beams due to fiber distribution and orientation and analysis of microstructure. In Proceedings of the IOP Conference Series: 4th International Conference on Innovative Materials, Structures and Technologies (IMST 2019), Riga, Latvia, 25–27 September 2019; IOP Publishing: Bristol, UK, 2019; Volume 660, p. 012059. [Google Scholar] [CrossRef]
  16. Tarawneh, A.; Almasabha, G.; Alawadi, R.; Tarawneh, M. Innovative and reliable model for shear strength of steel fibers reinforced concrete beams. Structures 2021, 32, 1015–1025. [Google Scholar] [CrossRef]
  17. Plizzari, G.A. Fiber reinforced concrete for repairing and strengthening RC structures: Some recent advancements. In Proceedings of the MATEC Web Conference, International Conference on Concrete Repair, Rehabilitation and Retrofitting (ICCRRR 2018), Cape Town, South Africa, 19–21 November 2018; Volume 199. [Google Scholar] [CrossRef]
  18. Balázs, G.L.; Czoboly, O.; Lublóy, É.; Kapitány, K.; Barsi, Á. Observation of steel fibres in concrete with computed tomography. Constr. Build. Mater. 2017, 140, 534–541. [Google Scholar] [CrossRef]
  19. Ferrara, L.; Faifer, M.; Toscani, S. A magnetic method for non destructive monitoring of fiber dispersion and orientation in steel fiber reinforced cementitious composites—part 1: Method calibration. Mater. Struct. 2012, 45, 575–589. [Google Scholar] [CrossRef]
  20. Komárková, T. Design of Methodology for Non-Destructive Testing of Steel-Reinforced-Fiber-Concrete. Key Eng. Mater. 2016, 714, 179–185. [Google Scholar] [CrossRef]
  21. Lataste, J.F.; Behloul, M.; Breysse, D. Characterisation of fibres distribution in a steel fibre reinforced concrete with electrical resistivity measurements. NDT E Int. 2008, 41, 638–647. [Google Scholar] [CrossRef]
  22. Lee, S.; Oh, J.; Cho, J. Fiber orientation factor on rectangular cross-section in concrete members. Int. J. Eng. Technol. 2015, 7, 470–473. [Google Scholar] [CrossRef] [Green Version]
  23. Li, L.; Xia, J.; Chin, C.; Jones, S. Fibre distribution characterization of ultra-high performance fibre-reinforced concrete (uhpfrc) plates using magnetic probes. Materials 2020, 13, 5064. [Google Scholar] [CrossRef] [PubMed]
  24. Li, Y.; Ruan, X.; Akiyama, M.; Zhang, M.; Xin, J.; Lim, S. Modelling method of fibre distribution in steel fibre reinforced concrete based on X-ray image recognition. Compos. Part B Eng. 2021, 223, 109124. [Google Scholar] [CrossRef]
  25. Mattarneh, A.-H. Electromagnetic quality control of steel fiber concrete. Constr. Build. Mater. 2014, 73, 350–356. [Google Scholar] [CrossRef]
  26. Park, T.; Her, S.; Jee, H.; Yoon, S.; Cho, B.; Hwang, S.; Bae, S. Evaluation of orientation and distribution of steel fibers in high-performance concrete column determined via micro-computed tomography. Constr. Build. Mater. 2021, 270. [Google Scholar] [CrossRef]
  27. Ponikiewski, T.; Katzer, J. X-ray computed tomography of fibre reinforced self-compacting concrete as a tool of assessing its flexural behaviour. Mater. Struct. /Mater. Constr. 2016, 49, 2131–2140. [Google Scholar] [CrossRef] [Green Version]
  28. Torrents, J.M.; Blanco, A.; Pujadas, P.; Aguado, A.; Juan-García, P.; Sánchez-Moragues, M.Á. Inductive method for assessing the amount and orientation of steel fibers in concrete. Mater. Struct. Mater. Constr. 2012, 45, 1577–1592. [Google Scholar] [CrossRef] [Green Version]
  29. Woo, L.Y.; Kidner, N.J.; Wansom, S.; Mason, T.O. Combined Time Domain Reflectometry and AC-Impedance Spectroscopy of Fiber-Reinforced Fresh-Cement Composites. Cem. Concr. Res. 2007, 37, 89–95. [Google Scholar] [CrossRef]
  30. Testing Fresh Concrete—Part 5: Flow Table Test; German Version EN 12350-5:2019; DIN EN 12350-5:2019-09; Beuth Publishing DIN: Berlin, Germany, 2019. [CrossRef]
  31. Testing Fresh Concrete—Part 6: Density; German Version EN 12350-6:2019; DIN EN 12350-6:2019-09; Beuth Publishing DIN: Berlin, Germany, 2019. [CrossRef]
  32. Testing Fresh Concrete—Part 7: Air Content—Pressure Methods; German Version EN 12350-7:2019; DIN EN 12350-7:2019-09; Beuth Publishing DIN: Berlin, Germany, 2019. [CrossRef]
  33. Reichling, K.; Raupach, M. Measurement and visualisation of the actual concrete resistivity in consideration of conductive layers and reinforcement bars. In Rehabilitation and Retrofitting III, Proceedings of the 3rd International Conference on Concrete Repair, Rehabilitation and Retrofitting, Cape Town, South Africa, 3–5 September 2018; Taylor Francis Group: Abingdon, UK, 2012; pp. 707–714. [Google Scholar]
Figure 1. Schematic figure of the arrangement of the drilling cores in the concrete plates.
Applsci 12 00454 g001
Figure 2. Test setup for conductivity measurements, schematical setup (a) and photo of a test setup with the investigated specimen (b) by [1].
Applsci 12 00454 g002
Figure 3. Cylindrical frame with 12 stainless steel electrodes on three height levels with angular distances of 90° (a) and electrodes with covering and isolation (b).
Applsci 12 00454 g003
Figure 4. Resulting isosurfaces, calculated by Comsol with different simulated electrical conductivity/resistivity of the electrodes. (a) electrical conductivity of electrodes: 1.4 × 10⁶ S/m; (b) electrical resistivity of electrodes: 100 Ωm.
Applsci 12 00454 g004
Figure 5. Electrical resistivity of the concrete cubes in different ages.
Applsci 12 00454 g005
Figure 6. Calculated fibre content of the cubic specimens at varying frequencies of the alternating current depending on the age of the concrete and the actual fibre content of the samples (dotted lines represent the fitted trend lines according to the equations given in the corresponding graph).
Applsci 12 00454 g006
Figure 7. Calculated fibre content of the cubic specimens at varying frequencies of the alternating current of the samples with a fibre content of 80 kg/m3 (dotted lines represent the fitted trend lines according to the equations given in the corresponding graph).
Applsci 12 00454 g007
Figure 8. Calculated fibre orientation of the cubic specimens with a fibre content of 40 kg/m3, based on the electrical resistivity measurements on specimens with different concrete ages at a frequency of the alternating current of 1 kHz.
Applsci 12 00454 g008
Figure 9. Calculated fibre orientation of the cubic specimens with a fibre content of 80 kg/m3, based on the electrical resistivity measurements on specimens with different concrete ages at a frequency of the alternating current of 1 kHz.
Applsci 12 00454 g009
Figure 10. Calculated electrical resistivity of PC drilling cores in different electrode configurations, simulated with the conductivity of steel.
Applsci 12 00454 g010
Figure 11. Calculated electrical resistivity of PC drilling cores in different electrode configurations, simulated with the resistivity of concrete.
Applsci 12 00454 g011
Figure 12. Calculated electrical resistivity of drilling cores depending on the fibre content.
Applsci 12 00454 g012
Figure 13. Coefficient of variation of the calculated electrical resistivity of drilling cores depending on the fibre content.
Applsci 12 00454 g013
Figure 14. Calculated fibre content of the drilling cores as a function of the actually added fibre content.
Applsci 12 00454 g014
Figure 15. Calculated fibre content of the drilling cores depending on the fibre content by use of the adjusted fibre aspect ratio.
Applsci 12 00454 g015
Figure 16. Calculated fibre orientation of the drilling cores with a fibre content of 40 kg/m3.
Applsci 12 00454 g016
Figure 17. Calculated fibre orientation of the drilling cores with a fibre content of 80 kg/m3.
Applsci 12 00454 g017
Table 1. Concrete mix design of the basic concrete.
ParameterUnit32-60-300-00
CEM I 32.5 Rkg/m3300.0
Waterkg/m3180.0
Sand 0–4 mmkg/m3845.5
Gravel 4–16 mmkg/m31004.0
Water/cement ratio-0.60
Grain size distribution-A/B16
Steel fibre type-Macrofibre 60 mm
Steel fibre contentkg/m30, 40, 80
Publisher’s Note: MDPI stays neutral with regard to jurisdictional claims in published maps and institutional affiliations.