Abstract
Cable overload is one of the most critical contributors to early cable fires. This study proposes a hybrid Bayesian network (BN)-based fire risk analysis model, to investigate the evolution of overload-induced early cable fire risks. In particular, the fire risk transmission paths caused by cable overload are reported, considering the critical factors that likely lead to fires. A BN with a specific structure was considered using the fire risk transmission paths. Later, given the risk index system, a hybrid fire risk assessment model caused by cable overload was developed based on the entropy weight method. Subsequently, the corresponding risk levels were evaluated based on the evolution of the fire risk, using numerical simulations. Finally, a case study was conducted to validate the proposed methods, and the results indicated that the proposed methods can effectively evaluate the state of the cable and explain the causes of fire risk, which can be used for early fire warnings.
1. Introduction
Electrical wires and cables are important power conduits, supporting the rapidly evolving energy needs of modern societies. Facing the explosive growth of the urban population, electrical wires and cables carry more power than before, which results in faster wire aging and corrosion. At the same time, the numbers of fires, victims, and property damage cases caused by wire- and cable-related disasters were the highest among all types of electrical products []. In the United States alone, it was reported that half of the domestic fire incidents from 2012 to 2016 were caused by various cable factors (i.e., power distribution and/or lighting) []. Compared with the United States, China is confronted with a more serious situation. There are 587,000 electrical fire-related disasters that occurred in China from 2015 to 2020, accounting for a large proportion of all incidents. In this sense, to prevent the serious consequences of cable fires, the mechanisms underlying cable fires should be explored, and fire risk analysis models should be developed for providing early fire warnings.
It is widely acknowledged that cable fires usually result in secondary hazards with much more damage, such as smoke, poison gas, dust explosion, and gas explosion. Accordingly, many researchers have paid attention to experimental, monitoring, risk analysis, investigative, and other aspects of cable fires, because these often result in great loss of life and property []. However, most of the existing studies have only focused on the mechanisms of cable fires, applications to prevention and early warnings, and analysis of consequences. Compared with the studies of the effects of cable fires after their occurrence, research on the early evolution of cable fires has not received sufficient attention. Consequently, this study focuses on analyzing the risk of overload-induced early fires from the perspective of cable fire risk transmission paths based on a Bayesian network (BN).
To estimate the risk level of overload-induced early cable fires, this study proposes a novel BN-based hybrid fire risk assessment model. First, the evolution of the cable overload fire risk is studied; then, a BN with a specific structure is proposed for presenting the evolution process. Subsequently, the prior probabilities of basic factors are explored, and the conditional probabilities of network nodes are determined based on cable-temperature-rise experiments. In addition, given the risk index system and combined with the entropy weighting method, the risk assessment model of overload-induced early cable fires is established, and the risk level is estimated based on the numerical simulations of risk evolution. The results show that the proposed model can evaluate the overload fire risk states of cables and infer the causes of the risk states. To address the aforementioned concerns and research gaps, this study focuses on the overload-induced early cable fire risk analysis, based on the proposed BN and considering the effects of mechanical damage, cable aging, and other factors.
The remainder of this paper is organized as follows. Section 2 reviews and discusses previous studies and the main concerns of this study, where the existing research gaps are identified. Section 3 constructs the cable overload-induced early cable fire BN, based on the risk transmission of early cable fires. To formulate the cable fire risk using the BN, a cable overload coupling experiment was conducted for investigating the causes of the cable temperature in the case of the cable overload. To assess the early cable fire risk, a risk index system combined with the entropy weighting method is developed in Section 4. Furthermore, to validate the effectiveness of the proposed method, a case study and its computational results are presented in Section 5. Finally, Section 6 concludes the paper by providing valuable insights and by highlighting future directions.
2. Literature Review
Regarding the main concerns associated with the cable fire risk assessment, we position this study within the following main streams of the literature.
2.1. Cable Fire Mechanisms
Many studies have addressed the ignition and combustion mechanisms of cable fires, by a large number of experimental analyses. For instance, Babrauskas [,] and Zhang [], investigated the mechanisms of cable fires caused by arc faults, overheating of cable cores, and external heating. Courty [] and Fisher [], revealed the ignition mechanisms and failure criteria of cable fires by performing cable fire characterization experiments. Shea [] investigated cable fires caused by cable looseness or corrosion, high resistance connection, and wire insulation moisture absorption. Xie [], Shu [], and Zhang [], studied the influence of polyvinyl chloride (PVC) cable aging on the fire risk. The above studies revealed that the mechanisms of cable fires were associated with intrinsic factors. However, the occurrence of cable fires is generally attributed to a complex combination of factors. Moreover, conventional methods cannot simultaneously predict the occurrence probability and the consequences of cable fires. In this sense, a cable risk analysis model should be implemented, for incorporating the impact of multi-factor coupling and for quantifying the occurrence probability and the severity of fire consequences.
2.2. Impact of Cable Overload on Cable Fires
It is known that cable overload increases the risk of cable fires, and many studies have addressed this issue. For instance, Yu [], studied the microstructure of a copper wire arc bead with an overcurrent fault. Gao [], investigated the fire risk for copper wires under overcurrent fault conditions. He [], investigated the dripping behavior of the molten thermoplastic insulation of copper wires induced by the flame spreading, for overload currents. Zhang [], studied the thermal and fire behavior of a polyethylene-insulated wire under an overload current. Shimizu [], focused on the ignition of electric wires after a long-term excess current supply under microgravity.
Previous studies have mainly focused on wires ignited by external heat sources, and only a few studies have investigated the characteristics of cable fires induced by current overloads. However, in most realistic fire scenarios, cable fires are expected to start with short-circuiting or a current overload. Fires for cables subjected to strong currents are more common and dangerous. To the best of our knowledge, the study of early cable fire risk analysis for overcurrent energized wires remains nascent.
2.3. Methods for Preventing Cable Fires
To prevent the occurrence of cable fires, detection equipment (i.e., monitors and devices) that provides early warnings should be used. In particular, Parise [], designed a residual current protector for the active and passive protection of cables. Huang [], developed a ZigBee monitoring and protection system for electrical safety in buildings. Ping [], investigated methods for real-time monitoring of temperature elevation episodes in energized transformer cores with distributed optical fiber sensors. Tvs [], proposed a framework for cable-condition monitoring and for estimating the remaining service life, based on an artificial neural network and the Weibull theory.
In addition to the usage of specialized detection equipment, risk analysis offers an effective way to address the main concerns associated with the appearance of cable fires. He [], proposed a method for quantitative assessment of cable fire risks in utility tunnels, by combining weighted fuzzy Petri nets and event trees. Worrell [], explored the use of machine learning methods for generating meta-model approximations of a physics-based fire hazard model. Khan [], proposed a framework for bridge fire risk assessment based on the Analytic hierarchy process. Manan [], presented a building fire risk analysis model based on scenario clusters. Ding [], proposed a framework combining two methods (i.e., uncertainty reasoning approach and deterministic modeling approach), to assess the probability of fire accidents. Vanweyenberge [], described a bow-tie-based risk assessment methodology for tunnel fires involving smoke spread, evacuation, and consequences. Yang [], proposed a model that combines a Bayesian network (BN) with stochastic Petri nets (SPN), for analyzing the probability of fire accidents in congested and complex processing areas. Chen [], developed a model that combined quantitative and qualitative methods, for evaluating the risks that accompany fires and pipeline explosions.
2.4. Summary
Previous experimental research, which aimed to elucidate the mechanisms underlying the emergence of cable fires, found that cable fires are caused by a complex combination of critical factors. To investigate the underlying processes, risk analysis should be conducted to quantitatively assess the risk level of cable fires. Compared with neural network-based models [], bow-ties [], and Petri nets [], BNs have the advantages of flexible inference and are good at dealing with uncertain relations, not requiring large amounts of data. They are widely used in accident probability analysis [], accident scenario deduction [], fault diagnosis [], and risk assessment []. BNs can be used for quantitative analysis using forward and reverse methods [,]. Accordingly, to analyze the early risk of cable fires from the risk transmission perspective, the forward and reverse analyses of BNs are applied for risk assessment and risk cause reasoning, respectively. Combined with multi-factor coupling experiments of cable overload fires, the theory of risk transformation, and the BN-based risk assessment, this study proposes a composite early cable fire risk analysis method for investigating the fire risk in energized cables before cable fires, and for inferring the critical factors leading to cable fires.
3. Construction of a BN
3.1. Risk Transmission for Overload-Induced Early Cable Fires
In general, the process of risk transmission occurs in four phases: (i) risk incubation, (ii) diffusion, (iii) outbreak, and (iv) extinction []. This study focuses on the processes before fire spreading, namely risk incubation and diffusion phases, which correspond to the early evolution and formation stages of fire elements.
The evolution of overload-induced cable fires needs to be explored to prevent risk generation and transmission, which is of great significance for cable fire prevention and early warning. To investigate the overload-induced cable fires’ evolution characteristics, three categories of factors are usually considered: (i) basic factors, (ii) intermediate factors, and (iii) fire risk factors. The basic factors are the root causes of cable overheating, which usually include electric currents, cable damage, aging, and environment temperature. These factors directly or indirectly affect the overload fire risk factors through the second category of intermediate factors. The intermediate factor considered in this study, the cable temperature rise, is the bridge connecting the basic factors and the third category of the fire risk factors, which consists of the insulation breakdown, cable heat resource, and material pyrolysis risks.
During the early fire risk evolution, regardless of external factors, the overcurrent is the main culprit of overheating, increasing the cable temperature. In addition, cable aging, mechanical damage, and high ambient temperature are also important factors that increase the cable temperature. In particular, the cable insulation material, PVC, suffers from thermal aging, which irreversibly increases the cable insulation breakdown risk []. In addition, the loss of the plasticizer causes the formation of voids in the material, which reduces the insulation breakdown strength []. Based on the above considerations, the risk transmission process of overload-induced cable fires in this study is presented in Figure 1. In the cable fire formation stage, electric sparks, high-temperature heat sources, and flammable substances are caused by three risk factors, as shown in Figure 1.
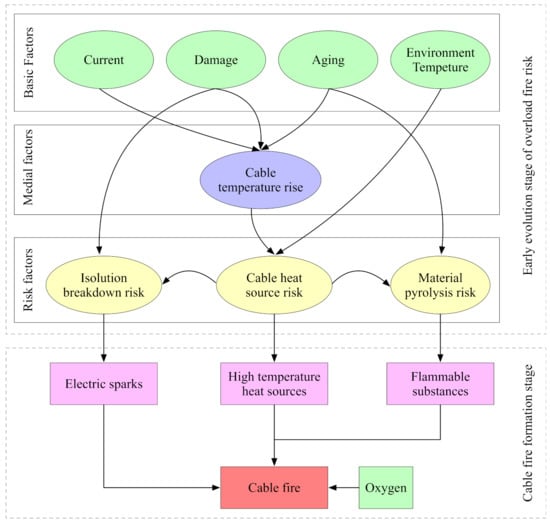
Figure 1.
Risk transmission paths of overload-induced cable fires.
3.2. Risk BN for Overload-Induced Early Cable Fires
BNs were introduced by Dr. Judea Pearl. A BN captures conditional probability relationships based on the Bayesian theorem, and connects the uncertainty relationships among different events by a directed acyclic graph, thus yielding a causal probability network that contains the transmission paths of events. In Figure 2, a sample BN is shown, where three layers of nodes are connected with directed acyclic arrows. The nodes are considered the model variables, and relationships between variables are represented by directed acyclic arrows. Any sub-node of a given node is called a child node, and the given node is the parent node. Root nodes have no links directed toward them (i.e., they do not have parent nodes), and represent basic events whose probabilities are assigned as prior probabilities. These probabilities are obtained from standard sources of failure data or based on expert elicitation in the case of unavailable failure data. Nodes with no child nodes are called leaf nodes, and are quantified using a conditional probability table (CPT). Both intermediate and leaf nodes are quantified using a CPT, considering the causal dependence between them [].
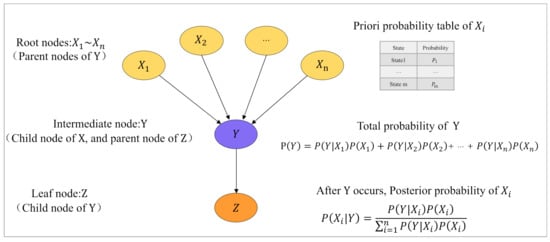
Figure 2.
Basic structure of a BN.
In a BN, according to the inference principle of Bayesian decision theory, the conditional probability of random events X and Y is given by:
where is the probability of occurrence of when occurs.
If event leads to event , is regarded as a child node. After the evidence associated with the child node is updated, the posterior probability of the parent node is written as:
If , n events occur, then the occurrence probability of these events is given by the joint probability
A BN can be used as a risk analysis model for complex systems []. Risk factors are represented as nodes in the BN, and risk transmission is encoded in the directed acyclic graph, yielding a causal probability network that represents the risk evolution process. By calculating conditional probability, the probability of event occurrence and possible consequences can be measured quantitatively. At the same time, a BN can integrate quantitative information from different channels, can deal with continuity and multi-state variables, and can carry out prediction and diagnostic analyses.
To establish an overload-induced early cable fire risk BN model, it is necessary to determine the network structure and parameters. Then, the model BN can be established according to the early evolution stage of the fire risk transmission paths, as shown in Figure 1. The established BN structure with node states is shown in Figure 3.
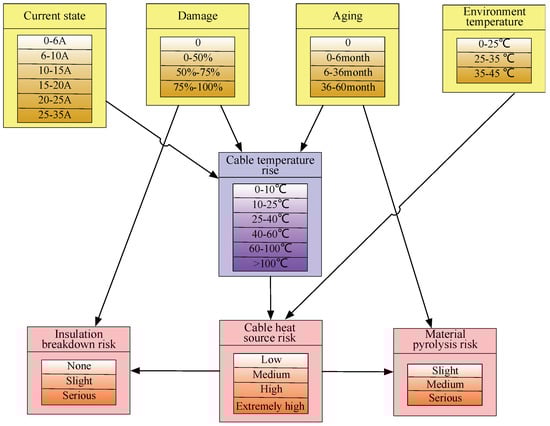
Figure 3.
Structure of the BN for overload-induced early cable fire risk.
3.3. Determination of the BN Parameters
After constructing a BN, it is necessary to determine the prior probabilities of the root nodes and the conditional probabilities for all pairs of connected nodes in order to specify the relationship between the BN’s child and parent nodes.
3.3.1. Prior Probabilities of Root Nodes
Root nodes with no parent nodes are the most basic nodes in a BN. The initial state of these root nodes must be determined through empirical decision-making and historical data. In this study, the prior probabilities of root nodes were obtained from the monitoring records of a tobacco distribution center and the historical data of electrical inspection (Table 1). Establishing a CPT relies on the following five rules:

Table 1.
Prior probabilities of root nodes.
- (I)
- Because of the different properties of the nodes, these nodes are divided into discrete and continuous nodes. To unify the construction of a BN, continuous variables should be discretized and divided into different discrete intervals, where each discrete interval represents the state of the corresponding node.
- (II)
- Cable current node reflects the current through the 0.75 mm2 cross-sectional area of the cable. According to an experimental study on the cable temperature rise, the rated current for this type of cable during normal operation is approximately 7 A.
- (III)
- The degree of mechanical damage indicates the original damage of the cable, that is, the mechanical damage caused by wiring, operation, or animals’ gnawing.
- (IV)
- Cable aging is quantified by the aging time. In the temperature rise experiment, the cables aged according to the Arrhenius high-temperature aging model [], yielding cables with different aging degrees.
- (V)
- Cable working environment temperature is derived from historical records of a tobacco storage and distribution center.
3.3.2. CPT
In a BN, each node has a different state, where each state corresponds to a certain probability. At the same time, a combination of different states of each parent node leading to different states of child nodes also has a certain probability. Accordingly, a CPT based on the nodes’ states can be constructed between child nodes and parent nodes with polymorphic uncertainty. In general, conditional probability is determined by the corresponding functional relation, statistical probability, and subjective decision. To obtain the conditional probability relationship of the temperature rise, this study utilized the temperature rise theory and evidence from coupling experiments.
- (i)
- Conductor heating theory
When a cable is connected to a constant-current circuit, its inner core conductor generates heat. Owing to the heat transfer, the temperature of the insulation layer will gradually increase with time, and the conductor insulation layer will dissipate heat into the environment around it. The dynamic process of heat dissipation is shown in Figure 4, where the circle indicates the cross-section of a cable.
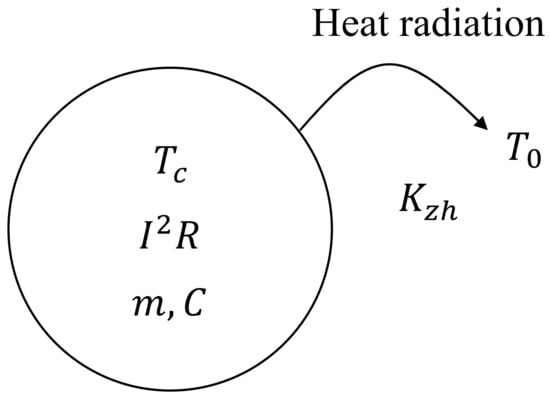
Figure 4.
Heat generation and dissipation by the cable.
In Figure 4, the basic process of heat generation and dissipation by a conductor is presented, where the temperatures of the inner core and ambient are denoted by and , respectively. The physical processes of heat generation and heat dissipation by a conductor follow the law of energy conservation. The temperature rise of the conductor can be regarded as the difference between heat generation and dissipation, which can be expressed as:
where is the time during which the current is applied, is the linear density of the conductor, denotes the specific heat capacity of the conductor, is the core resistance per unit length, is the total heat transfer coefficient between the conductor insulation layer and external environment, is the surface area of the conductor per unit length.
The temperature rise function can be obtained by solving the first-order differential Equation (4), and the temperature difference, denoted by , is given by:
With , the above Equation (5) can be written as follows:
Equation (6) gives the conductor temperature rise as a function of time, assuming ideal conditions, and given a certain current. There are three coefficient terms in the temperature rise function: temperature rise equilibrium coefficient , temperature difference coefficient , and time coefficient . In the limit of in Equation (6), the expression for the temperature difference is given by:
When the heat generation rate of the inner core of the conductor equals the heat dissipation rate of the outer surface of the conductor insulation layer, the conductor is in a balanced state of heat generation and heat dissipation, and its temperature rise is the temperature rise balance coefficient , where the current and the total heat transfer coefficient are two important factors. The total heat transfer coefficient for the conductor surface is affected by heat conduction, heat convection, and heat radiation on the conductor surface and environment. Therefore, changing the heat dissipation on the conductor surface, for example, owing to the conductor damage and/or aging, affects the total heat transfer coefficient on the conductor surface.
According to Equation (7), after a sufficiently long time the conductor temperature will eventually stabilize at a certain value, which is called the equilibrium temperature for the specific current. The equilibrium temperature of a conductor can be determined in terms of the equilibrium temperature rise and ambient temperature, as follows:
- (ii)
- Coupling experiment of conductor temperature rise
To explore the influence of mechanical damage, aging, and current on the cable temperature increase, an experiment was conducted to test the internal wiring single-core flexible conductor unshielded cable (60227iec 05 BV) with a cross-sectional area of 0.75 mm2. The equipment used in this experiment is shown in Figure 5. In particular, a grounding resistance tester, TSO6210 (Figure 5a), was used for providing a stable and large constant current. The temperature of the cable surface was measured using a 0.32 mm T-type thermocouple and recorded using an LR8431-30 data acquisition instrument (Figure 5b). A thermal aging test chamber (Figure 5c) provided a constant-temperature aging environment for aging cable samples.
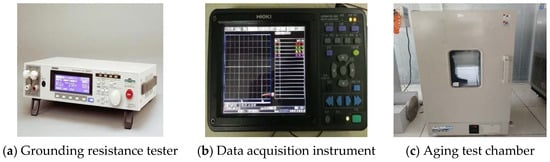
Figure 5.
Equipment used in this study.
In this study, cables were tested for six currents (i.e., 6, 10, 13, 15, 18, and 20 A), three levels of mechanical damage (i.e., 50%, 75%, and 100%), and four aging states (i.e., 6, 12, 36, and 60 months). Meanwhile, cables under different damage degrees and aging time are tested under different loading currents, where the cable temperature rise is recorded. To accurately measure the cable temperature and calculate the cable temperature rise, three thermocouple measuring points (i.e., inlet, outlet, and middle end points) are fixed on the conductor, and another measuring point is arranged in the surrounding to record the ambient temperature nearby. For the damaged cable test group, it is necessary to add a temperature measurement point at the damaged conductor edge to monitor its temperature change. Finally, the temperature rise of the cable is obtained by calculating the difference value of cable equilibrium temperature and ambient temperature.
Mechanical damage was modeled as partial insulation that affected heat dissipation, directly exposing the high-temperature core and causing cable overheating. Cable damage was quantified by the angle of the cable local damage; five examples that illustrate different exposed ratios are shown in Figure 6.
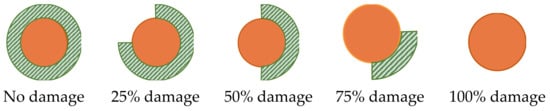
Figure 6.
Illustration of cable damage degrees.
In addition to the mechanical damage, aging affects the structure of the cable insulation layer and its insulation ability and resistance to high temperatures; aging causes cables to overheat easier. In aged cables, overload induces a sharp temperature rise. In this study, an aging model developed by Arrhenius [], was used for modeling cables with different aging degrees. Regarding the same chemical reaction, the activation energy did not change and the component service life under different temperatures shows an inversely proportional relationship to the exponent of temperature, which is given by:
where : reaction rate, mol/(m3s); : constant, known as frequency factor; : Activation energy, 0.3–1.2 eV (1.01 eV for PVC); : Kelvin temperature, k; : Boltzmann constant, = 8.617385 × 10⁻⁵.
Given a certain product, if the life degradation reaction follows Arrhenius law, the failure rate of the product is directly proportional to the reaction rate; and the average life is inversely proportional to the reaction rate V, see Equation (11). The acceleration factor, denoted by AF, is defined as the ratio of average life under two different temperatures, shown in Equation (12):
where : temperature during normal use; : accelerated aging temperature; : average life at operating temperature; : average life at accelerated aging temperature.
Regarding the experimental environment, this study followed the recommendations of 60,227 IEC 06 (BV) wires in the PVC wire test standard CB/T5023-2008, where the aging temperature was 80 °C and the treatment scheme of the test scenario could be obtained (Table 2).
Table 2.
Design of accelerated aging time.
The nodes with conditional probability in the BN included the cable temperature rise, insulation breakdown risk, cable heat source risk, and insulation pyrolysis risk. The parent nodes of the cable temperature rise were the current, the damage degree, and the aging time. Based on the experimental data, the fits to the cable temperature dependence on current-damage and current-aging are shown in Figure 7, where the corresponding three-dimensional (3D) illustrative diagrams are also shown. In particular, the cable temperature rise caused by currents and damage is shown in Figure 7a, and the cable temperature rise caused by currents and aging is shown in Figure 7b.
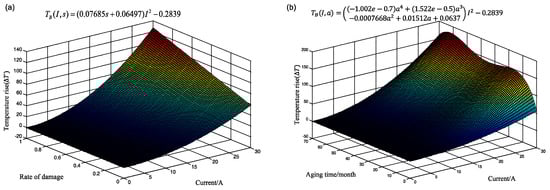
Figure 7.
Fitted relationships: (a) current−damage; (b) current−aging.
It is known that cable aging and mechanical damage involve two independent processes, and the temperature rise function for the coupled model of current, damage, and aging effects is given by:
where is the balanced temperature rise under specific current, damage, and aging conditions; is the current, is the damage degree, ; and is the aging time (in months).
Using the least-squares method, the Python data analysis toolkit StatsModels was used for fitting the experimental data, which are available at https://github.com/cxiaolong/experiments/. The fit results are listed in Table 3.
Table 3.
Fit results for .
Then, the conditional probability of the cable temperature rise node was calculated using Equation (13), and the cable heat source temperature was determined as the sum of the cable equilibrium temperature rise and the ambient temperature:
Because the nodes of the insulation breakdown risk and the material pyrolysis risk are difficult to calculate, the conditional probability remains unknown, although the equation and the relationships are given. In this sense, this study first evaluated the breakdown and pyrolysis of insulating materials based on the phenomena of cable melting, damage, smoke, and peculiar smell during the experiment, and analyzed multiple groups of experimental data to obtain the needed conditional probabilities (Table 4).
Table 4.
Conditional probabilities of insulation breakdown risk and material pyrolysis risk.
4. Numerical Analysis of the Fire Risk Assessment
In this study, risk is represented as [], which is a function of the probability and severity of the consequences of a certain hazardous event. In particular, represents the total fire risk of the overload-induced early cable fires, is the risk index of the i-th risk factor, represents the quantitative value of the j-th severity in the i-th risk factor, and represents the weight of the -th risk factor. Then, the cable overload fire risk is:
Based on the risk-establishing BN, the probabilities of different risk factors corresponding to each risk state were obtained. Then, the risk indices of risk factors were obtained from Equation (15), and the overall risk index was computed using Equation (16).
4.1. Classification of Risk Factors
In this study, the overload-induced early cable fires were divided into three risk-factor categories. The severity classes and quantitative rules for the three categories are listed in Table 5.
Table 5.
Classification of risk factors with severities.
4.2. Determination of the Risk-Factor Weights
Because different categories of risk factors contribute unevenly to the overall fire risk, different priorities (i.e., weights) of these risk factors need to be considered. To determine the weights, three popular methods are usually used: (1) difference-driven, (2) function-driven, and (3) comprehensive set assignment methods []. The difference-driven weight determination method was used in this study because it not only retains the data characteristics perfectly but also adapts to the data changes automatically. At the same time, this method can avoid subjectivity in determining the weights, which makes it more scientific and reasonable. Consequently, the entropy weight method based on the difference-driven approach was used for weight analysis. The steps of the entropy weight method are described below.
- (i)
- Data evaluation matrix
The weight judgment of the entropy weight was based on the input data. Before evaluating the data, an evaluation matrix must be constructed, consisting of cases and indicators, as in:
- (ii)
- Standardization of the evaluation matrix
Firstly, indicators in the matrix need to be standardized using the following equation:
Then, each element is normalized by:
The standardized evaluation matrix is given by:
- (iii)
- Computation of the information entropy
Given the evaluation matrix , the information entropy of each evaluation factor is calculated as:
where represents the information entropy of factor j, and 0 < H < 1,log. It should be noted that the index value of the logarithmic function is not zero; thus, log = zero when = 0.
- (iv)
- Calculation of weights
The weight of each factor is calculated according to the information entropy of each index, and is given by:
4.3. Simulation
4.3.1. Weight Determination of Fire Risk Factors
To determine the weights of risk factors, a numerical dataset was generated using the Netica software based on the constructed BN with its probability relationships. In this study, 70 groups of cases were generated (Table 6).
Table 6.
Node states and risk factors generated by Netica.
Using the entropy weight method to calculate the generated node data, the information entropy and weight vectors of three factors were obtained: = [0.5962,0.6492,0.8673], = [0.455,0.395,0.1495].
4.3.2. Risk-Level Classification Based on the Risk Evolution
By virtue of the flexible inference of the BN and the ability to update the node evidence data, the probability of each root node in the BN was updated, to simulate the change in risk. The probabilities of the sub-node states were obtained by Bayesian reasoning based on the simulated root node states, and then the risk indices were obtained using Equation (4). Figure 8 shows the evolution curve of the risk indices based on the current, aging time, mechanical damage degree, and environment temperature.
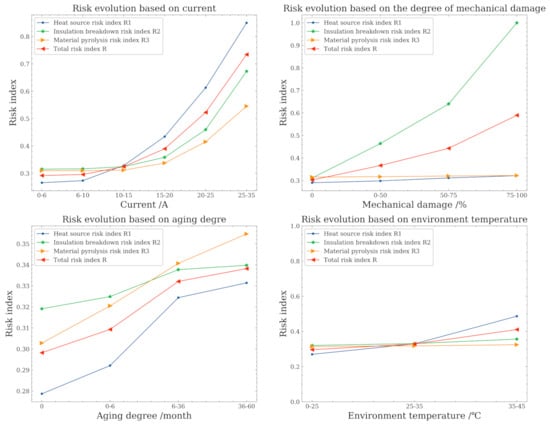
Figure 8.
Risk evolution.
The division of the overall risk level depends on the risk evolution of the risk factors. The change trends of the risk indices for the different factors can be seen as follows:
- (i)
- When the total risk index is below 0.35, the risks of the three factors are relatively small, and the current indicator is in the state of normal or slight overload; the overload fire risk is relatively low.
- (ii)
- When the total risk index is in the 0.35–0.5 range, the factors in this range are often in the state of intermediate risk. For example, for currents in the 15–20 A range, the risk index of the cable heat source risk is = 0.4342. According to the explanation of the current overload degrees in Table 4, the current is in the medium-overload state.
- (iii)
- When the total risk index is in the 0.5–0.65 range, the factors are often in a high-risk state. For example, for 20–25 A currents, the risk index of the cable heat source is = 0.6128, and when the damage rate of mechanical damage is in the 50–75% range, the risk index of insulation breakdown is = 0.694.
- (iv)
- When the total risk factor is above 0.65, the basic node states, such as the overcurrent, cable damage, and aging, are close to the edge of fire, the states of all the risk factors are above high risk, and the fire risk of the cable overload is extremely high.
Based on the above rules of risk evolution, the risk index can be categorized into the following four categories, as shown in Table 7.
Table 7.
Risk classification table.
5. Case Study
An electrical anomaly record of a tobacco logistics center in Chongqing was selected for BN reasoning and risk assessment. On a certain day, an inspector opened the door of the transformer room during daily inspection, and immediately felt a heatwave gushing out. A wall-mounted thermometer showed that the ambient temperature reached 45 °C, and the temperature inside the transformer equipment, displayed on an LCD panel, was as high as 90 °C. The inspector immediately contacted the equipment control center with the request to reduce the power consumption and turned on the transformer indoor refrigeration and air conditioning for cooling.
5.1. BN-Based Reasoning
Based on the description of the case, the following evidence-related information was extracted: when the ambient temperature was 45 °C, the state of the environmental node in the BN was (35–45 °C) = 1. The transformer panel showed that the internal temperature was 90 °C; thus, it was assumed that the temperature of the internal line cable was approximately 90 °C, and the state of the temperature node in the BN was (70–90 °C) = 1.
These two pieces of information could be obtained directly based on daily inspection, but other information remained unavailable. Because the BN has a strong reasoning function, it can be used for inferring the probability of unknown information based on the known information. Therefore, based on the above two pieces of evidence, the updated state of the BN is shown in Figure 9.
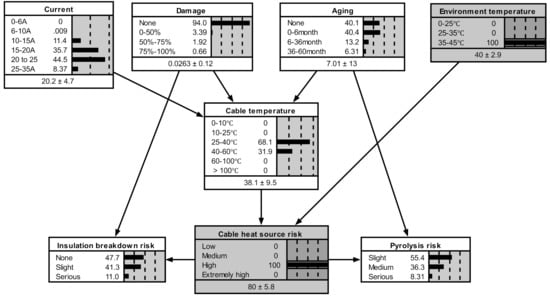
Figure 9.
Bayesian network reasoning analysis.
According to the inference of the BN posterior probability, some additional information was obtained about that dangerous situation.
- (1)
- The event was mostly owing to a high current. The node of the current changed, and the probability of a normal current (under 10 A) was 0, indicating that there must have been an overcurrent in this accident. The likelihood of a serious overload at 20–25 A could reach 44.5%.
- (2)
- The temperature rise of the cable was obvious. The cable temperature rise node also changed significantly. The probability of the cable temperature rising to less than 25 °C was 0. The probability of the cable temperature rising to the 25–40 °C range was 68.1%, indicating that cable heating was extremely serious, and the risk probability of insulation breakdown and pyrolysis significantly increased when the cable was in the state of a high-temperature heat source for a long time. The main reason for the risk of overheating is the heating of the cable line rather than the high air temperature.
- (3)
- The cable exhibited the risk of insulation breakdown, and the main cause was cable overheating. The node of the cable mechanical damage changed only weakly, and the probability of no mechanical damage was 94%, indicating that the main cause of the insulation breakdown risk was overheating rather than mechanical damage.
5.2. Risk Assessment
The state probabilities of the three risk factors were determined by the BN-based reasoning and taken as the corresponding risk probabilities, where the corresponding risk indices were obtained by substituting them into Equations (15) and (16). The cable heat source risk was = 0.75, the insulation breakdown risk was = 0.5009, the material pyrolysis risk was = 0.4671, and the total fire risk index was = 0.6089, as shown in Figure 10.
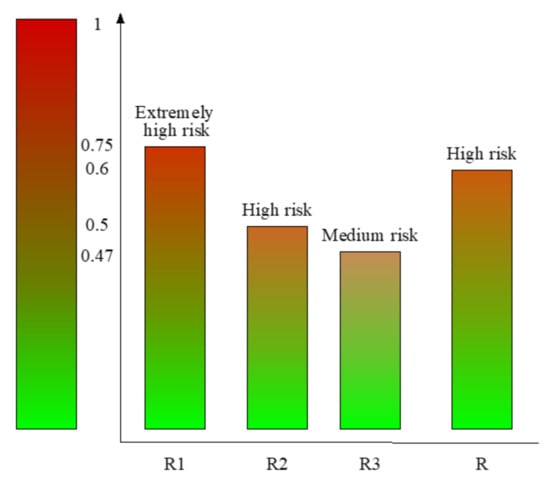
Figure 10.
Risk indices and risk levels for the case study.
According to the above risk index levels, the high-temperature heat source risk level of the overload accident was in the high-risk category, the cable insulation breakdown risk was in the high-risk category, the material pyrolysis risk was in the medium-risk category, and the overall risk level was in the high-risk category. These results were in agreement with the facts of the case.
6. Conclusions
To investigate the early fire risk caused by cable overloads, this study proposed a hybrid risk analysis model called BN-RA. Specifically, we investigated the risk transmission paths in overload-induced early cable fires, where the influence of overcurrent, damage, aging, and environment temperature on the risks of early cable fires was mainly considered. A BN was established for estimating the risk transmission paths for overload-induced early cable fires. The parameters of this risk BN were determined based on the cable overload coupling experiment and data analysis. Combined with the entropy weight method, a risk index-based risk assessment model was proposed for assessing the risk state of overload-induced early cable fires. A numerical simulation was performed for quantifying the associated risk levels. Finally, a case study was implemented for validating the proposed method, and the results indicated that the proposed method can effectively evaluate the state of the cable and elucidate the underlying fire risk mechanisms.
From the established risk transmission paths for overload-induced early cable fires, we determined that the occurrence of overload-induced cable fires is characterized by stages; the early evolution stage is crucial for cable fire prevention and early warning. Overcurrent, mechanical damage, aging, and temperature were the basic factors associated with the cable overload-induced fire risk. From the numerical simulation and entropy weight method analysis, we found that overcurrent is the main factor causing fires, which shows the importance of reducing circuit load and configuring circuit-monitoring devices for cable fire prevention and control. In addition, cable damage can be prevented, cable barriers should be set, and new cables should be replaced regularly to reduce the likelihood of fires caused by cable damage and aging.
Despite these novelties and contributions, there are several potential directions that can be further investigated. This study explored the cable fire risk owing to the cable overload, and proposed a hybrid risk analysis model (i.e., BN-RA). However, there are more dangerous situations that may result in cable fires, such as short circuits, leakage discharges, and poor contacts. Besides, this study only investigates the widely used single core low-voltage PVC cables. However, it is interesting to explore the influence of multi-core cables with different insulation thickness, different installation methods, and high-voltage cables on fire risk in future. At the same time, in this sense, a more comprehensive early risk analysis of cables still requires in-depth studies. In addition, dynamical BNs are expected to be useful for cable fire studies.
Author Contributions
Conceptualization, X.C. and X.G.; methodology, X.C. and X.G.; writing—original draft preparation, X.C. and X.G.; writing—review and editing, X.C., X.G., G.H., S.O., Y.L., and I.M.H. All authors have read and agreed to the published version of the manuscript.
Funding
This work was supported by National Natural Science Foundation of China Grant No. 72104020, and by Researchers Supporting Project number (RSP-2021/389), King Saud University, Riyadh, Saudi Arabia.
Institutional Review Board Statement
No applicable.
Informed Consent Statement
No applicable.
Data Availability Statement
Data are available at my GitHub https://github.com/cxiaolong/experiments/.
Conflicts of Interest
The authors declare no conflict of interest.
References
- Huang, X.; Nakamura, Y. A Review of Fundamental Combustion Phenomena in Wire Fires. Fire Technol. 2020, 56, 315–360. [Google Scholar] [CrossRef]
- Ahrens, M.; Maheshwari, R. Home Structure Fires; National Fire Production Association: Quincy, MA, USA, 2020. [Google Scholar]
- Huang, X.; Zhu, H.; He, L.; Peng, L.; Chow, W. Improved model for estimating sidewall effect on the fire heat release rate of horizontal cable tray. Process Saf. Environ. Prot. 2021, 149, 831–938. [Google Scholar] [CrossRef]
- Babrauskas, V. Mechanisms and modes for ignition of low voltage PVC-insulated electrotechnical products. Fire Mater. 2006, 30, 151–174. [Google Scholar] [CrossRef]
- Babrauskas, V. Electric arc explosions-A review. Fire Saf. J. 2017, 89, 7–15. [Google Scholar] [CrossRef]
- Zhang, J.; Zhang, B.; Wang, L.; Fan, M.; Li, W. The state of the art of combustion behavior of live wires and cables. Mater. Rev. 2017, 31, 1–9. [Google Scholar]
- Courty, L.; Garo, J.P. External heating of electrical cables and auto-ignition investigation. J. Hazard. Mater. 2017, 321, 528–536. [Google Scholar] [CrossRef]
- Fisher, R.P.; Stoliarov, S.I.; Keller, M.R. A criterion for thermally-induced failure of electrical cable. Fire Saf. J. 2015, 72, 33–39. [Google Scholar] [CrossRef]
- Shea, J.J. Identifying causes for certain types of electrically initiated fires in residential circuits. Fire Mater. 2011, 35, 19–42. [Google Scholar] [CrossRef]
- Xie, Q.; Zhang, H.; Tong, L. Experimental study on the fire protection properties of PVC sheath for old and new cables. J. Hazard. Mater. 2010, 179, 373–381. [Google Scholar] [CrossRef]
- Shu, Z.; Jia, W.; Chen, N. The Effect of Thermal Ageing on Fire Performance of Flame Retardant PVC Cable. Fire Sci. Technol. 2010, 29, 142–149. [Google Scholar]
- Zhang, B.; Zhang, J.; Li, Q.; Wang, L.; Xie, H.; Fan, M. Effects of Insulating Material Ageing on Ignition Time and Heat Release Rate of the Flame Retardant Cables. Procedia Eng. 2018, 211, 972–978. [Google Scholar] [CrossRef]
- Yu, Z.; Chen, S.; Deng, J.; Xu, X.; Wang, W. Microstructural Characteristics of Arc Beads with Overcurrent Fault in the Fire Scene. Materials 2020, 13, 4521. [Google Scholar] [CrossRef]
- Gao, A.; Zhao, C.; Xu, F.; Di, M.; Gao, W. Fire Risk and Failure Mechanism of Copper Wire under Overcurrent Fault Condition. Procedia Eng. 2013, 52, 119–123. [Google Scholar] [CrossRef] [Green Version]
- He, H.; Zhang, Q.; Tu, R.; Zhao, L.; Liu, J.; Zhang, Y. Molten thermoplastic dripping behavior induced by flame spread over wire insulation under overload currents. J. Hazard. Mater. 2016, 320, 628–634. [Google Scholar] [CrossRef]
- Zhang, Y.; Tang, K.; Liu, Z.; Chen, Y. Experimental study on thermal and fire behaviors of energized PE-insulated wires under overload currents. J. Therm. Anal. Calorim. 2021, 145, 345–351. [Google Scholar] [CrossRef]
- Shimizu, K.; Kikuchi, M.; Hashimoto, N.; Fujita, O. A numerical and experimental study of the ignition of insulated electric wire with long-term excess current supply under microgravity. Proc. Combust. Inst. 2016, 36, 3063–3071. [Google Scholar] [CrossRef]
- Parise, G.; Hesla, E.; Mardegan, C.S.; Parise, L.; Capaccini, E.B. Measures to Minimize Series Faults in Electrical Cords and Extension Cords. IEEE Trans. Ind. Appl. 2019, 55, 4551–4556. [Google Scholar] [CrossRef]
- Huang, L.C.; Chang, H.C.; Chen, C.C.; Kuo, C.C. A ZigBee-based monitoring and protection system for building electrical safety. Energy Build. 2011, 43, 1418–1426. [Google Scholar] [CrossRef]
- Ping, L.; Michael, P.B.; Kevin, B.; Seung, R.M. Real-Time Monitoring of Temperature Rises of Energized Transformer Cores With Distributed Optical Fiber Sensors. IEEE Trans. Power Deliv. 2019, 34, 1588–1598. [Google Scholar]
- Tvs, A.; Vg, A.; Akg, B.; Bgf, C. An approach for reliability prediction of instrumentation & control cables by artificial neural networks and Weibull theory for probabilistic safety assessment of NPPs—ScienceDirect. Reliab. Eng. Syst. Saf. 2018, 170, 31–44. [Google Scholar]
- He, L.; Ma, G.; Hu, Q.; Cai, Q.; Tan, J. A Novel Method for Risk Assessment of Cable Fires in Utility Tunnel. Math. Probl. Eng. 2019, 15, 2563012. [Google Scholar] [CrossRef]
- Worrell, C.; Luangkesorn, L.; Haight, J.; Congedo, T. Machine learning of fire hazard model simulations for use in probabilistic safety assessments at nuclear power plants. Reliab. Eng. Syst. Saf. 2019, 183, 128–142. [Google Scholar] [CrossRef]
- Khan, M.A.; Khan, A.A.; Anwar, G.A.; Usmani, A. Framework for fire risk assessment of bridges. In Structures; Elsevier: Amsterdam, The Netherlands, 2021. [Google Scholar]
- Manan, N.; Idham, N.; Hasan, A.; Mariyah, N.; Faezah, N. Fire Risk Assessment of Residential Buildings Based on Fire Statistics from Selangor. J. Pharm. Sci. Innov. 2020, VII, 2321–2705. [Google Scholar]
- Ding, L.; Ji, J.; Khan, F. Combining uncertainty reasoning and deterministic modeling for risk analysis of fire-induced domino effects. Saf. Sci. 2020, 129, 104802. [Google Scholar] [CrossRef]
- Van Weyenberge, B.; Deckers, X.; Caspeele, R.; Merci, B. Development of a Risk Assessment Method for Life Safety in Case of Fire in Rail Tunnels. Fire Technol. 2016, 52, 1465–1479. [Google Scholar] [CrossRef]
- Yang, R.; Khan, F.; Taleb-Berrouane, M.; Kong, D. A time-dependent probabilistic model for fire accident analysis. Fire Saf. J. 2019, 111, 102891. [Google Scholar] [CrossRef]
- Chen, J.; Ji, J.; Ding, L.; Wu, J. Fire risk assessment in cotton storage based on fuzzy comprehensive evaluation and Bayesian network. Fire Mater. 2020, 44, 683–692. [Google Scholar] [CrossRef]
- Sarbayev, M.; Yang, M.; Wang, H. Risk assessment of process systems by mapping fault tree into artificial neural network. J. Loss Prev. Process Ind. 2019, 60, 203–212. [Google Scholar] [CrossRef]
- Vileiniskis, M.; Remenyte-Prescott, R. Quantitative risk prognostics framework based on Petri Net and Bow-Tie models. Reliab. Eng. Syst. Saf. 2017, 165, 62–73. [Google Scholar] [CrossRef]
- Zhou, J.; Reniers, G. A Petri net–based methodology for domino effect assessment. In Dynamic Risk Assessment and Management of Domino Effects and Cascading Events in the Process Industry; Valeio, C., Genserik, R., Eds.; Elsevier: Amsterdam, The Netherlands, 2021; pp. 73–95. [Google Scholar]
- El-Awady, A.; Ponnambalam, K. Integration of Simulation and Markov Chains to Support Bayesian Networks for Probabilistic Failure Analysis of Complex Systems. Reliab. Eng. Syst. Saf. 2021, 211, 107511. [Google Scholar] [CrossRef]
- Tang, Y.; Huang, S. Assessing seismic vulnerability of urban road networks by a Bayesian network approach. Transp. Res. Part D Transp. Environ. 2019, 77, 390–402. [Google Scholar] [CrossRef]
- Li, X.; Chen, G.; Zhu, H. Quantitative risk analysis on leakage failure of submarine oil and gas pipelines using Bayesian network. Process Saf. Environ. Prot. 2016, 103, 163–173. [Google Scholar] [CrossRef]
- Kabir, S.; Papadopoulos, Y. Applications of Bayesian networks and Petri nets in safety, reliability, and risk assessments: A review. Saf. Sci. 2019, 115, 154–175. [Google Scholar] [CrossRef]
- Yuan, Z.; Khakzad, N.; Khan, F.; Amyotte, P. Risk analysis of dust explosion scenarios using Bayesian networks. Risk Anal. 2015, 35, 278–291. [Google Scholar] [CrossRef]
- Wang, Y.; Xie, M.; Chin, K.; Fu, X. Accident analysis model based on Bayesian Network and Evidential Reasoning approach. J. Loss Prev. Process Ind. 2013, 26, 10–21. [Google Scholar] [CrossRef]
- Mukiyt, A.; Wang, Y.; Xiao, L.; Dong, H.; Huang, G.; Zhang, D. Dynamic analysis of defect risk transfer in automotive brake system. China Saf. Sci. J. 2019, 29, 93–98. [Google Scholar]
- Boukezzi, L.; Boubakeur, A.; Laurent, C.; Lallouani, M. Observations on structural changes under thermal ageing of cross-linked polyethylene used as power cables insulation Iran. Iran. Polym. J. 2008, 17, 611–624. [Google Scholar]
- Zaikov, G.E.; Gumargalieva, K.Z.; Pokholok, T.V.; Moiseev, Y.V. PVC Wire Coatings. PartII. Characterizations and Performance Predictions. Int. J. Polym. Mater. 1998, 39, 261–288. [Google Scholar] [CrossRef]
- George, P.G.; Renjith, V.R. Evolution of Safety and Security Risk Assessment methodologies to use of Bayesian Networks in Process Industries. Process Saf. Environ. Prot. 2021, 149, 758–775. [Google Scholar] [CrossRef]
- Aydin, M.; Akyuz, E.; Turan, O.; Arslan, O. Validation of risk analysis for ship collision in narrow waters by using fuzzy Bayesian networks approach. Ocean Eng. 2021, 231, 108973. [Google Scholar] [CrossRef]
- Alghamdi, A.S.; Desuqi, R.K. A study of expected lifetime of XLPE insulation cables working at elevated temperatures by applying accelerated thermal ageing. Heliyon 2020, 6, e03120. [Google Scholar] [CrossRef] [PubMed] [Green Version]
- Vykydalova, A.; Dubaj, T.; Cibulkova, Z.; Mizerova, G.; Zavadil, M. A predictive model for polyethylene cable insulation degradation in combined thermal and radiation environments. Polym. Degrad. Stab. 2018, 158, 119–123. [Google Scholar] [CrossRef]
- Aven, T. The risk concept—Historical and recent development trends. Reliab. Eng. Syst. Saf. 2012, 99, 33–44. [Google Scholar] [CrossRef]
- Liu, Z.; Jiang, Z.; Xu, C.; Cai, G.; Zhan, J. Assessment of provincial waterlogging risk based on entropy weight TOPSIS–PCA method. Nat. Hazards 2021, 108, 1545–1567. [Google Scholar] [CrossRef]
Publisher’s Note: MDPI stays neutral with regard to jurisdictional claims in published maps and institutional affiliations. |
© 2021 by the authors. Licensee MDPI, Basel, Switzerland. This article is an open access article distributed under the terms and conditions of the Creative Commons Attribution (CC BY) license (https://creativecommons.org/licenses/by/4.0/).