1. Introduction
It is commonly accepted that user experience is a crucial factor that determines the intensity of use of a product, and that if a product creates negative experiences, users will not like it and will use it half-heartedly. More specifically, during challenging educational activities, students concentrate their attention on the activity at hand and do not feel very enthusiastic about using biometric equipment or, even worse, biofeedback techniques in parallel to their main activity. They usually feel that all these collateral activities divert their attention and inhibit their efforts to achieve a better performance. Thus, products that manage to create a positive user attitude can most probably overcome many potential obstacles, therefore presenting a certain advantage.
This work aspires to provide student anxiety awareness as detected by cost-effective sensors that are as least obtrusive as possible. To this aim, the presented article tries to examine whether the biofeedback device constitutes a convenient and useful way of detecting anxiety level awareness, as established during intensive and challenging educational activities such as examinations.
In addition, it is commonly accepted that a user’s attitude towards a tool is related to his/her personality to a certain extent. Thus, this research explores the association between student personality traits (extraversion–introversion), perceived usefulness, perceived ease of use, attitude towards using and behavioral intention.
The paper is structured as follows: in the next section, we explore related research work. Then, we present a detailed description of the operation of the biofeedback system. The research questions of this study are next described in detail. Furthermore, we proceed with a detailed description and the conclusions of a case study on the user evaluation of this system, based on the system usability scale (SUS) [
1,
2] and the technology readiness and acceptance Model (TRAM) [
3]. Finally, we present a summary of our conclusions and our views on future work.
2. Literature Review
Many researchers claim that a high level of test anxiety is one of the main causes of bad performance [
4,
5,
6,
7]. According to Afolayan et al. [
8], anxiety surrounding examinations and other particular situations affects approximately 25% to 40% of individuals [
9,
10,
11,
12], with more females than males being affected.
Zeidner [
13] stated that test anxiety is a multidimensional term. Liebert and Morris [
14] suggested that test anxiety is composed of two major dimensions, (a) the cognitive dimension, labeled as “worry”, which refers to concerns about being evaluated and to possibilities of failure and (b) the affective dimension, labeled as “emotionality”, which refers to the perception of autonomic reactions evoked by test conditions [
15].
The present article is exploring the students’ attitude towards using a biofeedback system providing real—time test anxiety awareness. Thus, the evaluation activity is taking place in a realistic context of academic examinations. Meanwhile a cost-effective biofeedback system [
16] is utilized to recognize the real—time students’ emotionality.
Research work regarding the assessment of affective computing systems integrated into learning environments is quite limited. One such study tested the usability evaluation of “presentation trainer”, using sensors to track the learners’ current behavioral state and provide real-time feedback [
17]. Furthermore, Hilborn, Cederholm, Eriksson and Lindley [
18] presented the design and usability evaluation of a serious game for training in emotion regulation by utilizing biosensors. Another example was a study involving a multi-mode affective learning system integrated into a distance instruction system supported by affective computing techniques and its usability evaluation [
19].
The article tries to evaluate the use of a biofeedback system under actual, intensive and challenging conditions. To our knowledge, it is the first time that the acceptance of a system consisting of bio-signal sensors has been evaluated while taking into account a variety of factors, including the users’ personality traits which surface during the students’ examinations. It is assumed that the students usually do not feel very enthusiastic about wearing sensors under test conditions, since they want to be undistracted and concentrate on their exams. However, we thought it is more appropriate and valuable to evaluate the biofeedback system in such realistic and unfavorable conditions.
During the adoption stage of new technologies, users develop positive or negative feelings, which are linked to their either positive or negative impression of the products they use [
20]. The four traits described as optimism, innovativeness, discomfort and insecurity comprise the technology readiness (TRI) [
21] part of the TRAM model [
3]. Moreover, technology acceptance dimensions as perceived usefulness, perceived ease of use, attitude towards using, behavioral intention and actual usage comprise the technology acceptance model (TAM) [
22,
23], which forms the other part of TRAM. Utilizing the TRAM model, we can examine students’ technology acceptance dimensions of the TAM model, concerning our cost-effective biofeedback system [
16] and how these dimensions are affected by the various students’ personality traits composing the TRI model. Thus, following this evaluation methodology, we can deepen in different types of students’ feelings and their effects on technology acceptance, concerning the technological product under study.
3. Design and Implementation
This section presents the work done in order to determine the design and implementation stages of our biofeedback tool. More specifically, in our case the design of the biofeedback device was based on the analysis and modeling of the users, and on activities and suitable usage scenarios. We then proceeded with the implementation of the biofeedback tool (a) by creating a prototype version of our tool and evaluating it, and (b) by implementing the second version of our tool.
3.1. Prototyping, Implementation of the First Version of the System and Its Evaluation
During the prototyping phase, filters were used to assess the appearance of our system, its functionality and its interactivity. We focused on the ergonomic quality of the system and the quality of the input—feedback relationship.
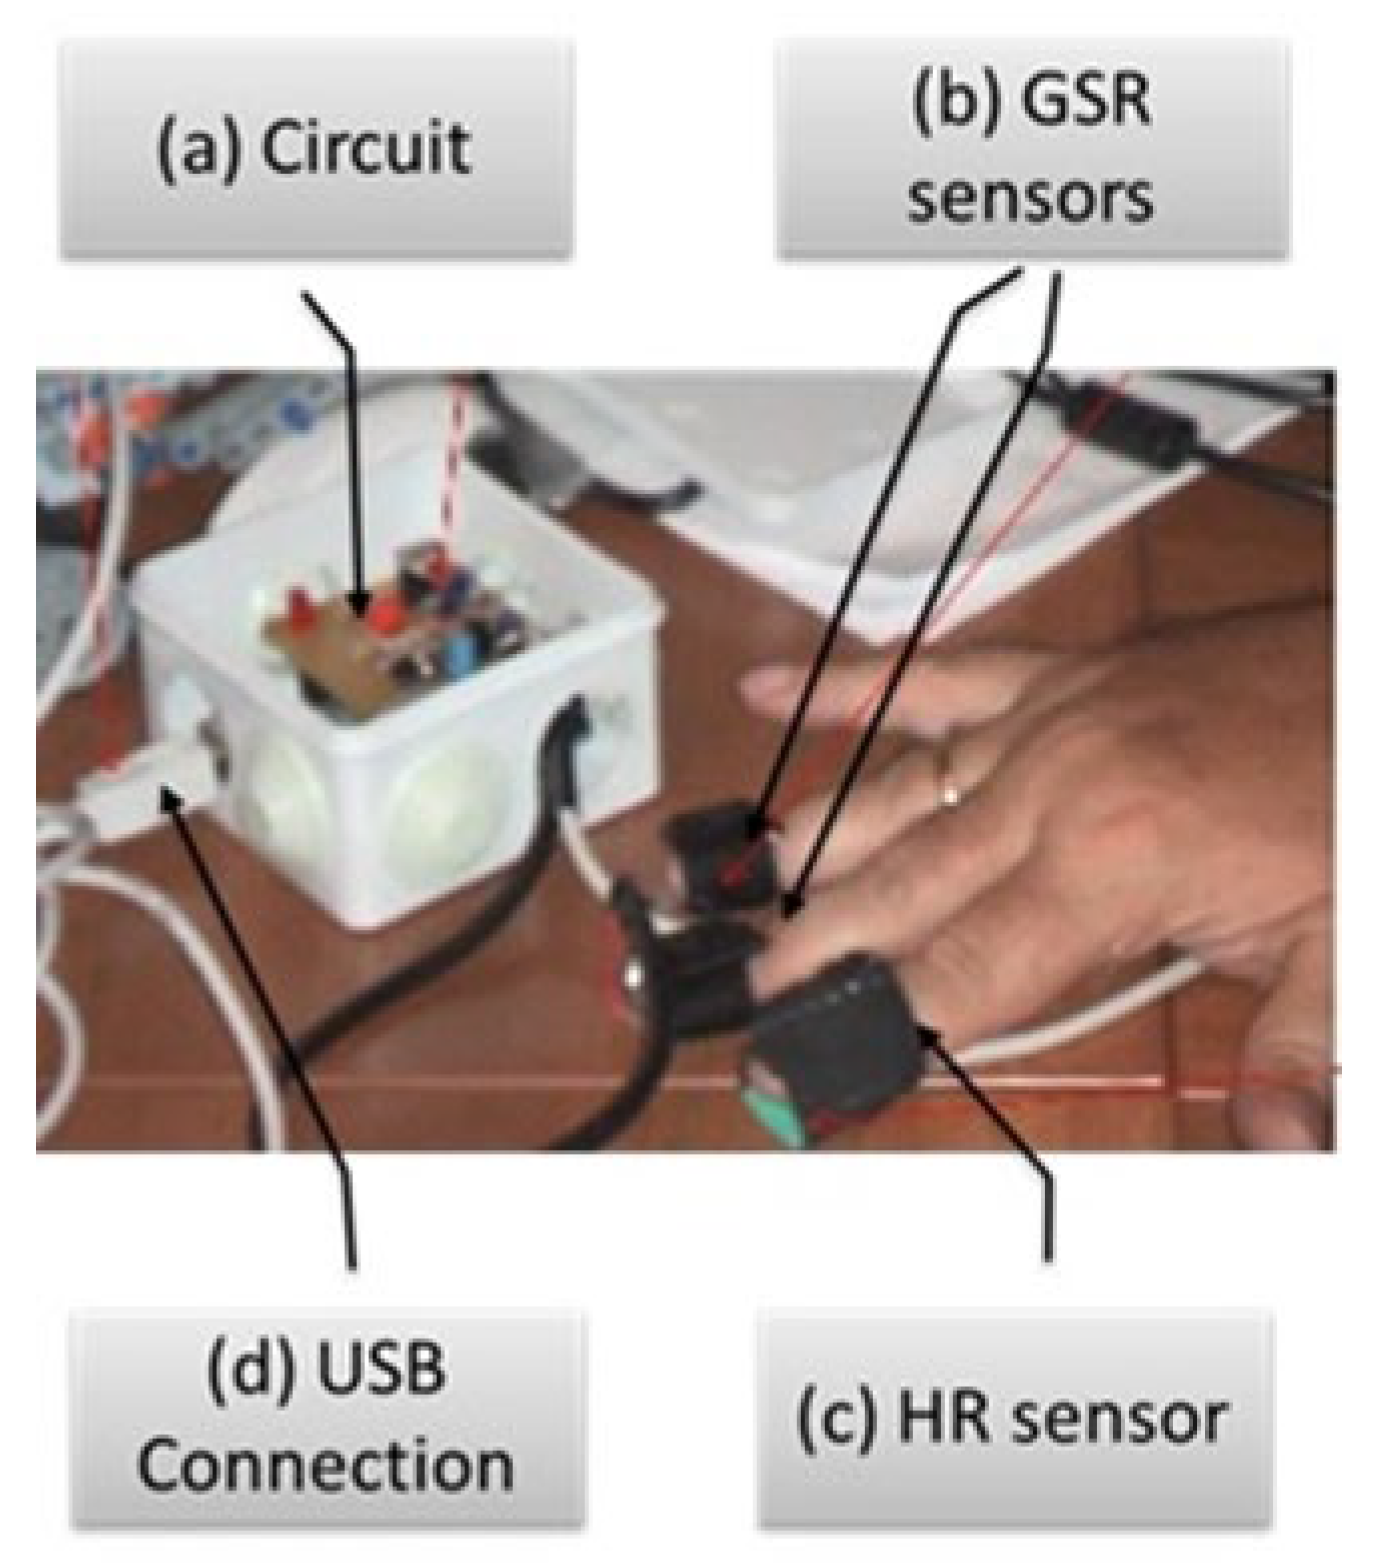
The biofeedback device (
Figure 1a) collects, identifies and utilizes bio-signals which are the result of physiological reactions to stressful situations, such as epidermal ephidrosis (GSR,
Figure 1b) and heart rate (HR,
Figure 1c). These bio-signals are classified in real-time using a machine learning technique, the Gaussian regression algorithm [
24], in relation to human anxiety levels. The system is based on the Arduino open-source electronic prototyping platform. The Arduino board was programmed to collect bio-signal values.
Next, vectors in the form of <bio-signal value 1, bio-signal value 2> are created, consisting of GSR and heart rate values. The device is connected to a computer through a USB connection (
Figure 1d) and collaborates with dedicated software in order to convert bio-signals into an anxiety level on screen and advise the user on how to regulate stress through relaxation techniques.
The first version was evaluated using the teaching and thinking-aloud protocol methods. Critical usability problems were identified. By being on their fingertips, the sensors hindered the subjects’ actions (e.g., typing on a computer) when involved in an activity [
25].
3.2. Implementation of the Second Version of the System
In the second version of the system (
Figure 2a), we added a third sensor that was sensitive to skin temperature bio-signals, in order to collect a wider range of physiological reactions and thus get closer to the users’ real anxiety state. Moreover, we tried to improve user convenience by keeping both hands as free as possible. Therefore, we embedded the skin temperature (SKT) (
Figure 2b) and GSR (
Figure 2c) sensors on the surface of a bracelet. We also changed the heart rate fingertip sensor and replaced it with a clip attached to the ear lobe (
Figure 2d). This is part of the Grove ear clip kit which calculates the values of interbeat interval time series (IBIs) resulting in heart rate values (HR). In addition, a low pass filter and moving average filter were applied to the GSR and skin temperature values to remove the high frequency components. All collected bio-signals, namely the GSR, SKT and HR, were added to bio-signal vectors, which were then transferred to the biofeedback classification application.
This application uses the same machine learning technique as the first version of the presented system in order to convert bio-signals into real-time anxiety levels and store all measurements on an online database for record-keeping.
It also has a graphical interface that appears either on screen or embedded in a web environment. The graphical part of the application displays the anxiety level detected by the biofeedback system as a visualized response on the computer screen, where a user can see his/her personal code and recognize his/her anxiety states. During the measurement, once high anxiety is reached, the application encourages the user to use diaphragmatic breathing and projects pictures to relax him/her. Furthermore, the application informs the user about whether the sensors are working properly (with a green color next to the sensor name) or not (with a red color next to the sensor name).
The tutor can monitor the students’ stress level in real time through a monitor user interface.
The convergent validity of the biofeedback system in relation to self-report measures of anxiety was quite satisfactory. Moreover, a relevant research showed that students become more anxious or even stressed when they realize that their performance is declining [
16].
4. Research Goals
The first aim of this study was to test the usability of the biofeedback system in question (RG1).
The second aim of this study was to explore the relationships between the students’ technology readiness personality dimensions and their perceptions of the usability and usefulness of the presented biofeedback system, when utilized during online academic examinations (RG2).
5. Method
This section presents the methodology followed in order to examine our research questions.
5.1. Participants
Forty-four (44) postgraduate students took part in online examinations in the framework of one of their courses. They were all seated in the same classroom and were under the supervision of their teacher. The mean age of the participants was 26.02 years (SD = 1.5). Before the activities, all participants signed a consent form.
5.2. Instruments
The instruments used to answer our research questions are presented in the paragraphs below.
5.2.1. System Usability Evaluation
The usability of our biofeedback system was examined using the system usability scale (SUS) questionnaire. This tool provides a quick and reliable measurement of the users’ perceived usability of a technological system and is used in a wide area of industry engineering [
1,
2]. It consists of 10 items and the answers are measured using a 5-point Likert scale (from 1 = strongly disagree to 5 = strongly agree) [
26].
SUS scores have a range from 0 to 100. The average usability resulting from a SUS evaluation is a score of 68 [
27].
5.2.2. Technology Readiness and Acceptance Model (TRAM)
In an effort to establish an evaluation method which would relate the users’ personality to their attitude towards using the biofeedback system and their behavioral intention, we selected the readiness and acceptance model (TRAM) [
3]. This model is an integration of the technology readiness index model (TRI) [
21] and the technology acceptance model (TAM) [
22,
23]. The model utilized in this article is based on TRAM (
Figure 3) and includes the dimensions of attitude towards using and behavioral intention, which leads to a strong induction for actual use [
28].
Godoe and Johansen [
29] have explained the dimensions of the TRAM model and their relationships in detail.
Hypothesis 1 (H1). Student optimism is positively related to perceived usefulness.
Hypothesis 2 (H2). Student optimism is positively related to perceived ease of use.
Hypothesis 3 (H3). Biofeedback system innovativeness is positively related to perceived usefulness.
Hypothesis 4 (H4). Biofeedback system innovativeness is positively related to perceived ease of use.
Hypothesis 5 (H5). Student insecurity is negatively related to perceived usefulness.
Hypothesis 6 (H6). Student insecurity is negatively related to perceived ease of use.
Hypothesis 7 (H7). Student discomfort is not significantly related to perceived useful-ness.
Hypothesis 8 (H8). Student discomfort is negatively related to perceived ease of use.
Hypothesis 9 (H9). Student perceived ease of use is positively related to student per-ceived usefulness.
Hypothesis 10a (H10a). Student perceived usefulness is positively related to biofeedback de-vice actual use.
Hypothesis 11a (H11a). Student perceived ease of use is positively related to biofeedback de-vice actual use.
By breaking down the actual usage variable of the original TRAM model (hypotheses H10a, H11a) into the two variables of attitude towards using and behavior intention, based on the initial modified version of the TAM model [
22,
23], H10b and H11b are modified and two additional hypotheses (twelve and thirteen) can be added as below:
Hypothesis 10b (H10b). Student perceived usefulness is positively related to their attitude to-wards using.
Hypothesis 11b (H11b). Student perceived ease of use is positively related to their attitude to-wards using.
Hypothesis 12 (H12). Student perceived usefulness is positively related to their behavioral intention.
Hypothesis 13 (H13). Student attitude towards using is positively related to their behavioral intention.
Thus, by using the structural equation modeling technique in our evaluation, we will explore the relationships revealed by the afore-mentioned hypotheses. In addition, we will examine whether the external variables of optimism, innovativeness, insecurity and discomfort are somehow related. According to Eysenck’s [
32] extraversion–introversion personality dimension, optimism and desire for novelty are general dispositions that are included in the extraverted aspect of the dimension, while insecurity and discomfort are related to the introverted aspect of the dimension. Furthermore, we will examine if these external variables are significantly and directly related to internal variables like attitude towards using and behavioral intention. Moreover, according to many studies, the behavioral intention to use technology is strongly related to actual usage (actual behavior) in learning environments [
33,
34,
35]. In addition, according to the theory of reasoned action [
28], as well as the action control theory [
36], strong behavioral intention leads to increased motivation and effort to perform the related behavior (actual usage). Therefore, we consider behavioral intention inducing actual usage as one variable (behavioral intention—actual usage).
The initial four external measured variables borrowed from the TRI model consist of 36 technology belief items/questions. Each question is scored on a 5-point Likert scale [
26] (from 1 = strongly disagree to 5 = strongly agree). The other four internal latent variables borrowed from the TAM model consist of 14 questions. Each question is scored on a 7-point Likert scale (from 1 = extremely likely to 7 = extremely unlikely) [
29].
5.2.3. Anxiety Awareness
The students’ test anxiety during the examination activity was measured using the presented biofeedback device.
5.2.4. Knowledge Test—Academic Performance
The reliability of the knowledge test was estimated based on the Kuder and Richardson [
37] Formula 20 (KR-20) measure that checks the internal consistency of measurements with dichotomous data. The KR-20 score for the knowledge test was 0.86.
5.3. Materials
During all evaluation activities, each student (participant) was connected to one of the copies of the biofeedback device (
Figure 2).
5.4. Procedure
All the evaluation activities were in the form of online academic examinations, and mainly included multiple-choice questions relevant to the syllabus of the examined course. The questions were displayed on a computer screen and were answered using a customized application. The tests were constructed by the instructors of the said course. There were a number of short-answer questions involving computations, and others which required students to present their reasoning by completing a multiple-choice assessment.
During all evaluation activities, a biofeedback device was connected to each student’s computer and the participants could all see the same biofeedback application interface. The biofeedback system application ran on each student’s computer.
5.5. Data Analysis
Descriptive statistics (frequency analysis) were applied to the SUS scores and the Cronbach’s alpha coefficients were examined in relation to each item of the questionnaire.
Furthermore, confirmatory factor analysis (CFA) was used to examine the factor structure of the Greek version of the questionnaires by measuring the variables that were included in the path model based on TRAM. The CFA was conducted using EQS Version 6.1 and was performed on a covariance matrix using the maximum likelihood, robust estimation procedure [
38].
For each questionnaire, the final number of items was based on the model with the best fit to data. Cronbach’s alpha coefficients were then examined for each questionnaire by tapping the variables of the model based on TRAM to test its internal consistency. According to Nunnally [
39], alphas above 0.70 are acceptable.
Finally, we applied path analysis—a structural equation modeling (SEM) technique- in order to test the hypotheses of the integrated TRAM model [
28]. Path analysis was conducted in EQS Version 6.1. For the CFA and path analysis, the Satorra–Bentler scaled Chi-square (χ2), the root mean square error of approximation (RMSEA) and the comparative fit index (CFI) were used as indices of good fit for each produced model.
6. Evaluation Results
After applying statistical analysis to the evaluation methods stated in the previous chapter, we arrived at certain considerations, which are expressed in detail in the paragraphs below.
6.1. Results of the SUS Applied to the Biofeedback System
The mean SUS score is calculated to be 71.25 and the frequencies of the participants’ SUS scores are presented in
Table 1.
According to the SUS scores, 12.5% of the participants (7) had a score of 67.5, which is 0.5 degrees below the average of 68 (defined as the usability average) [
26] and (23) 41.1% had a score above the average. The Cronbach’s alpha internal consistency estimate was found to be 0.76.
6.2. Results of the Applied TRAM Model
We initially examined the factor structure of the Greek version of the eight questionnaires that measure the variables included in the model based on TRAM. More specifically, we used confirmatory factor analyses to compare the a priori factor structures implied by previous theoretical and empirical research. In more detail:
Optimism questionnaire: The one-factor structure of the questionnaire based on 9 items (the optimism questionnaire that was administered in the present study included nine and not ten items as were the case with the original questionnaire) was not verified by the initial CFA. The results of the initial one-factor model were: Satorra–Bentler scaled χ2 (27, Ν = 44) = 102.90, p = 0.00, CFI = 0.10, and RMSEA = 0.28 (CI90% 0.20 to 0.32). Consequently, a second CFA was performed, using a revised item set for the questionnaire. In the revised item set, according to the suggested modifications, as indicated by the Lagrange multiplier and Wald tests, and the largest standardized residuals as well, the one item (Item 10 of the original questionnaire) that failed to come up with a one-factor solution corresponding to the optimism questionnaire, was dropped. Using the revised item set, the model yielded a noticeably better fit to data compared to the initial model: Satorra–Bentler scaled χ2 (17, Ν = 44) = 20.88, p = 0.40, CFI = 0.99, and RMSEA = 0.02 (CI90% 0.00 to 0.15). Thus, we concluded that the variance of that one factor could be explained by the users’ optimism regarding the biofeedback system under study.
Innovativeness questionnaire: The one-factor structure of the questionnaire based on 7 items was not confirmed by the initial CFA. The results of the initial one-factor model were: Satorra–Bentler scaled χ2 (15, Ν = 44) = 88.05, p = 0.00, CFI = 0.13, and RMSEA = 0.35 (CI90% 0.27 to 0.41). Consequently, a second CFA was performed, using a revised item set for the questionnaire. In the revised item set, according to the suggested modifications, as indicated by the Lagrange multiplier and Wald tests, and the largest standardized residuals as well, two items (Items 4 and 6 of the original questionnaire) that failed to come up with a one-factor solution corresponding to the innovativeness questionnaire, were dropped. Using the revised item set, the model yielded a better fit to data compared to the initial model: Satorra–Bentler scaled χ2(4, Ν = 44) = 1.57, p = 0.70, CFI = 1.00, and RMSEA = 0.00 (CI90% 0.00 to 0.15). Thus, we derived one factor, which could be explained by the users’ innovative attitude towards the system under study.
Insecurity questionnaire: The one-factor structure of the questionnaire based on nine items was not confirmed by the initial CFA. The results of the initial one-factor model were: Satorra–Bentler scaled χ2 (27, Ν = 44) = 112.32, p = 0.00, CFI = 0.44, and RMSEA = 0.35 (CI90% 0.24 to 0.35). Consequently, a second CFA was performed, using a revised item set for the questionnaire. In the revised item set, according to the suggested modifications, as indicated by the Lagrange multiplier and Wald tests, and the largest standardized residuals as well, four items (Items 1, 2, 5 and 8 of the original questionnaire) that failed to come up with a one-factor solution corresponding to the insecurity questionnaire, were dropped. Using the revised item set, the model yielded a better fit to data compared to the initial model: Satorra–Bentler scaled χ2 (3, Ν = 44) = 1.10, p = 0.47, CFI = 1.00, and RMSEA = 0.00 (CI90% 0.00 to 0.25). Thus, we derived one factor, which could be explained by the users’ insecurity regarding the biofeedback system under study.
Discomfort questionnaire: The one-factor structure of the questionnaire based on 10 items was not confirmed by the initial CFA. The results of the initial one-factor model were: Satorra–Bentler scaled χ2 (35, Ν = 44) = 265.20, p = 0.00, CFI = 0.29, and RMSEA = 0.43 (CI90% 0.35 to 0.44). Consequently, a second CFA was performed, using a revised item set for the questionnaire. According to the suggested modifications, as indicated by the Lagrange multiplier and Wald tests, and the largest standardized residuals as well, five items (Items 2, 5, 6, 8 and 10 of the original questionnaire) that failed to come up with a one-factor solution corresponding to the discomfort questionnaire, were dropped. Using the revised item set, the model yielded a better fit to data compared to the initial model: Satorra–Bentler scaled χ2 (3, Ν = 44) = 0.21, p = 0.99, CFI = 1.00, and RMSEA = 0.00. Thus, we derived one factor, which could be explained by the users’ discomfort regarding the system under study.
The procedure followed in the case of the optimism, innovativeness, insecurity, and discomfort questionnaires is similar to the analysis described in another article which reviewed the same items applied to 35 subjects [
16].
Perceived usefulness questionnaire: CFA verified the one-factor structure-based on six items of the original perceived usefulness questionnaire for this sample [Satorra–Bentler scaled χ2 (8, Ν = 44) = 2.23, p = 0.97, CFI = 1.00, and RMSEA = 0.00]. We derived one factor, whose variance could be explained by the users’ perceived usefulness of the system under study.
Perceived ease of use questionnaire: The one-factor structure of the questionnaire based on six items was not confirmed by the initial CFA. The results of the initial one- factor model were as follows: Satorra–Bentler scaled χ2 (7, Ν = 44) = 9.12, p = 0.24, CFI = 0.98, and RMSEA = 0.84 (CI90% 0.00 to 0.21). Consequently, a second CFA was performed, using a revised item set for the questionnaire. In the revised item set, according to the suggested modifications, indicated by the Lagrange multiplier and Wald tests, and the largest standardized residuals as well, one item (Item 5 of the original questionnaire) that did not enable us to come up with a one-factor solution corresponding to the discomfort questionnaire, was dropped. Using the revised item set, the model yielded better fit to data compared to the initial model: Satorra–Bentler scaled χ2(3, Ν = 44) = 1.78, p = 0.62, CFI = 1.00, and RMSEA = 0.00 (CI90% 0.00 to 0.21). Thus, we derived one factor, which could be explained by the users’ perceived ease of use of the system under study.
Attitude towards using questionnaire: The CFA verified the one-factor structure -based on two items of the initial attitude towards using questionnaire for this sample [Satorra–Bentler scaled χ2(0, Ν = 44) = 0.00,
p = −1.00, NFI = 1.00]. The NNFI, CFI and RMSEA were not computed because the degrees of freedom were zero. The aforementioned model should be considered as just-identified. In order for this limitation to be addressed, in accordance with Brown [
40], the variance of both variables was fixed to values under 1.0, and consequently, the aforementioned solution was provided, with one derived factor explained by the users’ attitude towards using.
Behavioral intention questionnaire: The CFA verified the one-factor structure -based on two items of the initial behavioral intention questionnaire for this sample [Satorra–Bentler scaled χ2(0, Ν = 44) = 0.00, p = −1.00, NFI = 1.00]. The NNFI, CFI and RMSEA were not computed (degrees of freedom = 0). We followed the same procedure as in the case of attitude towards using questionnaire and derived one factor, whose variance could be explained by the users’ behavioral intention.
The Cronbach’s alpha internal consistency estimates obtained in the present study for each questionnaire, the sum of which are included in the path model based on TRAM, were satisfactory and ranged from 0.74 to 0.88. We then applied path analysis in order to test the hypotheses of the integrated TRAM model [
29]. The TRAM model was not verified by the initial path analysis [Satorra–Bentler scaled χ2 (15, Ν = 44) = 165.11,
p = 0.000, CFI = 0.20, and RMSEA = 0.48 (CI90% 0.41 to 0.54)]. Consequently, starting with the covariance matrix, different models were computed using maximum likelihood robust estimates. Several iterations and modifications, as indicated by the Lagrange multiplier and Wald tests, resulted in the final model. The Wald test was used to test the need for these regressions and to suggest a more restricted model. The confirmed path model is displayed in
Figure 4, with good overall fit of this model: Satorra–Bentler scaled χ2 (13, Ν = 44) = 16.07,
p = 0.25, CFI = 0.98, and RMSEA = 0.07 (CI90% 0.00 to 0.18). Only statistically significant effects have been included in the confirmed model. The initial hypotheses H2, H8 (although not negative but positive), H9, H10a and H13 are confirmed and ten new relationships having as starting point the four dimensions of technology beliefs (TRI) are revealed, as described in
Table 2. These new relationships are represented as HYnumber in
Figure 4.
7. Discussion
In order to evaluate the usability of the biofeedback system, we used the SUS evaluation method. The presented research evaluation showed a mean SUS score of 71.25. According to the participants’ answers to this questionnaire, most of the participants (53.6%) had a score very close to or above the usability average (score, 68) as defined by Sauro [
27]. There is the possibility that the perceptions of the rest 46.4% were negatively affected by the difficult and intensive conditions under which the biofeedback system was evaluated, and the minor connection problems faced by six (6) students, at the beginning of the activity. However, the minor connection problems, which are probable to happen in realistic conditions, were overcome easily without a remarkable delay. To our knowledge, it is the first time that the usability and acceptance of a wearable biofeedback system has been evaluated while considering a variety of factors including personality traits during real-world learning settings such as academic examinations. There are articles examining the effectiveness of learning tools utilizing a variety of sensors [
17]. Moreover, there are some research articles examining wearable biofeedback systems usability, in general, resulting to high SUS mean scores. However, these articles are referring to different kinds of research, contexts, conditions, social groups and sensors of the evaluated biofeedback systems. An article utilizing biofeedback system for arm trajectory showed a mean usability score of 74.64 (above average usability score 68) [
41]. Another article applied a wearable sensor-based biofeedback exercise for orthopaedical rehabilitation showing a mean SUS score of 90.8 [
42].
According to Johnson [
43], all people have different areas of emotional and intellectual sensitivity when trying to interpret and respond to current situations based on their experience. It is assumed that every participant in the presented research is a unique human being with h/her personality. Therefore, we thought that it would be interesting to examine how each subject’s personality traits are affecting h/her decision and attitude about the biofeedback system usage. Moreover, analyzing all participants’ behavior we tried to explore which kind of student personalities are more likely to accept the biofeedback system in learning processes choosing the examinations as the most realistic and intensive learning activity.
In order to explore the direct and indirect relations between the students’ personality traits and the biofeedback system’s perceptions of usefulness, ease of use and behavioral intention, we examined the TRAM model. According to the confirmed path model, there were some interesting relationships between the personality traits of the TRI. Primarily, optimism was found to be positively related to both innovativeness and discomfort. In addition, innovativeness was found to be negatively related to both insecurity and discomfort. Besides, insecurity was found to be positively related to discomfort. The interrelations which were found between the four personality traits that contribute via the corresponding technology beliefs of the technology readiness index (TRI) model—to technology adoption are in line with Eysenck’s [
32] personality theory. In specific, as regards optimism and discomfort, they were found to share a low percentage (5.29%) of common variance due to the fact that they both are control beliefs. Optimism as component of TR is defined as “a positive view of technology and a belief that it [technology] offers people increased control, flexibility, and efficiency in their lives” [
44] while discomfort as component of TR is defined as “a perceived lack of control over technology” [
44].
Moreover, optimism and discomfort were found to have a positive effect on the TAM dimensions. More specifically, optimism and discomfort are positively and directly related to the perceived ease of use. Furthermore, optimism was found to have a positive direct influence on both attitude towards using and behavioral intention—i.e., actual usage of the biofeedback system. In addition, optimism has an indirect positive effect on perceived usefulness. This finding is confirmed by Taylor et al. [
45] who support that an optimistic person is in an inverse relation to perceived risks, emotional sadness, concern and anxiety related to bad experiences. Optimistic people do not focus on negative feelings and welcome technology or new experiences with a more open and positive point of view [
20]. An optimist is driven by motivations for supporting advancement strategies and attaining growth even if h/she recognizes that there is a possible risk Moreover, an optimist is more like to be technology optimist [
46,
47], having strong beliefs that technology will result in success [
48]. Thus, we could support that optimism has a positive effect on perceptions about utilizing biofeedback systems, in general.
However, insecurity and innovativeness have negative direct effects on attitude towards using and behavioral intention. The negative effects of insecurity are considered as commonly expected and reasonable. Trying to analyze the surprising negative effects of innovativeness, we took into consideration that “innovative people are more critical towards technology since they are aware of the newest developments and possibilities and expect all technology to fulfill the highest demands” [
29,
49]. Thus, innovative people usually set high standards and have high expectations from technological equipment. This is sometimes very risky since they may be easily disappointed, when they find out that the technological equipment in question does not fulfill their very high demands [
29].
While examining the cognitive dimensions of TAM [
29], perceived ease of use was found to be positively related to the perceived usefulness of the system, which indicates that people who believe that the biofeedback system is easy to use are more ready to admit that this system is a useful tool. Finally, attitude towards using has a direct positive influence on behavioral intention. The effect of attitude towards using was found to explain almost 49.0% of the variance of behavioral intention—actual usage of the biofeedback system. Thus, the attitude towards using of the biofeedback system seems to be the most crucial variable with regard to forming a strong behavioral intention to use it. This is confirmed by Morris and Dillon [
50], Taylor and Todd [
51] and Davis [
23], who support that attitude has a positive influence on behavioral intention.
8. Conclusions
This research focused on two research goals:
The students’ perceived usability of the biofeedback system (RG1).
The students’ technology readiness and acceptance (the personality traits that reflect the corresponding technology beliefs of the technology readiness index model) are related to perceptions of usefulness, ease of use and behavioral intention regarding the biofeedback system (RG2).
According to the results derived and analyzed from both case studies, the following conclusions can be reached per research goal:
RG1: The evaluation results showed that a sufficient number of users were quite satisfied with the usability of the system, whilst there is a considerable concentration of users whose score is almost equal to the average usability satisfaction. These two aforementioned categories make up 53.6% of the participants. Therefore, we could support that the usability level of the presented biofeedback system was quite satisfactory.
RG2: The second research question was answered by the final path model, which is based on TRAM. Optimism, a TR dimension, seems to be crucial, since it has direct and indirect positive effects on TAM dimensions. Thus, optimistic people are more open to use and adopt the biofeedback system. Moreover, a positive attitude towards using the examined device seems to be the most crucial factor in predicting the users’ behavioral intention and actual usage of this system.
9. Future Work
The present study suffers from some limitations that should be taken into consideration when interpreting the findings. The sample of presented studies is relatively small, since the number of biofeedback devices is limited, thus restricting the number of participants in every experiment. Future research should extend to samples of older students (e.g., lifelong learning) and non-student samples. Although, more research is required, the results of our studies showed that most of the participants were positive towards the biofeedback system’s usability and revealed important factors related to the adoption of its usage during learning activities. Furthermore, we will setup wireless connection for the biofeedback device to improve its usability.
Author Contributions
Conceptualization, H.A. and T.T.; methodology, H.A., G.P. and T.T.; software, H.A. and P.S.; validation, H.A., G.P., P.S. and T.T.; formal analysis, H.A. and G.P.; investigation, H.A.; resources, H.A.; writing—original draft preparation, H.A.; writing—review and editing, G.P. and T.T.; visualization, H.A., G.P. and T.T.; overall supervision, T.T.; supervision and support on psychological issues: G.P. All authors have read and agreed to the published version of the manuscript.
Funding
This research received no external funding.
Institutional Review Board Statement
The study was conducted according to the guidelines of the Declaration of Helsinki, and approved by the Institutional Ethics Committee of Aristotle University of Thessaloniki (protocol code/date 254353/2020).
Informed Consent Statement
Informed consent was obtained from all subjects involved in the study.
Data Availability Statement
The data presented in this study are available upon request from the corresponding author. The data are not publicly available due to restrictions provided by the process of Aristotle University Ethics and legislation committee.
Acknowledgments
The authors of this article would like to thank Alexandros Veis for his hospitality and assistance during the work carried out in the School of Dentistry of Aristotle University of Thessaloniki, Greece.
Conflicts of Interest
The authors declare no conflict of interest.
References
- Brooke, J. SUS: A retrospective. J. Usability Stud. 2013, 8, 29–40. Available online: http://uxpajournal.org/sus-a-retrospective (accessed on 10 January 2019).
- Brooke, J. SUS: A “quick and dirty” usability scale. Usability Eval. Ind. 1996, 207–212. [Google Scholar] [CrossRef]
- Lin, C.-H.; Shih, H.-Y.; Sher, P.; Wang, Y.-L. Consumer adoption of e-service: Integrating technology readiness with the technology acceptance model. In Proceedings of the PICMET 05: Technology Management: A Unifying Discipline for Melting the Boundaries, Portland, OR, USA, 1 January 2005. [Google Scholar]
- Von der Embse, N.; Jester, D.; Roy, D.; Post, J. Test anxiety effects, predictors, and correlates: A 30-year meta-analytic review. J. Affect. Disord. 2018, 227, 483–493. [Google Scholar] [CrossRef] [PubMed]
- Rana, R.A.; Mahmood, N. The relationship between test anxiety and academic achievement. Bull. Educ. Res. 2010, 32, 63–74. [Google Scholar]
- Cassady, J.; Johnson, R.E. Cognitive test anxiety and academic performance. Contemp. Educ. Psychol. 2002, 27, 270–295. [Google Scholar] [CrossRef] [Green Version]
- Hancock, D.R. Effects of test anxiety and evaluative threat on students’ achievement and motivation. J. Educ. Res. 2001, 94, 284–290. [Google Scholar] [CrossRef]
- Afolayan, J.A.; Donald, B.; Onasoga, O.; Babef, E.A.; Juan, A. Relationship between anxiety and academic performance of nursing students, Niger Delta University, Bayelsa State, Nigeria. Adv. Appl. Res. 2013, 4, 25–33. [Google Scholar]
- McDonald, A.S. The prevalence and effects of test anxiety in school children. Educ. Psychol. 2001, 21, 89–101. [Google Scholar] [CrossRef]
- Putman, S. The debilitative effects of anxiety on reading effect. In Anxiety in School—Consequences; Peter Lang: New York, NY, USA, 2010; pp. 59–79. [Google Scholar]
- Carter, R.; William, S.; Silverman, W. Cognitive and emotional facets of test anxiety in African American school children. Cogn. Emotion 2008, 22, 539–551. [Google Scholar] [CrossRef]
- Ergene, T. Effective interventions on test anxiety reduction: A meta-analysis. Sch. Psychol. Int. 2003, 24, 313–328. [Google Scholar] [CrossRef]
- Zeidner, M. Test Anxiety: The State of the Art; Springer: New York, NY, USA, 1998. [Google Scholar]
- Liebert, R.M.; Morris, L.W. Cognitive and emotional components of test anxiety: A distinction and some initial data. Psychol. Rep. 1967, 20, 975–978. [Google Scholar] [CrossRef] [PubMed]
- Stöber, J.; Stoeber, J. Dimensions of test anxiety: Relations to ways of coping with pre-exam anxiety and uncertainty. Anxiety Stress. Coping 2004, 17, 213–226. [Google Scholar] [CrossRef] [Green Version]
- Apostolidis, H.; Papantoniou, G.; Tsiatsos, T. Deployment and Dynamics of a Biofeedback System for Anxiety Awareness during Online Examination Activities. Appl. Sci. 2021, 11, 756. [Google Scholar] [CrossRef]
- Schneider, J.; Börner, D.; Van Rosmalen, P.; Specht, M. Presentation trainer: A toolkit for learning non-verbal public speaking skills. In Open Learning and Teaching in Educational Communities. EC-TEL 2014. Lecture Notes in Computer Science; Rensing, C., de Freitas, S., Ley, T., Muñoz-Merino, P.J., Eds.; Springer: Cham, Switzerland, 2014; Volume 8719. [Google Scholar]
- Hilborn, O.; Cederholm, H.; Eriksson, J.; Lindley, C. A biofeedback game for training arousal regulation during a stressful task: The space investor. In International Conference on Human-Computer Interaction; Springer: Berlin/Heidelberg, Germany, 2013. [Google Scholar]
- Lin, H.C.; Su, S.; Cheng-Yen, H.; Shang-Chin, T. Construction of multi-mode affective learning system: Taking affective design as an example. J. Educ. Technol. Soc. 2016, 19, 132–147. Available online: http://www.jstor.org/stable/jeductechsoci.19.2.132 (accessed on 20 October 2020).
- Basgoze, P. Integration of technology readiness (Tr) into the technology acceptance model (Tam) for M-shopping. Int. J. Sci. Res. Innov. Technol. 2015, 2, 26–35. [Google Scholar]
- Parasuraman, A. Technology readiness index (Tri): A multiple-item scale to measure readiness to embrace new technologies. J. Serv. Res. 2000, 2, 307–320. [Google Scholar] [CrossRef]
- Davis, F.D. Perceived usefulness, perceived ease of use, and user acceptance of information technology. MIS Q. 1989, 13, 319–340. [Google Scholar] [CrossRef] [Green Version]
- Davis, F.D. A Technology Acceptance Model for Empirically Testing New End-user Information System: Theory and Results. Ph.D. Thesis, MIT Sloan School of Management, Cambridge, MA, USA, 1986. [Google Scholar]
- Rasmussen, C.E.; Williams, C.K.I. Gaussian Processes for Machine Learning; MIT Press: Cambridge, MA, USA, 2005. [Google Scholar]
- Apostolidis, H.; Stylianidis, P.; Tsiatsos, T. Mobile adaptation of a prototype bio-feedback device. In Proceedings of the 8th International Conference on Interactive Mobile Communication Technologies and Learning, IMCL2014, Thessaloniki, Greece, 13–14 November 2014. [Google Scholar]
- Likert, R. A technique for the measurement of attitudes. Arch. Psychol. 1932, 140, 44–53. [Google Scholar]
- Sauro, J. Measuring Usability with the System Usability Scale (SUS) . 2011. Available online: http://www.measuringu.com/sus.php (accessed on 10 November 2020).
- Fishbein, M.; Ajzen, I. Belief, Attitude, Intention, and Behavior; Addison-Wesley: Reading, MA, USA, 1975. [Google Scholar]
- Godoe, P.; Johansen, T.S. Understanding adoption of new technologies: Technology readiness and technology acceptance as an integrated concept. J. Eur. Psychol. Stud. 2012, 3, 38. [Google Scholar] [CrossRef]
- Parasuraman, A. National Technology Readiness Survey: Research Report; Rockbridge Associates: Great Falls, VA, USA, 2000. [Google Scholar]
- Maslin, M. Technology acceptance model and E-learning. In Proceedings of the 12th International Conference on Education, New York, NY, USA, 21–24 May 2007. [Google Scholar]
- Eysenck, H.J. Personality, Genetics and Behavior; Springer: New York, NY, USA, 1982. [Google Scholar]
- May, C.L.; Ramayah, T.; Mohamad, A. Does Intention Actually Lead to Actual Usage? A Study of an E-learning System among University Students in Malaysia. Croat. J. Educ. 2015, 17, 835–863. [Google Scholar]
- Jan, A.U.; Contreras, V. Technology acceptance model for the use of information technology in universities. Comput. Hum. Behav. 2011, 27, 845–851. [Google Scholar] [CrossRef]
- Teo, T.; Lee, C.B. Explaining the intention to use technology among student teachers. Campus-Wide Inf. Syst. 2010, 27, 60–67. [Google Scholar] [CrossRef]
- Kuhl, J.; Beckmann, J. Volition and Personality: Action Versus State Orientation; Hogrefe and Huber: Seattle, WA, USA, 1994. [Google Scholar]
- Kuder, G.F.; Richardson, M.W. The theory of the estimation of test reliability. Psychometrika 1937, 2, 151–160. [Google Scholar] [CrossRef]
- Bentler, P.M. EQS 6.1.; Multivariate Software, Inc.: Encino, CA, USA, 2005. [Google Scholar]
- Nunnally, J.C. Psychometric Theory; Mcgraw-Hill: New York, NY, USA, 1978. [Google Scholar]
- Brown, T.A. Confirmatory Factor Analysis for Applied Research; Guilford: New York, NY, USA, 2006. [Google Scholar]
- Hall, S.; Wild, F.; Scheper, T.O. Real-time auditory biofeedback system for learning a novel arm trajectory: A usability study. In Perspectives on Wearable Enhanced Learning (WELL); Springer: Cham, Switzerland, 2019; pp. 385–409. [Google Scholar]
- Argent, R.; Slevin, P.; Bevilacqua, A.; Neligan, M.; Daly, A.; Caulfield, B. Wearable sensor-based exercise biofeedback for orthopaedic rehabilitation: A mixed methods user evaluation of a prototype system. Sensors 2019, 19, 432. [Google Scholar] [CrossRef] [Green Version]
- Johnson, S.L. Therapist’s Guide to Clinical Intervention, 2nd ed.; Academic Press: San Diego, CA, USA, 2004. [Google Scholar]
- Parasuraman, A.; Colby, C.L. Techno-Ready Marketing: How and Why your Customers Adopt Technology; Free Press: New York, NY, USA, 2001. [Google Scholar]
- Taylor, S.E.; Kemeny, M.E.; Aspinwall, L.G.; Schneider, S.G.; Rodri-guez, R.; Herbert, M. Optimism, coping, psychological distress, and high-risk sexual behavior among men at risk for acquired immunodeficiency syndrome (AIDS). J. Personal. Soc. Psychol. 1992, 63, 460–473. [Google Scholar] [CrossRef]
- Hochschild, J.; Crabill, A.; Sen, M. Technology Optimism or Pessimism: How Trust in Science Shapes Policy Attitudes toward Genomic Science. Issues in Technology Innovations; The Brookings Institution: Washington, DC, USA, 2012. [Google Scholar]
- Slovic, P. Perception of risk. Science 1987, 236, 280–285. [Google Scholar] [CrossRef] [PubMed]
- Clark, B.B.; Robert, C.; Hampton, S.A. The technology effect: How perceptions of technology drive excessive optimism. J. Bus. Psychol. 2015, 31, 87–102. [Google Scholar] [CrossRef]
- Walczuch, R.; Lemmink, J.; Streukens, S. The effect of service employees’ technology readiness on technology acceptance. Inf. Manag. 2007, 44, 206–215. [Google Scholar] [CrossRef]
- Morris, M.; Dillon, A. How user perceptions influence software use. IEEE Softw. 1997, 14, 58–65. [Google Scholar] [CrossRef]
- Taylor, S.; Todd, P. Decomposition and crossover effects in the theory of planned behavior: A study of consumer adoption intentions. Int. J. Res. Mark. 1995, 12, 137–155. [Google Scholar] [CrossRef]
| Publisher’s Note: MDPI stays neutral with regard to jurisdictional claims in published maps and institutional affiliations. |
© 2021 by the authors. Licensee MDPI, Basel, Switzerland. This article is an open access article distributed under the terms and conditions of the Creative Commons Attribution (CC BY) license (https://creativecommons.org/licenses/by/4.0/).


 ,
, 


