
Weighting with Life Cycle Assessment and Cradle to Cradle: A Methodology for Global Sustainability Design


Abstract
:1. Introduction
- Procedures with different stages;
- Non-matching, or simply non-comparable, impact categories;
- Results with different scope: quantitative (LCA) and qualitative (C2C);
- Interpretation and presentation of impact results in different ranges of values (positive, zero and negative impacts).
2. Materials and Methods
- Analysis and comparison of LCA and C2C methods (Section 2.1);
- Development of the new damage-oriented integrated assessment process (Section 2.2);
- Design of information flow and data classification system for the LCA+C2C assessment (Section 2.3);
- Definition of the procedure to apply the LCA+C2C integrated design and assessment methodology (Section 2.4).
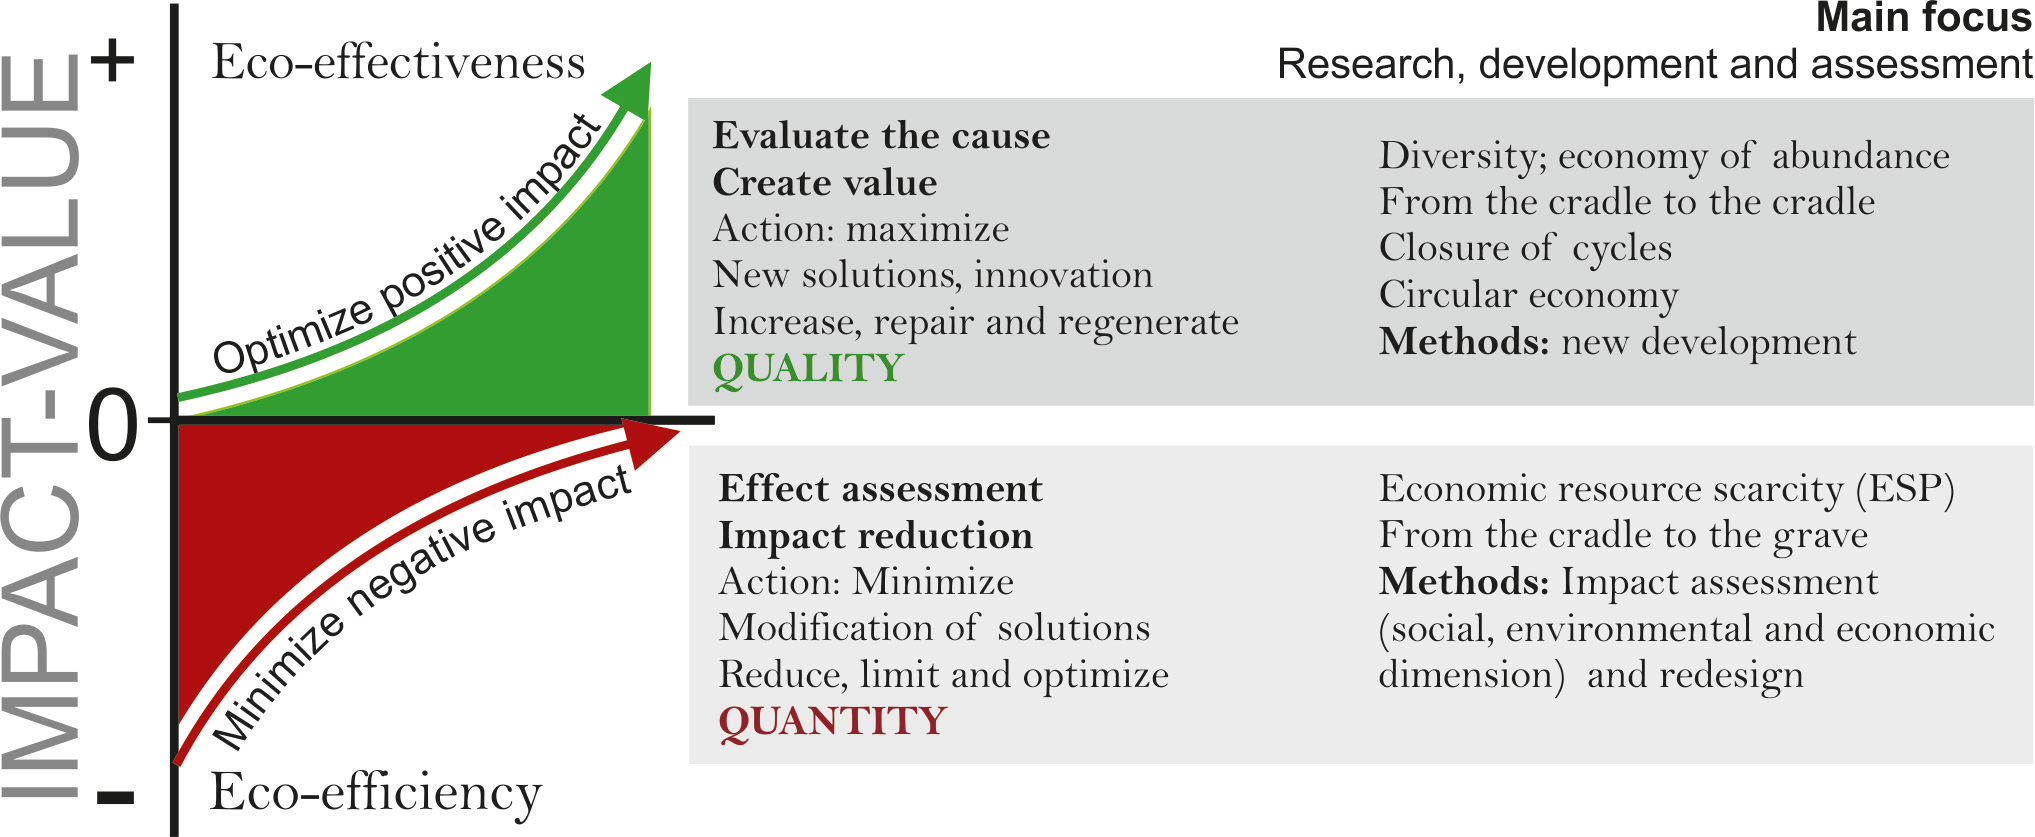
2.1. LCA and C2C for Product Design
2.2. Definition of the New Assessment Process
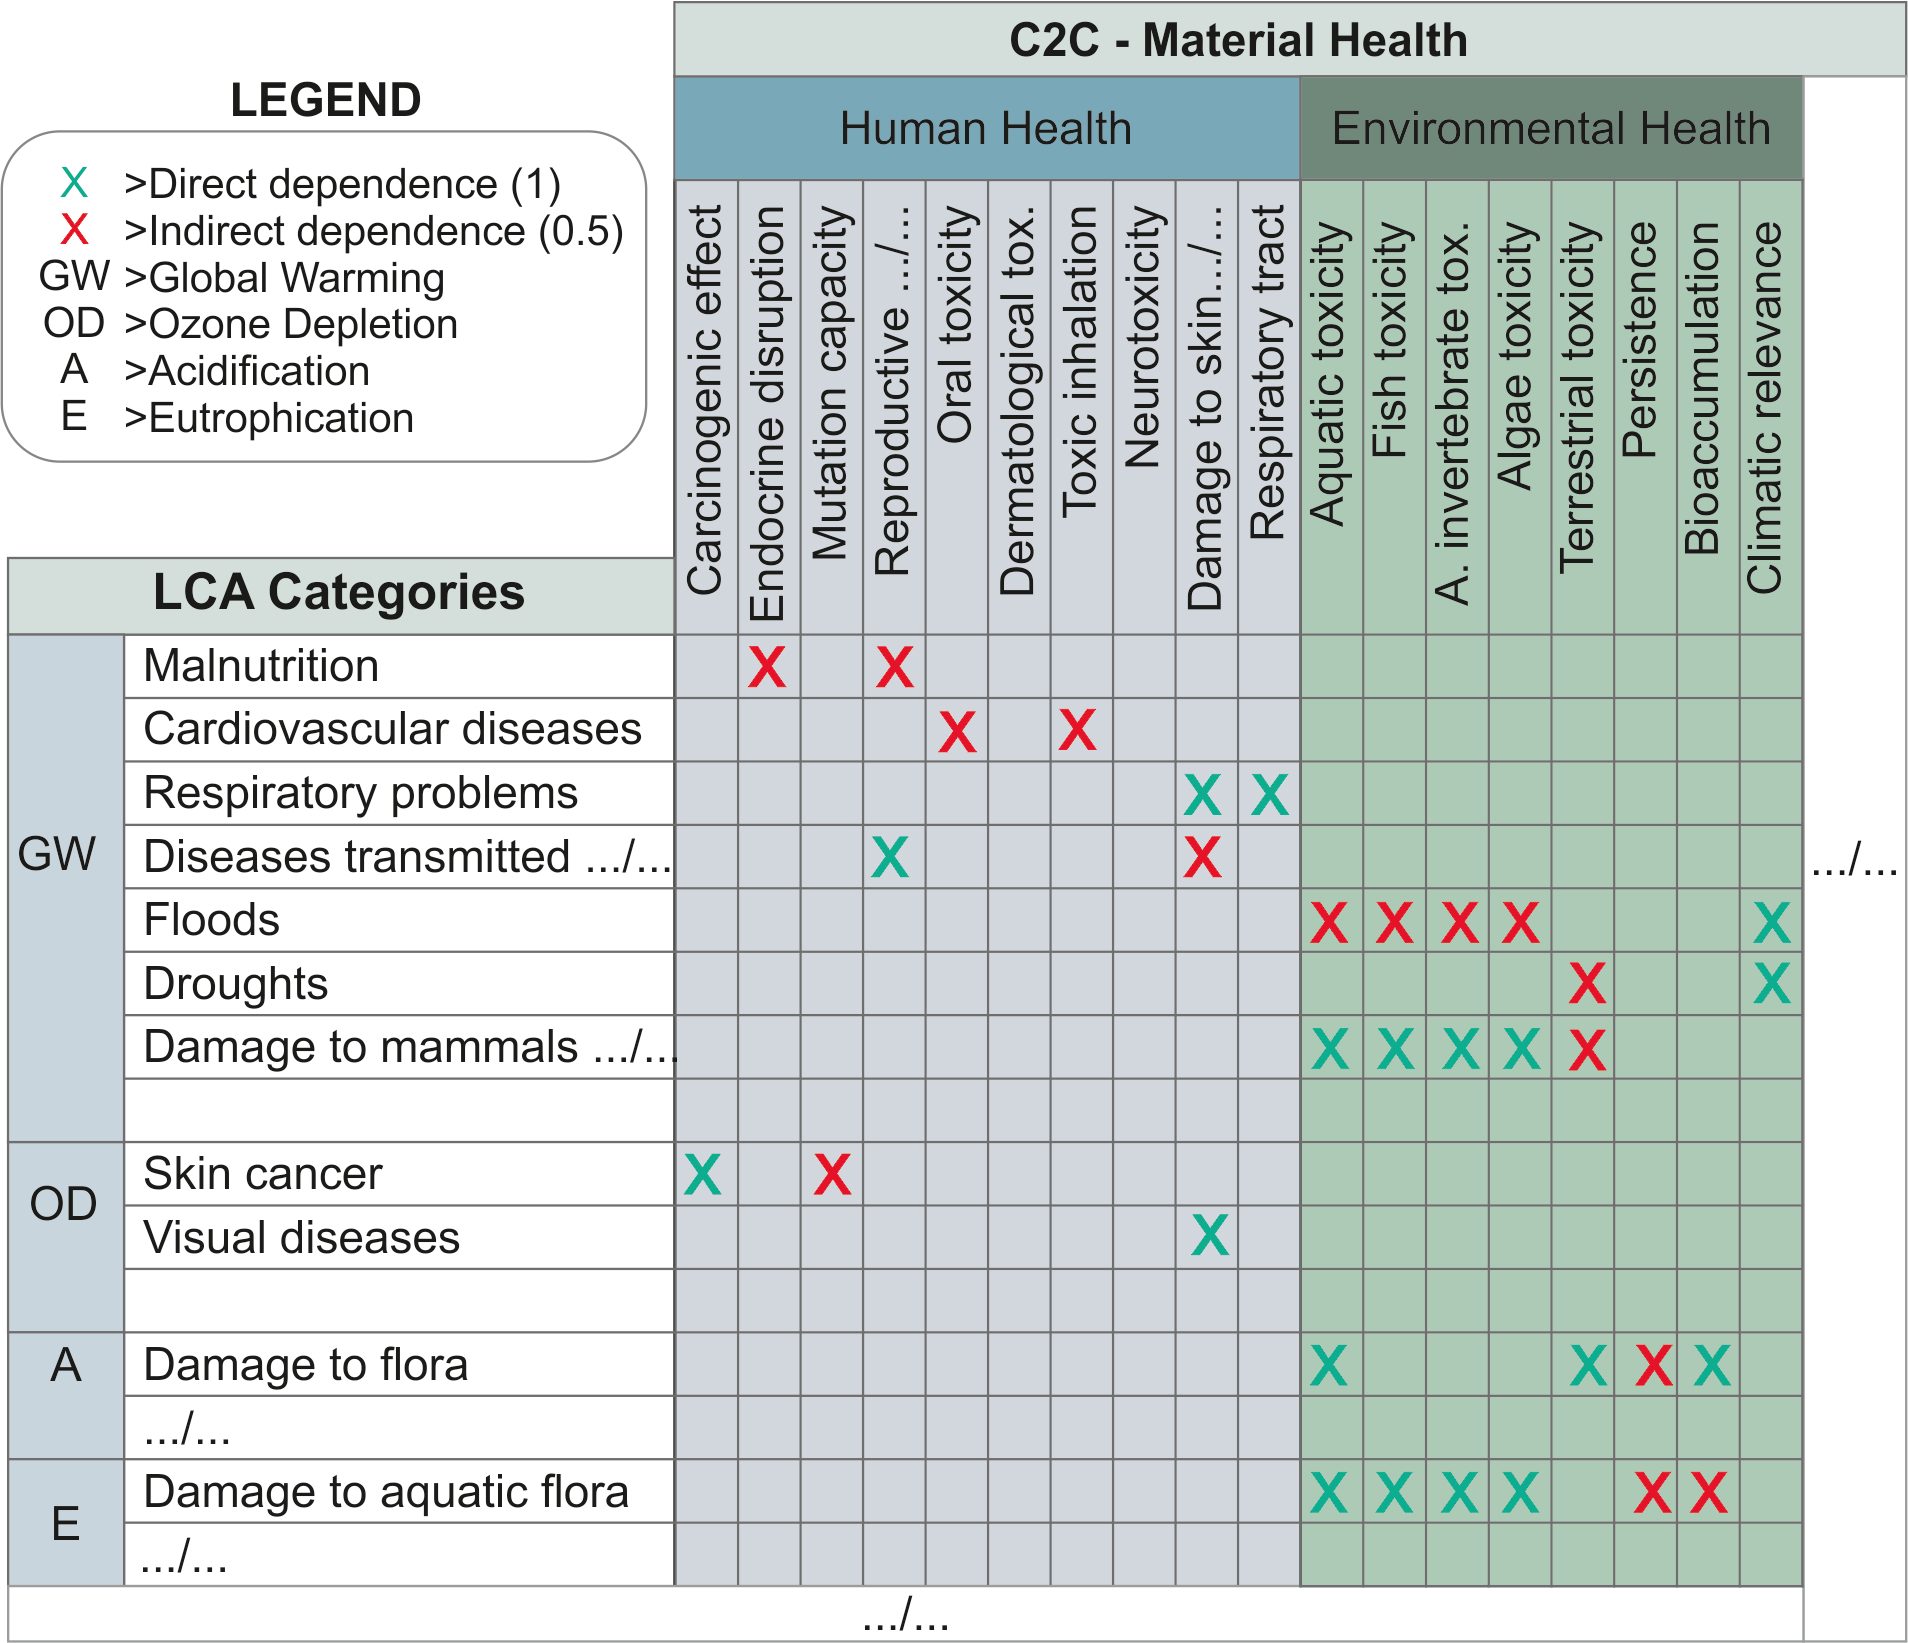
2.3. Analysis of the C2C and LCA Assessment Categories
2.4. Definition of LCA+C2C Endpoint Indicators
2.5. Calculation of LCA+C2C Endpoint Indicators
2.6. Definition of New Integrated LCA+C2C Categories
- (a)
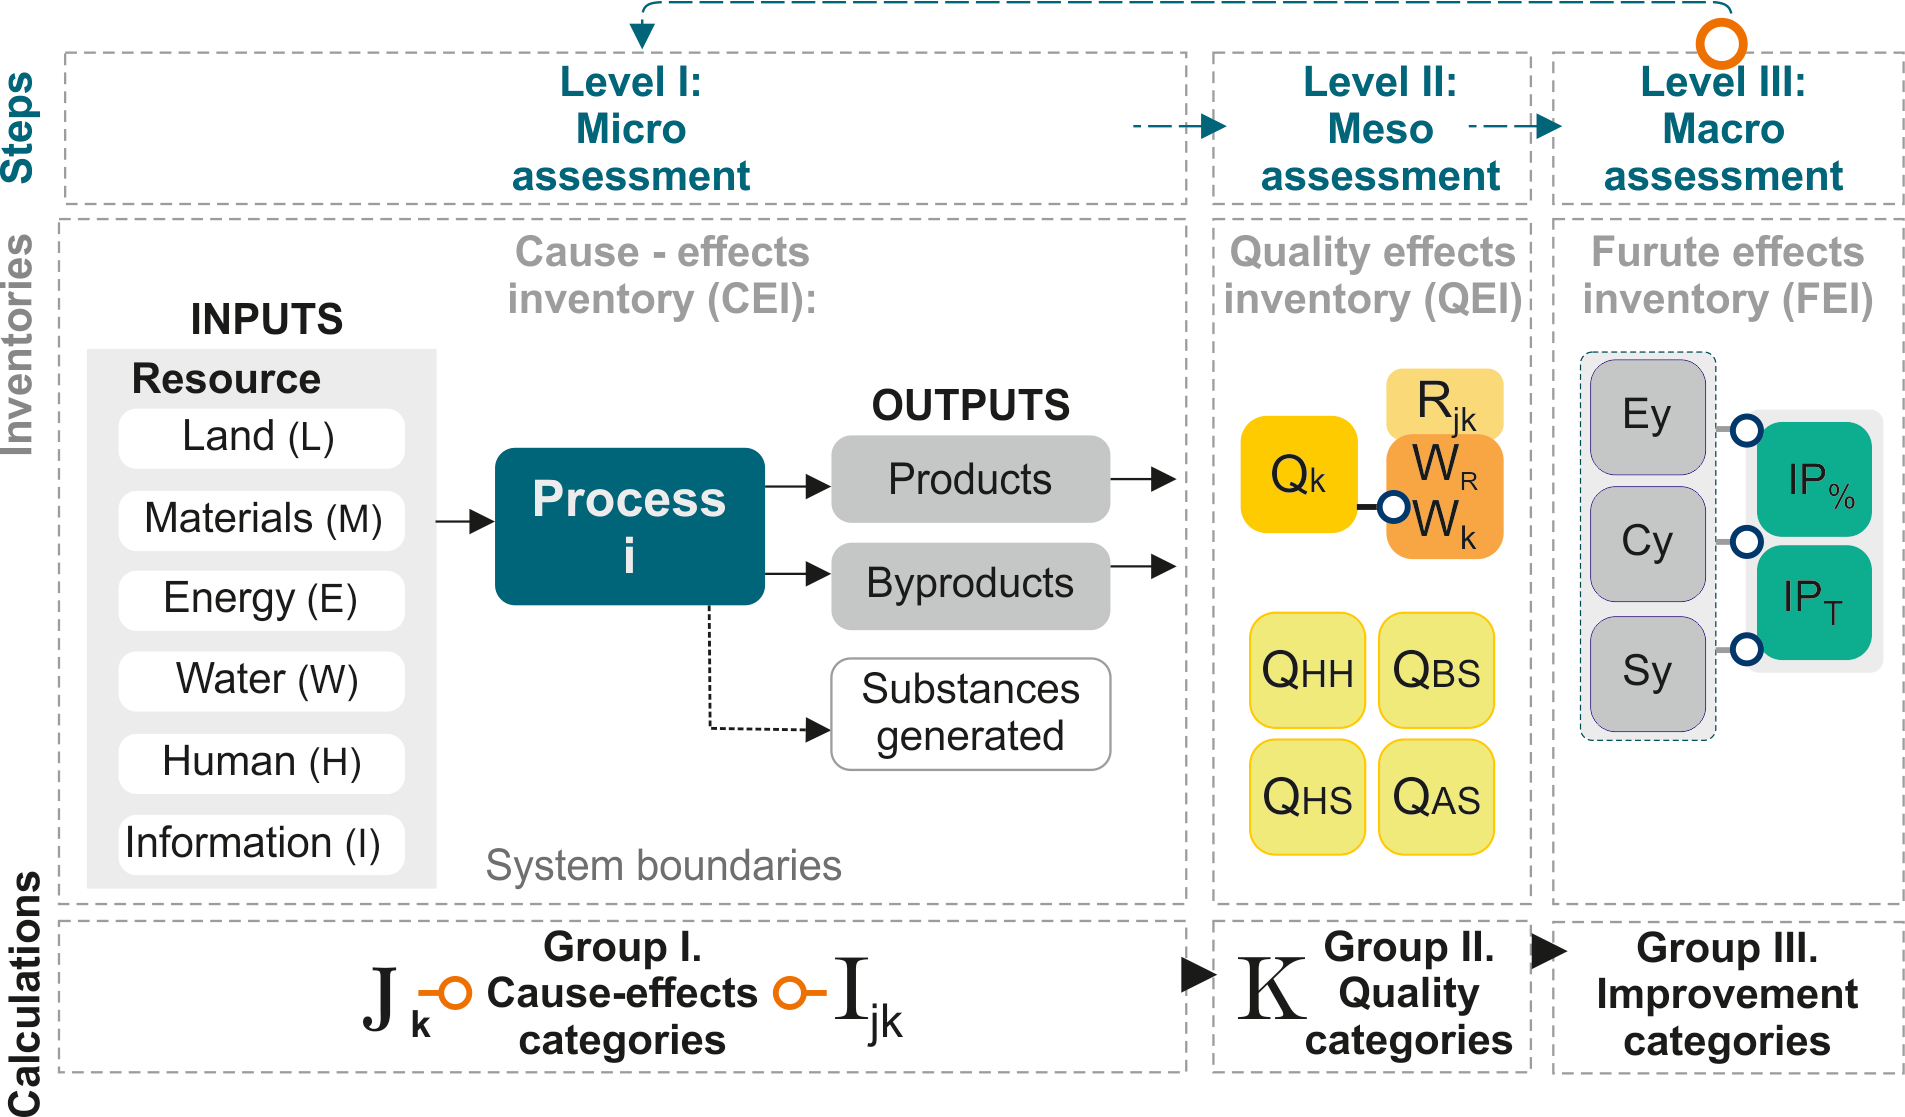
- Group I or cause–effect categories: A set of categories that provide information regarding the impacts generated by the system individually, associated with:
- a.
- Inputs: Set J of consumed and used resources to which land (L), materials (M), energy (E), water (W), human (H) and information (I) belong. This group provides impact data related to the causes.This set is defined as: Jk = {1,2,3,4,5,6} = {L,M,E,W,H,I} = {Land, Materials, Energy, Water, Human, Information}.
- b.
- Outputs: Set Ijk of midpoint impacts caused by products, by-products or substances generated in a life cycle process. These impacts are caused on resources defined in set J (land, materials, energy, water, human and information) and are quantified through endpoint impact categories (K).
- (b)
- Group II or quality categories (QK): A set of four LCA+C2C endpoint indicators of integrated environmental and social assessment, which provide information on the level of “care” to the protected areas (K). Four endpoint categories are defined, divided into society and ecosystem:
- a.
- Human health (QHH);
- b.
- Security and well-being (QSH);
- c.
- Biotic system (flora and fauna) (QBS);
- d.
- Abiotic system (hydrosphere, hydrosphere and lithosphere) (QAS).
- Set Jk or inputs (resources) as: Jk = {1,2,3,4,5,6} = {L,M,E,W,H,I} = {Land, Materials, Energy, Water, Human, Information};
- Set Ijk or outputs (midpoint) as: ;
- Set K of “damages” in protected areas (LCA+C2C endpoint) as: K ={1,2,3,4}= {HH, SH, BS, AS}= {Human Health, Human Safety, Biotitic System, Abiotic System}.
- i is the impact category;
- Ci is the characterized impact of the impact category I;
- Ni is the normalized results of impact category i—it permits results on the same scale and shows the contribution to the overall environmental problem;
- ni is the normalization reference—the normalization factor for the category i in the reference system (for example, CML, Recipe H or ILCD).
- is the LCA+C2C endpoint impact for each K (HH, SH, BS and AS) category. It measures the level of interference of each resource in the LCA+C2C endpoint categories, i.e., the loss of value by the cause–effect relationship. It is the result of the global cause–effect weighting. The unit of measurement coincides with NK and depends on the reference method used.
- NK is the total normalized impact value for a QK category. The unit of measurement depends on the reference method used.
- is the weighting factor in the LCA+C2C endpoint method; it is dimensionless.
- is the weighting result for an LCA+C2C endpoint category. The unit of measurement is LiC eq.
- is the endpoint impact generated by each type of resource (land, materials, energy, water, human and information). It is the result of the partial weighting derived from the inputs. The unit of measurement coincides with NK and depends on the reference method used.
- is the index of the quality of inputs (resources used)—the limits are 0≤ ≤ 1, where 1 is the total quality of the resource (or zero impact). The unit of measurement is LiC eq.
- is the index of the quality level of the protected elements (human, biotic ecosystem and abiotic ecosystem)—the limits are 0 ≤ ≤ 1, where 1 is the total quality (or zero impact on the protected element). The unit of measurement is LiC eq.
- (c)
- Group III or improvement categories: Set of global sustainable performance indicators. These analyze and establish the strategies for the Continuous Improvement Plan (CIP), which includes the product redesign proposals. This group provides a single life cycle assessment score as an index of the environmental, economic and social footprint. The results are compiled in the Future Effects Inventory (FEI).
- , the ratio of product improvement in two consecutive periods.
- , the changing trend in the complete evolution of the product (between generations or variants). If , the product evolves correctly; if , the strategies defined are not the correct ones, so it will be necessary to change the CIP.
- , the FEI indicator to be evaluated in the current period.
- , the FEI indicator to be evaluated in the previous period.
- , the first FEI indicator obtained for the product, i.e., the first period coinciding with the date of market launch (first design).
- , number of redesigns in which a strategy has been applied to improve environmental, social or economic performance.
- Efficiency (Ey): This corresponds to the best environmental and social performance result of the product obtained. This provides information on the improvement achieved between the different product versions (expression (8)) and the changing trend for the LCA+C2C endpoint categories (Qk) (expression (9)). The use of this macro-indicator will minimize the impacts of the system, reducing the causes of the problem.
- Consistency (Cy) or Effectiveness: This macro-indicator evaluates the cyclicity of the system and is composed of three complementary and proportional parameters. These can be expressed in Kg or %. CC (Cyclicity) quantifies the cycle-closing capacity of the system; ER (Energy Recovery) determines the energy recovery of the product with valorization strategies; and LCV (Loss of Cyclical Value) indicates the loss of resources, due to mismanagement of the end of life. These are calculated with expressions (10), (11) and (12). These indicators will also be subject to periodic evaluation with expressions (6) and (7).
- Sufficiency (S): This is a metric of positive impact or creation of value. This implies that, apart from reaching zero-impact strategies, the solution must include plans for regeneration after previously caused damage, i.e., strategies to contribute to the planet’s recovery. It is quantified from the C2C Global Score (C2CGS) and economic indicators.
- i, each category analyzed in the C2C certification. C2Ci = {1,2,3,4,5} = {material health, material recovery, energy, water, social}.
- Bi, score obtained in each category i at the basic level: Bri, score of each category i in the bronze level; Svi, score of each category i in the silver level; Gi, score of each category i in the gold level; and Pi, score of each category i in the platinum level.
- Considering 0 ≤ C2CGS ≤ 1. With the limits: [0, 0.75] negative impact creation, (0.75, 1) zero impact and [1] positive impact creation.
2.7. Design of Information Flow and Data Classification System
2.8. Methodology for Global Sustainability Design
- Life Cycle Inventory (LCI) [9]
- Cause Effect Inventory (CEI): Results on eco-efficiency, with quantified environmental and social analysis, with S-LCA midpoint and social categories. Eco-effectiveness design data reflected in the valuation of the resources used (health, material reutilization, renewable energy and carbon management, water stewardship, social fairness and information). At the interpretation stage, these data help to identify strategies for minimizing and controlling environmental and social impacts.
- Quality Effects Inventory (QEI): Integrated results of the level of intervention of the causes in the generation of damage. These are obtained from the new weighting with LCA+C2C endpoint indicators, measured in LiC eq. In the interpretation stage, these data help to determine the quality level of the solution and to propose specific improvements in the input groups.
- Future Effects Inventory (FEI): Results of sustainable global performance with macro-indicators of efficiency, consistency and sufficiency. At the interpretation stage, this information is relevant to the design and implementation of the Continuous Improvement Plan (CPI) of the product. The results are useful in selecting life cycle management strategies; defining strategies for product redesign, taking into account economic, environmental and social requirements; and establishing new improvement objectives and planning their implementation, thanks to obtaining a quantified value of the improvements between two consecutive time periods, and the tendency to change since the implementation of the CIP.
3. Results and Discussion
3.1. Step 1: Goal and Scope
3.2. Step 2: Life Cycle Inventory (LCI)
3.3. Step 3: Life Cycle Impact Assessment
3.3.1. Step 3.1: Micro-Assessment
3.3.2. Step 3.2: Meso-Assessment
- Partial impact weighting (Wi,j): this is the impact generated by a given cause (input or resource). It is calculated with expression (2) and represents the level of interference of each resource in each of the protected areas (SH, SH, AS and BS). The results for the case study may be found in Table 5, column Wij.
- Global impact weighting (QK): this is the impact weighting in the LCA+C2C endpoint. This is calculated with expression (1) and represents the total interference level of the resources in the protected areas, measured through the LCA+C2C endpoint categories (QSH, QSH, QAS and QBS). The results for the case study may be found in Table 5, column Qk.
- The quality of the inputs (Wr): this is calculated with expression (4) and represents the quality level of the resource used (in LiC eq). The results for the case study may be found in Table 5, column Wr.
- The quality of the protected areas (Wk): this is calculated with expression (5) and represents the quality level (in LiC eq) of the protection to the elements. The results for the case study may be found in Table 5, column Wk.
3.3.3. Step 3.3: Macro-Assessment
- Efficiency: starting from the LCA+C2C endpoint impact data for the QHH, QHS, QAS and QBS categories and using expressions (8) and (9), the maximum performance of the product reached so far, the evaluation of the improvement between periods and the change trend since the product launch are obtained. See Table 4, Ey cells.
- Consistency: using expressions (10), (11) and (12), the cyclicity of the system and the metabolic pathways are evaluated (C2C principle “waste equals food”). See Table 4, Cy cells. Likewise, subjecting these indicators to expressions (6) and (7) will obtain an assessment of the improvements achieved.
- Sufficiency: expression (13) evaluates the eco-effectiveness of the product or the value created (C2C principle “celebrate biodiversity”); see Table 4, Sy cells. In addition, an economic analysis of the product life cycle with LCC is carried out, including the evaluation of direct and indirect cost impacts, using eco-costs and the EVR indicator [10]. The calculation of the improvement between periods, and the change trend, is carried out, as in the previous cases.
3.4. Step 4: Interpretation
- Action in QBS (0.28 LiC eq) modifying the use of resources in quantity or type, in the following order: Water (0.85 LiC eq); Materials (0.91 LiC eq); Energy (0.85 LiC eq); Land (0.90 LiC eq).
- Action in QAS (0.40 LiC eq) modifying the use of energy in quantity or type.
- Action in QHH (0.74 LiC eq) modifying the use of resources in quantity or type, in the following order: Materials (0.88 LiC eq); Human (0.92 LiC eq); Energy (0.95 LiC eq).
- Action in QHS (0.80 LiC eq) modifying the use of resources in quantity or type, in the following order: Information (0.91 LiC eq); Human (0.93 LiC eq); Land (0.96 LiC eq).
- The QHH category is mainly influenced by the quality of the materials used; in order to reduce the effects (impacts) on human health, action should first be taken on the materials.
- As in the C2C analysis, the materials are evaluated individually; this action should be focused on those that have been classified with typology X (ABC-X assessment): corrugated cardboard, LDPE and paper. The elimination/modification of these materials will be considered.
- These strategies, linked to the materials, contribute to reducing the following impacts: ionizing radiation (5 × 10⁻⁵ DALY), global warming (498.97 Kg CO2 eq), human toxicity (387.68), SMOG (2781× 10−13 kg 1.4-DB eq), ozone depletion (38 × 10−5 kg CFC-11 eq) and particulate matter formation (0.024 kg PM10 eq).
- Similarly, the other categories, QSH, QBS and QAS, are interpreted.
4. Conclusions
- Level of evaluation of the product life cycle, which includes the Environmental Life Cycle Assessment (E-LCA) and Social Life Cycle Assessment (S-LCA). Results are collected in the Cause Effect Inventory (CEI), with eco-effectiveness design data and resources used (health, material reutilization, renewable energy and carbon management, water stewardship, social fairness and information). At the interpretation stage, these data help to identify strategies for minimizing and controlling environmental and social impacts.
- Level of product design and redesign. Results are collected in the Quality Effects Inventory (QEI), which integrates data of the level of intervention of the damage causes. These are obtained from the new weighting with LCA+C2C endpoint indicators. In the interpretation stage, these data help to determine the quality level of the solution and to propose specific improvements in the input groups.
- Level of management of the product life cycle, in the Continuous Improvement Plan (CPI). Results are collected in the Future Effects Inventory (FEI), with data of sustainable global performance with macro-indicators of efficiency, consistency and sufficiency that can aid in: (1) selecting life cycle management strategies; (2) defining strategies for product redesign, taking into account economic, environmental and social requirements; and (3) establishing new improvement objectives and planning their implementation, thanks to obtaining a quantified value of the improvements between two consecutive time periods, and the tendency to change since the implementation of the CIP.
Author Contributions
Funding
Institutional Review Board Statement
Informed Consent Statement
Conflicts of Interest
References
- Villamil, C.; Hallstedt, S. Sustainabilty integration in product portfolio for sustainable development: Findings from the industry. Bus. Strateg. Environ. 2021, 30, 388–403. [Google Scholar] [CrossRef]
- He, B.; Li, F.; Cao, X.; Li, T. Product Sustainable Design: A Review from the Environmental, Economic, and Social Aspects. J. Comput. Inf. Sci. Eng. 2020, 20. [Google Scholar] [CrossRef]
- McDonough, W.; Braungart, M. The Upcycle: Beyond Sustainability—Designing for Abundance; MacMillan USA: New York, NY, USA, 2013; ISBN 0865477485. [Google Scholar]
- Niero, M.; Hauschild, M.Z.; Hoffmeyer, S.B.; Olsen, S.I. Combining Eco-Efficiency and Eco-Effectiveness for Continuous Loop Beverage Packaging Systems: Lessons from the Carlsberg Circular Community. J. Ind. Ecol. 2017, 21, 742–753. [Google Scholar] [CrossRef]
- Avlonas, N.; Nassos, G.P. Practical Sustainability Strategies; John Wiley & Sons, Inc.: Hoboken, NJ, USA, 2013; ISBN 9781118787472. [Google Scholar]
- UNEP. Assessing the Environmental Impacts of Consumption and Production: Priority Products and Materials; United Nations Environment Programme, Ed.; United Nations Environment Programme; International Panel for Sustainable Resource Management: Milan, Italy, 2010; ISBN 9789280730845. [Google Scholar]
- Hofer, R. Sustainable Solutions for Modern Economies; RSC Publishing: London, UK, 2009; ISBN 9781847552686. [Google Scholar]
- Contant, C.K.; Wiggins, L.L. Defining and analyzing cumulative environmental impacts. Environ. Impact Assess. Rev. 1991, 11, 297–309. [Google Scholar] [CrossRef]
- ISO. ISO 14040:2006. Environmental Management. Life Cycle Assessment. Principles and Framework; ISO/TC 207/SC 5 Life Cycle Assessment: Geneva, Switzerland, 2006. [Google Scholar]
- Vogtländer, J.G. LCA-Based Assessment of Sustainability: The Eco-Costs/Value Ratio EVR; VSSD: Delft, The Netherlands, 2009; ISBN 978-9065622334. [Google Scholar]
- Huang, C.-L.; Vause, J.; Ma, H.-W.; Yu, C.-P. Using material/substance flow analysis to support sustainable development assessment: A literature review and outlook. Resour. Conserv. Recycl. 2012, 68, 104–116. [Google Scholar] [CrossRef]
- Jasch, C. Environmental and Material Flow Cost Accounting Principles and Procedures; Springer: London, UK, 2009; ISBN 9781402090271. [Google Scholar]
- Gabocy, T.A.; Ross, T.J. Ecological and Human Health Risk Assessment: A Guideline Comparison and Review. Environ. Methods Rev. Retooling Impact Assess. New Century 1998, 193–200. [Google Scholar] [CrossRef] [Green Version]
- Toxopeus, M.E.; de Koeijer, B.L.A.; Meij, A.G.G.H. Cradle to Cradle: Effective Vision vs. Efficient Practice? Procedia CIRP 2015, 29, 384–389. [Google Scholar] [CrossRef]
- Ayres, R.; Simonis, U. Industrial Metabolism: Restructuring for Sustainable Development; United Nations University Press: Tokyo, Japan, 1994; ISBN 9280808419. [Google Scholar]
- Braungart, M.; McDonough, W.; Bollinger, A. Cradle-to-cradle design: Creating healthy emissions—A strategy for eco-effective product and system design. J. Clean. Prod. 2007, 15, 1337–1348. [Google Scholar] [CrossRef]
- Barbiroli, G. Eco-efficiency or/and eco-effectiveness? Shifting to innovative paradigms for resource productivity. Int. J. Sustain. Dev. World Ecol. 2006, 13, 391–395. [Google Scholar] [CrossRef]
- McDonough, W.; Braungart, M. Cradle to Cradle: Remaking the Way We Make Things; Farrar, Straus and Giroux: New York, NY, USA, 2002; ISBN 9781429973847. [Google Scholar]
- Graedel, T.E.; Allenby, B.R. Industrial Ecology; Prentice Hall: Upper Saddle River, NJ, USA, 2003; ISBN 9780130467133. [Google Scholar]
- Ünal, E.; Shao, J. A taxonomy of circular economy implementation strategies for manufacturing firms: Analysis of 391 cradle-to-cradle products. J. Clean. Prod. 2019, 212, 754–765. [Google Scholar] [CrossRef]
- Pauli, G.A. The Blue Economy: 10 Years, 100 Innovations, 100 Million Jobs; Paradigm Publications: Boulder, CO, USA, 2010; ISBN 0912111909. [Google Scholar]
- Özkan, P.; Yücel, E.K. Linear Economy to Circular Economy: Planned Obsolescence to Cradle-to-Cradle Product Perspective. In Handbook of Research on Entrepreneurship Development and Opportunities in Circular Economy; IGI Global: Hershey, PA, USA, 2020; pp. 61–86. ISBN 978-1-7998-5116-5.ch004. [Google Scholar]
- Baas, L. Cleaner Production and Industrial Ecology: A Dire Need for 21st Century Manufacturing. In Handbook of Performability Engineering; Springer: Berlin/Heidelberg, Germany, 2008; pp. 139–156. ISBN 978-1-84800-130-5. [Google Scholar]
- Benyus, J.M. Biomimicry; William Morrow & Co: New York, NY, USA, 2009; ISBN 0061958921. [Google Scholar]
- Alston, K.; Braungart, M. Cradle to Cradle Design Initiatives: Lessons and Opportunities for Prevention through Design (PtD). J. Saf. Res. 2008, 39, 135–136. [Google Scholar] [CrossRef]
- Herrmann, C.; Blume, S.; Kurle, D.; Schmidt, C.; Thiede, S. The positive impact factory—Transition from eco-efficiency to eco-effectiveness strategies in manufacturing. In Proceedings of the Procedia CIRP; Elsevier B.V.: Amsterdam, The Netherlands, 2015; Volume 29, pp. 19–27. [Google Scholar]
- Geldermans, R.J. Design for Change and Circularity—Accommodating Circular Material & Product Flows in Construction. Energy Procedia 2016, 96, 301–311. [Google Scholar] [CrossRef] [Green Version]
- Van Dijk, S.; Tenpierik, M.; van den Dobbelsteen, A. Continuing the building’s cycles: A literature review and analysis of current systems theories in comparison with the theory of Cradle to Cradle. Resour. Conserv. Recycl. 2014, 82, 21–34. [Google Scholar] [CrossRef]
- Ankrah, N.A.; Manu, E.; Booth, C. Cradle to Cradle Implementation in Business Sites and the Perspectives of Tenant Stakeholders. Energy Procedia 2015, 83, 31–40. [Google Scholar] [CrossRef] [Green Version]
- El Haggar, S. Sustainable Industrial Design and Waste Management: Cradle-to-Cradle for Sustainable Development; Elsevier Academic Press: Cambridge, MA, USA, 2007; ISBN 9780080550145. [Google Scholar]
- Kumar, S.; Putnam, V. Cradle to cradle: Reverse logistics strategies and opportunities across three industry sectors. Int. J. Prod. Econ. 2008, 115, 305–315. [Google Scholar] [CrossRef]
- Barbiroli, G.; Candela, G.; Raggi, A. Implementing a new model to measure and assess eco-effectiveness as an indicator of sustainability. Int. J. Sustain. Dev. World Ecol. 2008, 15, 222–230. [Google Scholar] [CrossRef]
- Huesemann, M.H. The failure of eco-efficiency to guarantee sustainability: Future challenges for industrial ecology. Environ. Prog. 2004, 23, 264–270. [Google Scholar] [CrossRef]
- Csutora, M. From eco-efficiency to eco-effectiveness? The policy-performance paradox. Soc. Econ. 2011, 33, 161–181. [Google Scholar] [CrossRef] [Green Version]
- Kravchenko, M.; Pigosso, D.C.A.; McAloone, T.C. A Trade-Off Navigation Framework as a Decision Support for Conflicting Sustainability Indicators within Circular Economy Implementation in the Manufacturing Industry. Sustainability 2020, 13, 314. [Google Scholar] [CrossRef]
- Abukhader, S.M. Eco-efficiency in the era of electronic commerce—Should ‘Eco-Effectiveness’ approach be adopted? J. Clean. Prod. 2008, 16, 801–808. [Google Scholar] [CrossRef]
- Wang, G.; Côté, R. Integrating eco-efficiency and eco-effectiveness into the design of sustainable industrial systems in China. Int. J. Sustain. Dev. World Ecol. 2011, 18, 65–77. [Google Scholar] [CrossRef]
- Hauschild, M.Z. Better—But is it Good Enough? On the Need to Consider Both Eco-efficiency and Eco-effectiveness to Gauge Industrial Sustainability. Procedia CIRP 2015, 29, 1–7. [Google Scholar] [CrossRef] [Green Version]
- Simon, L.; Moraes, C.A.M.; Modolo, R.C.E.; Vargas, M.; Calheiro, D.; Brehm, F.A. Recycling of contaminated metallic chip based on eco-efficiency and eco-effectiveness approaches. J. Clean. Prod. 2017, 153, 417–424. [Google Scholar] [CrossRef]
- Dahiya, S.; Katakojwala, R.; Ramakrishna, S.; Mohan, S.V. Biobased Products and Life Cycle Assessment in the Context of Circular Economy and Sustainability. Mater. Circ. Econ. 2020, 2, 1–28. [Google Scholar] [CrossRef]
- Czyżewski, B.; Matuszczak, A.; Muntean, A. Approaching environmental sustainability of agriculture: Environmental burden, eco-efficiency or eco-effectiveness. Agric. Econ. 2019, 65, 299–306. [Google Scholar] [CrossRef]
- Gomes, R.; Silvestre, J.D.; de Brito, J. Environmental, economic and energy life cycle assessment “from cradle to cradle” (3E-C2C) of flat roofs. J. Build. Eng. 2020, 32, 101436. [Google Scholar] [CrossRef]
- Dinis-Silvestre, J.; de Brito, J. Environmental, energetic and economic life-cycle assessment from " cradle to cradle " (3E-C2C) of buildings assemblies. World Sustain. Build. Conf. 2011. [Google Scholar] [CrossRef]
- Dinis Silvestre, J.; de Brito, J.; Duarte Pinherio, M. LCA ‘From Cradle-to-Cradle’ of Energy-Related Building Assemblies: Promoting Eco-Efficient Materials. In Proceedings of the Conference: Portugal SB13—Contribution of Sustainable Building for EU 20-20-20 Targets, Guimaraes, Portugal, 30 October–3 November 2013. [Google Scholar]
- Ankrah, N.; Manu, E.; Booth, C. Beyond sustainable buildings: Eco-efficiency to eco-effectiveness through cradle-to-cradle design. In Proceedings of the Sustainable Building Conference 2013, Graz, Austria, 25–28 September 2013; pp. 47–56. [Google Scholar]
- Lanfang, L.; Issam, S.; Chong, W.K.; Christopher, H. Integrating G2G, C2C and resource flow analysis into life cycle assessment framework: A case of construction steel’s resource loop. Resour. Conserv. Recycl. 2015, 102, 143–152. [Google Scholar] [CrossRef]
- Atik, S.; Domenech Aparisi, T.; Raslan, R. Investigating the effectiveness and robustness of performing the BIM-based cradle-to-cradle LCA at early-design stages: A case study in the UK. Build. Simul. Optim. 2020 Int. Build. Perform. Simul. Asssoc. 2021, in press. Available online: https://discovery.ucl.ac.uk/id/eprint/10112217/ (accessed on 2 September 2021).
- Bor, A.-M.; Hansen, K.; Goedkoop, M.; Rivière, A.; Alvarado, C.; van den Wittenboer, W. Usability of Life Cycle Assessment for Cradle to Cradle Purposes; 2011; Available online: http://www.c2c-centre.com/sites/default/files/Position%20paper%20Usability%20of%20Life%20Cycle%20Assessment%20for%20Cradle%20to%20Cradle%20purposes_0.pdf (accessed on 2 September 2021).
- Bjørn, A.; Hauschild, M.Z. Absolute versus Relative Environmental Sustainability. J. Ind. Ecol. 2013, 17, 321–332. [Google Scholar] [CrossRef]
- Finkbeiner, M.; Schau, E.M.; Lehmann, A.; Traverso, M. Towards life cycle sustainability assessment. Sustainability 2010, 2, 3309–3322. [Google Scholar] [CrossRef] [Green Version]
- Hauschild, M.Z.; Rosenbaum, R.K.; Olsen, S.I. Life Cycle Assessment Theory and Practice; Springer International Publishing: Montpellier, France, 2018; ISBN 978-3-319-56474-6. [Google Scholar]
- EPD International. The International EPD® System. Available online: https://www.environdec.com/ (accessed on 7 November 2020).
- Ismayilova, A.; Silvius, G. Cradle-to-Cradle in Project Management: A Case Study. Int. J. Circ. Econ. Waste Manag. 2021, 1, 27. [Google Scholar] [CrossRef]
- MBDC. Guidance for the Cradle to Cradle CertifiedTM Product Standard, Version 3.1; 2016; Available online: https://www.c2ccertified.org/resources/detail/cradle_to_cradle_certified_product_standard_guidance_document (accessed on 2 September 2021).
- Brilhuis-Meijer, E.; Goedkoop, M. Sustainability News, PRé; 2015; Available online: https://www.pre-sustainability.com/news/lca-and-c2c-friends-or-foes. (accessed on 2 September 2021).
- Bjørn, A.; Hauschild, M.Z. Cradle to Cradle and LCA—Is there a Conflict? In Glocalized Solutions for Sustainability in Manufacturing; Springer: Berlin/Heidelberg, Germany, 2011; pp. 599–604. [Google Scholar]
- Llorach-Massana, P.; Farreny, R.; Oliver-Solà, J. Are Cradle to Cradle certified products environmentally preferable? Analysis from an LCA approach. J. Clean. Prod. 2015, 93, 243–250. [Google Scholar] [CrossRef] [Green Version]
- Kerdlap, P.; Cornago, S. Life Cycle Costing: Methodology and Applications in a Circular Economy. In An Introduction to Circular Economy; Springer: Singapore, 2021; pp. 499–525. ISBN 978-981-15-8510-4. [Google Scholar]
- Ramos Huarachi, D.A.; Piekarski, C.M.; Puglieri, F.N.; de Francisco, A.C. Past and future of Social Life Cycle Assessment: Historical evolution and research trends. J. Clean. Prod. 2020, 264, 121506. [Google Scholar] [CrossRef]
- Cradle to Cradle Products Innovation Institute. Material Health Assessment Methodology 2019, 92. Available online: https://www.c2ccertified.org/resources/detail/material_assessment_methodology (accessed on 2 September 2021).
- Cradle to Cradle Products Innovation Institute. Methodology for Applying the Final Manufacturing Stage Requirements 2020, 18. Available online: https://cdn.c2ccertified.org/resources/certification/guidance/MET_Applying_Final_Manufacturing_Stage_FINAL_103020.pdf (accessed on 2 September 2021).
- Cradle to Cradle Products Innovation Institute. Methodology for Defining Homogeneous Materials. Available online: https://s3.amazonaws.com/c2c-website/resources/certification/standard/MET_Defining_Homogeneous_Materials_FINAL_091018.pdf (accessed on 7 November 2020).
- Cradle to Cradle Products Innovation Institute. Mixture Hazard Assessment Methodology. Available online: https://s3.amazonaws.com/c2c-website/resources/certification/standard/MTD_Hazard_Assessment_of_Mixtures_Methodology_FINAL_031418.pdf (accessed on 7 November 2020).
- Cradle to Cradle Products Innovation Institute. Exposure Assessment Methodology. Available online: https://s3.amazonaws.com/c2c-website/resources/certification/standard/MTD_Exposure_Assessment_FINAL_091018.pdf (accessed on 7 November 2020).
- Cradle to Cradle Products Innovation Institute. Colorants (Textile Dyestuffs and Pigments) Assessment Methodology. Available online: https://s3.amazonaws.com/c2c-website/resources/certification/standard/MET_Colorants_Assessment_FINAL_091018.pdf (accessed on 7 November 2020).
- Cradle to Cradle Products Innovation Institute. Biological Materials Assessment Methodology. Available online: https://s3.amazonaws.com/c2c-website/resources/certification/standard/MTD_Biological_Materials_Assessment_FINAL_091018.pdf (accessed on 7 November 2020).
- Cradle to Cradle Products Innovation Institute. Geological Materials Assessment Methodology. Available online: https://s3.amazonaws.com/c2c-website/resources/certification/standard/MTD_Geological_Materials_Assessment_FINAL_091018.pdf (accessed on 7 November 2020).
- Cradle to Cradle Products Innovation Institute. Polymer Assessment Methodology. Available online: https://s3.amazonaws.com/c2c-website/resources/certification/standard/MTD_Polymer_Assessment_FINAL_052617.pdf (accessed on 7 November 2020).
- Cradle to Cradle Products Innovation Institute. Recycled Content Materials Assessment Methodology. Available online: https://s3.amazonaws.com/c2c-website/resources/certification/standard/MTD_Recycled_Content_Materials_Assessment_FINAL_052617.pdf (accessed on 7 November 2020).
- AENOR. ISO 14044: Environmental Management—Life Cycle Assessment—Requirements and Guidelines 2006. Available online: https://www.iso.org/standard/38498.html (accessed on 2 September 2021).
- UNEP; SETAC. Guidelines for Social Life Cycle Assessment of Products; United Nations Publications: New York, NY, USA, 2009; ISBN 9789280730210. [Google Scholar]
- ISO. ISO 15686-5:2017: Buildings and constructed assets—Service life planning—Part 5: Life-cycle costing 2017.
- MBDC. Cradle to Cradle Certified Product Standard Version 3.1. Available online: https://s3.amazonaws.com/c2c-website/resources/certification/standard/C2CCertified_ProductStandard_V3.1_160107_final.pdf (accessed on 2 September 2021).
- Minkov, N.; Bach, V.; Finkbeiner, M. Characterization of the Cradle to Cradle CertifiedTM Products Program in the Context of Eco-labels and Environmental Declarations. Sustainability 2018, 10, 738–758. [Google Scholar] [CrossRef] [Green Version]
- ISO. ISO 14025:2006. Environmental Labels and Declarations—Type IIIEnvironmental Declarations—Principles and Procedures 2006, 25. Available online: https://www.iso.org/standard/38131.html (accessed on 2 September 2021).
- Goedkoop, M.; Heijungs, R.; Huijbregts, M.; De Schryver, A.; Struijs, J.; Van Zelm, R. ReCiPe 2008. A Life Cycle Impact Assessment Method Which Comprises Harmonised Category Indicators at the Midpoint and the Endpoint Level First Edition Report I: Characterisation Mark Huijbregts 3). Available online: https://docplayer.net/2876611-Recipe-2008-a-life-cycle-impact-assessment-method-which-comprises-harmonised-category-indicators-at-the-midpoint-and-the-endpoint-level.html/ (accessed on 2 September 2021).
- RIVM. Committed to Health and Sustainability LCIA: The ReCiPe Model. Available online: https://www.rivm.nl/en/life-cycle-assessment-lca/recipe (accessed on 12 June 2021).
- UNEP. The Methodological Sheets for Sub-Categories in Social Life Cycle Assessment (S-LCA). Available online: https://www.lifecycleinitiative.org/wp-content/uploads/2013/11/S-LCA_methodological_sheets_11.11.13.pdf (accessed on 12 March 2021).
- PRé. The Eco-Indicator 99 A Damage Oriented Method for Life Cycle Impact Assessment Methodology Annex; PRé Consultants: Anersfiirt, The Netherlands, 2001. [Google Scholar]
- Swarr, T.E.; Hunkeler, D.; Klöpffer, W.; Pesonen, H.-L.; Ciroth, A.; Brent, A.C.; Pagan, R. Environmental life-cycle costing: A code of practice. Int. J. Life Cycle Assess. 2011, 16, 389–391. [Google Scholar] [CrossRef]
- Vogtländer, J.G.; Brezet, H.C.; Hendriks, C.F. The virtual Eco-costs ’99: A single LCA-based indicator for sustainability and the Eco-costs—Value ratio (EVR) model for economic allocation: A new LCA-based calculation model to determine the sustainability of products and services. Int. J. Life Cycle Assess. 2001, 6, 157–166. [Google Scholar] [CrossRef]
- PRé SimaPro [Software]. Available online: https://simapro.com/ (accessed on 1 August 2021).
- OpenLCA. GreenDelta. Available online: http://www.openlca.org/greendelta/ (accessed on 12 May 2018).
- C2C. Certified C2C Product Certification Overview. Available online: https://www.c2ccertified.org/get-certified/product-certification (accessed on 13 November 2018).
- Kalmykova, Y.; Sadagopan, M.; Rosado, L. Circular economy—From review of theories and practices to development of implementation tools. Resour. Conserv. Recycl. 2018, 135, 190–201. [Google Scholar] [CrossRef]
- CEC. CEC Global Database. Available online: https://www.circulareconomyclub.com/gd-home/cec-global-database/ (accessed on 8 December 2018).
- Circle Lab. Explore, Search, and Find Inspiring Examples of the Circular Economy in Practice. Available online: https://www.circle-lab.com/knowledge-hub (accessed on 8 December 2018).
- Circular CoLag. The State of the Circular Economy in America: Trends, Opportunities, and Challenges Empowering the Circular Economy. Available online: https://static1.squarespace.com/static/5a6ca9a2f14aa140556104c0/t/5c09d8c3f950b7546592158d/1544149193393/US+CE+Study_FINAL_2018.pdf (accessed on 8 March 2021).
- Sesini, G.; Castiglioni, C.; Lozza, E. New trends and patterns in sustainable consumption: A systematic review and research agenda. Sustainability 2020, 12, 5935. [Google Scholar] [CrossRef]
- PWC. Global Consumer Insights Survey 2019. It’s time for a Consumer-Centred Metric: Introducing “Return on Experience”; Available online: https://www.pwc.com/ee/et/publications/pub/Consumer-Insight-Survey-2019-report.pdf/ (accessed on 2 September 2021).
- Paula Pinheiro, M.A.; Jugend, D.; Demattê Filho, L.C.; Armellini, F. Framework proposal for ecodesign integration on product portfolio management. J. Clean. Prod. 2018, 185, 176–186. [Google Scholar] [CrossRef] [Green Version]


| Parameter | LCA | C2C |
|---|---|---|
| Objective | Eco-efficiency | Eco-effectiveness |
| Strategy | Minimization and cleanness | Maximization and regeneration. |
| Knowledge | Open, developed by the global scientific community. Application by experts in environmental analysis. | Restricted and licensed for use. No specialized training required. Some design guides available [60,61,62,63,64,65,66,67,68,69] |
| Normative and guidelines | Environment: ISO 14040 and ISO 14044 [9,70] Social: UNEP and SETAC Guidelines [71] Economic: ISO 15686-5 [72] (only building and construction) | Does not exist [54,73,74] |
| Certification | More accepted: some certifications require LCA, for example, ISO 14025: 2006 [52,75] | Certification in 5 levels: Basic, Bronze, Silver, Gold or Platinum. Private [54] |
| Scope | Assessment. Indirectly, in design and optimization technology. | Design and assessment |
| Assessment dimensions | Environmental and economic criteria, (quantitative). Social criteria (qualitative or semiquantitative); independent procedures. | Environmental and social in a single procedure. Qualitative. |
| Assessment categories | Based on effects. Two groups: midpoint or effect indicators (>18 categories with low uncertainty but difficult to interpret) and endpoint or final damage (3 categories easy to understand but with uncertainty). [76] Does not include analysis of externalities or environmental risk. | Based on causes. Proposes 3 design principles. Five simplified evaluation categories. No direct relationship between principles and categories. 5 categories easy to understand but with uncertainty. |
| Life cycle inventory | Exhaustive. Impact assessment based on outputs. Complexity in data collection. | Impact assessment based on inputs. Simplified inventory. |
| Result Interpretation step | Characterization in equivalent units, the comparison of impacts is not intuitive: normalization or weighting necessary. The proposal for improvements will depend on the experience of the expert. It does not propose design strategies. | The interpretation is simple. It does not allow comparison of solutions: redesigns are not verifiable. Different improvement strategies, design guides and proposals for zero-impact solutions and value regeneration are available. |
| Assessment process | Quantitative in four detailed phases: analysis of destination, exposure, effect and damage. The identification of causes is complex. | Qualitative in four conceptual phases: define, increase, support and optimize. It does not follow an ordered sequence. It does not define the effect (damage). |
| Tools and software | Complete databases, a variety of analysis methods and software. Availability of free software. | Knowledge base and databases not available. Design results controlled by expert (owners). |
| JK Causes | Ijk Effects | K Damage (Protected Areas) | |||
|---|---|---|---|---|---|
| Resources (Rjk) | Midpoint Category | Ci [unit]/Ni [unit] | Type | LCA+C2C Endpoint Category (Qk) | |
| Materials (M) | Global warming | Kg CO2 eq/unit | En | 0.19 | QHH Anthropo-sphere, care for human health |
| Ozone depletion | Kg CFC-11 eq/unit | En | 0.08 | ||
| Human toxicity | Kg 1.4-DB eq/unit | En | 0.39 | ||
| Particulate matter formation | Kg PM10 eq/unit | En | 0.08 | ||
| Photochemical oxidation potential (SMOG) | Kg C2H4 eq/unit | En | 0.14 | ||
| Ionizing radiation | Kg U235 eq/unit | En | 0.12 | ||
| Energy (E) | Global warming | kg CO2 eq/unit | En | 0.50 | |
| Particulate matter formation | Kg PM10 eq/unit | En | 0.25 | ||
| Photochemical oxidation potential (SMOG) | Kg C2H4 eq/unit | En | 0.25 | ||
| Human (H) | Human ecotoxicity | kg 1.4-DB eq/unit | En | 1.00 | |
| Human (H) | Health and safety (all stakeholders) | Color/[1, 6] | S | 0.36 | QHS Anthropo-sphere, care for human safety and well-being |
| Fair salary and hours of work | Color/[1, 6] | S | 0.18 | ||
| Equal opportunities, discrimination and association | Color/[1, 6] | S | 0.18 | ||
| Social benefits and social security | Color/[1, 6] | S | 0.09 | ||
| Child labor and forced labor | Color/[1, 6] | S | 0.18 | ||
| Land (L) | Access to resources (material and non-material) | Color/[1, 6] | S | 0.25 | |
| Problems related to society: delocalization and migration, armed conflicts and rights | Color/[1, 6] | S | 0.38 | ||
| Contribution to economic and technological development | Color/[1, 6] | S | 0.38 | ||
| Information (I) | Cultural heritage | Color/[1, 6] | S | 0.08 | |
| Community engagement and public commitments | Color/[1, 6] | S | 0.17 | ||
| Feedback mechanism and consumer privacy | Color/[1, 6] | S | 0.17 | ||
| Transparency and corruption | Color/[1, 6] | S | 0.17 | ||
| End of life and social responsibility | Color/[1, 6] | S | 0.25 | ||
| Fair competition and intellectual property rights | Color/[1, 6] | S | 0.17 | ||
| Materials (M) | Global warming | Kg CO2 eq/unit | En | 0.34 | QBS Biosphere, care for ecosystem (biotic) |
| Acidification | Kg SO2 eq/unit | En | 0.13 | ||
| Fresh water and marine aquatic ecotoxicity | Kg 1.4-DB eq/unit | En | 0.19 | ||
| Terrestrial ecotoxicity | Kg 1.4-DB eq/unit | En | 0.08 | ||
| Eutrophication | Kg PO4 eq/unit | En | 0.26 | ||
| Energy (E) | Global warming | kg CO2 eq/unit | En | 1.00 | |
| Water (W) | Acidification | kg SO2 eq/unit | En | 0.33 | |
| Fresh water and marine aquatic ecotoxicity | kg 1.4-DB eq/unit | En | 0.33 | ||
| Eutrophication | kg PO4 eq/year | En | 0.33 | ||
| Land (L) | Land use/transformation | m2/year | En | 1.00 | |
| Energy (E) | Mineral resource depletion | Kg Sb eq/year | En | 0.60 | QAS Biosphere, ecosystem (abiotic) |
| Cumulative energy demand | MJ eq/year | En | 0.40 | ||
| Water (W) | Water use/depletion | m3/year | En | 1.00 | |
| Level | Parameter | Result | |
|---|---|---|---|
| Product data | Raw material | Material | Quantity (kg) |
| Aluminum (6060 T6) | 7.41 | ||
| Aluminum (5754 H111) | 2.04 | ||
| Steel (304) | 4.27 | ||
| LDPE | 0.1 | ||
| …/… | |||
| Components | Name/Process | Quantity (number) | |
| Main tube/laser cutting | 1 | ||
| Steering wheel sheet/laser cutting and bent | 2 | ||
| Wheel sleeve/laser cutting and bent | 2 | ||
| Brake caliper support/laser cutting and bent | 2 | ||
| Supporting tube/laser cutting | 1 | ||
| …/… | |||
| Social data | Workers | Workplace discrimination | No |
| Overtime | Yes | ||
| Stress | Yes | ||
| …/… | |||
| Society | Local support | Yes | |
| Corruption | No | ||
| …/… | |||
| Users | Ergonomic elements | Yes | |
| False advertising | No | ||
| …/… | |||
| Company | Manufacturing costs | 1019.21 | |
| Recycling strategy | Yes | ||
| …/… | |||
| LCA | C2C | ||||||
|---|---|---|---|---|---|---|---|
| Dimension | Categories and Metrics | Category | Results | Certification | |||
| E-LCA | Impact category | Ci [unit] | Ni [year] | Ma. Health | Result ABC-X M/U/PC/E * | Level | |
| Abiotic dep. (kg Sb eq) | 4.18 | 2.64 × 10⁻¹¹ | Al 6060 T6 | C/A/A/B | Basic | ||
| Acidification (kg SO2 eq) | 5.62 | 1.74 × 10⁻¹¹ | Al 5754 H111 | C/A/A/B | |||
| Eutrophication (kg PO4 eq) | 0.25 | 1.95 × 10⁻¹² | Steel 304 | C/A/A/B | |||
| Global warm. (kg CO2 eq) | 498.97 | 1.36 × 10⁻¹¹ | Cardboard | X/A/A/A | |||
| Freshw.tox (kg 1.4-DB eq) | 38.19 | 3.08 × 10⁻¹⁴ | LDPE | X/A/A/X | |||
| …/… | …/… | …/… | …/… | ||||
| S-LCA | Impact category | Factor | Ni (points) | Ma. Reutilization | Origin | Destination | Level |
| Child labor and forced labor | 1 | Al 6060 T6 | 0% | 7.41% | Bronze %R (42.06) | ||
| Health and safety (all stakeholders) | 2 | Al 5754 H111 | 0% | 2.04% | |||
| Social benefit and social security | 3 | Steel 304 | 0% | 4.27% | |||
| EoL and social responsibility | 3 | C. Cardboard | 0% | 0% | |||
| Economic and tech. develop. | 1 | …/… | …/… | ||||
| Feedback mechanism and CP | 4 | Total | 0.427 | 83.70 | |||
| …/… | …/… | Renewable energy | Level | ||||
| Ec-LCA | Impact category | €/unit | Ni (€) | renewable energy < 5% ** | Bronze | ||
| LCC | - | 1200 | Water stewardship | Level | |||
| Global warm. (kg CO2 eq) | 0.116 | 69.63 | no audit for water management ** | Basic | |||
| Acidification (kg SO2 eq) | 7.55 | 39.75 | Social fairness | Level | |||
| Eutrophication (kg PO4 eq) | 3.60 | 0.93 | Social issues relating to suppliers not evaluated; no positive impact strategy ** | Silver | |||
| Summer smog (kg C2H4 eq) | 10.38 | 2.36 | |||||
| …/… | …/… | ||||||
| N | Weighting LCA+C2C | |||||
|---|---|---|---|---|---|---|
| K | NK | Jk | Wi j k | Qk | Wr LiC | WK LiC |
| QHH | 8.14 × 10⁻¹¹ | M (J2) | 1.01 × 10⁻¹¹ | 2.11 × 10⁻¹¹ | 0.88 | 0.74 |
| E (J3) | 4.42 × 10⁻¹² | 0.95 | ||||
| H (J5) | 6.53 × 10⁻¹² | 0.92 | ||||
| QSH | 30 | H (J5) | 2.07 | 5.94 | 0.93 | 0.80 |
| L (J1) | 1.26 | 0.96 | ||||
| I (J6) | 2.61 | 0.91 | ||||
| QBS | 1.71 × 10⁻¹⁰ | M (J2) | 1.62 × 10⁻¹¹ | 4.83 × 10⁻¹¹ | 0.91 | 0.28 |
| E (J3) | 5.84 × 10⁻¹² | 0.97 | ||||
| W (J4) | 2.61 × 10⁻¹¹ | 0.85 | ||||
| L (J1) | 1.57 × 10⁻¹³ | 0.99 | ||||
| QAS | 1.14 × 10⁴ | E (J3) | 4.56 × 10³ | 4.56 × 10³ | 0.60 | 0.40 |
| W (J4) | OBS | OBS | ||||
| FEI | Indicator | Historical Values (Pi) | Result (IP) | |||
|---|---|---|---|---|---|---|
| P0 | P1 | P2 | IP% | IPT | ||
| Ey | WK | (tO) | (t1) | (te) | E% | ET |
| HH (LiC) | 0.53 | 0.63 | 0.74 | 0.15 | 0.11 | |
| HS (LiC) | 0.64 | 0.72 | 0.89 | 0.19 | 0.13 | |
| BS (LiC) | 0.22 | 0.25 | 0.28 | 0.11 | 0.03 | |
| AS (LiC) | 0.3 | 0.4 | 0.40 | 0 | 0.05 | |
| Cy | Index | (tO) | (t1) | (te) | C% | CT |
| CC (%) | 0 | 0.4 | 0.6 | 0.33 | 0.30 | |
| ER (%) | 0.6 | 0.1 | 0.1 | 0 | −0.2 | |
| LCV (%) * | 1 | 0.6 | 0.4 | −0.5 | −0.3 | |
| Sy | Index | (tO) | (t1) | (te) | S% | ST |
| C2CGS | 0.13 | 0.16 | 0.24 | 0.33 | 0.06 | |
| LCC (€) | 140 | 123.8 | 1200 | 0.90 | 530 | |
| Eco-cost € | 160 | 155 | 112.7 | −0.3 | −23.6 | |
| Value (€) * | 2000 | 1850 | 1600 | −0.1 | −200 | |
| EVR* | 0.08 | 0.08 | 0.082 | −0.1 | −0.01 | |
Publisher’s Note: MDPI stays neutral with regard to jurisdictional claims in published maps and institutional affiliations. |
© 2021 by the authors. Licensee MDPI, Basel, Switzerland. This article is an open access article distributed under the terms and conditions of the Creative Commons Attribution (CC BY) license (https://creativecommons.org/licenses/by/4.0/).
Share and Cite
Peralta, M.E.; Alcalá, N.; Soltero, V.M. Weighting with Life Cycle Assessment and Cradle to Cradle: A Methodology for Global Sustainability Design. Appl. Sci. 2021, 11, 9042. https://doi.org/10.3390/app11199042
Peralta ME, Alcalá N, Soltero VM. Weighting with Life Cycle Assessment and Cradle to Cradle: A Methodology for Global Sustainability Design. Applied Sciences. 2021; 11(19):9042. https://doi.org/10.3390/app11199042
Chicago/Turabian StylePeralta, M. Estela, Nuria Alcalá, and Víctor M. Soltero. 2021. "Weighting with Life Cycle Assessment and Cradle to Cradle: A Methodology for Global Sustainability Design" Applied Sciences 11, no. 19: 9042. https://doi.org/10.3390/app11199042