1. Introduction
The interaction between dislocations is a well-known topic, discussed in scientific literature since the middle of last century. High-quality overviews on this topic can be found in reference books concerning dislocations (see for instance [
1,
2,
3]). The aim of the present work is to investigate a particular aspect observed for non-mobile, isolated dislocations, in a platelet-shaped single crystal of 4H-SiC with low dislocation density (~10
3 cm/cm
3).
The dislocations in 4H-SiC cannot move easily at room temperature, and we can consider their distance
D as constant. When this distance
D is in the range 50–250 µm, we observe a weak (~µradian) distortion of the region lying between parallel dislocations with opposite Burgers vectors. Dislocations in 4H-SiC crystals have been extensively studied through X-ray diffraction Rocking Curve Imaging (see for instance [
4,
5,
6,
7,
8,
9]). The faint distortion we observe had not been investigated previously because there was no available experimental technique allowing its visualisation. We took advantage of the capabilities of Rocking Curve Imaging (RCI) [
10] to perform this investigation. RCI is a Bragg diffraction imaging technique that has been developed and pushed to the limits at the European Synchrotron Radiation Facility (ESRF) over the last twenty years (see, as examples, [
11,
12,
13]). Nowadays, it is able to provide maps of a crystal with an angular resolution in the µradian range.
Our experiment shows that the region lying between parallel dislocations with opposite Burgers vectors exhibits an angular misorientation with respect to the crystal matrix that differs from the simple sum of the misorientation of the individual dislocations. The distortion field is modified and appears to extend the distortion associated with the neighbourhood of the core of the dislocations. In the present work, we characterise this misorientation and discuss its origin.
2. Materials and Methods
Single crystals of silicon carbide are grown industrially for high-power electronic applications. The experiment was carried out at the beamline ID06-HXM of the ESRF [
14] on a commercially produced 0.35 mm thick single crystal wafer of 4H-SiC. The surface orientation of our sample was nearly (0001), with a 4° offset towards the [
direction. We studied the
reflection in transmission mode (Laue geometry) using an X-ray beam energy of 10 keV with θ
B = 14.6°. The beam size was 1 × 1 mm
2. An indirect two-dimensional detector with an effective pixel size of 0.6 × 0.6 µm
2 (leading to a field of view of 1.2 × 1.2 mm
2) was positioned approximately 40 mm downstream of the sample.
The experimental technique we used is Rocking Curve Imaging (RCI), which gives access to quantitative data associated with crystal distortion with a spatial resolution in the µm range. RCI is an extension of monochromatic Bragg diffraction topography. Experimentally, it is performed by recording a series of images (200 in the present work) at slightly different consecutive angular positions on the Bragg diffraction curve (“rocking curve”) using a two-dimensional pixelated detector (
Figure 1). The data recorded along the rocking curve are processed and analysed pixel by pixel using purpose-built software [
15]. Maps of the “local” integrated intensity, Full Width at Half-Maximum (FWHM) and peak position are then generated from the rocking curves recorded in each pixel. The last two maps result from a Gaussian fit of the rocking curve recorded on each individual pixel, as schematically indicated in
Figure 1.
RCI was developed using synchrotron radiation because it is difficult to implement with conventional laboratory X-ray equipment. In particular, the number of photons recorded in a given pixel of the detector (with a surface typically in the 1 µm
2 range) should be statistically meaningful, which implies that a high photon flux and a bijective (reversible) relationship between one pixel of the detector and one voxel in the crystal should exist. This implies a low divergence beam. This technique was initially implemented in the reflection geometry [
10] and was used for the characterisation of crystals and deposited layers with thicknesses in the µm range [
12]. In order not to be limited to the near-surface distortion, we use RCI in transmission geometry.
Most of our RCI work relies on two assumptions that simplify the interpretation of the various maps. We first assume that interferences, such as Kato fringes, associated with dynamical diffraction effects [
16], are averaged out and that the diffracted beam recorded in a given pixel of the detector originates from a well-defined volume (“voxel”) in the crystal that corresponds to the intersection of the incident beam with the projection of the considered pixel along the Bragg diffracted direction. We assume, in addition, that all of the beam diffracted by the considered voxel goes to one pixel of the detector; this assumption is valid when the “mosaic spread” in this voxel, measured by the FWHM obtained from the Gaussian fit, is small enough (smaller than ~2 × 10
2 µradian for our experimental conditions). Both assumptions appear to be well-satisfied in the present work.
Crystal defects produce a contrast in the integrated intensity map that is similar to that obtained by classical Lang or white beam topography [
16]. The FWHM and integrated intensity maps are rather similar in the X-ray low-absorption case. However, the FWHM map provides a quantitative measurement of the distortion associated with a given defect. The peak position map measures the effective misorientation [
16] averaged over each of the voxels. In the case of a dislocation, this effective misorientation exhibits a change of sign when passing from one side of the dislocation line to the other. Let us consider, as an example, the case of an isolated screw dislocation perpendicular to the diffracting planes: the variation of peak position Δω measured when going from a distance (−r
0) from the core of the dislocation to a distance (+r
0) is given by Δω =
b/π
r0,
b being the modulus of the Burgers vector of the dislocation. A variation of the peak width associated with the dislocation results from the change of Δω within a pixel. This contribution to the FWHM can be written as ~
p (δ(Δω)/δr), where
p is the pixel size. We use this characteristic variation to identify dislocations in the peak position and FWHM maps [
11]. In the present work, we pay close attention to the quantitative dependence of both Δω and FWHM when dislocations are not isolated but are parallel and exhibit opposite Burgers vectors.
3. Results
From the ensemble of images recorded along the rocking curve of our 4H-SiC sample, we produced maps of the local FWHM and peak position. These maps result, as described above, from a Gaussian fit of the rocking curve recorded in each individual pixel.
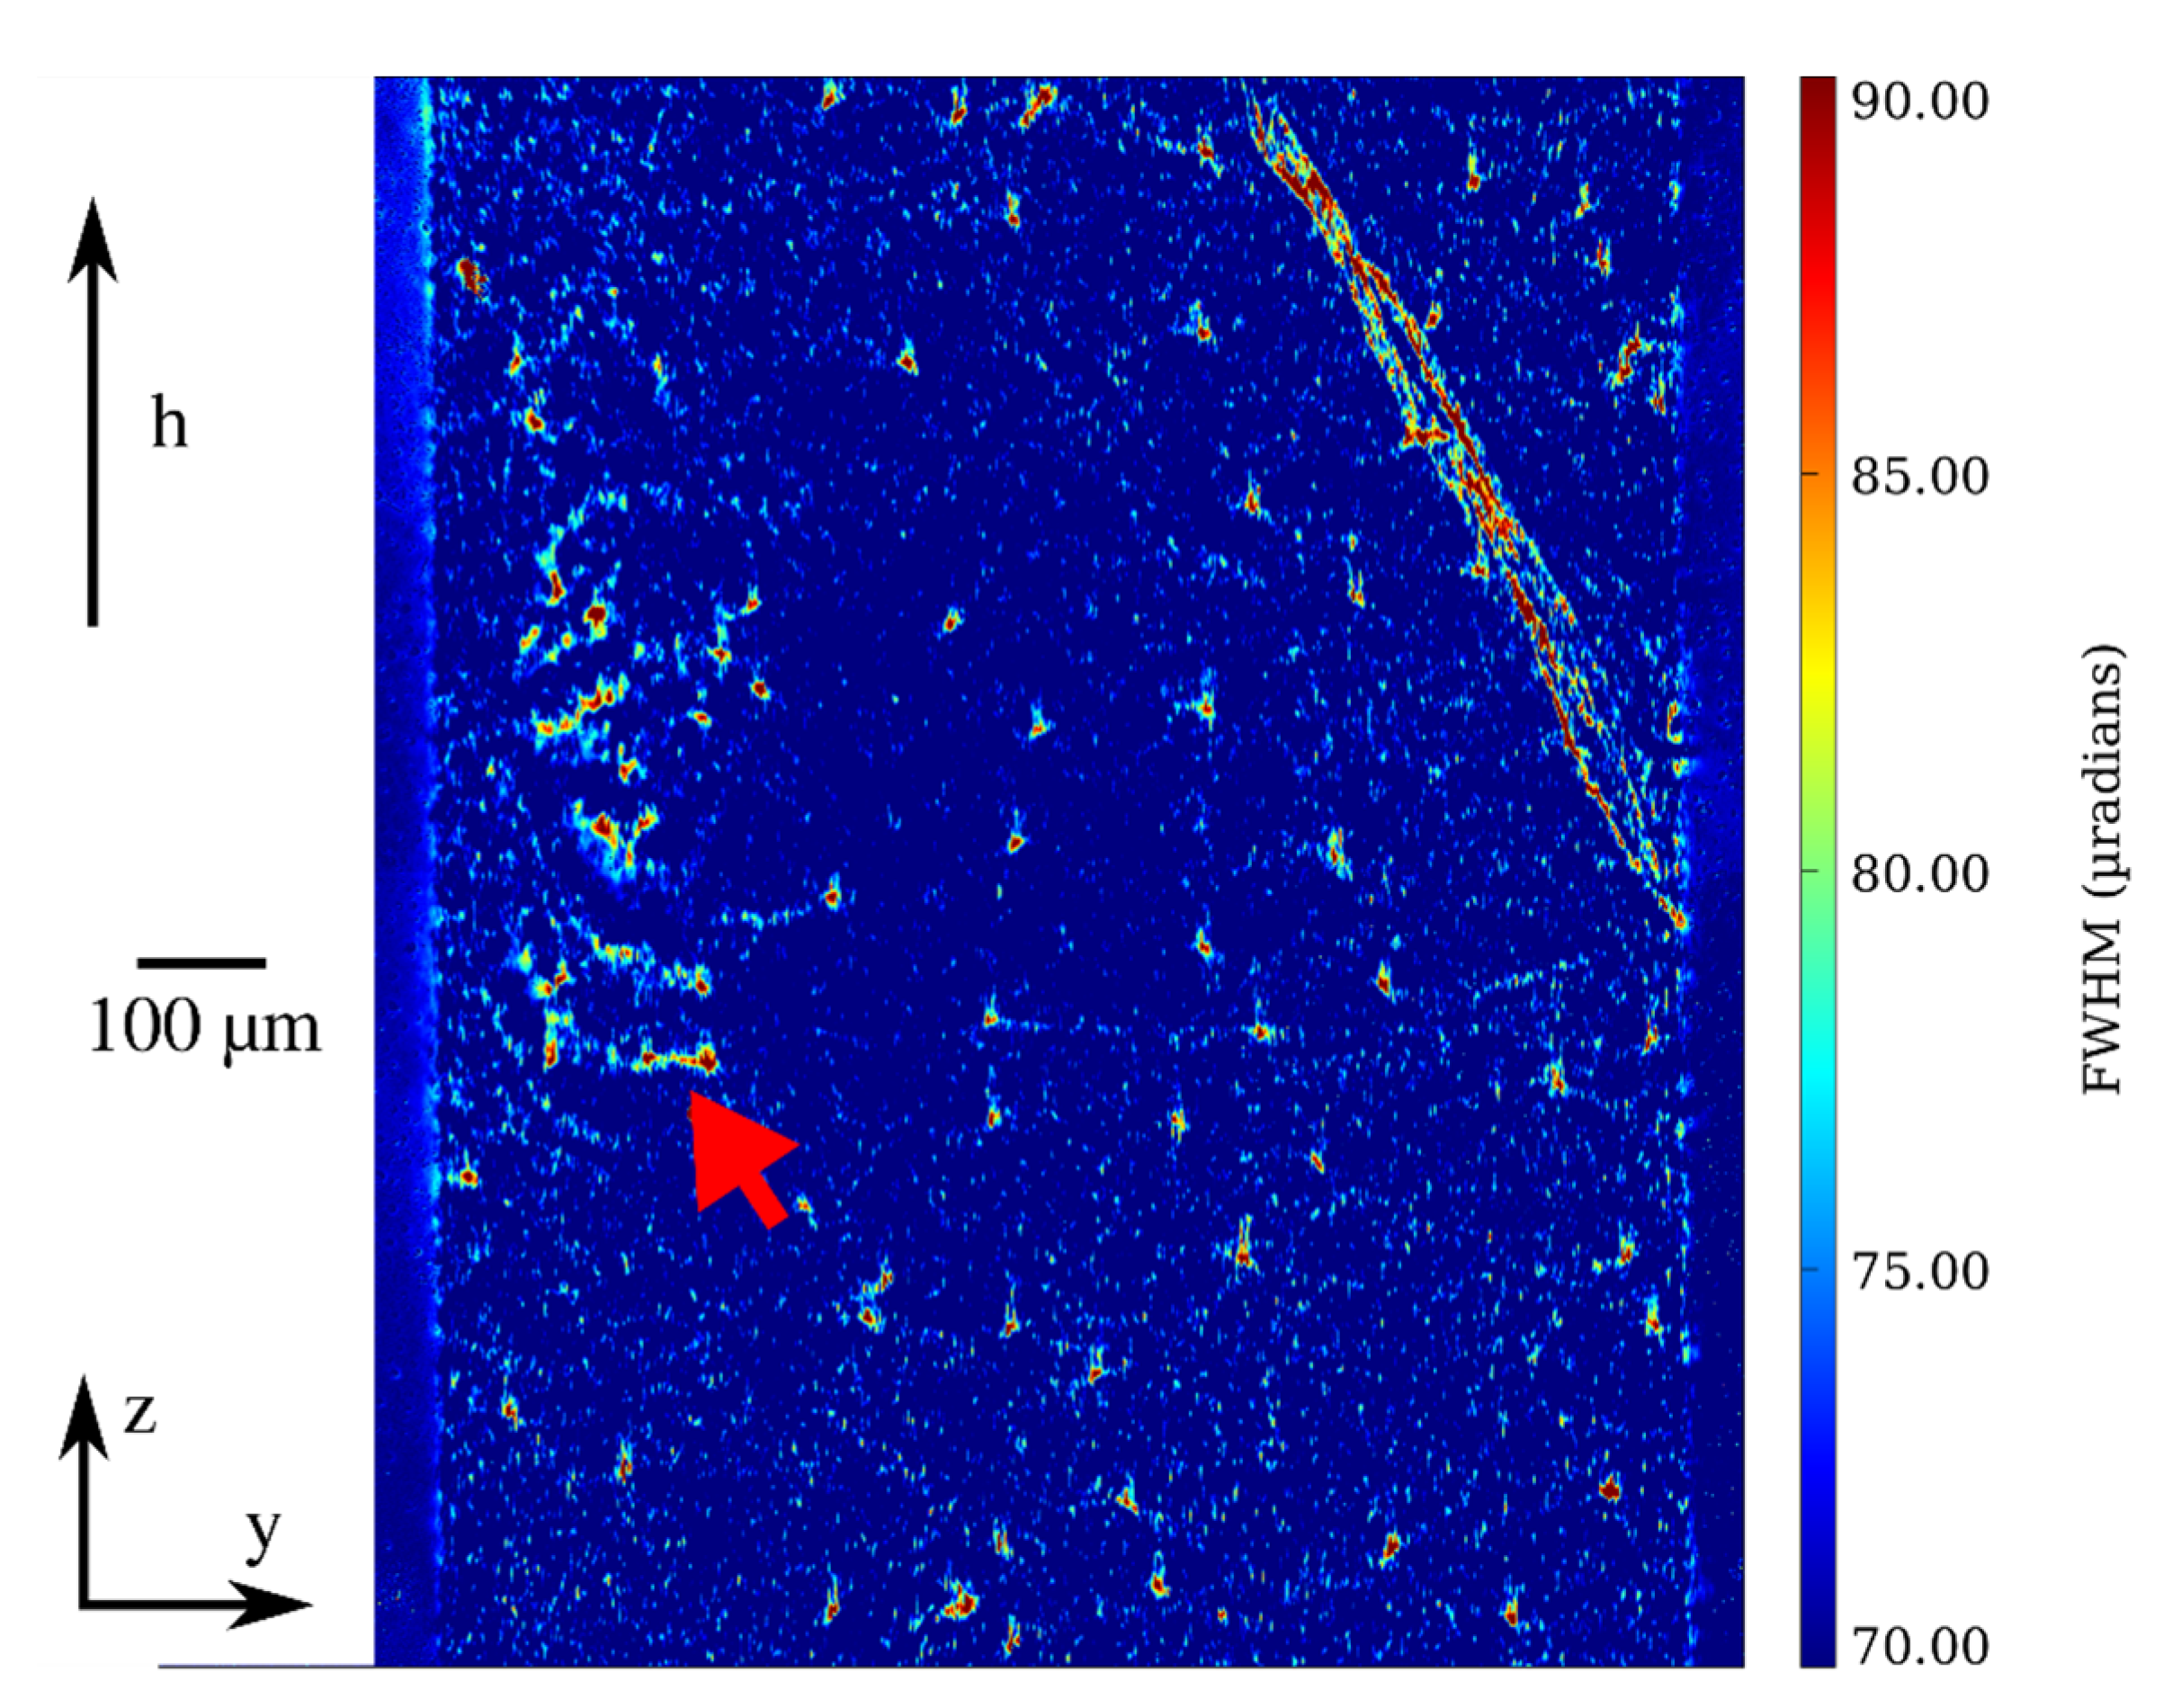
The FWHM map (
Figure 2) shows for most pixels a local FWHM that is around 60 µradians. The width is rather uniform, with a few exceptions that will be discussed later. This value mainly results from the convolution between an “instrumental” divergence δζ and the local mosaic spread of the crystal. δζ includes the divergence of the faintly convergent beam (~40 µradians) and the width corresponding to the energy bandwidth of the Si (111) monochromator (~30 µradians). It appears that δζ is the dominant term of this convolution and that the mosaic spread corresponding to most of the voxels is smaller (<30 µradians), indicating a rather high crystalline quality of the crystal matrix.
A few regions exhibit, in
Figure 2, a higher FWHM than the matrix. They are associated with the distortion field of crystalline defects. The most visible ones are red-yellow lines located in the upper right corner of the figure, which are probably associated with surface scratches. We also observe a number of red dots surrounded by yellow pixels. These dot-like images are also visible on the peak position map shown in
Figure 3, where they display a double-dot shape, the dot on one side exhibiting a higher peak position than the matrix and the one on the other side a lower peak position (see, e.g., the image in the black circle on
Figure 3). These FWHM and peak position images are characteristic of dislocations [
11], which show up in RCI images as regions of higher FWHM (red-yellow dots in the FWHM map) and exhibit an abrupt change of peak position from one side of the dislocation core to the other, in the peak position map. In both
Figure 2 and
Figure 3, these dislocation-associated images are “dot” shaped, indicating that the dislocation lines are nearly perpendicular to the surface, i.e., nearly parallel to the c-axis. We estimated the dislocation density (~1300/cm
2) by counting these dot-like images.
All the observed dot-like images are very similar, suggesting that the crystal displays one type of threading dislocation, having the same direction along the c-axis and the same Burgers vector modulus. The peak position map shows that both signs of the Burgers vector are present because the sign of the angular departure with respect to the matrix average on one (e.g., the right) side of a dislocation is not the same for all dislocations.
Let us now point out the behaviour of the region lying between two dislocations with opposite Burgers vectors, which constitutes the main topic of the present work. This behaviour is particularly visible for the pair of dislocations indicated by the red arrow on both the FWHM (
Figure 2) and the peak position map (
Figure 3). The two dislocations, located at a distance
D~50 µm, exhibit Burgers vectors of opposite signs as indicated, in
Figure 3, by reversed yellow and blue sides. The region between the dislocations displays a higher FWHM than the matrix (
Figure 2) and is also misoriented with respect to the matrix (
Figure 3).
Let the angle Δω be the difference in the peak position relative to the crystal matrix.
Figure 4 shows how Δθ varies in the region between two dislocations of opposite sign, indicated by the red arrow in
Figure 2 and
Figure 3. The angular position of the
Bragg diffracting planes does not relax to the matrix orientation in the region lying between the dislocations. Instead, it decays towards an angle α corresponding to a region of the distortion field of the dislocations located near the core. This angle α is not constant over the region between the two dislocations: it is largest along the line joining the cores of the dislocations and decreases when going away from this line, implying a gradient of distortion that is evidenced by a higher FWHM than that of the matrix in
Figure 2. The different curves shown in
Figure 4 correspond to averaging α over distances, perpendicular to the line joining the core of the dislocations, going from ~3 to 20 µm. The average angle α corresponds to the 20 µm-wide region that displays a darker blue color in the peak position map (
Figure 3), corresponding to an orientation difference of ~10 µradians.
The described feature is clearly visible for the pair of dislocations indicated by the red arrow. It is also observable for several other, similar, pairs of dislocations in
Figure 3. The sign of α reverses when the sign of both Burgers vectors is inverted in the region between the dislocations (blue-yellow-blue vs. yellow-blue-yellow in
Figure 3). However, for the two cases, the modulus of α decreases when the distance
D between the dislocations increases.
4. Discussion
The dislocations we observe display a similar contrast and are nearly parallel to the c-axis. The threading dislocations parallel to the c-axis in 4H-SiC that have been reported [
5,
6] are either screw dislocations or edge dislocations displaying a Burgers vector along
. We discard the screw dislocation case because it is such that
h.b = 0,
h being the diffraction vector (perpendicular to the
planes) and
b the Burgers vector (parallel to
c), and therefore, these dislocations should not be observed because they produce nearly no contrast in the image [
16]. The Burgers vectors of the dislocations we observe display an edge component. These dislocations are such that they produce, on the
lattice planes, an angular misorientation towards the
c-axis, as indicated in
Figure 4.
Figure 5 schematically shows the dislocation lines (violet) and the tilt of the
lattice planes in the region between dislocation lines of opposite sign. The intersection of the scattering plane (the
lattice planes of the crystal matrix) with the distorted
lattice planes is shown as green lines. In the region between the pair of dislocations, these lines are rotated by an angle α with respect to the matrix. For simplicity, for the present discussion, we assume that the weak variation of the angle α within this region can be neglected and that α can be approximated by a constant, average angle, as indicated on the right side of
Figure 5. Subgrain boundary-like regions (red rectangles in
Figure 5) are generated at the boundaries between the regions where the
lattice planes exhibit a rotation and the matrix.
Let E
d be the energy per unit length (comprising core and elastic energy) of the dislocation. When the distance
D between the dislocations is large enough, the interaction between dislocations can be neglected, and the misorientation angle α in the region between the dislocations decays back to zero. In this case, the energy of the dislocation pair is simply the sum of the energies of the two dislocations
, where
t is the thickness of the crystal, i.e., also the length of the dislocation in the crystal. In the case of the pair of dislocations indicated by the red arrow in
Figure 2 and
Figure 3, the energy of the dislocations is smaller than
because there is no return to the matrix orientation in between them. This is shown schematically in
Figure 6, which shows a truncated distortion field for the dislocations. A zone in between the two dislocations retains a misorientation α instead of going to zero. We therefore suggest that the energy of the dislocations reduces to
instead of
, with
k < 2.
The energy of the dislocations in the case indicated by the red arrow (
Figure 2 and
Figure 3) can therefore be expressed as
, with 1 <
k < 2. However, another energy, the one of the two subgrain boundary-like regions, indicated in
Figure 5 by the red rectangular volumes, has to be added, in this simple model approximation, to determine the total energy of this configuration.
This total energy can therefore be written as
, where γ is the energy per unit surface of the subgrain boundary-like volume. The expressions of γ and
Ed are known [
2]:
, and
, where
G is the elastic shear modulus, and
w is the width of the region where the plane orientation varies.
The parameter
k is a function of the angle α: we know that
k = 2 for α = 0 and that
k diminishes if the modulus of α increases. The experiment shows that α is small, i.e., <~10
−5 radians for all the cases that can be observed in
Figure 3. This suggests a phenomenological approach that assumes a linear variation of
k =
k(α) as a function of the modulus of α, thus writing
k = 2 −
z |α|, where
z is a proportionality factor for the linearization. We will consider, for simplicity in this discussion, that α is positive.
The shortest distance
D observed in
Figure 3 is 50 µm, and it corresponds to α = 10 µradians. Let us assume that this pair of dislocations and its (
D, α) couple can be considered an “experimental minimum”. By writing d
E/dα = 0 for this configuration, we can deduce that
z = 4 (
D − 2 r0).
w.α/b
2. The effective misorientation Δω
exp of an edge dislocation lying perpendicular to the diffracting planes is expected to vary as a function of the angle between the diffraction and Burgers vectors and to display a maximum given by Δω = 1.75
b/π
r0 [
16]. Using this formula for the isolated dislocation indicated by the black circle in
Figure 3, we can estimate, with Δω~18 µradian and r
0~5 µm, that the modulus of the Burgers vector b is ~0.2 nm. This, with
w~1.5 µm, allows a rough estimation of
z and
k that leads to 1 <
k < 2, which is consistent with the model.
We will consider, for the
D larger distances case, (i) that the value of
z remains constant when
D varies and (ii) that
D >>
r0. With these approximations, we can write
and, from d
E/dα = 0, deduce that the α that minimises the energy for a given
D is α~(1/
D) (
z b2/4
w). This means that α should be nearly proportional to 1/
D. This statement allows estimation of the expected α for the different
D observed in
Figure 3 and comparison between them with the experiment. The value of α = 10 µradians, corresponding to
D = 50 µm, is the biggest we measured. It is therefore the one where the error is the smallest. We will use this point as a reference for all the other measured (α,
D) pairs. The experimental and calculated (α,
D) pairs are given in
Table 1.
Figure 7 graphically visualises the comparison between the calculated curve and the experiment. It shows that the experimental points (measured in the same way as for the first point on
Figure 4) are in fair agreement with the curve resulting from our very simple model.
Let us mention again that this phenomenological approach only applies when dislocations are such that they cannot move easily, i.e., are sessile. Otherwise, it is well-known [
2] that dislocations lying in the same glide plane and exhibiting opposite Burgers vectors attract with a force
in such a way that they can annihilate upon meeting. We can notice that as
F = dE/dD, within the frame of this phenomenological model that implies
E~1/D, the force decays faster than in the standard model.
5. Conclusions
The present capabilities of the RCI experimental setup we developed, which is located at the ESRF, allowed us to show that a long-range distortion and interaction takes place between non-mobile parallel dislocations located a distance D (nearly horizontal in the image) and exhibits opposite Burgers vectors in a 4H-SiC crystal. This distortion is observable for a range of macroscopic distances (D~50–250 µm).
Our phenomenological model rests on a distortion coupling the non-mobile dislocations and allowing a reduction in the total energy. The main physical idea is that the region displaying an average angle α with respect to the matrix and lying between the dislocations with opposite Burgers vectors
- (1)
permits the reduction in the extension of the distortion field associated with the dislocations, and consequently the energy of the dislocation pair,
- (2)
introduces an extra energy associated with subgrain boundary-like areas.
For each distance D between the dislocations, there is an angle α that minimises the energy of the whole configuration.
The simple model resulting from the above considerations has only one parameter: the average angle α. It leads to a dependence of this average angle α~1/D, which is in fair agreement with the experimental results. This mechanism should modify the attractive force and thus potentially the dislocation dynamics.
This original experiment mainly provides the angular distortion of the reflecting planes along the diffraction vector (vertical for all the presented images) and, as such, opens the way to further diffraction experiments aimed at measuring the complete two-dimensional distortion and at visualising in this way the long-range interactions between dislocations that are not located in nearly the same horizontal plane of the image. This should provide a more complete view of the distortion and lead to further comparisons with more sophisticated theoretical calculations.


 ,
, 


