Abstract
A sun-tracking solar array is an effective solution to the increasing energy demand of spacecrafts. However, the driving torque fluctuation of the solar array driving assembly (SADA) and its oscillatory motion lead to the micro-vibration problem of the spacecraft. In this article, a disturbance torque model of the sun-tracking solar array, which takes its friction and flexibility into consideration, is established. Furthermore, a test platform was built to measure the disturbance force/torque, and a solar array simulator (SAS) was designed to replace the solar array in the ground experiments. Finally, the disturbance torque of the SADA-driven SAS is simulated, and the model is validated by comparing the simulation results with the experimental results. These results show that the frequency error of the model is less than 0.648%, and the amplitude error of the corresponding frequency is less than 22.33%, which indicates that the proposed model can effectively predict the disturbance torque generated by the sun-tracking solar array in orbit. The research provides theoretical guidance for the system optimization design and micro-vibration suppression of spacecrafts.
1. Introduction
As the functions of spacecrafts have become increasingly numerous and powerful, their energy demand has increased sharply. Sun-tracking solar arrays are adopted by more and more spacecrafts as energy sources to meet the high power demand. A sun-tracking solar array is mainly composed of a solar array driving assembly (SADA) and a solar array. The SADA acts as an actuator to drive the rotation of the solar array and to keep it oriented toward the sun in order to efficiently generate electricity to meet the energy requirements of the spacecraft. Although a sun-tracking solar array is an effective solution to the increasing energy demand of spacecrafts, the fluctuations of speed and the driving torque of the SADA will cause the oscillatory motion of the flexible solar array. The fluctuant driving torque of the SADA and the oscillatory motion of the solar array will act on the main body of the spacecraft and cause micro-vibrations. Spacecraft micro-vibration is low-amplitude and wide-band, and it will significantly reduce the spacecraft pointing accuracy [1]. There are many potential causes of disturbance on the spacecraft, among which the flywheel [2,3] and the control moment gyros [4,5] with middle and high frequency disturbance frequencies are considered to be the largest sources. Scholars have conducted a lot of relevant research and had many achievements with regard to the flywheel and control moment gyros [6,7,8]. On the other hand, the sun-tracking solar array is also a source of disturbance, and the disturbance it causes is mainly concentrated on the low-frequency band, which has the characteristics of a wide-frequency band and lasts for a long period of time [9]. This affects the performance of the spacecraft payloads and even the attitude stability of the satellite in some cases [10,11].
The disturbance torque model of the sun-tracking solar array is the key to predicting the influence of the disturbance on the spacecraft and to developing the disturbance suppression methods. The SADA is the disturbance source of the sun-tracking solar array, which is generally composed of a stepping motor and a harmonic reducer [12]. Stepping motors are the core component of the SADA. Many scholars have carried out theoretical and simulation research on the vibration of stepping motors. Bodson proposed the electromagnetic vibration model of the stepping motor [13]. Yang revealed the electromagnetic vibration mechanism of the stepping motor and proposed a method of reducing the amplitude of electromagnetic vibration [14]. Si defines the expression of the electromagnetic vibration frequency of the stepping motor [15]. Wang inferred that the electromagnetic field between the stator and rotor of the stepping motor could be equivalent to a viscous damping system of an electromagnetic spring and named the stiffness of the electromagnetic spring as electromagnetic stiffness [16]. Although many achievements have been made in the study of the vibration of the stepping motor, there is little research on the vibration characteristics of the SADA. Si proposed the dynamic model of SADA based on the dynamic model of the stepping motor established by Bodson, and adopted the adaptive current compensation method to improve the performance [17]. Sattar proposed the disturbance torque model of a SADA-driven rigid load for the first time and measured the disturbance torque emitted by the SADA driving four rigid loads to verify the model [9]. However, the model ignored the friction torque of the harmonic reducer and the conductive slip ring and the rigid–flexible coupling between the SADA and the solar array. Gasbarri pointed out that the effects of the rigid–flexible coupling could lead to the instability of the controlled system [18]. Therefore, it is necessary to propose a comprehensive disturbance torque model for SADA in driving the flexible solar array.
In recent years, scholars have proposed many measures for reducing the micro-vibration caused by the flywheel and control moment gyros [19,20,21]. However, the structure of the sun-tracking solar arrays makes it hard to test them by these methods. Therefore, experimental research on the disturbance produced by the SADA is still in its infancy. Two main constraints limit the experimental research on the disturbance of solar arrays: (1) Solar arrays are characterized by low stiffness and low damping, which make it risky to operate them in a ground test; (2) Gravity and air resistance have a great influence on the ground disturbance test of the solar array, and the influence is hard to avoid. For the reasons above, there is a lack of experimental studies on the micro-vibration, which also leads to the difficulty in verifying the accuracy of the disturbance torque model of the sun-tracking solar array.
In summary, the sun-tracking solar array is one of the sources of disturbance on spacecrafts. However, there has not been a comprehensive disturbance torque model that takes both the friction and flexibility of the solar array into consideration. Moreover, due to the structural characteristics of the solar array, it is difficult to conduct ground tests to verify the accuracy of a model. Therefore, this paper studies the disturbance torque of the solar array from the modeling and experimental perspectives. Firstly, a model of the disturbance torque was proposed, which took the structural friction and the flexibility of the solar array into consideration. Then, to verify the model by ground experiment, a solar array simulator (SAS) with an adjustable moment of inertia and torsional mode frequency was designed to replace the solar array for the ground tests. At the same time, as the moment of inertia and the modal frequency of the SAS were changed, their influences on the disturbance moment were investigated. Finally, the effectiveness of the model was verified by comparing the simulation results with the experimental results.
2. Disturbance Torque Model of the Sun-Tracking Solar Array
2.1. Electromagnetic Torque Model of Stepping Motors
Stepper motors convert electrical pulse signals into rotor angular displacement. Due to the advantages of having a simple structure, high positioning accuracy, no accumulating error, and an easy-to-use open-loop control, it is widely used in SADA.
For a bi-phase hybrid step motor with a sine–cosine subdivision drive strategy, the winding currents of the two phases are respectively characterized by sine and cosine patterns. However, due to the limit of the current subdivision number, the reference currents approximate to sine or cosine with the step function form. Reference currents for the positive drive are [22]:
where and respectively signify the currents of phase-A and phase-B stator winding, I is the motor winding rated current, z is the rotor teeth number, is the angular displacement of the stepping motor rotor, is the step angle of the stepping motor, is the subdivision number.
The driving voltages are obtained by a winding current loop PID controller, based on errors between practical currents and reference currents. The current loop control equation is as follows:
where , , and are the proportional coefficient, integral coefficient, and differential coefficient, respectively.
The equilibrium equation of voltage describes the relationship between drive voltages and winding currents. Taking winding resistance, self-inductance effect, and cogging distribution into account, the voltage equilibrium equation for the hybrid stepper motor is as follows:
where R is the winding resistance, L is the winding self-inductance coefficient, is the motor output shaft speed, is the motor torque constant.
The motor torque of the hybrid step motor is [23]:
where is the motor electromagnetic torque, is the detent torque constant.
2.2. Friction Torque Model
Upon analyzing the SADA structure, the internal friction torque of the SADA is found to mainly consist of bearing friction, harmonic reducer friction, and conductive slip ring friction. Bearing friction is relatively small, so its influence is ignored in this paper.
Due to its structural characteristics, the harmonic reducer has nonlinear friction in the transmission process [24]. The static Stribeck model, which is suitable for simulating the influence of low-speed mechanical friction, can be used to describe the relationship between the nonlinear friction and angular velocity of the harmonic reducer, and the friction torque can be expressed as [25]:
where is the Coulomb friction moment, is the Stribeck friction moment, is the rotation angular velocity of the solar array along the drive axis direction, is the Stribeck velocity, is the Stribeck shape factor, and is the viscous friction factor. In this paper, the Tustin empirical model is used to describe the Stribeck phenomenon, so = 1.
The friction moment of the conductive slip ring is mainly caused by the friction pair between the ring and the brush, and its calculation formula is:
where is the number of contact pairs of the ring and brushes, p is the single point pressure, μ is friction coefficient, r is the radius of the conducting ring.
In conclusion, the internal friction torque of the SADA can be obtained as follows:
2.3. Dynamics Model of the Solar Array
As shown in Figure 1, the origin of the inertial frame is assigned to the center of the spacecraft-rocket separation interface, and the origin of the body-fixed frame of the sun-tracking solar array is assigned to the center of the installation interface. The fundamental frequency of the spacecraft body is much greater than that of the sun-tracking solar array, and the mass and moment of inertia of the spacecraft body are also generally one or more orders of magnitude greater than that of the sun-tracking solar array. Therefore, when the sun-tracking rotates at a low speed, the spacecraft body can be assumed as a rigid body with constrained translational and rotational displacements.
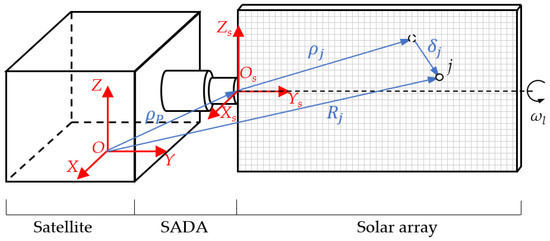
Figure 1.
Schematic diagram of the solar array drive system.
The solar array is discretized by the finite element method, and the position vector and the absolute velocity vector of the jth node can be expressed as follows:
where is the vector from the origin of the body-fixed frame to the origin of the inertial frame, and are the vector of the jth node in the body-fixed frame relative to the origin before deformation and the vector diameter generated by the flexible deformation of the solar array, is the rotating velocity matrix of the solar array.
In terms of the modal coordinates, can be written as follows:
where is the modal generalized coordinates matrix of the solar array, is the jth modal shape matrix of the solar array, is the modal truncation order.
It is known that
where and are the skew symmetric matrices of and , respectively.
Therefore, the absolute velocity vector of the jth node can also be expressed as:
The kinetic energy of the solar array can be expressed as:
where N is the number of the nodes in the solar array, is the mass of the jth node.
Substituting Equation (11) into Equation (12), the kinetic energy equation of the solar array can be obtained as follows:
where is the moment of inertia of the solar array before the deformation, is the modal angular momentum of the solar array, , , and .
The elastic potential energy and the energy loss of the solar array can be expressed as follows:
where , , , and are the ith natural frequency and modal damping of the solar array.
The Lagrange function was constructed from Equations (13) and (14), and the dynamics equation of the solar array was obtained by substituting the Lagrange equation:
where , is the driving torque of the solar array, is the angular displacement of the solar array, , .
The coefficients of the three items on the left of Equation (15) represent the generalized mass matrix, generalized damping matrix, and generalized stiffness matrix, respectively. The two items on the right are the generalized active torque vector and the structural coupling term, respectively. Since the velocity and elastic deformation in the solar array are first order small quantities, the structural coupling term in Equation (15) is a second-order small quantity and can be ignored. Therefore, the dynamics equation of the solar array can be simplified as follows:
2.4. Disturbance Torque Model
The SADA discussed in this study is composed of a two-phase hybrid stepper motor in series with a harmonic reducer. A sketch of the SADA structure is shown in Figure 2.
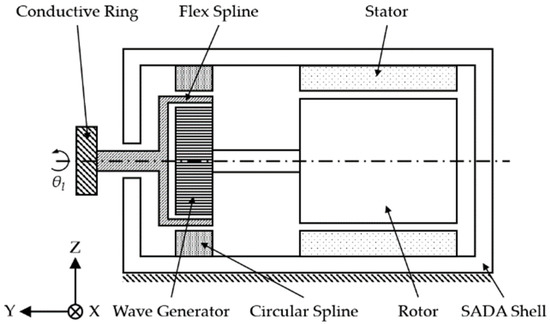
Figure 2.
Structure sketch of the SADA.
It is assumed that (1) the transmission efficiency of the harmonic reducer is 100%; (2) the stepper motor rotor, the wave generator, and the flexible spline of the harmonic reducer only have the rotational degree of freedom around the rotation axis.
Based on the above assumptions, the dynamics model of SADA is [26]:
where , , and are respectively the moment of inertia along the rotation axis of the flex wheel, stepper motor rotor, and wave generator along the rotation axis; is the rotational angular displacement of the solar array; and is the reduction ratio of the harmonic reducer.
The force analysis of each sub-structure in the SADA is carried out separately, as shown in Figure 3. The dynamic equations of the three subsystems of the rotor and wave generator assembly, the flexible wheel, and the SADA housing can be obtained according to the force analysis as follows:
where is the moment of inertia of the SADA shell; is the angular displacement of the SADA shell along the rotation axis, and its value is 0 because the SADA shell is fixed; is the value of the equivalent action moment between the wave generator and the flexible wheel; is the value of the equivalent action moment between the flexible wheel and the rigid wheel; is the restrain moment given to the SADA by the spacecraft.
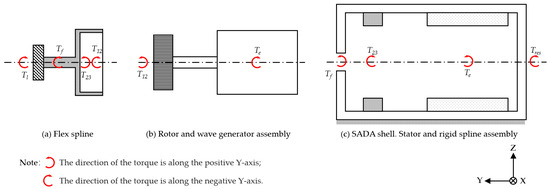
Figure 3.
Force analysis of components.
The relationships between and , , and are given by
It is obvious that the disturbance torque generated by the SADA on the spacecraft body is the counter-torque of the SADA’s restrain torque. Therefore, according to Equations (17) and (18), the disturbance torque can be obtained as follows:
3. Solar Array Simulator
The solar array is characterized by low stiffness and damping, so it would have been difficult to operate it during the ground test. Therefore, the typical multi-fold solar array was analyzed in this paper, and a SAS was designed according to its dynamic characteristics. The SAS can be used to replace the solar array for ground test research, and it can simulate the moment of inertia and the first-order torsional frequency of the solar array. Thus, it can mimic the influence of the solar array on the SADA to reflect the mutual coupling relationship between the solar array and the SADA.
3.1. The Dynamic Characteristics of the Solar Array
The concept of modal effective mass was first proposed by Bamford, Wada, and Garba [27]. It is a parameter describing the interaction between modes and an excitation. The larger the value is, the greater the contribution of the mode to the dynamic response is [28]. The modal superposition method is a common method of calculating the dynamic response of a system. In engineering, the cumulative effective modal mass fraction—the ratio of cumulative effective modal mass to structural physical mass—is often used to judge whether the number of analyzed modes is sufficient. And it is generally considered that a cumulative effective modal mass fraction greater than 90% meets the analysis requirements [29].
The satellite solar array shown in Figure 4 is taken as an example to analyze the dynamic characteristics of the multi-fold solar array with a SADA connecting rod. The solar array panels are sandwich plates that are composed of aluminum honeycomb core and a carbon fiber composite surface, and the SADA connecting rod is made of a high-strength aerospace aluminum square tube.
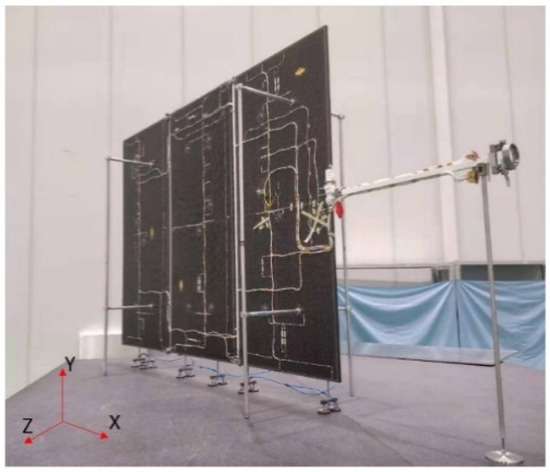
Figure 4.
Solar array of a satellite.
An accurate finite element model of the solar array was established; the model is mainly composed of panels, hinges, and a SADA connecting rod, as shown in Figure 5a. The panels were simulated by shell elements with the composite property. Spring elements and bar elements were respectively used to simulate the hinges and the connecting rod. And the constraint was applied to the end of the SADA connecting rod.
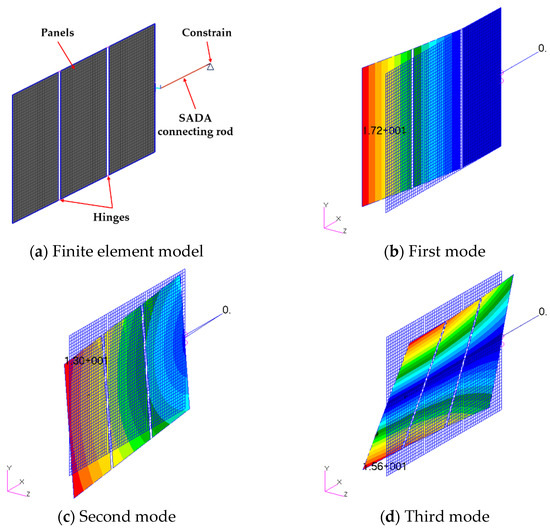
Figure 5.
Finite element model and the first three modes of the solar array.
Figure 5 also shows the first three modes of the solar array. The first mode of the solar array is the out-of-plane bending mode, the second mode is the in-plane bending mode, and the third mode is the torsional mode along the rotation axis.
Furthermore, the mass matrix, stiffness matrix, and mode information of the solar array were obtained from the accurate finite element model to calculate the modal effective mass fractions of the first ten modes. As shown in Table 1, the fractions were compared to determine the contribution proportion of every mode in the dynamic response caused by the SADA. According to the table, the sum of the effective mass of the first ten modes is about 7.69 kg·m2, which is approximately equal to the moment of inertia of the solar array along the X-axis, indirectly indicating the accuracy of the finite element model [30]. The modal effective mass fraction of the third mode is 96.7%, and the third mode is the torsional mode, as shown in Figure 5. The analysis above indicates that the dynamic response caused by the SADA is mainly the torsional oscillation of the solar array.

Table 1.
Modal effective mass and proportion of the solar array.
3.2. Structure of the SAS
Based on the dynamic characteristics of the multi-fold solar array with a connecting rod analyzed in Section 3.1, the SAS shown in Figure 6 is proposed. The SAS is composed of a central plate, a series of springs, an inertia frame, and four counterweights. After output by the SADA, the driving torque is transferred to the inertia frame through the central plate and a series of springs. When the spring extends and compresses in reaction to the SADA output torque, the inertia frame will rotate at the required frequency. Therefore, the torsional oscillation characteristics of the solar array can be simulated.
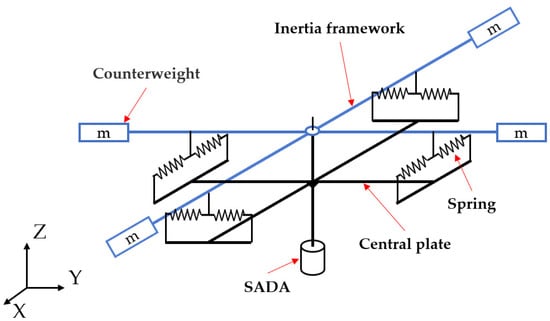
Figure 6.
A structure sketch of the SAS.
According to the dynamic characteristics analysis of the structure, the kinetic energy of the system is as follows:
where T is the kinetic energy of the system, JSAS is the moment of inertia of the SAS along the axis of the drive shaft, and is the angle displacement of inertia frame.
The potential energy of the system is:
where d is the initial deformation of the springs, k is the stiffness of the springs, and l is the distance of the spring from the center axis.
The Lagrange function was constructed from Equations (21) and (22), and substituted into the Lagrange equation to obtain the dynamics equation of the SAS:
Furthermore, the fundamental frequency of the system can be obtained, which is the first torsional mode frequency:
Figure 7 shows the SAS designed in detail according to the structure sketch in Figure 6. The system consists mainly of a central shaft, a central plate, an inertia frame, four counterweights, four counterweight seats, four spring adjusting sliders, four spring seats, and a SADA connector. The SADA connector is fixedly connected at one end of the central axis, and the central plate is fixed to the central axis by bolts. The inertia frame and the central axle are connected through the bearing in the center of the inertia frame so that the inertia frame can rotate freely along the central axle. The inertia frame is oscillated by the spring connection between the central plate and the inertia frame. Therefore, the driving torque output by the SADA is transmitted according to the path: the SADA interface–the central shaft–the central plate–the springs–the inertia frame. Finally, the inertia frame is driven to rotate.
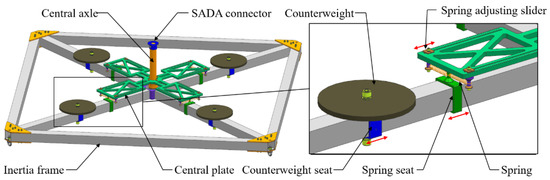
Figure 7.
A structure model of the SAS.
There are adjustment mechanisms in the SAS to simulate different types of solar arrays. The counterweight seats and the spring-fixed seats can slide along the inner inertia frame, and the spring-adjusting seats can slide along the sliding column on the central plate. According to Equation (24), the torsional mode frequency of the SAS can be adjusted by changing the distance l of the spring from the central axis, spring stiffness k, and moment of inertia JSAS. The distance l can be adjusted by moving the spring-fixed seats and the spring-adjusting seats, so the torsional mode frequency of the structure changes accordingly. The spring stiffness k can be adjusted by replacing the springs with different levels of stiffness. The moment of inertia JSAS of the system can be adjusted by replacing the counterweights with different weights or by changing the distance of the counterweights from the center axis by moving the counterweight seats.
4. Validation of the Proposed Disturbance Torque Model
4.1. Experimental Results
The Kistler 6-component piezoelectric sensors have been widely used in testing aerospace micro-vibration [3,31,32]. In the research, the disturbance force/torque of the sun-tracking solar array is measured by a micro-vibration test platform based on the Kistler 6-component piezoelectric sensors (HR-FP3406, Kistler, Winterthur, Zurich, Switzerland), as shown in Figure 8.
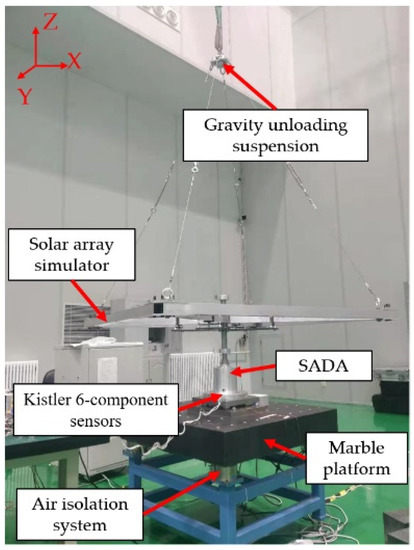
Figure 8.
Disturbance force/torque test.
A micro-disturbance force/torque measurement platform was built, which was composed of a Kistler 6-component piezoelectric sensor, a marble countertop, and an air isolation system. During the tests, the SAS was suspended by a rope to simulate the zero-gravity environment on orbit. The SADA was attached to the Kistler 6-component piezoelectric sensor fixed on the marble countertop, and the air isolation system was installed below the marble countertop to avoid external vibration during the test. The sampling frequency of the system was 4096 Hz, and the sampling time was 16 s.
The internal driving source of the SADA studied in this work was a two-phase stepping motor. The beat number of the motor b was 4, the tooth number z was 50, and a 16-subdivision drive was adopted. The speed was 6°/s. Therefore:
where is the motor driving frequency.
To investigate the coupling relationship between the SADA and the different types of solar arrays, the disturbance force/torque generated by the SADA-driven SAS in different states were measured. Table 2 shows the five test states of the SAS. Among them, states 1–3 have the same moment of inertia and different modal frequencies. States 1, 4, and 5 have the same modal frequency and different moments of inertia.
Table 2.
List of modal frequencies and rotational inertias from the test in different states.
Figure 9 shows the time-domain curve obtained by the state 1 test. As shown in Figure 9a, the amplitudes of the disturbance forces of the X, Y, and Z directions are of small magnitude, no greater than 0.725 N. According to engineering experience, the disturbance forces of this magnitude have little impact on spacecraft such as satellites [33]. As shown in Figure 9b, the amplitude of the disturbance torque in the Z direction is much bigger than that in the other two directions, and their peaks can reach 1.643 N·m, while the amplitudes of the disturbance torque in the X and Y directions are one magnitude smaller than that in the Z direction, and the peak value of both is not greater than 0.166 N·m. Therefore, it can be considered that the main form of disturbance generated by the SADA-driven SAS is the disturbance torque along the rotation axis.
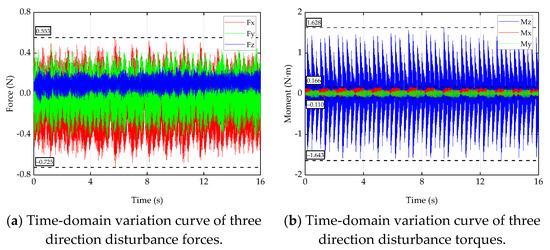
Figure 9.
The time-domain curves of disturbed forces/torques.
The time-domain signal of the disturbance torque along the z-direction during the stable operation of the SADA was intercepted, which was processed by fast Fourier transform and characterized in the frequency domain. Since the spacecraft is mainly susceptible to the disturbance in the middle and low frequency bands [7], the frequency band 0–200 Hz was analyzed, as shown in Figure 10.
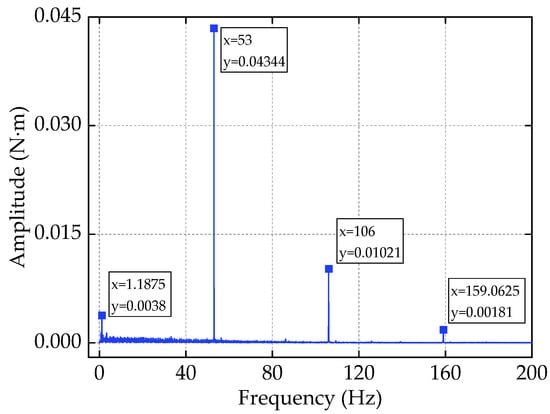
Figure 10.
The frequency-domain curve of the disturbed torque.
As shown in Figure 10, within the frequency range of 0–200 Hz, there are four peaks of the disturbance torque: 1.1875 Hz, 53 Hz, 106 Hz, and 159.0625 Hz. By classifying the four peaks, the frequency components of the disturbance torque can then be divided into two categories: (1) The first-order torsional natural frequency of the solar array, which is 1.1875 Hz; (2) The motor-driving frequency and its high-order harmonics (53 Hz, 106 Hz, and 159 Hz, etc.). There are errors between the peak frequencies and the theoretical frequencies of 1.19 Hz and 53.33 Hz, which were caused by the frequency adjustment error of the SAS and the test system error.
The focus here is on the frequency analysis of the disturbance torque to get the peaks and the amplitudes; therefore, the frequency domain curves of the test and simulation results are analyzed in the following study. Figure 11 shows a spectrum curve comparison of the disturbance torques corresponding to states 1–3. The figure shows that the increase of the fundamental frequency of the SAS does not change the frequency composition of the disturbance torque when the moment of inertia is constant. Meanwhile, the disturbance torque amplitudes at the fundamental frequency increase with the increase of the fundamental frequency. The reason for this is that the fundamental frequency of the load is closer to the driving frequency of the motor, so it has a stronger coupling relationship with the SADA.
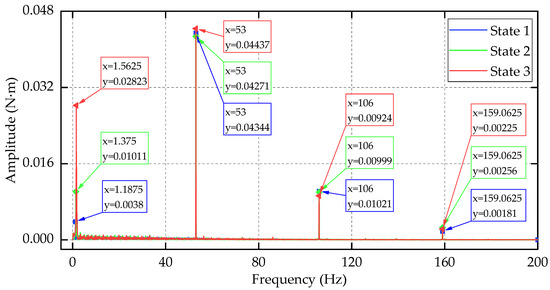
Figure 11.
The frequency-domain curve of the disturbance torque in tests 1–3.
Figure 11 shows that the range of the amplitudes at the driving frequency and its harmonics is no greater than 0.00166 N·m, which indicates that the change of fundamental frequency has little effect on the driving frequency and its harmonic disturbance torque component when the moment of inertia of the load remains unchanged.
Figure 12 shows the spectrum curve comparison of the disturbance torques corresponding to tests 1, 4, and 5. As shown in the figure, when the fundamental frequency of the load is constant, the amplitude of each frequency component increases with the increase of the moment of inertia of the solar array. The reason for this is that the increase of load inertia leads to the increase of the driving torque, the fluctuation of the driving torque increases correspondingly, and the load vibration increases.
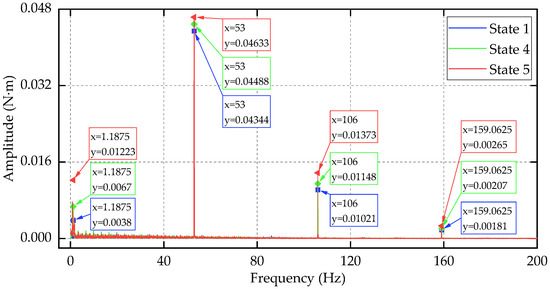
Figure 12.
The frequency-domain curve of disturbance torque in tests 1, 4, and 5.
4.2. Simulation Results
According to the disturbance torque model established in Section 2, the rotation process of the SADA-driven solar array is simulated by using the Simulink toolbox in the commercial software Matlab (MathWorks, Natick, MA, USA). The schematic diagram of the simulation model is shown in Figure 13.
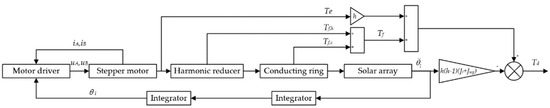
Figure 13.
Schematic diagram of the disturbance torque simulation.
The disturbance torque generated by the SADA-driven SAS of state 1 is simulated. The input parameters are mainly composed of two parts: (a) The SADA and its control system parameters; (b) parameters of the SAS. Table 3 shows the parameters of the SADA and its control system, which are provided by the manufacturer after test or calculation.
Table 3.
Parameters of the SADA.
Parameters of the SAS are stiffness matrix, mass matrix, and damping information. These parameters are extracted from the accurate finite element model of the SAS, as shown in Figure 14a.
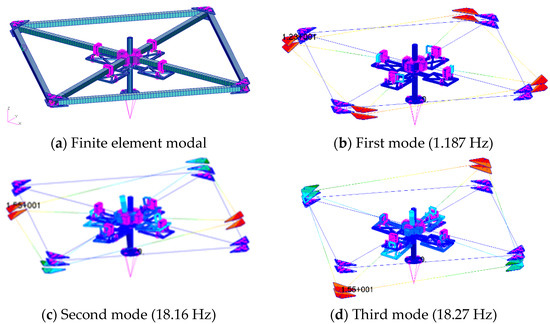
Figure 14.
Finite element model and the first three modes of the SAS.
Figure 14b–d show the first three modes of the SAS; the moment of inertia of the finite element model along the rotation axis was 8.46 kg·m2. On the other hand, the natural frequency and moment of inertia of the SAS were measured, as shown in Figure 15.
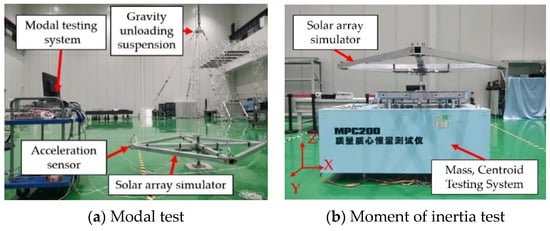
Figure 15.
Modal test and moment of inertia test of the SAS.
The tested moment of inertia of the SAS about the rotation axis, which is 8.19 kg·m2, was taken as reference; the error of the moment of inertia calculated by the finite element model was 0.27 kg·m2, and the relative error was only 3.3%. Table 4 shows the frequencies of the first three modes obtained by finite element method and test. The table shows that the frequency error is no more than 3.15%, which indicates that the finite element model is an accurate model of the SAS under test state 1.
Table 4.
Comparison of modal frequency.
Figure 16 shows the frequency domain curve comparison between the simulation results and the test results. Table 5 shows the frequency values of the peaks of the simulation results and the test results. The frequency error between the simulation results and the test results is no more than 0.684%. Table 6 shows the amplitudes of simulation results and test results at each peak; the relative errors of the amplitude of the disturbance torque between simulation results and test results at each frequency component are not greater than 22.33%. The results above indicate that the model established in this paper can accurately simulate the disturbance torque generated by the SADA-driven solar array.
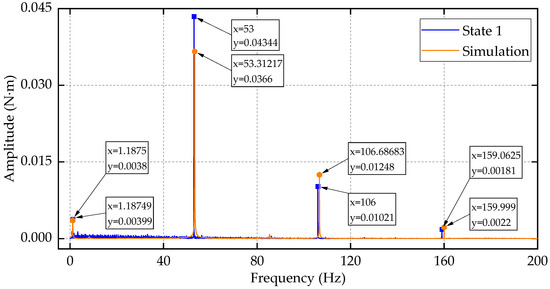
Figure 16.
Simulation and test results of the disturbance torque.
Table 5.
Comparison of simulation/test frequencies.
Table 6.
Comparison of simulation/test amplitudes.
5. Conclusions
The purpose of this article was to investigate the disturbance behavior of the sun-tracking solar arrays. Firstly, a disturbance torque model, which took the friction torque and the flexibility of the solar array into consideration, was proposed. Secondly, the dynamic characteristic of a multi-fold solar array was analyzed, with the analysis results revealing that the torsional mode contributed most of the dynamic response inspired by the SADA. Based on the finding, a SAS was designed to simulate the torsional mode dynamic behavior of the solar array. Then, the disturbance torque generated by the SADA-driven SAS was tested by the micro-disturbance force/torque measurement platform, which was built based on a Kistler 6-component piezoelectric sensor. According to the results, the disturbance of the SADA-driven SAS has the following characteristics: (1) The frequency components of the disturbance torque consist of two parts: (a) the first torsional natural frequency of the SAS; (b) the motor-driving frequency and its harmonics. (2) When the moment of inertia is constant, the disturbance torque amplitude at the torsional mode frequency increases with the increase of the mode frequency. (3) When the torsional mode frequency of the SAS is constant, the amplitude of each frequency component of the disturbance torque increases with the increase of the moment of inertia of the solar array. Finally, the proposed disturbance torque model was validated by comparing the simulation and test results, which illustrated that the predicted frequency error of the model is less than 0.648%, and the amplitude error of the corresponding frequency is less than 22.33%. Therefore, the model can effectively predict the disturbance torque produced by the sun-tracking solar array.
The disturbance torque model established in this paper can be used to predict the disturbance torque at the design stage of sun-tracking solar arrays. The SAS proposed in this paper makes the ground experiments on the solar array feasible, which serves as a reference for other research.
Author Contributions
Conceptualization, J.Y. and Y.G.; data curation, J.Y. and C.Z.; formal analysis, J.Y.; funding acquisition, L.Z.; investigation, J.Y.; methodology, J.Y. and D.Z.; project administration, L.Z.; resources, D.Z. and S.C.; software, J.Y.; validation, J.Y.; visualization, L.Z.; writing—original draft, J.Y.; writing—review and editing, Y.G. and S.C. All authors have read and agreed to the published version of the manuscript.
Funding
This research was funded by National Key Research and Development Plan of China, Grant No.2016YFB0500904.
Institutional Review Board Statement
Not applicable.
Informed Consent Statement
Not applicable.
Data Availability Statement
Not applicable.
Conflicts of Interest
The authors declare no conflict of interest.
References
- Aglietti, G.; Langley, R.S.; Rogers, E.; Gabriel, S. Model Building and Verification for Active Control of Microvibrations with Probabilistic Assessment of the Effects of Uncertainties. Proc. Inst. Mech. Eng. Part C J. Mech. Eng. Sci. 2004, 218, 389–399. [Google Scholar] [CrossRef]
- Zhang, Z.; Aglietti, G.S.; Ren, W. Coupled microvibration analysis of a reaction wheel assembly including gyroscopic effects in its accelerance. J. Sound Vib. 2013, 332, 5748–5765. [Google Scholar] [CrossRef]
- Li, L.; Tan, L.; Kong, L.; Wang, D.; Yang, H. The influence of flywheel micro vibration on space camera and vibration suppression. Mech. Syst. Signal Process. 2018, 100, 360–370. [Google Scholar] [CrossRef]
- Luo, Q.; Li, D.; Jiang, J. Coupled dynamic analysis of a single gimbal control moment gyro cluster integrated with an isolation system. J. Sound Vib. 2014, 333, 345–363. [Google Scholar] [CrossRef]
- Zhang, Y.; Zang, Y.; Li, M.; Wang, Y.; Li, W. Active-passive integrated vibration control for control moment gyros and its application to satellites. J. Sound Vib. 2017, 394, 1–14. [Google Scholar] [CrossRef]
- Chen, S.; Xuan, M.; Xin, J.; Liu, Y.; Gu, S.; Li, J.; Zhang, L. Design and experiment of dual micro-vibration isolation system for optical satellite flywheel. Int. J. Mech. Sci. 2020, 179, 105592. [Google Scholar] [CrossRef]
- Chen, S.; Xuan, M.; Zhang, L.; Gu, S.; Gong, X.-X.; Sun, H.-Y. Simulating and Testing Microvibrations on an Optical Satellite Using Acceleration Sensor-Based Jitter Measurements. Sensors 2019, 19, 1797. [Google Scholar] [CrossRef]
- Alkomy, H.; Shan, J. Modeling and validation of reaction wheel micro-vibrations considering imbalances and bearing disturbances. J. Sound Vib. 2020, 492, 115766. [Google Scholar] [CrossRef]
- Sattar, M.; Wei, C. Analysis of Coupled Torsional Disturbance Behavior of Micro-stepped Solar Array Drives. J. Sound Vib. 2018, 442, 572–597. [Google Scholar] [CrossRef]
- Wang, H.-j.; Wang, W.; Wang, X.; Zou, G.-y.; Fan, X.-w. Space Camera Image Degradation Induced by Satellite Micro-vibration. Acta Photon. Sin. 2013, 42, 1212–1217. [Google Scholar] [CrossRef]
- Woodard, S. Upper Atmosphere Research Satellite In-Flight Dynamics Study: Lessons Learned. J. Spacecraft Rockets 2000, 37, 794–800. [Google Scholar] [CrossRef]
- Farley, R.; Ngo, S. Development of the solar array deployment and drive system for the XTE spacecraft. In Proceedings of the 29th Aerospace Mechanisms Symposium, Houston, TX, USA, 17–19 May 1995; pp. 268–282. [Google Scholar]
- Elsodany, N.; Rezeka, S.; Maharem, N. Adaptive PID control of a stepper motor driving a flexible rotor. World Pumps 2011, 50, 127–136. [Google Scholar] [CrossRef]
- Xia, L. The Primary Research on Low-frequence Resonate of Step-motor and it’s Damping Methods. J. Shenyang Polytech. Univ. 1994, 3, 73–78. [Google Scholar]
- Bodson, M.; Sato, J.; Silver, S. Spontaneous speed reversals in stepper motors. IEEE Trans. Control Syst. Technol. 2006, 4, 369–373. [Google Scholar] [CrossRef]
- Yang, Y.; Cheng, W.; Wu, S.; Wang, G. Experiment and Simulation of Electromagnetic Stiffness for Stepper Motor. Appl. Mech. Mater. 2010, 29–32, 1567–1573. [Google Scholar] [CrossRef]
- Si, Z.; Liu, Y.; Li, K. Research on modeling and driver design of solar array drive assembly. Aerosp. Control Appl. 2010, 36, 13–19. [Google Scholar]
- Gasbarri, P.; Monti, R.; Angelis, C.; Sabatini, M. Effects of uncertainties and flexible dynamic contributions on the control of a spacecraft full-coupled model. Acta Astronaut. 2012, 94, 515–526. [Google Scholar] [CrossRef]
- Wang, X.; Xu, Z.; Xia, M.; He, S.; Li, H.; Wu, Q. Research on a six-degree-of-freedom disturbance force and moment simulator for space micro-vibration experiments. J. Sound Vib. 2018, 432, 530–548. [Google Scholar] [CrossRef]
- Zhang, J.; Guo, Z.; Zhang, Y.; Tang, L.; Guan, X. Inner structural vibration isolation method for a single control moment gyroscope. J. Sound Vib. 2016, 361, 78–98. [Google Scholar] [CrossRef]
- Sun, X.; Yang, B.; Zhao, L.; Sun, X. Optimal design and experimental analyses of a new micro-vibration control payload-platform. J. Sound Vib. 2016, 374, 43–60. [Google Scholar] [CrossRef]
- Zhu, S.; Lei, Y.; Wu, X.-f.; Zhang, D.-P. Effect of drive mechanisms on dynamic characteristics of spacecraft tracking-drive flexible systems. J. Sound Vib. 2015, 343, 194–215. [Google Scholar] [CrossRef]
- Kapun, A.; Hace, A. Identification of Stepping Motor Parameters. In Proceedings of the EUROCON 2007—The International Conference on Computer as a Tool, Warsaw, Poland, 9–12 September 2007. [Google Scholar] [CrossRef]
- B’Elanger, P.; Taghirad, H. An Experimental Study on Modelling and Identification of Harmonic Drive Systems. In Proceedings of the Proceedings of 35th IEEE Conference on Decision and Control, Kobe, Japan, 13 December 1996. [Google Scholar]
- Jamaludin, Z.; Brussel, H.; Swevers, J. Friction Compensation of an XY Feed Table Using Friction-Model-Based Feedforward and an Inverse-Model-Based Disturbance Observer. IEEE Trans. Ind. Electron. 2009, 56, 3848–3853. [Google Scholar] [CrossRef]
- Acarnley, P. Stepping Motors: A Guide to Theory and Practice, 4th ed.; IET: London, UK, 2002; pp. 85–86. [Google Scholar]
- Girard, A. Modal effective mass models in structural dynamics. In Proceedings of the 9th Conference International Modal Analysis Conference (IMAC), Florence, Italy, 15–18 April 1991; pp. 45–50. [Google Scholar]
- Füllekrug, U.; Sinapius, J.M. Identification of Modal Parameters, Generalized and Effective Masses During Base-Driven Tests. Aerosp. Sci. Technol. 1998, 7, 469–480. [Google Scholar] [CrossRef]
- Irvine, T. Effective Modal Mass and Modal Participation Factors. Available online: http://www.vibrationdata.com/tutorials2/ModalMass.pdf (accessed on 25 September 2021).
- Wijker, J. Modal Effective Mass. In Spacecraft Structures; Springer: Berlin, Germany, 2008; pp. 247–264. [Google Scholar]
- Masterson, R.A.; Miller, D.W.; Grogan, R.L. Development and validation of reaction wheel disturbance models: Empirical model. J. Sound Vib. 2002, 249, 575–598. [Google Scholar] [CrossRef]
- Cheng, T.-S.; Chao, Y.C.; Wu, C.Y.; Li, Y.-H.; Nakamura, Y.; Lee, K.Y.; Yuan, T.; Leu, T.-S. Experimental and numerical investigation of microscale hydrogen diffusion flames. Proc. Combust. Inst. 2005, 30, 2489–2497. [Google Scholar] [CrossRef]
- Yu, Y.; Gong, X.; Zhang, L.; Jia, H.; Xuan, M. Full-Closed-Loop Time-Domain Integrated Modeling Method of Optical Satellite Flywheel Micro-Vibration. Appl. Sci. 2021, 11, 1328. [Google Scholar] [CrossRef]


Publisher’s Note: MDPI stays neutral with regard to jurisdictional claims in published maps and institutional affiliations. |
© 2021 by the authors. Licensee MDPI, Basel, Switzerland. This article is an open access article distributed under the terms and conditions of the Creative Commons Attribution (CC BY) license (https://creativecommons.org/licenses/by/4.0/).