4.1. Experimental Results
The Kistler 6-component piezoelectric sensors have been widely used in testing aerospace micro-vibration [
3,
31,
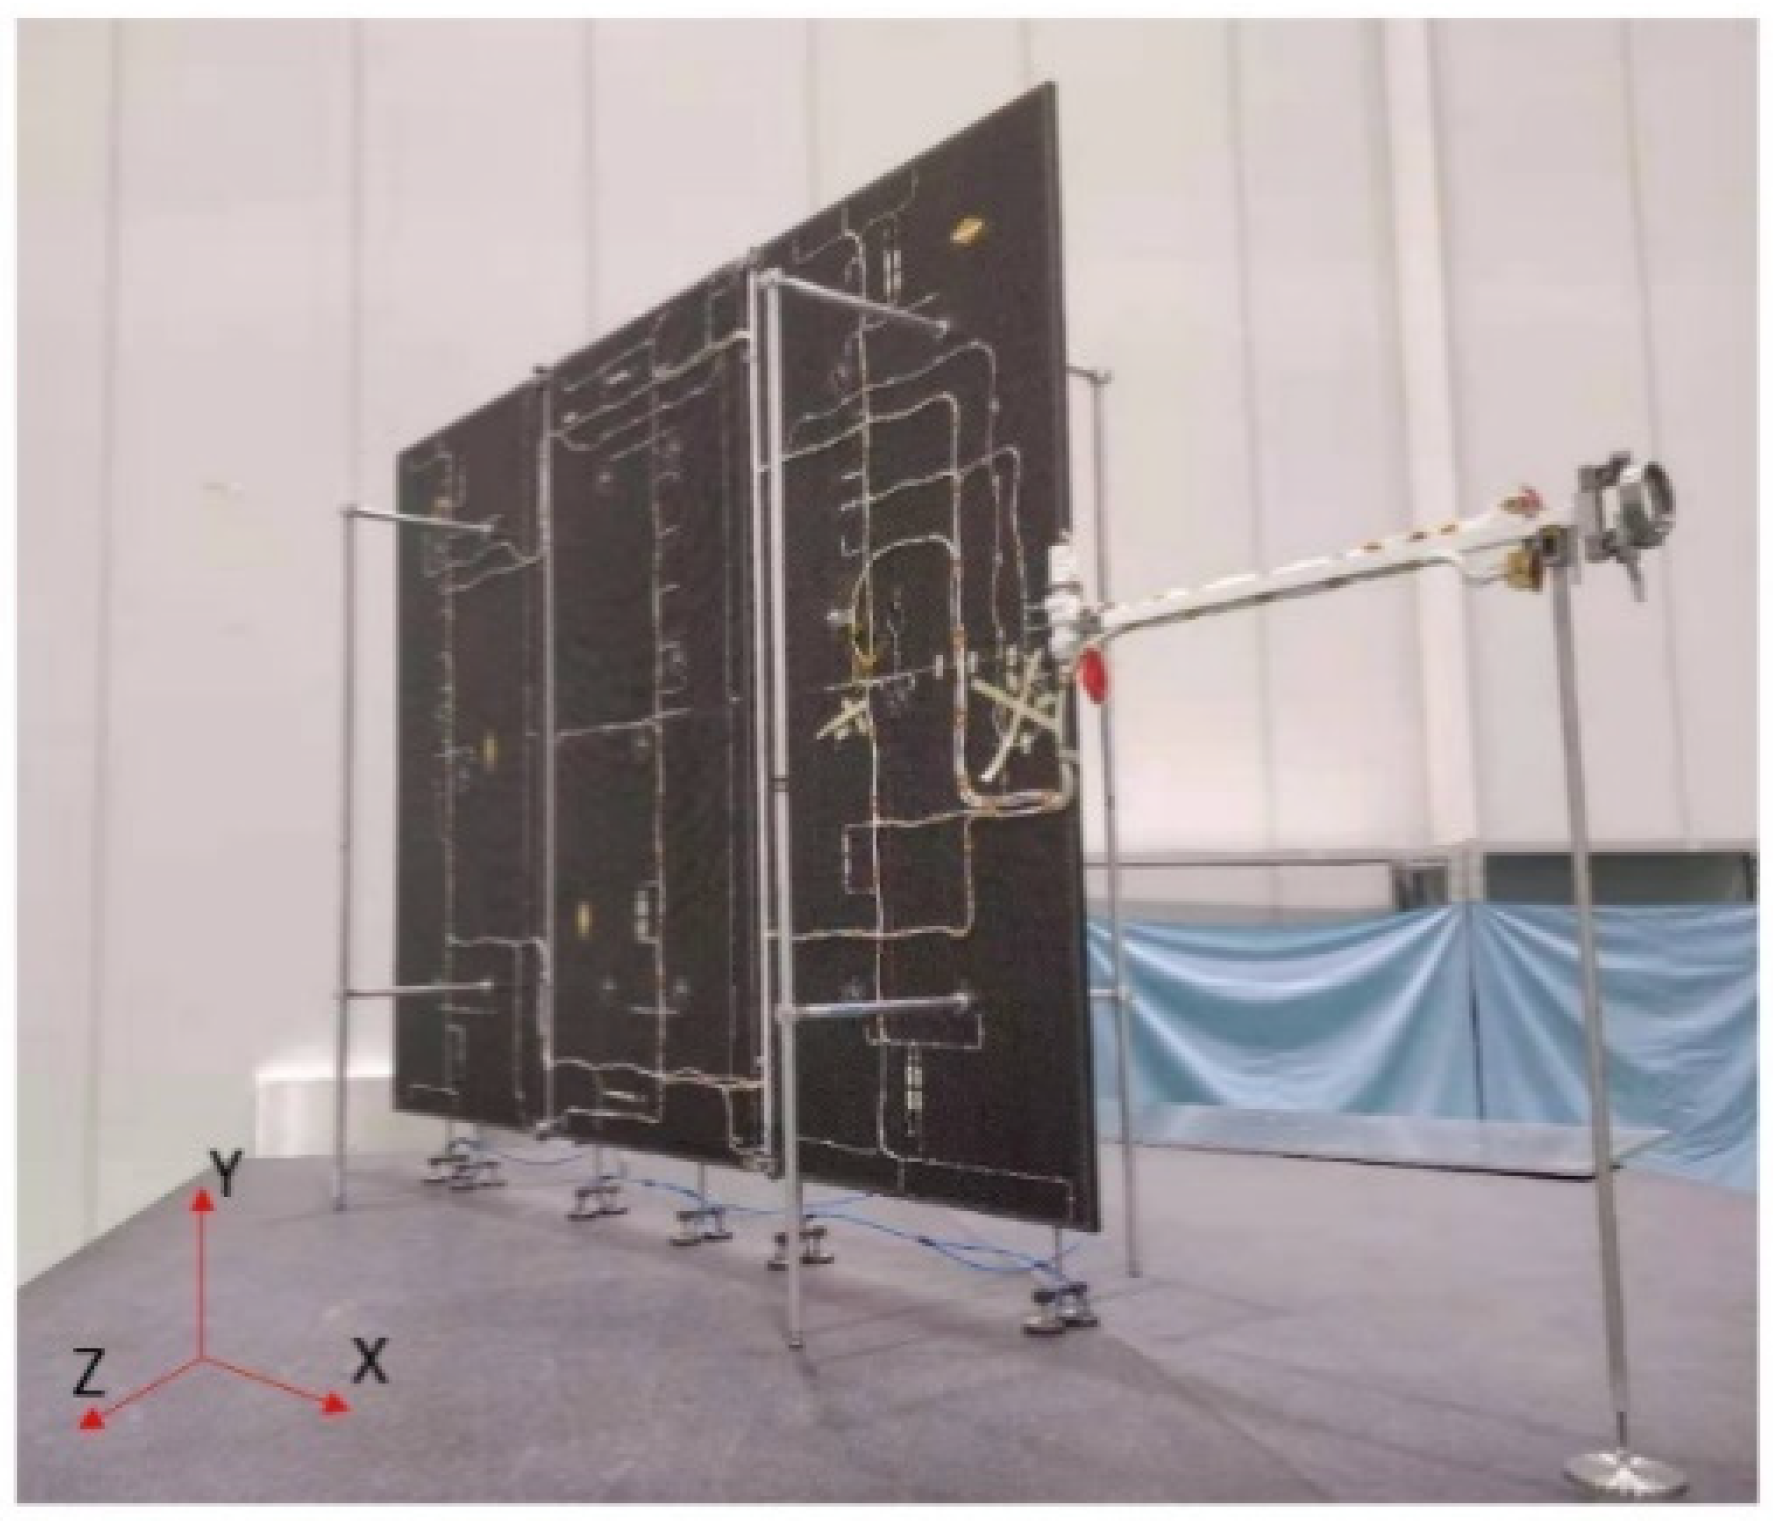
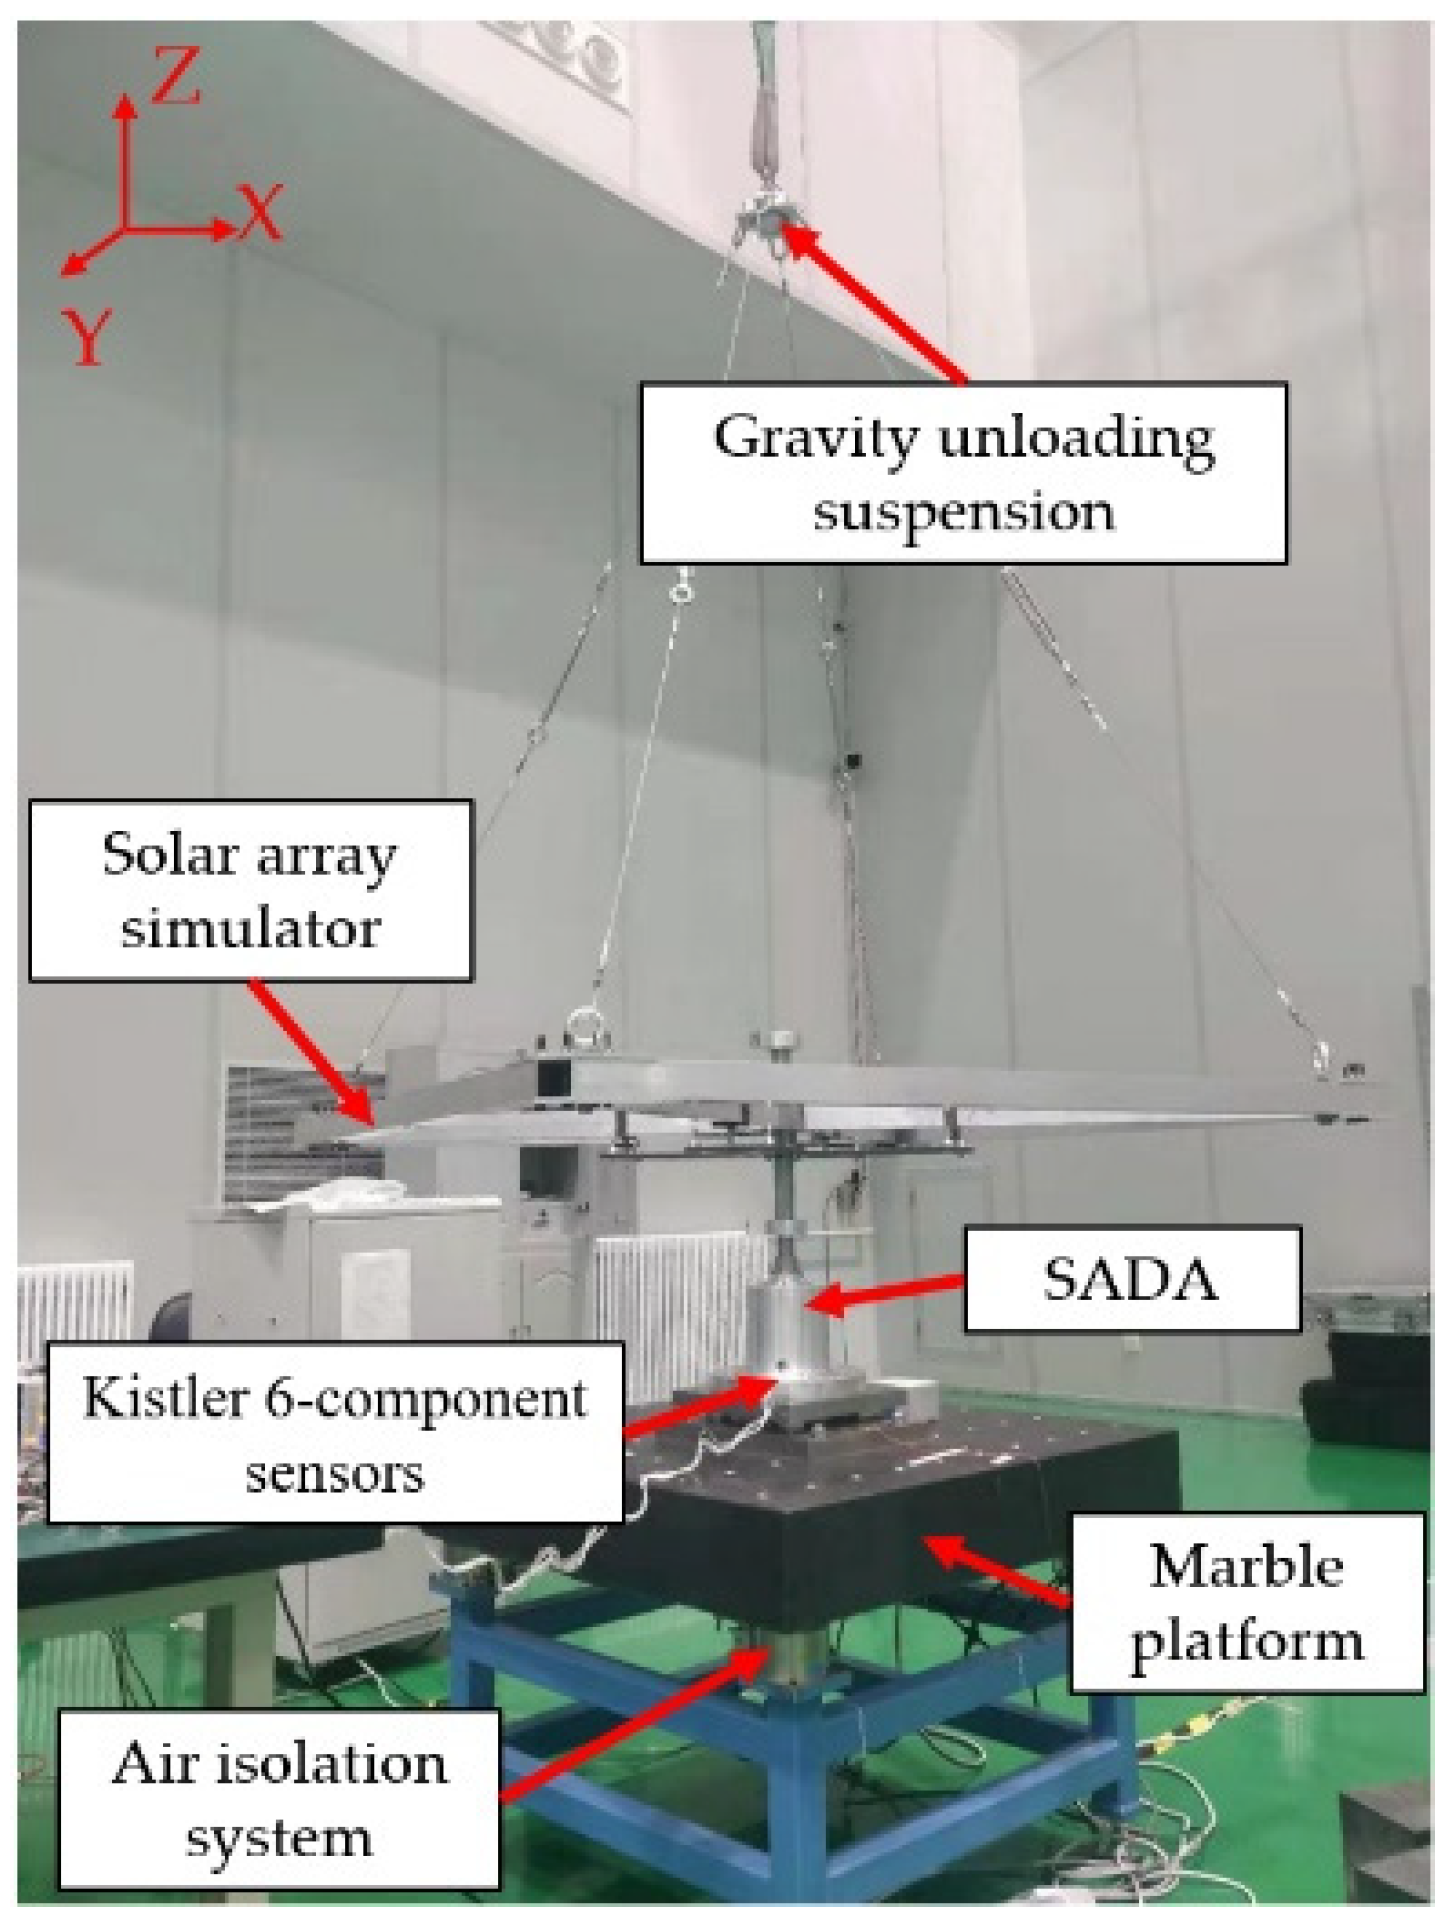
32]. In the research, the disturbance force/torque of the sun-tracking solar array is measured by a micro-vibration test platform based on the Kistler 6-component piezoelectric sensors (HR-FP3406, Kistler, Winterthur, Zurich, Switzerland), as shown in
Figure 8.
A micro-disturbance force/torque measurement platform was built, which was composed of a Kistler 6-component piezoelectric sensor, a marble countertop, and an air isolation system. During the tests, the SAS was suspended by a rope to simulate the zero-gravity environment on orbit. The SADA was attached to the Kistler 6-component piezoelectric sensor fixed on the marble countertop, and the air isolation system was installed below the marble countertop to avoid external vibration during the test. The sampling frequency of the system was 4096 Hz, and the sampling time was 16 s.
The internal driving source of the SADA studied in this work was a two-phase stepping motor. The beat number of the motor b was 4, the tooth number z was 50, and a 16-subdivision drive was adopted. The speed was 6°/s. Therefore:
where
is the motor driving frequency.
To investigate the coupling relationship between the SADA and the different types of solar arrays, the disturbance force/torque generated by the SADA-driven SAS in different states were measured.
Table 2 shows the five test states of the SAS. Among them, states 1–3 have the same moment of inertia and different modal frequencies. States 1, 4, and 5 have the same modal frequency and different moments of inertia.
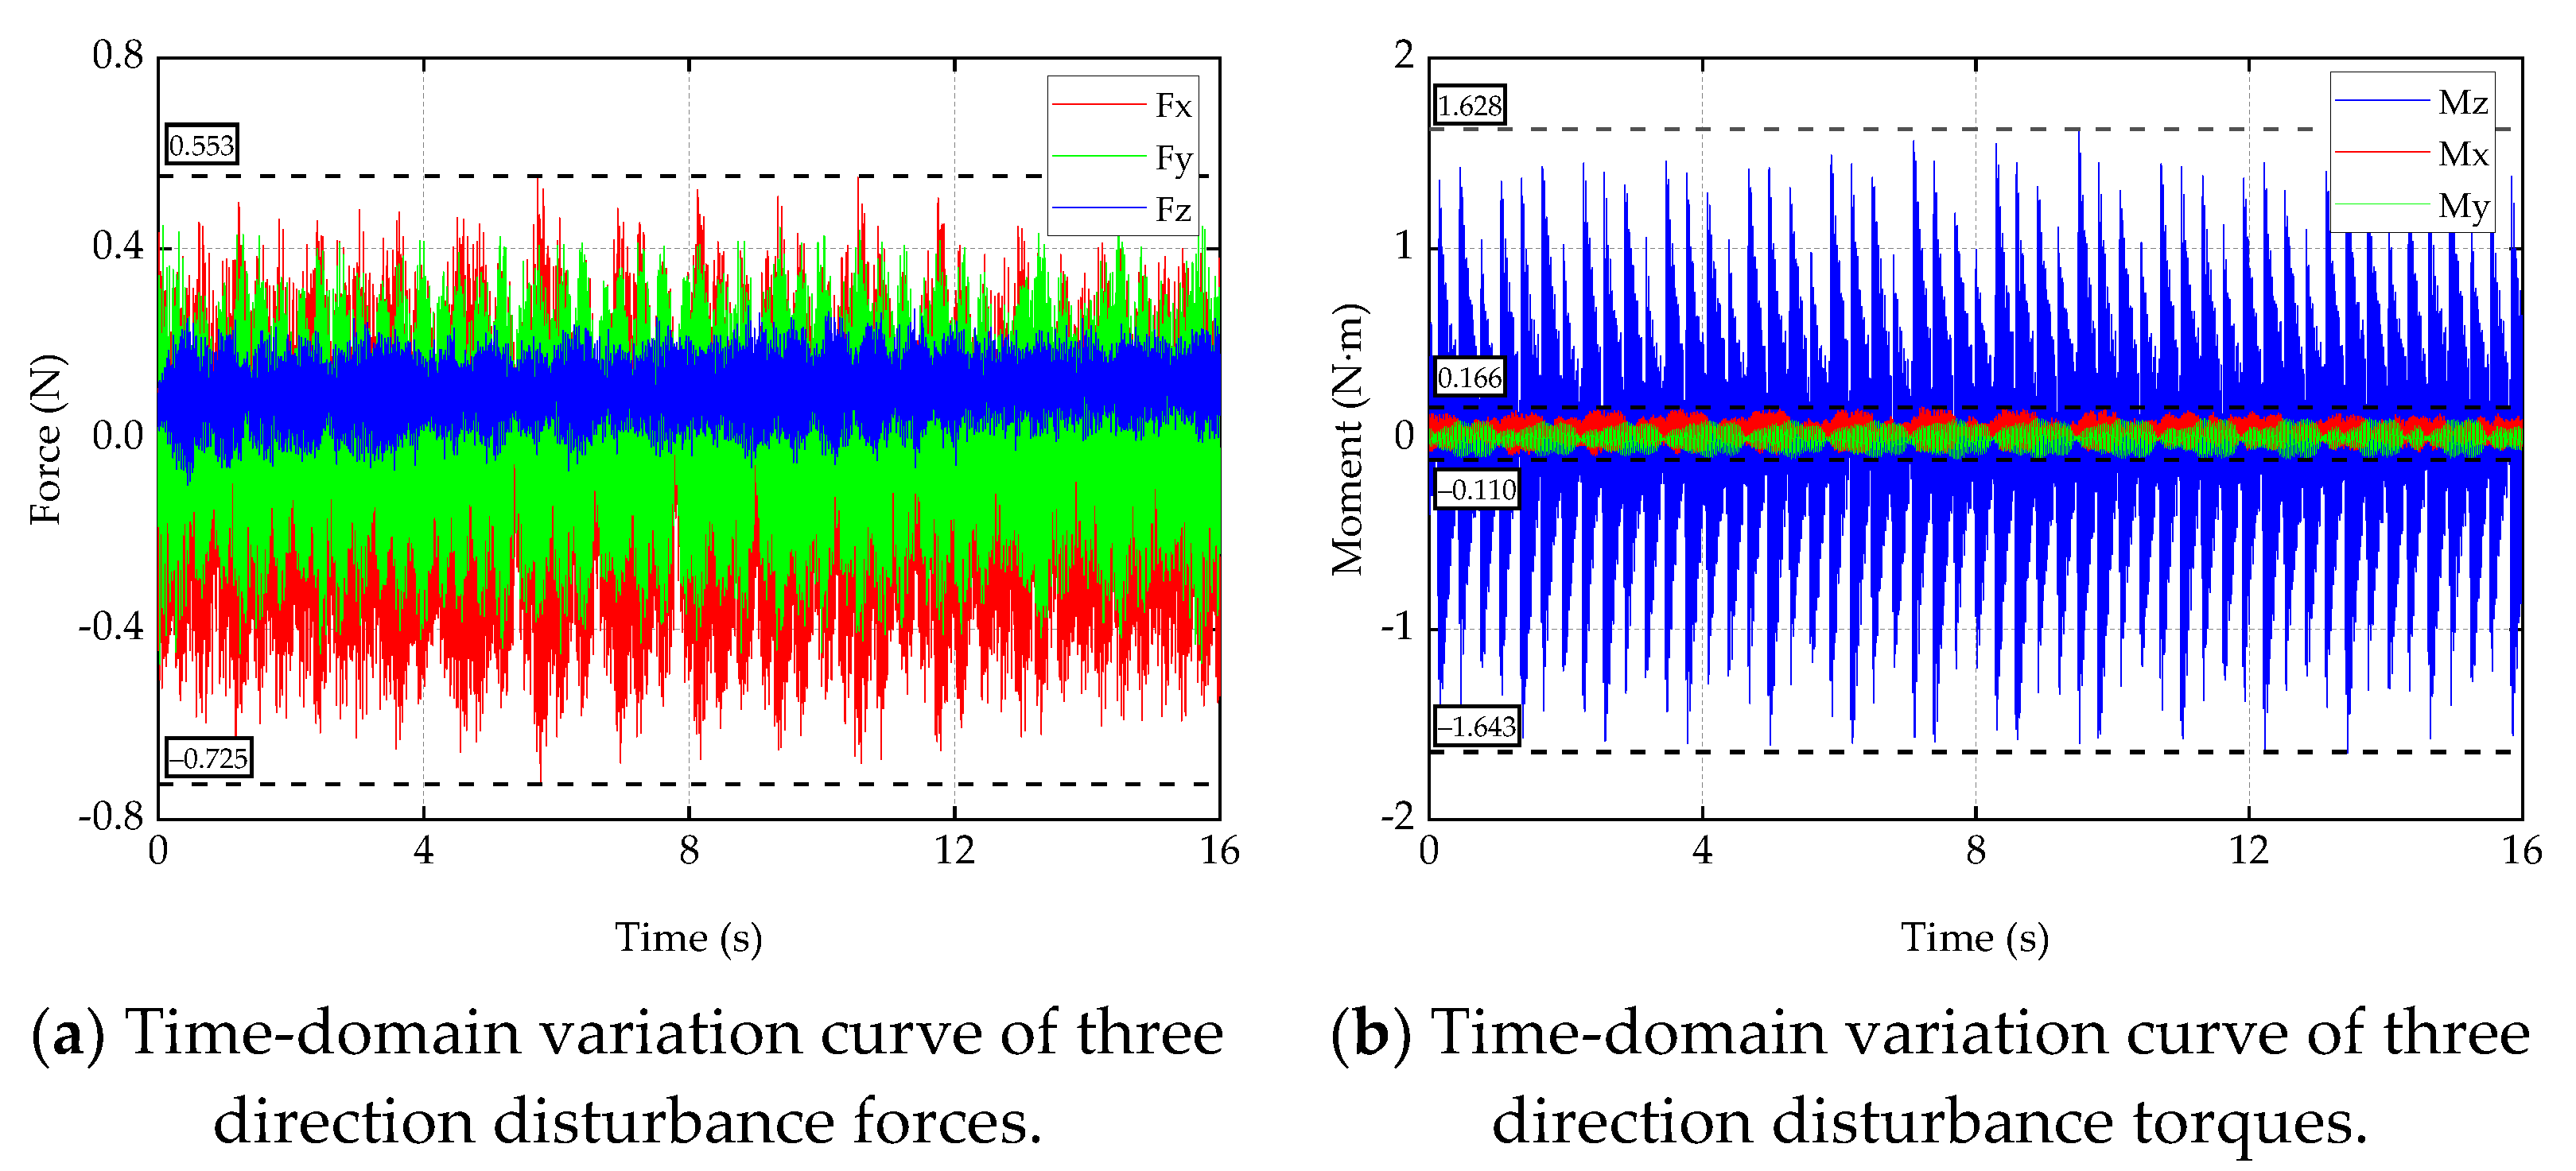
Figure 9 shows the time-domain curve obtained by the state 1 test. As shown in
Figure 9a, the amplitudes of the disturbance forces of the X, Y, and Z directions are of small magnitude, no greater than 0.725 N. According to engineering experience, the disturbance forces of this magnitude have little impact on spacecraft such as satellites [
33]. As shown in
Figure 9b, the amplitude of the disturbance torque in the Z direction is much bigger than that in the other two directions, and their peaks can reach 1.643 N·m, while the amplitudes of the disturbance torque in the X and Y directions are one magnitude smaller than that in the Z direction, and the peak value of both is not greater than 0.166 N·m. Therefore, it can be considered that the main form of disturbance generated by the SADA-driven SAS is the disturbance torque along the rotation axis.
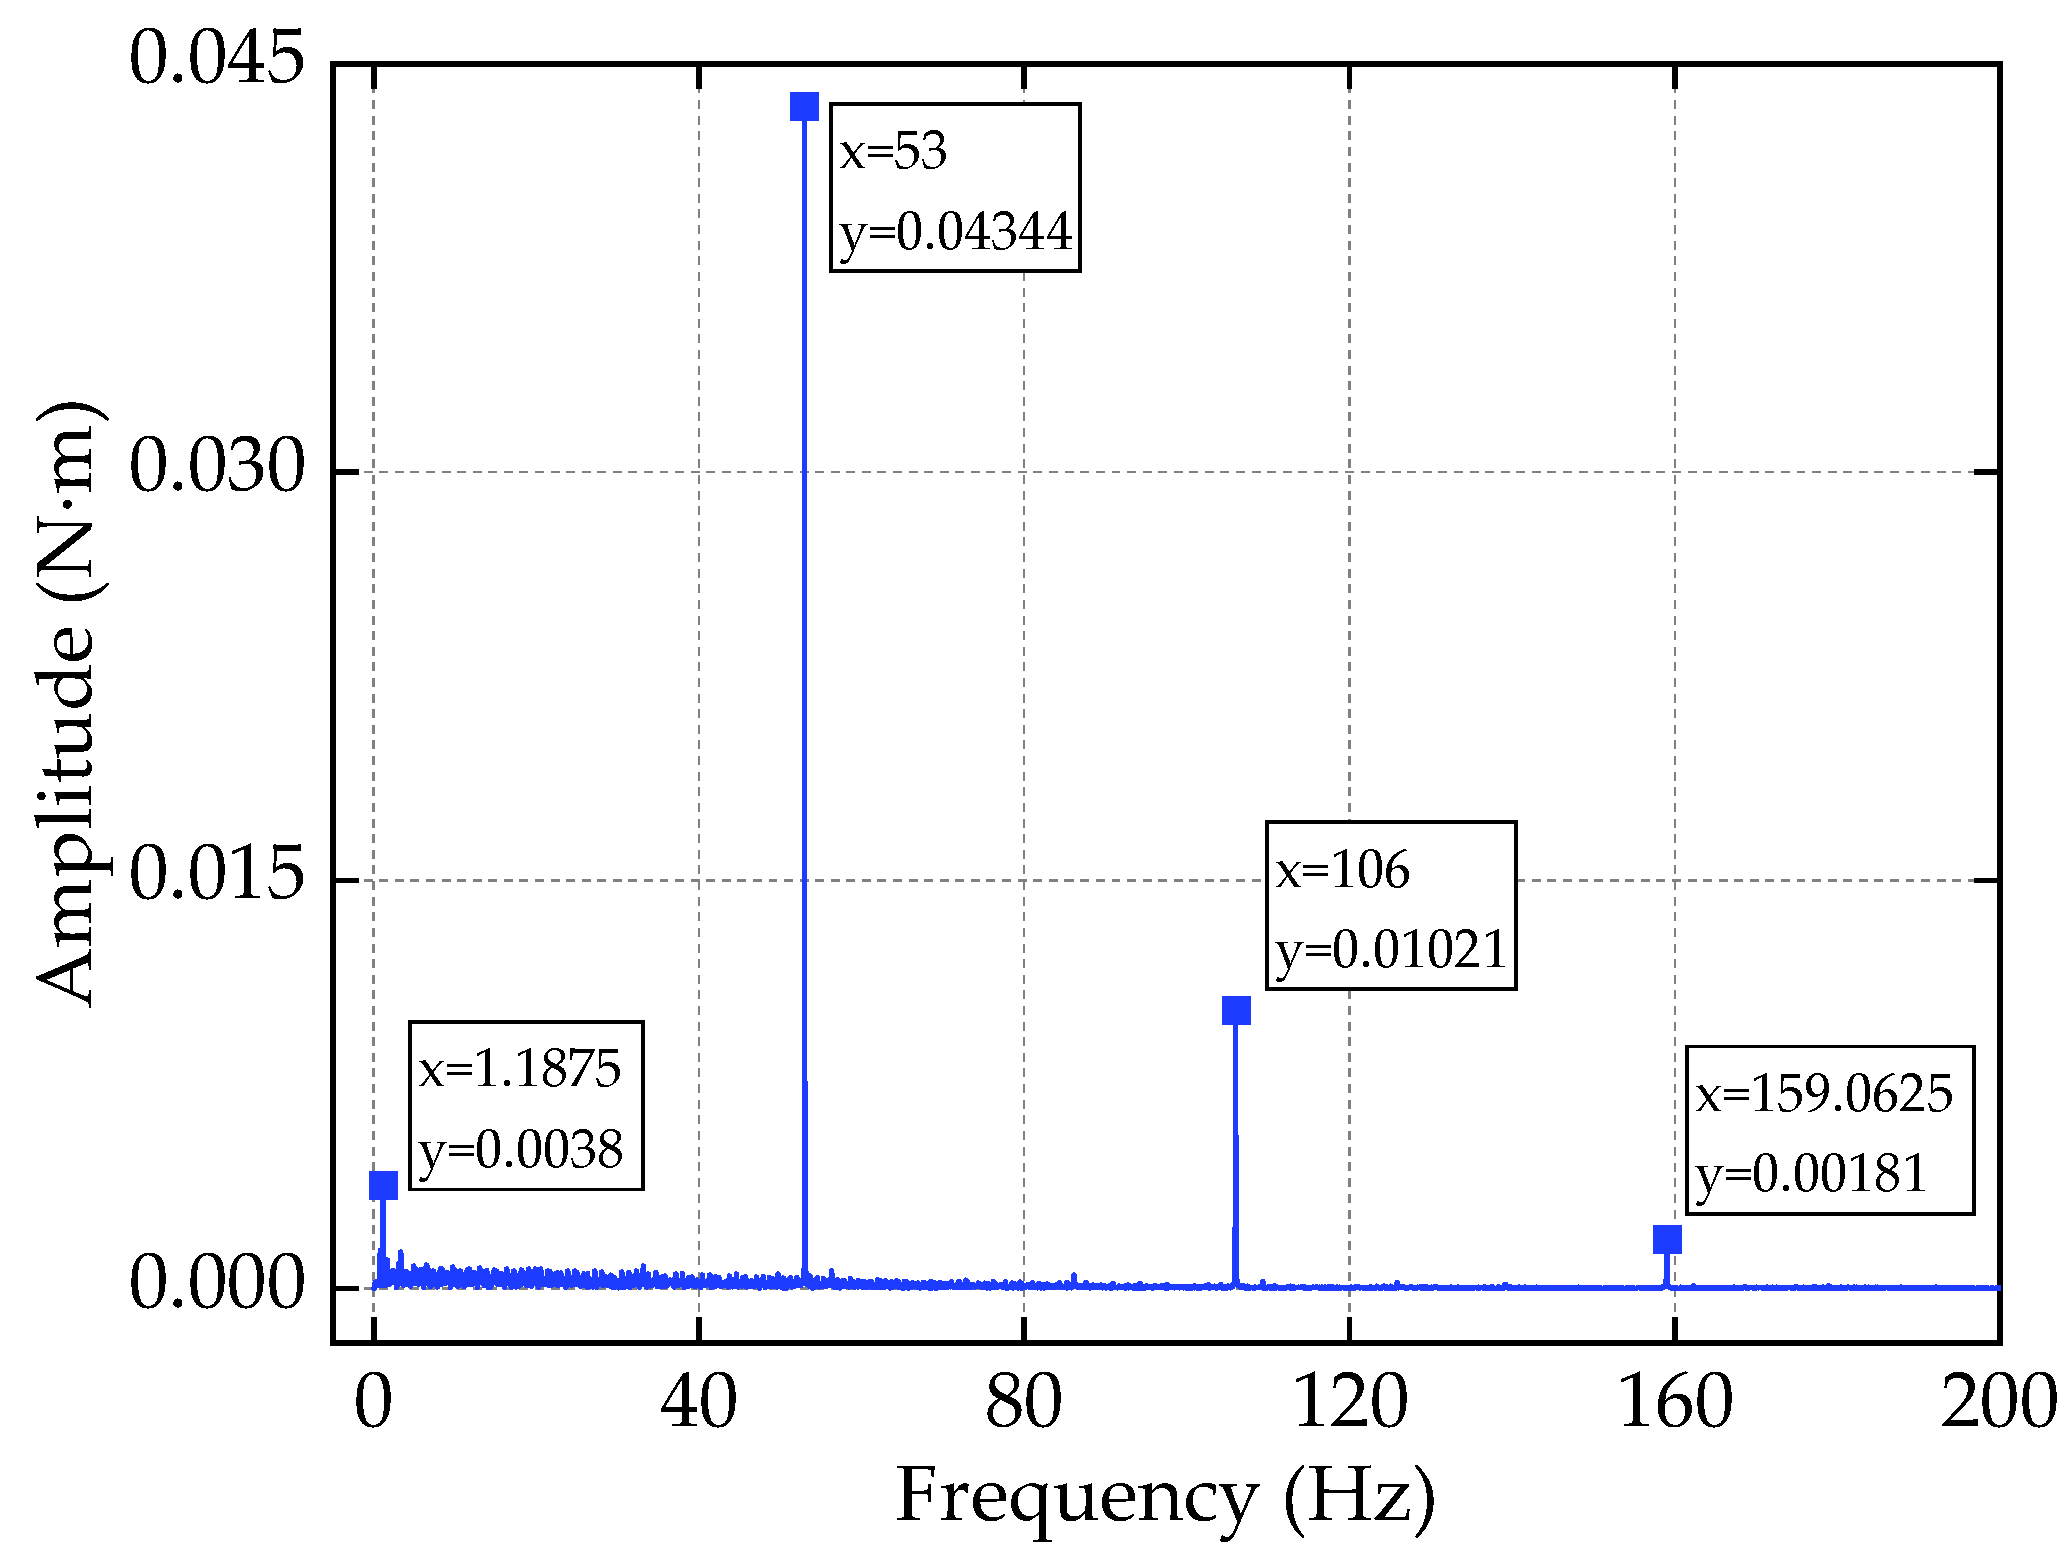
The time-domain signal of the disturbance torque along the z-direction during the stable operation of the SADA was intercepted, which was processed by fast Fourier transform and characterized in the frequency domain. Since the spacecraft is mainly susceptible to the disturbance in the middle and low frequency bands [
7], the frequency band 0–200 Hz was analyzed, as shown in
Figure 10.
As shown in
Figure 10, within the frequency range of 0–200 Hz, there are four peaks of the disturbance torque: 1.1875 Hz, 53 Hz, 106 Hz, and 159.0625 Hz. By classifying the four peaks, the frequency components of the disturbance torque can then be divided into two categories: (1) The first-order torsional natural frequency of the solar array, which is 1.1875 Hz; (2) The motor-driving frequency and its high-order harmonics (53 Hz, 106 Hz, and 159 Hz, etc.). There are errors between the peak frequencies and the theoretical frequencies of 1.19 Hz and 53.33 Hz, which were caused by the frequency adjustment error of the SAS and the test system error.
The focus here is on the frequency analysis of the disturbance torque to get the peaks and the amplitudes; therefore, the frequency domain curves of the test and simulation results are analyzed in the following study.
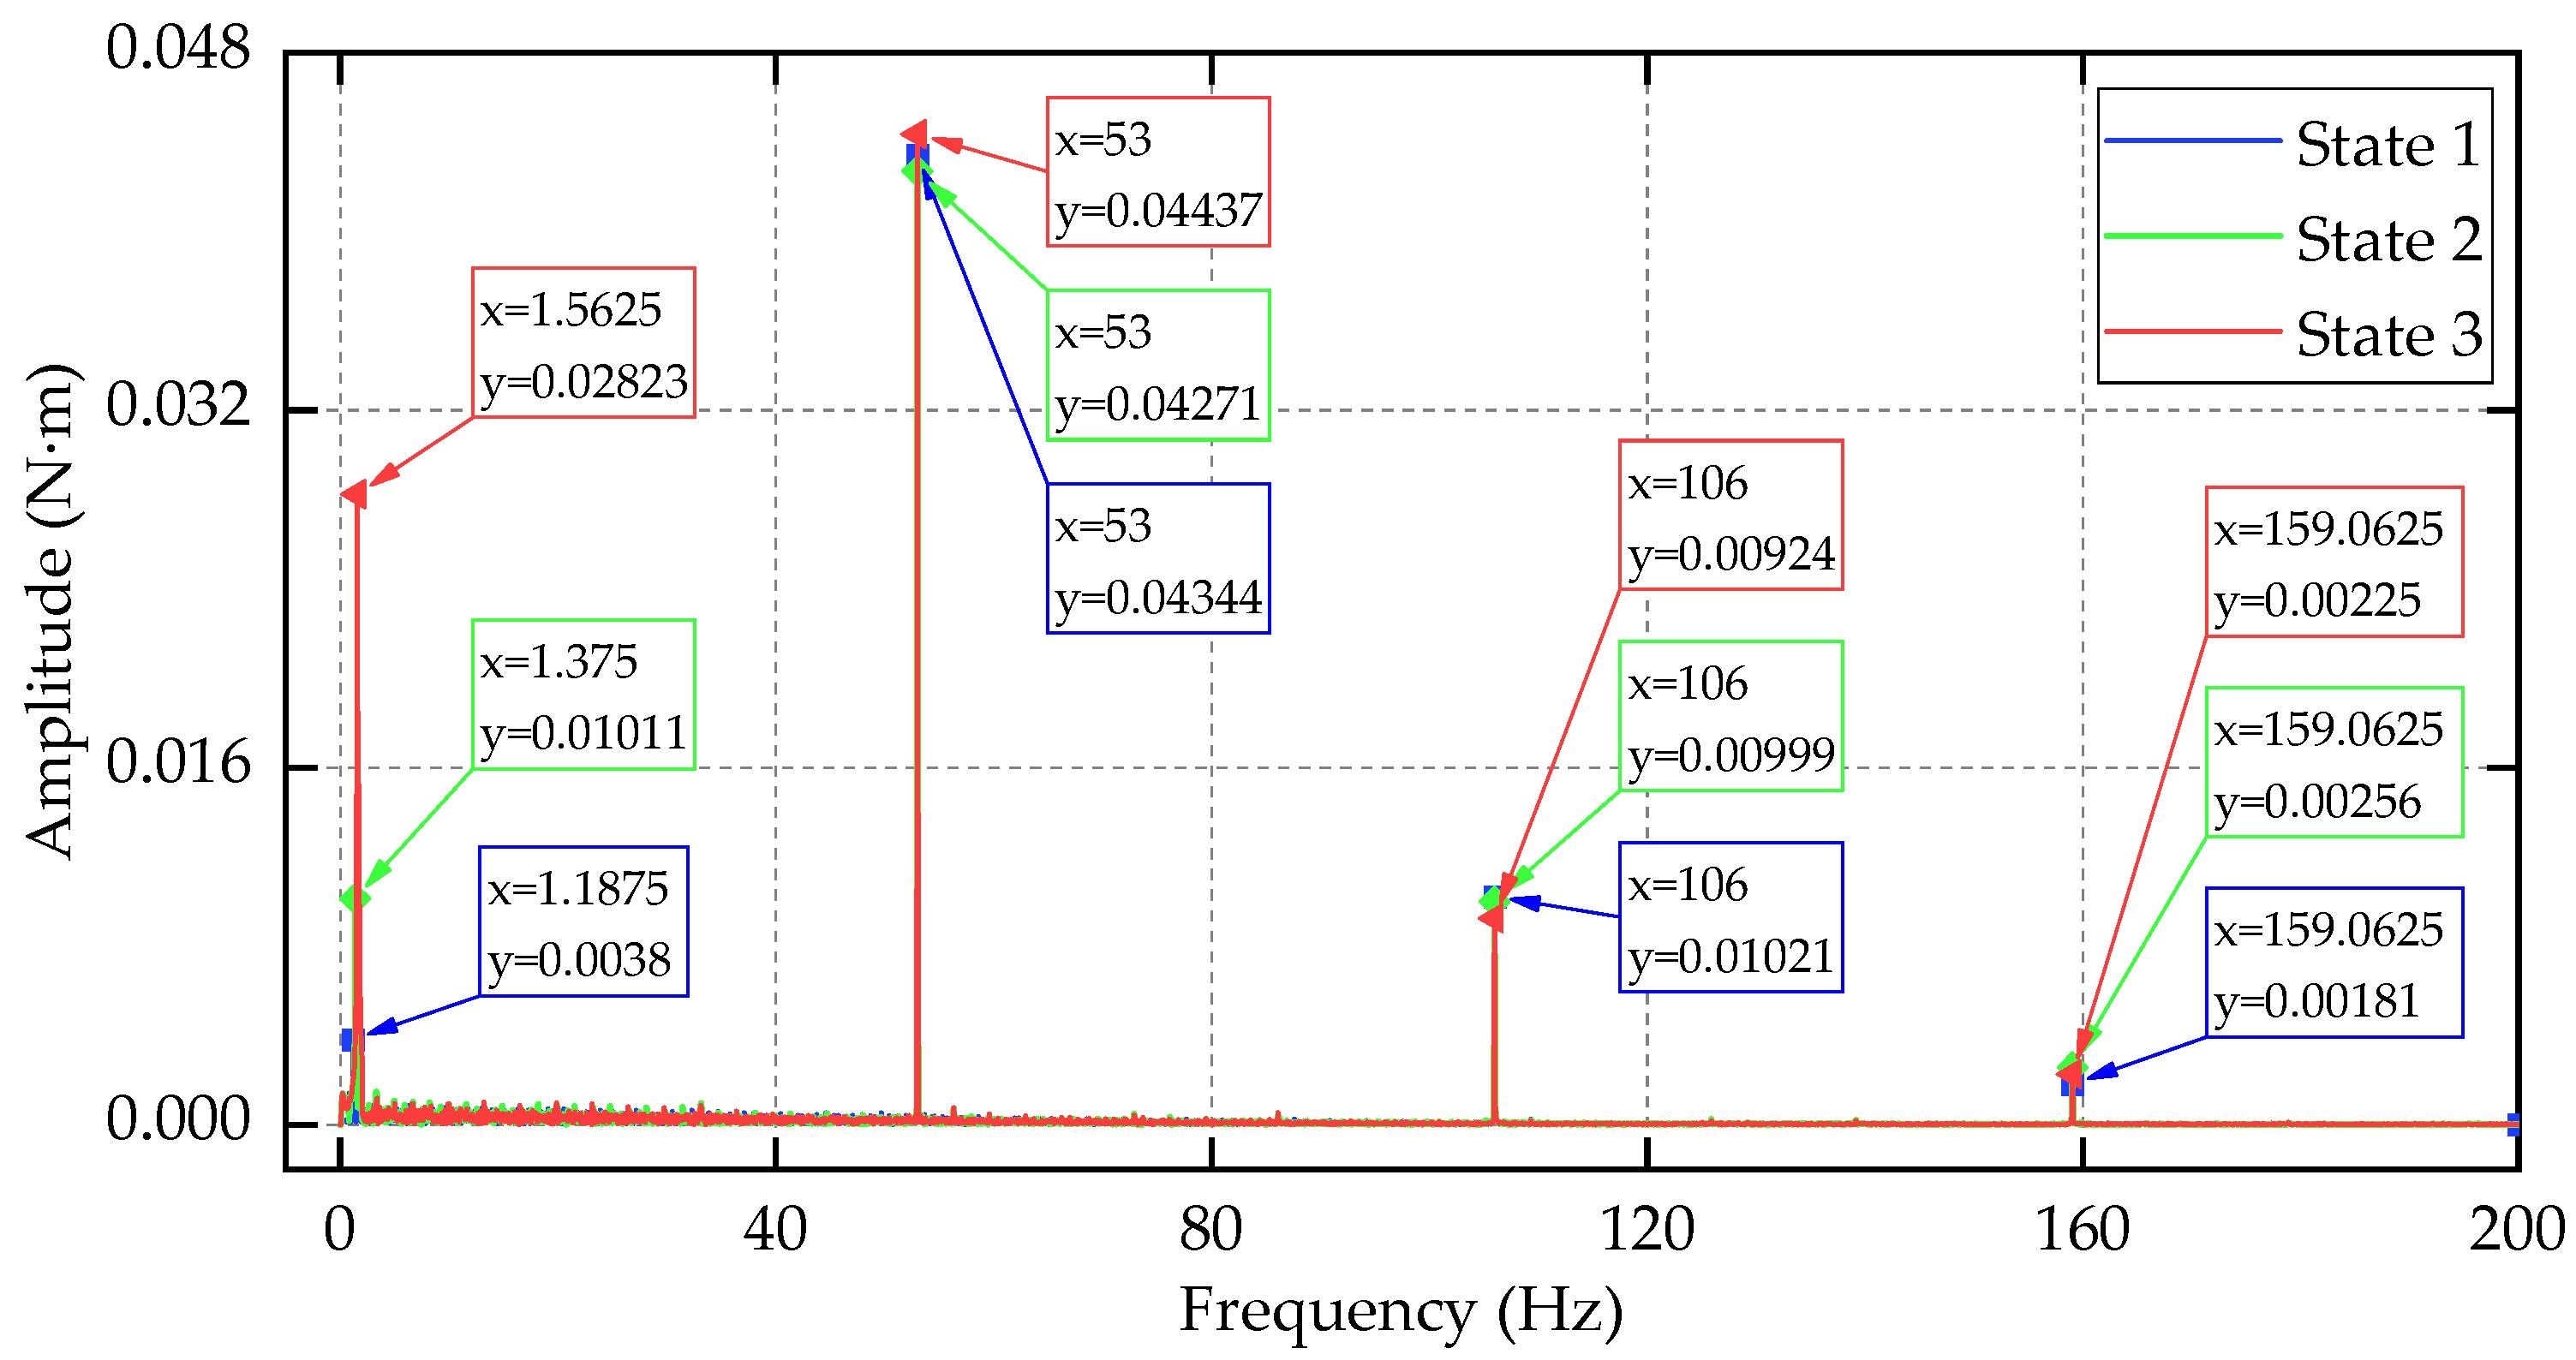
Figure 11 shows a spectrum curve comparison of the disturbance torques corresponding to states 1–3. The figure shows that the increase of the fundamental frequency of the SAS does not change the frequency composition of the disturbance torque when the moment of inertia is constant. Meanwhile, the disturbance torque amplitudes at the fundamental frequency increase with the increase of the fundamental frequency. The reason for this is that the fundamental frequency of the load is closer to the driving frequency of the motor, so it has a stronger coupling relationship with the SADA.
Figure 11 shows that the range of the amplitudes at the driving frequency and its harmonics is no greater than 0.00166 N·m, which indicates that the change of fundamental frequency has little effect on the driving frequency and its harmonic disturbance torque component when the moment of inertia of the load remains unchanged.
Figure 12 shows the spectrum curve comparison of the disturbance torques corresponding to tests 1, 4, and 5. As shown in the figure, when the fundamental frequency of the load is constant, the amplitude of each frequency component increases with the increase of the moment of inertia of the solar array. The reason for this is that the increase of load inertia leads to the increase of the driving torque, the fluctuation of the driving torque increases correspondingly, and the load vibration increases.
4.2. Simulation Results
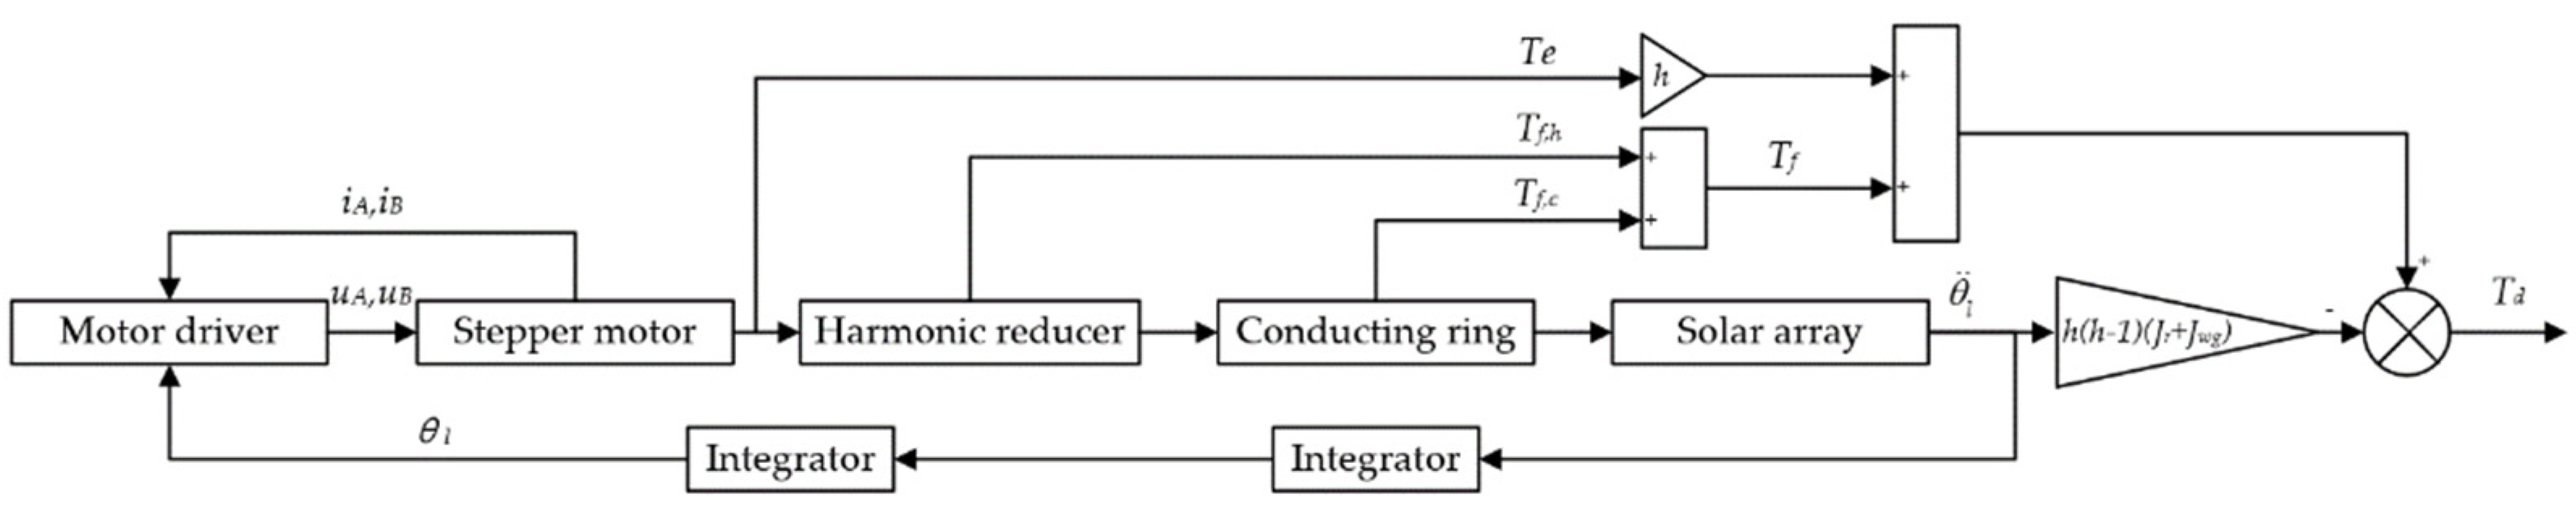
According to the disturbance torque model established in
Section 2, the rotation process of the SADA-driven solar array is simulated by using the Simulink toolbox in the commercial software Matlab (MathWorks, Natick, MA, USA). The schematic diagram of the simulation model is shown in
Figure 13.
The disturbance torque generated by the SADA-driven SAS of state 1 is simulated. The input parameters are mainly composed of two parts: (a) The SADA and its control system parameters; (b) parameters of the SAS.
Table 3 shows the parameters of the SADA and its control system, which are provided by the manufacturer after test or calculation.
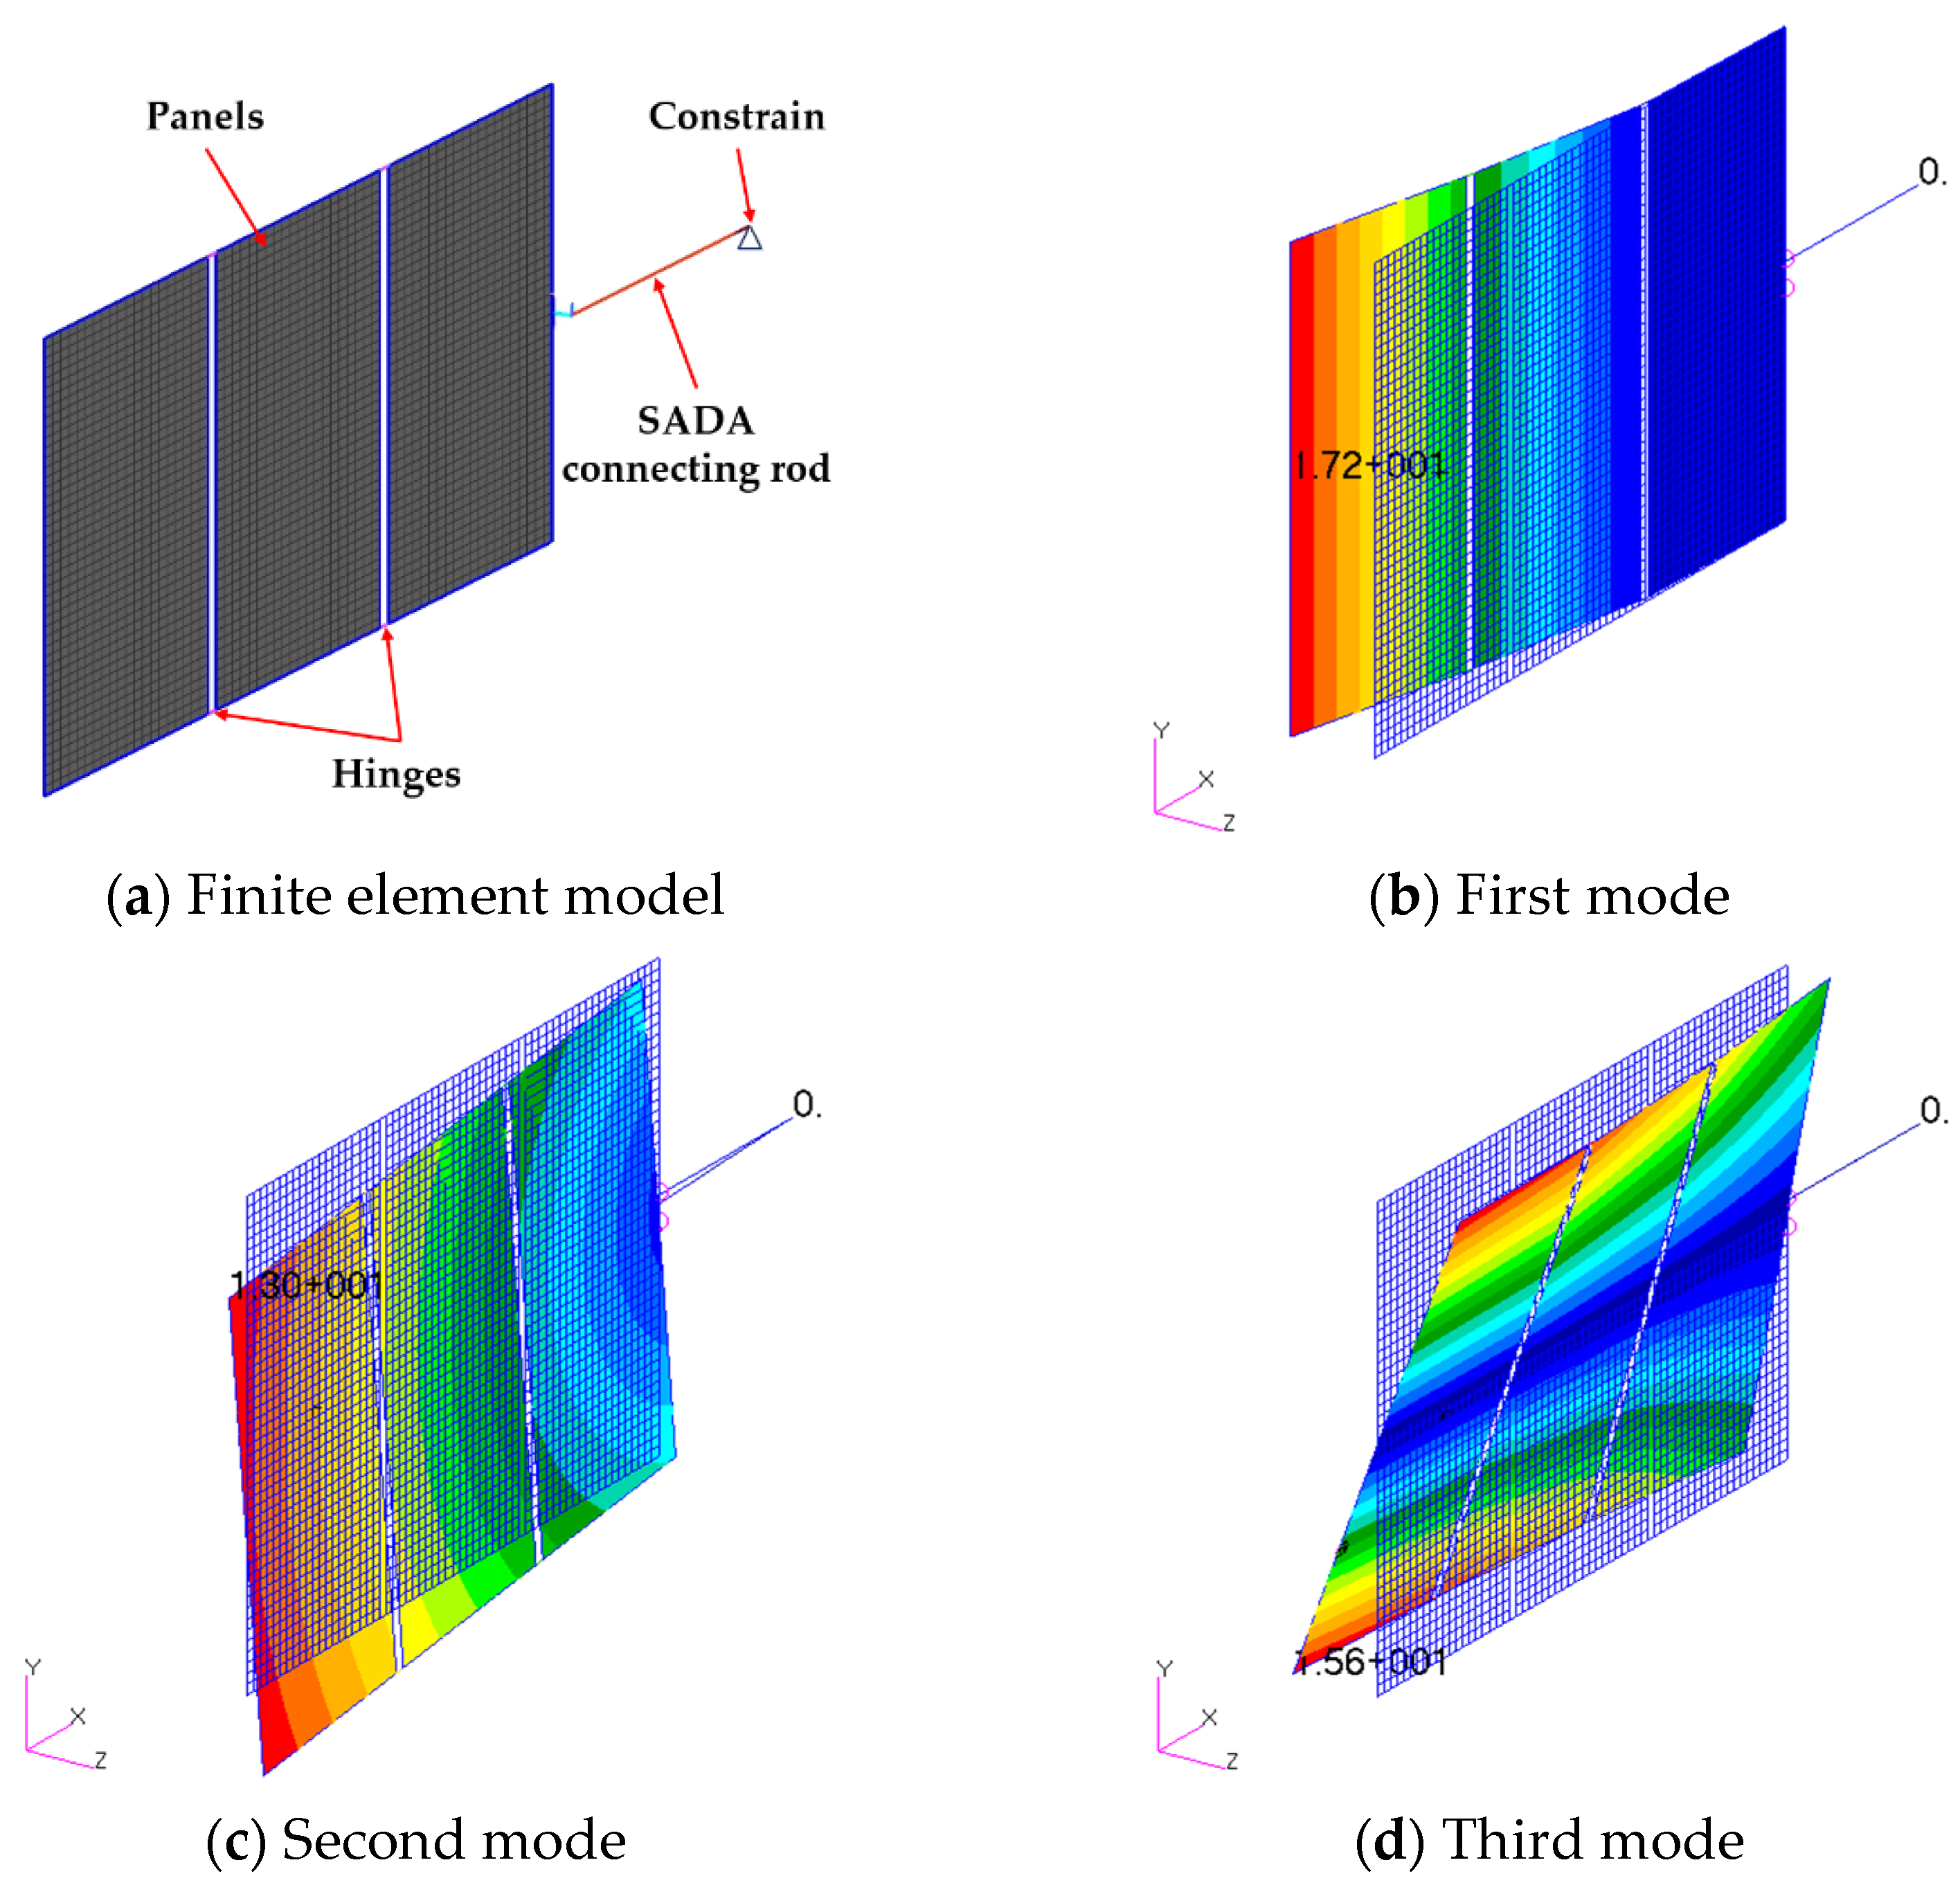
Parameters of the SAS are stiffness matrix, mass matrix, and damping information. These parameters are extracted from the accurate finite element model of the SAS, as shown in
Figure 14a.
Figure 14b–d show the first three modes of the SAS; the moment of inertia of the finite element model along the rotation axis was 8.46 kg·m
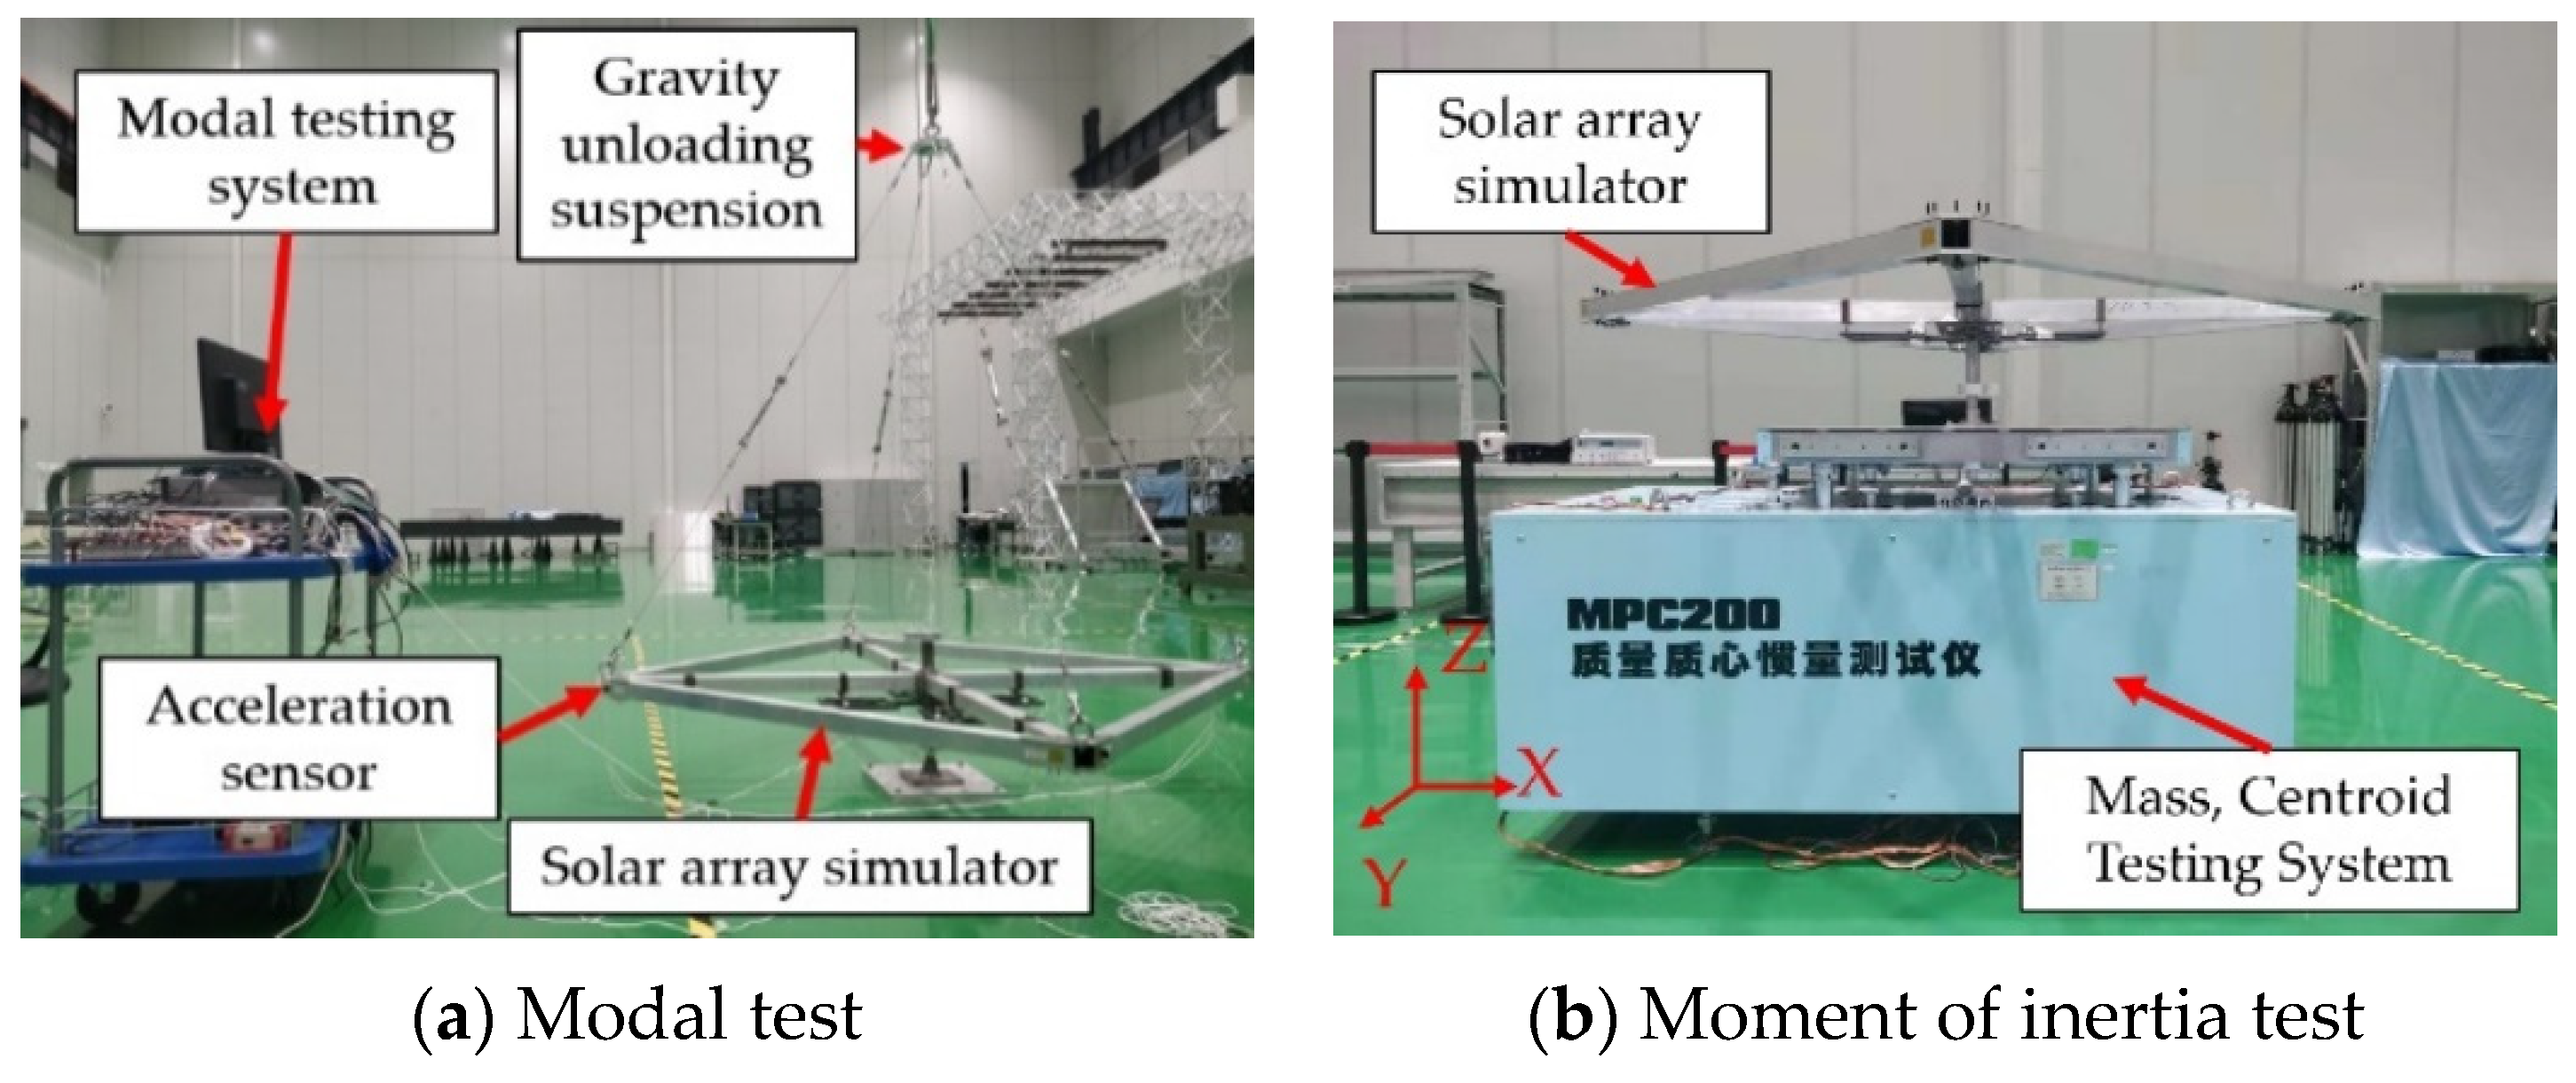
2. On the other hand, the natural frequency and moment of inertia of the SAS were measured, as shown in
Figure 15.
The tested moment of inertia of the SAS about the rotation axis, which is 8.19 kg·m
2, was taken as reference; the error of the moment of inertia calculated by the finite element model was 0.27 kg·m
2, and the relative error was only 3.3%.
Table 4 shows the frequencies of the first three modes obtained by finite element method and test. The table shows that the frequency error is no more than 3.15%, which indicates that the finite element model is an accurate model of the SAS under test state 1.
Figure 16 shows the frequency domain curve comparison between the simulation results and the test results.
Table 5 shows the frequency values of the peaks of the simulation results and the test results. The frequency error between the simulation results and the test results is no more than 0.684%.
Table 6 shows the amplitudes of simulation results and test results at each peak; the relative errors of the amplitude of the disturbance torque between simulation results and test results at each frequency component are not greater than 22.33%. The results above indicate that the model established in this paper can accurately simulate the disturbance torque generated by the SADA-driven solar array.


 ,
, 


