Article

A Novel Adaptive Approach for Autonomous Vehicle Based on Optimization Technique for Enhancing the Communication between Autonomous Vehicle-to-Everything through Cooperative Communication

by
Radwa Ahmed Osman
1,* and
Ahmed Kadry Abdelsalam
2
1
Basic and Applied Science Department, College of Engineering and Technology, Arab Academy for Science and Technology (AAST), Alexandria 1029, Egypt
2
Electrical and Control Engineering Department, College of Engineering and Technology, Arab Academy for Science and Technology (AAST), Alexandria 1029, Egypt
*
Author to whom correspondence should be addressed.
Appl. Sci. 2021, 11(19), 9089; https://doi.org/10.3390/app11199089
Submission received: 6 September 2021 / Revised: 27 September 2021 / Accepted: 27 September 2021 / Published: 29 September 2021
(This article belongs to the Special Issue Application of Mobile Systems in Smart Vehicles and Smart Roads)

Abstract

:
Recent autonomous intelligent transportation systems commonly adopt vehicular communication. Efficient communication between autonomous vehicles-to-everything (AV2X) is mandatory to ensure road safety by decreasing traffic jamming, approaching emergency vehicle warning, and assisting in low visibility traffic. In this paper, a new adaptive AV2X model, based on a novel optimization method to enhance the connectivity of the vehicular networks, is proposed. The presented model optimizes the inter-vehicle position to communicate with the autonomous vehicle (AV) or to relay information to everything. Based on the system quality-of-service (QoS) being achieved, a decision will be taken whether the transmitting AV communicates directly to the destination or through cooperative communication. To achieve the given objectives, the best position of the relay-vehicle issue was mathematically formulated as a constrained optimization problem to enhance the communication between AV2X under different environmental conditions. To illustrate the effectiveness of the proposed model, the following factors are considered: distribution of vehicles, vehicle density, vehicle mobility and speed. Simulation results show how the proposed model outperforms other previous models and enhances system performance in terms of four benchmark aspects: throughput (S), packet loss rate (PLR), packet delivery ratio (PDR) and average delivery latency (DL).

1. Introduction

Vehicular communication has become an emerging technology in intelligent transportation system (ITS) due to the offered road safety, comfort ride, traffic efficiency and infotainment [1]. This promising technology encourages most of the leading car companies to jointly work with national government agencies and wireless network research groups to develop communication-based products related to the transportation sector [2]. ITS is a system that exchanges information among vehicles, infrastructure and people; it can also be called vehicle-to-everything (V2X) communication. V2X includes various communications such as vehicle-to-vehicle (V2V), vehicle-to-infrastructure (V2I), vehicle-to-device (V2D) and vehicle-to-network (V2N). In the near future, all autonomous vehicles on the road will be able to connect in a self-organized way either through V2V or V2I. Thus, it is important to ensure that the communication between V2V and V2I is efficient and reliable to effectively share safety-related and infotainment services.
Due to the high complexity and the wide range of functionalities of the modern vehicular infotainment systems, a practical application based on developing a system capable of estimating the driving complexity in real time is presented [3]. In order to fulfil the vehicular networks environment, an international American standard for V2V and V2I communications has been proposed by the IEEE 802.11 working group for short-range inter-vehicle communication in the 5.9 GHz frequency band called IEEE 802.11p [4,5]. IEEE 802.11 p allows vehicles to directly communicate with each other without the need to go through the infrastructure. Additionally, different methods can be implemented at IEEE 802.11 p to mitigate the impact of the imperfect channel state information (CSI) and increase the required safety related data transmissions for vehicular ad-hoc networks [6]. Moreover, to increase the road safety, several frameworks was developed to link the characteristics of V2V communications; such as packet loss probability and packet transmission delay, with the physical mobility characteristics of the vehicular system such as safe inter-vehicular distance [7]. Furthermore, a V2V-based method for the detection of road traffic congestion using fuzzy logic is suggested to solve the problem of road congestion and increase the system accuracy for detecting road traffic congestion [8].
V2V is becoming an important part in modern ITS as there is no mandate for roadside units or infrastructure to facilitate the communication among vehicles, hence vehicles can be used to transfer and exchange messages. To increase the fault tolerance and the stability, a peer-to-peer approach can be applied for the autonomous vehicles network to increase the real-time capability, efficiency and cost effectiveness of the network [9]. Moreover, cooperative communication is one of the most well-known strategies which show how the combination between V2I communications and V2V communications can improve the capacity of vehicular networks [10]. However, performance enhancement in the vehicular network is always affected by the autonomous vehicle’s position, mobility, speeds, transmission range and density. These issues can have an adverse effect on the performance of the vehicular networks [11]. The density and the transmission range of the vehicles are two of the main factors on which the connectivity in vehicular communications depends. Therefore, in order to improve vehicular connectivity, combination between V2I and V2V is a strong candidate.
In the previous work proposed in [12], the combination between V2I and V2V using either multi-hop or cooperative communication was the authors’ main focus to improve quality-of-service (QoS) across the vehicular network. Consequently, based on these outcomes, the authors investigate the connectivity between autonomous vehicles-to-everything (AV2X) and its characteristics, and the major contributions of this article are summarized as follows:
  • The proposed adaptive approach develops an efficient method to enhance the connectivity between AV2X by applying a method assisted by V2V communications.
  • An optimization problem to ascertain that the communication between AV2X is reliable, and to achieve the required system QoS was formulated.
  • Based on the required QoS, the AV was used to decide whether to reach the destination through the direct link or through cooperative communication by finding the optimum position of the relay-vehicle. This enables determination of the required distance between AV2X to fulfil the required QoS.
  • The proposed adaptive model was evaluated in terms of throughput, packet loss rate, packet delivery ratio and average delivery latency for the vehicular communication under different conditions, such as transmission power, and channel condition (path loss exponent), interference, vehicle mobility, vehicle density and vehicle speed. These findings can optimize the system performance for the whole network in a vibrant environment. This can be achieved by finding the optimum inter-vehicle position to communicate with the autonomous vehicle (AV) or to relay information to everything.
The proposed paper is organized in five sections. Following the introduction, Section 2 discusses the relevance of this research to other work. The system model, the optimization problem formulation and the autonomous vehicles communication scenario of the proposed model are presented in Section 3. Simulation results and discussions are provided in Section 4. Finally, the paper is concluded in Section 5.

2. Literature Review

Cooperative communication strategy for vehicular networks is one of the most commonly used techniques in different manners to enhance the link reliability in a vehicular network and also improve the overall system performance under different environmental conditions. Cooperative communication strategy for vehicular networks is proposed in [13] to explore the combination using V2I communications, and V2V communications, mobility of autonomous vehicles, and cooperation among autonomous vehicles and infrastructure to improve the capacity of the vehicular networks. In addition, the use of cooperative V2X downloading was a typical solution of driving experience [14], in order to achieve better energy efficiency, low emissions and resource sharing. Moreover, the reliability and effectiveness of V2X communication greatly depends on communication architecture, and authors in [15] proposed a D2D communication approach to reduce the latency by offering direct vehicle-to-vehicle (V2V) and vehicle-to-infrastructure (V2I) communication. The implicit cooperative positioning (ICP) algorithm that exploits the V2V connectivity in an innovative manner, avoiding the use of explicit V2V measurements such as ranging, was investigated in [16] to enhance the autonomous vehicle localization accuracy. Additionally, to improve road traffic efficiency in cooperative vehicular networks, a new algorithm was presented in [17], combining both clustering and cluster-head autonomous vehicles (CHVs) cooperative communication for reducing traffic congestion. The design of cooperative adaptive cruise control (CACC) to regulate the longitudinal motion of connected and automated vehicles is presented in [18] to improve vehicle safety and mitigate mixed traffic perturbs.
In vehicular communication, improving the system performance is an important issue, which is always affected by the accurate representation of the real network topology by the vehicular mobility model [19]. Clustering algorithm in vehicular networks can also contribute to the improvement of the unstable V2V connectivity caused by high-speed vehicle movement [20]. Additionally, the packet delivery rate can be maximized by using a new model called sectorised relay-assisted vehicle-to-vehicle communication (SR-V2VC) [21]. To overcome the problem of current resource constraint, stochastic dynamic programming (SDP) is employed as a tool to analyze and solve network resource constraint and allocation issues of resources in vehicular ad hoc networks [22]. In addition, the massive multiple-input-multiple-output (MIMO) architecture is attractive to multiple vehicles on the road for V2I, as it is one of the promising solutions to meet the requirements of vehicular communication and it can significantly improve the system spectrum efficiency and energy efficiency [23]. Furthermore, for system performance improvement, [24] developed a new V2V communication scheme to enhance system power control, improving the throughput and fairness index. Moreover, for system reliability, [25] extended a multihop relaying into vehicular communication in highways by investigating a transmission scheme where traveling vehicles are allowed to relay signals via neighboring vehicles to the final destination. In addition, a new proposed model based on V2V communication was proposed in [26] to overcome the problem of traffic jams and decrease the travel time for any emergency vehicle. Additionally, it aims to enhance the system performance of vehicular communication.
This paper aims to establish an adaptive AV communication, based on using optimization technique to ascertain that the communication between AV2X is reliable. This will be achieved by finding, based on the required QoS, the required best vehicle position that AV should communicate with to efficiently obtain specific road information, and send information to other vehicles or to everything (V2X). If the optimum position of the relay-vehicle is at the destination, then AV communicates directly to the destination, otherwise AV communicates with the destination through the relay-vehicle. This enhances the overall vehicular system performance, while at the same time decreases the amount of infrastructure needed by adapting the connection through AV2V and AV2X. The proposed method aims to improve the reliability and the efficiency of the connectivity either between AV2X or AV2V. Different scenarios are investigated during simulation to assess and evaluate the performance of the proposed approach in terms of throughput, packet delivery ratio, packet loss rate and average delivery latency. The proposed approach is evaluated by five different benchmark metrics which are not all commonly utilized in one specific research paper. Hence, related researches [12,22] are considered for comparison with the proposed model. The proposed model shows how to achieve the optimized required vehicular communication performance through choosing the best inter-vehicle position. The position will be determined based on different environmental conditions to satisfy a required QoS. Table 1 shows the novelty of the proposed model compared with other related research articles.

3. Proposed Model and Problem Formulation

3.1. System Model

The objective of this proposed model is to build an adaptive model to improve the performance of autonomous vehicle communication. Therefore, the proposed model, as shown in Figure 1, through the constrained optimization techniques, is capable to determine the best vehicle position to communicate with others or to relay the information to any destination. The decision of using direct communication or cooperative communication between AV2X will be taken based on the requirement QoS. Therefore, if the system requirement will be fulfilled within the transmission distance between AV2X, then AV will communicate directly to the destination. On the other hand, if the transmission distance between AV2X will affect the required QoS, then AV will communicate with the destination through relay-vehicle. The proposed model will be evaluated in terms of throughput, packet delivery ratio and packet loss rate, average delivery latency via a combined use of direct AV2X communications and cooperative V2V communications. Additionally, through the performance analysis vehicle mobility, vehicle density, vehicle speed and cooperation among vehicles and infrastructure are considered. Based on the proposed model, each autonomous vehicle conditions will decide, based on the environment, which best autonomous vehicle it should communicate with to efficiently obtain specific road information, send information to other autonomous vehicles or to send information to infrastructure with reliable and efficient connection.
A vehicular network is considered, in which the infrastructure provides infotainment services to vehicles. The system consists of a road with four lanes and infrastructures located on each side, and the infrastructure is deployed with equal distance L. The width of a lane is typically small compared with the transmission range of vehicles; it may range from 3.0 to 3.5 m for any road [27]. Each lane contains density of vehicles equal to ρ and the number of vehicles in each lane will be represented as:
G = D . ρ
where G is the number of vehicle and D is the road length. Besides, vehicles in each lane travel at the average speed of v. Moreover, for road safety, the distance between any two consecutive vehicles must follow the 1-s or 2-s rule, where the driver should drive at least 1 or 2 s behind the vehicle in front during ideal conditions based on the rules of different countries [28].

3.2. Problem Formulation

The goal of the proposed model is finding the most appropriate way for communication between AV2X in order to fulfill the required QoS. This can be achieved by deciding whether to use the direct communication or the cooperative communication between AV2X based on implementing an optimization technique. If the cooperative communication is going to be the most appropriate way for communication, the optimum vehicle position to communicate with others or to relay information to anything should be determined with given network requirements. The proposed model aims to enhance QoS by increasing the system throughput, packet delivery ratio and minimizing the packet loss rate and average delivery latency, i.e.,
M a x i = 1 J q i s . t . C 1 = : { I 1 X I 1 X m a x } C 2 = : { P V P V m a x } C 3 = : { S I N R A V X , V 1 X S I N R t h }
In the formulated optimization problem, qi represents the position weight of any destination whether it was vehicle, infrastructure or the relay-vehicle of the i-th path. C1 is the constraint that interference at any destination (I1X) must be lower than the maximum required interference (I1Xmax). I1Xmax can be obtained from:
S I N R A V X m a x = P A V | h A V X | 2 I 1 X m a x + N o B
I 1 X m a x = P A V | h A V X | 2 S I N R A V X m a x
where SINRAVmax represents the maximum required signal-to-interference-plus-noise for AVX link. PAV and | h A V X | 2 represent the autonomous vehicle transmission power and the channel gain for the information of autonomous vehicle and everything, respectively. B is the channel bandwidth, and No denotes the power spectral density of AWGN.
C2 identifies the constraint that transmission power of AV and any transmitting vehicle (PV) must be lower than the maximum transmission power (PVmax). C3 denotes the constraints imposed by the maximum required signal-interference-plus-noise (SINRth).
Based on the proposed idea, it is assumed that the inter-vehicles are located at a position between the AV2X (dAVX). Thus, the distance between the AV and the relay-vehicle (dAVV1) and the distance between the relay-vehicle and the destination (dV1X) can be expressed as:
d A V V 1 = ( 1 q ) d A V X
d V 1 X = q d A V X
The connectivity between AV2V and AV2X is identified in Figure 2, including the direct communication between AV2V and the communication between AV2X through inter-vehicular communication. The proposed model attest system efficiency and reliability under various operating conditions using standard benchmarks as (i) throughput; (ii) packet delivery ratio; (iii) packet loss rate; and (iv) average delivery latency.
The transmission links between AV2V and AV2X are subjected to Rayleigh fading with additive white Gaussian noise (AWGN) and propagation path-loss [29]. The channel fades for different links are considered to be statistically mutually independent. Additionally, as a wireless standard for vehicular communications, the dedicated short range communications (DSRC) is considered as the most promising protocol to be used in automotive system [5]. DSRC technology involves one-way or two-way short range wireless communication channels specifically designed for automotive use.
The US Federal Communications Commission (FCC) has allocated 75 MHz spectrum in the 5.9 GHz band for short-range communications to be used in ITS including V2I and V2V. On the other hand, the European Telecommunications Standards Institute (ETSI) has allocated 30 MHz of spectrum in the 5.9 GHz band for ITS [30]. The physical and MAC layer of the DSRC layered model employs the IEEE 802.11p standard for vehicular communication. The IEEE 802.11p standard supports eight different data rates based on the orthogonal frequency division multiplexing (OFDM) method [6].

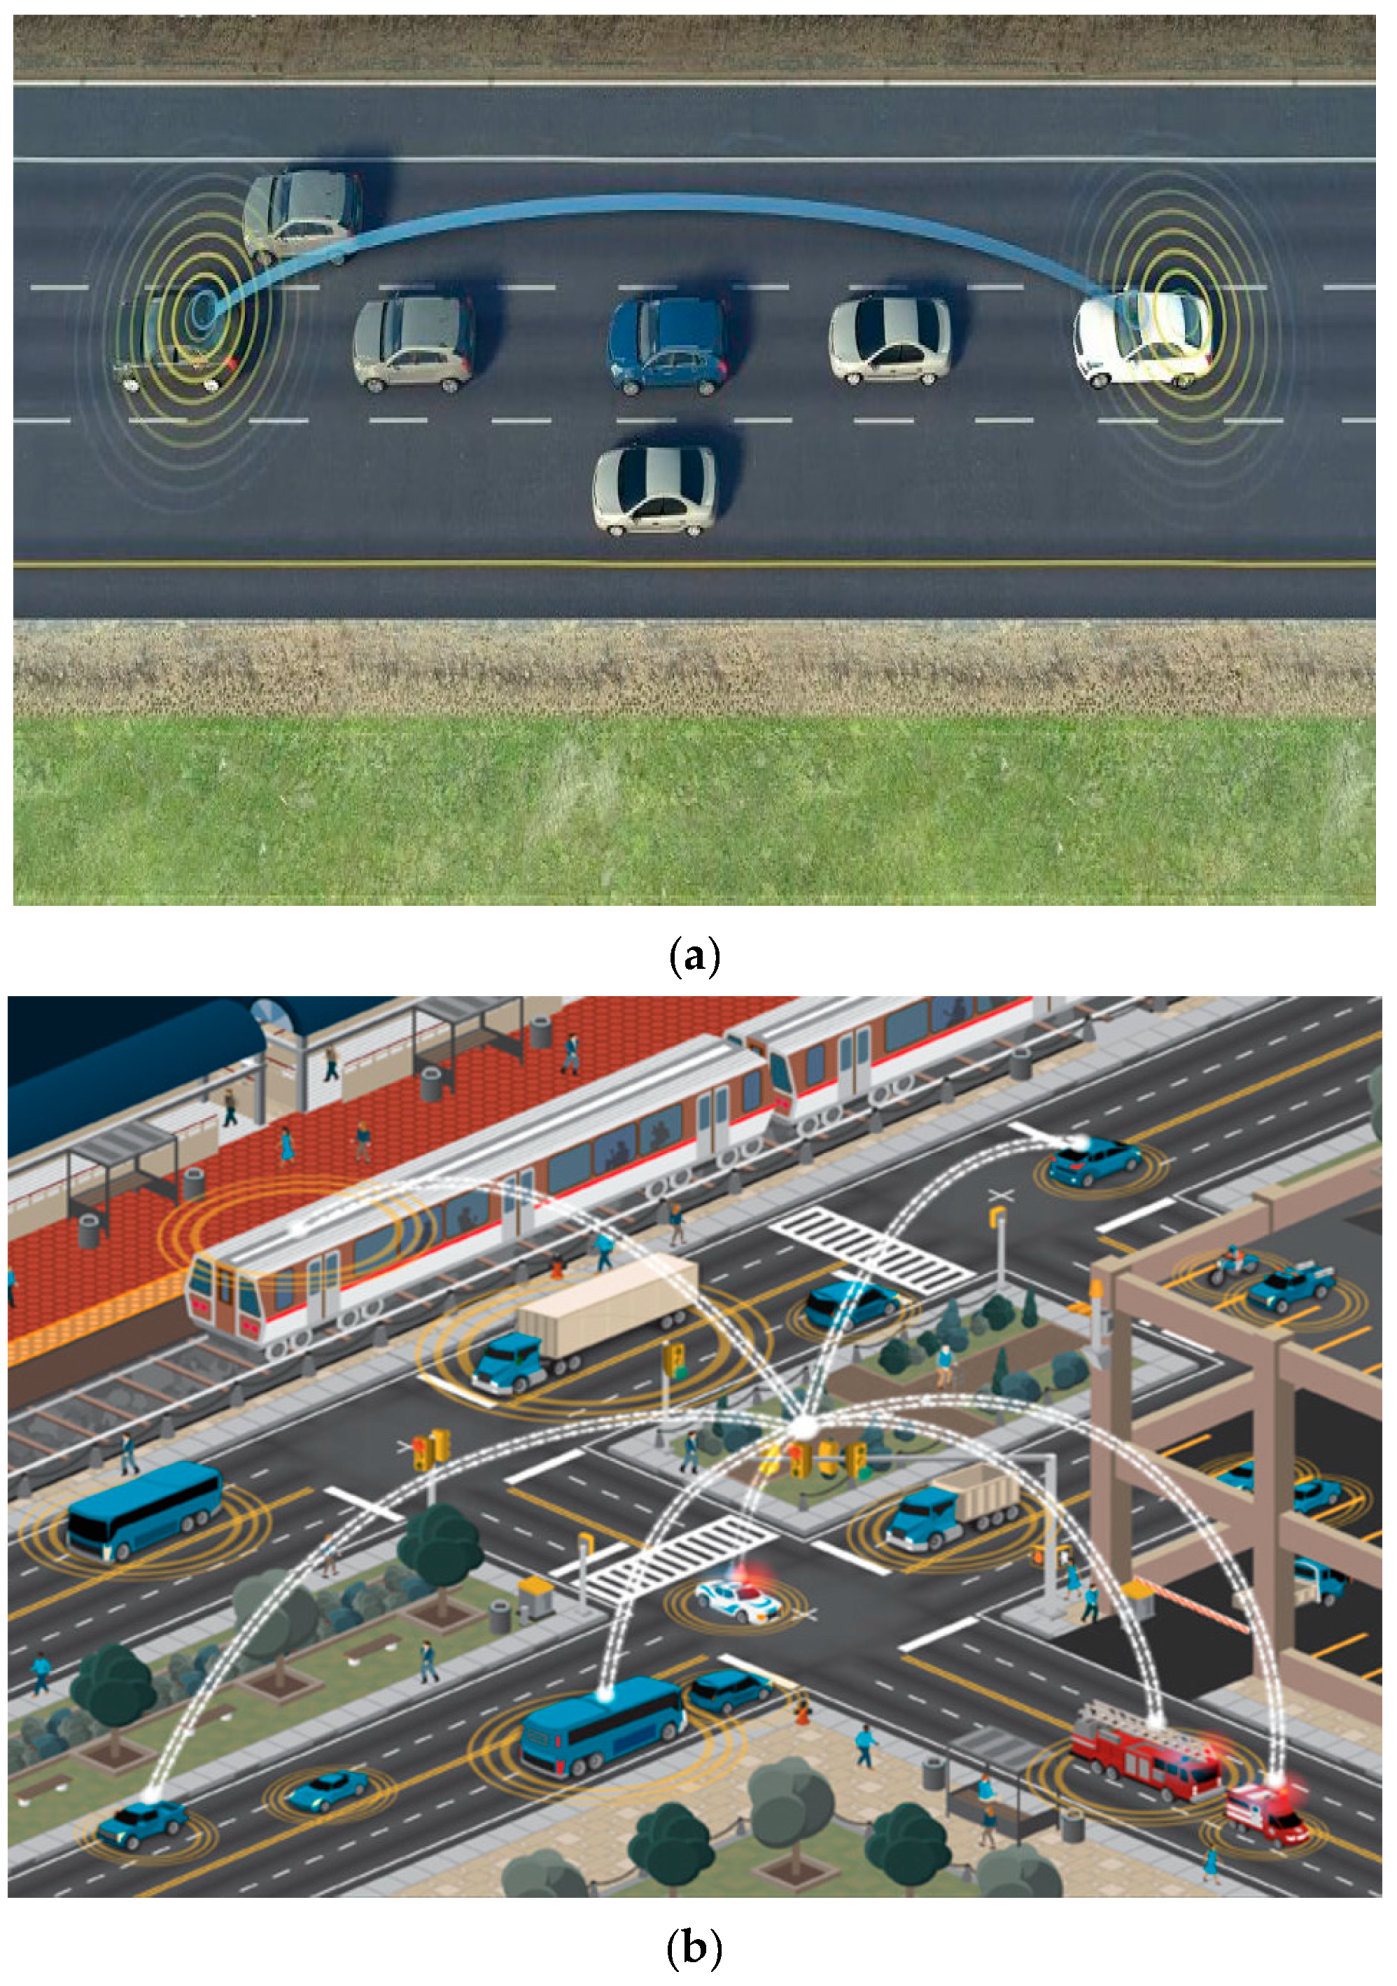
3.3. Vehicle Communication Scenario

The vehicular scenario is shown in Figure 2, where vehicles and autonomous vehicles are moving along a road and communicate with anything (AV2X). The scenario assumes that the infrastructures are located along the road with equal distance (L), and assumes that all infrastructure points have the same radio range (rI) and all the vehicles have the same radio range (rV) where rI > rV, which reflects the fact that the capability of communication of the infrastructure is stronger than the capability of communication of vehicles [10]. Any pair of vehicles can directly communicate with each other only if this pair is within its radio range rV. Thus, the proposed model intends to find the best position of inter-vehicles to communicate with other vehicles or to relay the information to the infrastructure. The proposed model adopts two communication schemes; the first one is the communication between vehicles, and the second is the communication between vehicles (V) and everything (X) through the existence of the inter-vehicular between AV2X. The inter-vehicles are located at a distance equal to (q*dAVX), where q is the position weight of the inter-vehicles from the destination and dAVX is the distance from the destination. The uplink communications between the AV2V and AV2X are assumed to be frequency-flat block-fading Rayleigh channels [31]. Therefore, the uplink data rate between autonomous vehicle-to-vehicle or relay-vehicle (RAVV1) and autonomous vehicle-to-everything through relay-vehicle (RAVX) are given by [32]:
R A V V 1 = B A V V 1 l o g 2 ( 1 + S I N R A V V 1 )
R A V X V 1 X = B V 1 X l o g 2 ( 1 + S I N R A V X , V 1 X )
BAVV1 and BV1X represent the bandwidth of the uplink channel between autonomous vehicle-relay-vehicle and relay-vehicle-everything, respectively. SINRAVV1 and SINRAVX,V1X represent the signal-to-interference-plus noise between autonomous vehicle-relay-vehicle (AVV1) and between autonomous vehicle-everything (AVX) and relay-vehicle-everything (V1X), which can be expressed, respectively, as [32]:
S I N R A V V 1 = P A V | h A V V 1 | 2 I V 1 + N o B
S I N R A V X , V 1 X = P A V | h A V X | 2 I 1 X + N o B + P V | h V 1 X | 2 I 2 X + N o B
where h A V V 1 , h A V X and h V 1 X are channel gain for the information of autonomous vehicle-relay-vehicle (AVV1), autonomous vehicle-destination and relay-vehicle-destination, respectively. PV is the relay-vehicle transmission power. IV1, I1X and I2X are the interference occurred at the relay-vehicle from AVV1 link, at the destination due to AV2X link and at the destination due to V1X link. The interference occurred due to other transmitting devices or vehicles sharing the same spectrum. Therefore, I1X and I2X can be given as:
I 1 X = k = 1 K P I k | h I k X | 2
I 2 X = r = 1 R P I r | h I r X | 2
where h I k X and h I r X are the fading co-channel interference at the destination due to AVX link and relay-vehicle-destination link, respectively. PIk and PIr are the interference transmission powers of the devices which share the AVX link and relay-vehicle-destination link, respectively. The fading channel coefficient between any source-destination h S D can be expressed as [33]:
| h S D | 2 = | h S D o | 2 P L S D
where h S D o and PLSD are the complex Gaussian random variables to model fading phenomena and the pathloss of S-D link. Thus, Equations (9) and (10) can be rewritten as:
S I N R A V V 1 = P A V | h A V V 1 o | 2 P L A V V 1 ( I V 1 + N o B )
S I N R A V X , V 1 X = P A V | h A V X o | 2 P L A V X ( I 1 X + N o B ) + P V | h V 1 X o | 2 P L V 1 X ( I 2 X + N o B )
where PLAVV1, PLAVX and PLV1X are the path loss between autonomous vehicle and relay-vehicle, autonomous vehicle and any destination, and relay-vehicle and any destination, respectively, which can be modelled as PLAVV1 = PLo dAVV1α, PLAVX = PLo dAVXα and PLV1X = PLo dV1Xα. Here, the parameters PLo, dAVV1, dAVX and dV1X are the path loss constant, the distance between autonomous vehicle and relay-vehicle, autonomous vehicle and any destination, and relay-vehicle and any destination, respectively. The factor α is the path loss exponent.
Based on the assumption given in Equations (5) and (6), Equation (15) can be rewritten as:
S I N R A V X , V 1 X = P A V | h A V X o | 2 P L o d A V X α ( I 1 X + N o B ) + P V | h V 1 X o | 2 P L o q α d A V X α ( I 2 X + N o B )
Assuming that the autonomous vehicle and any transmitting vehicle have the same transmission power (PV), q can therefore be given as:
q = [ P V | h V 1 X o | 2 ( I 1 X + N o B ) ( S I N R A V X , V 1 X P L o d A V X α ( I 1 X + N o B ) P V | h A V X o | 2 ) ( I 2 X + N o B ) ] 1 α
To find the solution for the optimization problem specified in (1), the first-order optimality conditions are now investigated. The Lagrangian of the optimization problem in (1) can be calculated as:
L ( I 1 X , P V , S I N R A V X , V 1 X , λ , ζ , μ ) = q λ ( I 1 X m a x I 1 X ) ζ ( P V m a x P V ) μ ( S I N R A V X , V 1 X S I N R t h )
where λ, ζ and μ are non-negative Lagrangian multipliers for C1, C2 and C3, respectively. By taking the derivative of Equation (18) with respect to I1X, PV and SINRAVX,V1X, λ, ζ and μ can therefore be found as:
L ( I 1 X , P V , S I N R A V X , V 1 X , λ , ζ , μ ) I 1 X = 0
0 = q I 1 X λ ( P V | h A V X | 2 S I N R A V X m a x N o B I 1 X ) I 1 X ζ ( P V m a x P V ) I 1 X μ ( S I N R A V X , V 1 X S I N R t h ) I 1 X
λ = 1 α [ P V | h V 1 X o | 2 ( I 1 X + N o B ) ( S I N R A V X , V 1 X P L o d A V X α ( I 1 X + N o B ) P V | h A V X o | 2 ) ( I 2 X + N o B ) ] ( 1 α 1 ) [ P V 2 | h V 1 X o | 2 ( ( S I N R A V X , V 1 X P L o d A V X α ( I 1 X + N o B ) P V | h A V X o | 2 ) ( I 2 X + N o B ) ) 2 ]
L ( I 1 X , P V , S I N R A V X , V 1 X , λ , ζ , μ ) P V = 0
0 = q P V λ ( P A V | h A V X | 2 S I N R A V X m a x σ 2 I 1 X ) P V ζ ( P V m a x P V ) P V μ ( S I N R A V X , V 1 X S I N R t h ) P V
ζ = 1 α [ P V | h V 1 X o | 2 ( I 1 X + N o B ) ( S I N R A V X , V 1 X P L o d A V X α ( I 1 X + N o B ) P V | h A V X o | 2 ) ( I 2 X + N o B ) ] ( 1 α 1 ) [ S I N R A V X , V 1 X | h V 1 X o | 2 ( I 1 X + N o B ) 2 ( ( S I N R A V X , V 1 X P L o d A V X α ( I 1 X + N o B ) P V | h A V X o | 2 ) ) 2 ( I 2 X + N o B ) ] + λ ( | h A V X | 2 S I N R A V X m a x )
L ( I 1 X , P V , S I N R A V X , V 1 X , λ , ζ , μ ) S I N R A V X , V 1 X = 0
0 = q P V λ ( P A V | h A V X | 2 S I N R A V X m a x σ 2 I 1 X ) S I N R A V X , V 1 X ζ ( P V m a x P V ) S I N R A V X , V 1 X μ ( S I N R A V X , V 1 X S I N R t h ) S I N R A V X , V 1 X
μ = 1 α [ P V | h V 1 X o | 2 ( I 1 X + N o B ) ( S I N R A V X , V 1 X P L o d A V X α ( I 1 X + N o B ) P V | h A V X o | 2 ) ( I 2 X + N o B ) ] ( 1 α 1 ) [ P V | h V 1 X o | 2 ( I 1 X + N o B ) 2 ( ( S I N R A V X , V 1 X P L o d A V X α ( I 1 X + N o B ) P V | h A V X o | 2 ) ( I 2 X + N o B ) ) 2 ]
By taking the derivative of (18) with respect to λ, ζ and PV, respectively, the optimal solution to (1) can be found as:
L ( I 1 X , P V , S I N R A V X , V 1 X , λ , ζ , μ ) λ = 0
0 = q λ λ ( P V | h A V X | 2 S I N R A V X m a x N o B I 1 X ) λ ζ ( P V m a x P V ) λ μ ( S I N R A V X , V 1 X S I N R t h ) λ
0 = P V | h A V X | 2 S I N R A V X m a x N o B I 1 X
I 1 X = P V | h A V X | 2 S I N R A V X m a x N o B
L ( I 1 X , P V , S I N R A V X , V 1 X , λ , ζ , μ ) ζ = 0
0 = q ζ λ ( P V | h A V X | 2 S I N R A V X m a x N o B I 1 X ) ζ ζ ( P V m a x P V ) ζ μ ( S I N R A V X , V 1 X S I N R t h ) ζ
P V = P V m a x
L ( I 1 X , P V , S I N R A V X , V 1 X , λ , ζ , μ ) μ = 0
0 = q μ λ ( P V | h A V X | 2 S I N R A V X m a x N o B I 1 X ) μ ζ ( P V m a x P V ) μ μ ( S I N R A V X , V 1 X S I N R t h ) μ
S I N R A V X , V 1 X = S I N R t h
The expressions obtained from Equations (21), (24), (27), (31), (34) and (37) play a significant role in enhancing the system performance, since they find the optimum required distance between AV2X, which give the user the required enhanced system performance and the required user satisfaction. Additionally, controlling the transmission power leads to the decrease of total power consumption and also the cost, as well as decreasing the interference among other existing devices.
Four different metrics have been considered to evaluate the system performance of the proposed model, which are:
  • Throughput (S): the number of the successful received packets from any source to any destination in a unit time. Throughput is usually represented in bit per second (bit/s or bps). For the proposed model, the throughput can be expressed by the following formula [34]:
    S = T o t a l   r e c e i v e d   p a y l o a d T o t a l   t r a n s m i s s i o n   t i m e
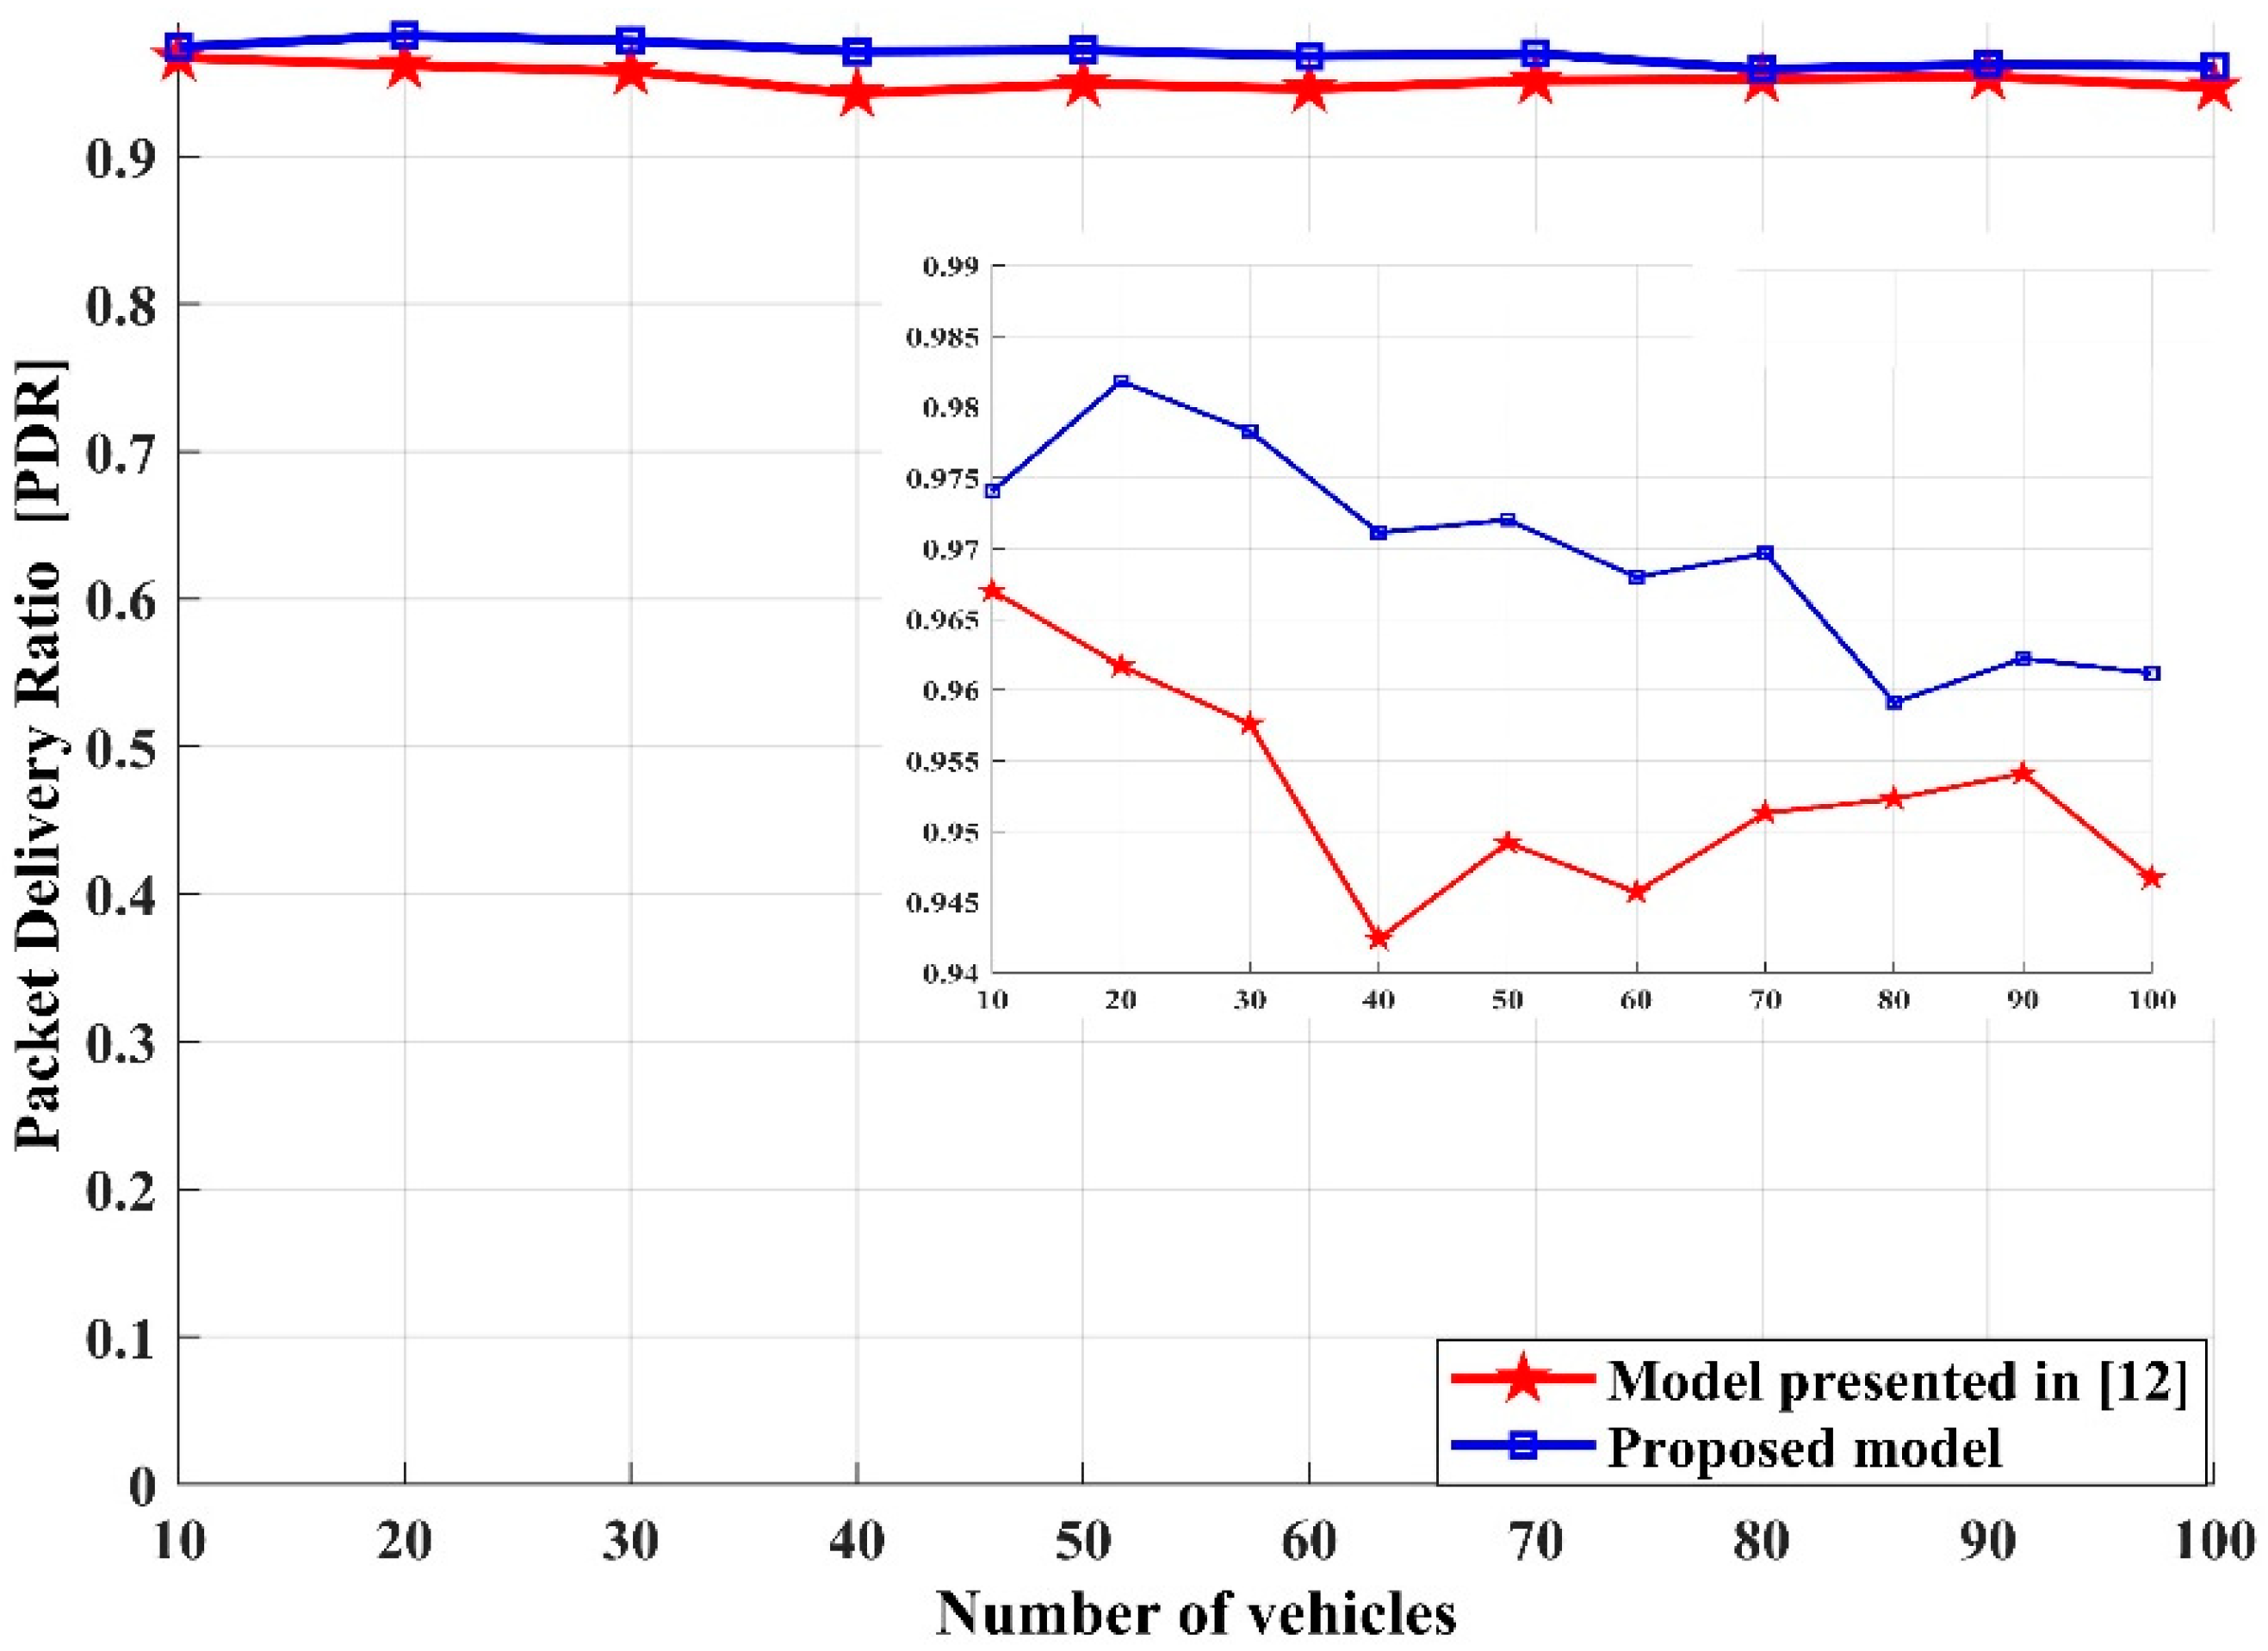
  • Packet delivery ratio (PDR): the ratio of the number of successfully received packets by the destinations to those generated by the sources. The increment of successful packet received by the destination nodes relative to the number of packets sent by the source nodes reflects how reliable and efficient the network is. Thus, PDR can be expressed as [34]:
    P D R = # r e c e i v e d _ p a c k e t s # s e n t _ p a c k e t s
  • Packet loss rate (PLR): packet loss rate occurs when the destination fails to receive one or more pieces of transmitted information travelling across a network. It is typically caused by the physical channel of the wireless network, or due to network congestion. Then, the packet loss rate can be calculated mathematically as the percentage of packets lost with respect to packets sent. The percentage of packets lost is measured as the difference between the numbers of sent packets and received packets. Thus, it is defined by the following equation [35]:
    P L R = # s e n t _ p a c k e t s # r e c e i v e d _ p a c k e t s # s e n t _ p a c k e t s
  • Average delivery latency (DL): the word latency is an important term that should be used to indicate any kind of delay in the network. Additionally, it can be defined as the total time taken by the transmitted data packet from one node to reach another node over a network; it is also called the network average-end-to-end-delay. Thus, the average delivery latency can be measured as the sum of the amount of time spent from the beginning of the transmission until the successful delivery of the packets at the destination over the total number of received packets by the destination [34]:
    D L = r e c e i v e d   p a c k e t s t i m e   s p e n t   t o   d e l i v e r   p a c k e t s # r e c e i v e d _ p a c k e t s

4. Numerical Results and Discussion

In this section, the performance of the proposed model is evaluated through Matlab and NS-2 software simulation package in terms of best inter-vehicle position, and optimum transmission distance between V2X and V2V, to enhance the system reliability and efficiency which is presented by throughput, packet delivery ratio and packet loss rate. The proposed approach is also examined in terms of average delivery latency.
In the simulation model, all vehicles keep the same distance between each other. Additionally, the 2-s rule is followed [28] for road safety and for stopping in time to avoid collision and reducing the rate of accidents. This rule does not always come with specific distances that must be observed, but the general rule is that each driver must keep sufficient distance between his/her vehicle and the vehicle in front. This required minimum distance or time between the vehicles should be two seconds in order to avoid an accident if the car in front stops suddenly or reduces speed. For example, if a driver is driving a car with a speed of 40 km/h, then the minimum safety distance between his/her vehicle and the front vehicles must be approximately 23 m.
For the mobility generation, mobility-files in NS-2 have been built. In addition, to evaluate the system performance, some information is required to be extracted from the simulations. Hence, an AWK script was implemented to extract these metrics from the trace files generated during the simulation using NS-2. Moreover, in the suggested scenarios, all vehicles are running at an average speed which is 60 km/h, the lane width in the road is 3.5 m, and the distance between two consecutive vehicles is approximately 34 m based on the 2-s rule. The network parameters used for simulation are listed in Table 2.
Figure 3 depicts the best position of the relay-vehicle versus the distance between AV2X at various QoS requirements. As can be observed, when the transmission power increases, especially with high SINRth, the distance between the relay-vehicle and the destination must decrease to fulfill the system requirements. In addition, it can be noticed that when the transmission distance between AV and X is less than or equal to 50 m (dAVX 50 m) there is no need for a cooperative link with different required QoS. It also means that, at this transmission distance, the best relay-vehicle position from the destination is zero or less than 1 m, which means that the relay-vehicle position will be at the destination. Thus, in that case, the direct communication will be the efficient way for communication between AV2X. Additionally, it can be shown that increasing the transmission distance between AV and X increases the need for cooperative communication. At the required SINRth of 20 dB, which is considered the high system requirement, it can be seen that the transmission power (PV) is 17 dBm, the distance between AV2X is 200 m, and the required position between the relay-vehicle and the destination is 12.5 m. Conversely, when the transmission power is 23 dBm, the relay-vehicle position is 20 m. On the other hand, when the required system performance decreases, the relay-vehicle position from the destination increases, e.g., when SINRth is 0 dB, the transmission power is 17 dBm and 23 dBm and dAVX is 200 m, then the relay-vehicle position between AV2X is 57.7 m and 94.22 m, respectively. The obtained results show that the required system QoS affects the position of the relay-vehicle when needed, as decreasing the distance between relay-vehicle and the destination decreases the packet loss due to the channel conditions.
The best relay-vehicle position is examined again versus different signal-to-interference-plus-noise threshold (SINRth) for transmission distance between AV and X equal to 100 m and with two different AV and vehicle transmission power. In this scenario, it is assumed that the system suffers from high interference which means that all the devices sharing the same spectrum have maximum transmission power. Thus, it can be demonstrated from Figure 4 that increasing the vehicle transmission power leads to the relay-vehicles being far from the destination, regardless of the value of the required SINRth. Additionally, it can be noticed that increasing the required SINRth leads to a decrease in the distance between relay-vehicle and the destination, regardless of the value of the transmission power. It can be noted from Figure 4, when PV is 17 dBm and the required SINRth is 20 dB, that the best relay-vehicle position from the destination (dV1X) must be 3.247 m in order to fulfill the required system performance, while when PV is 23 dBm, the position of the relay-vehicle must be 5.277 m from the destination. On the other hand, when the required SINRth is 0 dB and PV is 17 dBm, the distance between relay-vehicle and destination (dV1X) is 15.37 m, while when PV equals 23 dBm, dV1X is 24.51 m. Therefore, it can be concluded from this figure that the required SINRth plays an important role in deciding at what distance the relay-vehicle should be located from the destination.
Furthermore, Figure 5 depicts the best relay-vehicle position versus vehicle transmission power. Assuming that dAVX is 100 m andtwo different SINRth, the system experiences high interference. Then, under these conditions, it can be mentioned that increasing the vehicle transmission power increases the required distance between the relay-vehicle and destination. As can be noticed from Figure 5, when SINRth is 0 dB and PV is 23 dBm, the best position relay-vehicle must be located at 24.71 m from the destination; conversely, if PV is 0 dBm, the relay-vehicle should be at a distance of 4.258 m from the destination. Furthermore, increasing the SINRth with high interference leads to the need for the relay-vehicle to be located near the destination to try to overcome the interference and fulfill the QoS requirement, e.g., when SINRth is 20 dB and PV is 23 dBm, the distance between the destination and the relay-vehicle is 5.226 m. This means that for this required SINRth, decreasing PV decreases the location of the relay-vehicle from the destination. It can be concluded from this figure that any transmitting vehicle should adapt the transmission power based on the required QoS. It also reflects the role of the transmission power in deciding where the inter-vehicles should be located for communication with everything to obtain an adequate and efficient communication.
Figure 6 shows the overall system data rate versus SINRth for the proposed model compared with the direct communication between AV2X, assuming that dAVX is 100 m and PV is 23 dBm. It can be mentioned from Figure 6 that, using the adaptive proposed model, sending the information to the destination either with direct link or with cooperative communication gradually enhances the system performance. Additionally, it demonstrates how finding the best position of the relay-vehicle increases the overall system data rate. As mentioned, the adaptive proposed model increases dramatically in terms of data rate compared with the direct communication link. This figure shows how the adaptive proposed model enhances the system performance.
Additionally, Figure 7 shows the performance of the adaptive proposed model under different conditions such as interference, SINRth, vehicle transmission power and dAVX equal to 100 m. It can be noticed from Figure 7 that the proposed adaptive model outperforms the direct communication between AV2X in terms of overall system data rate for the two assumed SINRth (0 dB and 20 dB). It also shows that increasing the required SINRth increases the overall system data rate. The result obtained in Figure 7 is correlated with the one obtained in Figure 6, as it proves that the adaptive proposed model enhances the system performance by deciding based on the channel conditions whether to use direct communication or cooperative communication through finding the best relay-vehicle position for communication of the transmitting AV with the destination.
The overall system throughput for the proposed model compared with the model presented in [12] is shown in Figure 8 at two varying vehicles’ velocities, 20 km/h and 60 km/h. The proposed model clearly outperforms the performance of the model suggested in [12], as, in [12], the author utilizes the cooperative communication without taking into account the required position of the relay-vehicle. Therefore, the proposed model enriches system throughput, thanks to the assisted role of the inter-vehicle communication in addition to V2V and V2I distance optimization. Furthermore, when using the best position vehicles as a relay between V-I, the distance between V-I gradually decreases. Accordingly, the main reason for the increment of the throughput of the proposed model is the best position of the intermediate vehicles, which promotes easy and effective route selection and transmission of V2I or from V2V. Therefore, from this result, it can be concluded that the choosing of the best position of vehicles to communicate with each other or to relay information to I plays a significant key role in increasing the efficiency of the communication between V2V and V2I. It is also noticed that the throughput of the proposed model and the model presented in [12] both decrease when increasing the number of transmitting vehicles through the road. This is mainly due to congestion in medium access and increased operation overhead at the nodes that are the vehicle-source, as well as the relay at the same time. Increasing the numbers of vehicles contributes to the increment of the number of transmitted packets, which raises the probability of packet losses and increases the length of retransmission time.
The packet delivery ratio (PDR) of the proposed model is evaluated and compared with the model proposed in [12]. Figure 9 shows the ratio of the packets that successfully reach the destination for the proposed model and the model illustrated in [12], respectively, at two average vehicles’ velocities of 20 km/h and 60 km/h. As it can be seen from the zoomed illustration in Figure 9, the proposed model has an enhanced of PDR when comparing it with the competitor model [12]. It is also mentioned that, in both models, PDR is affected by the change in vehicular density.
For both investigated models, PDR decreases gradually when the density of the vehicles increases, as the increment of the vehicular density means increasing the number of transmission vehicles which will cause the congestion and overhead in the network, and thus cause decreases in the PDR. The results obtained in this figure are justified by the results obtained in Figure 8, that choosing the best vehicle position to communicate with each other or to relay information to I is the main reason for the increment of PDR for the proposed model when comparing it with other models. Additionally, it justifies that the higher the information throughput, the higher the packet delivery ratio.
The overall system packet loss rate (PLR) for the proposed model and the model in [12] versus the number of transmitting vehicles are evaluated and examined in Figure 10 for two average vehicles’ velocities of 20 km/h and 60 km/h. It can be shown in Figure 10 that the proposed model has much lower PLR than the compared model [12], as choosing the best position of the intermediate vehicles leads to increasing the link reliability, either between V2V or V2I, and then decreasing the PLR. It is also mentioned that for the proposed model and the model suggested in [12], increasing the number of transmission vehicles affects the system performance in terms of PLR. Increasing the number of the transmission vehicles for both models increases the packet loss rate, which is caused by network congestion and physical channel conditions.
The result obtained in Figure 10 is correlated with the corresponding performance in throughput and PDR, as shown in Figure 8 and Figure 9, respectively.
Furthermore, to show that the proposed algorithm is efficient and reliable, it has been evaluated with other models proposed in [22]. Stochastic dynamic programming (SDP) is employed as a tool to analyze and solve network resource constraint and allocation issues [22]. In addition, it suggested an alternative solution called model predictive control algorithm (MPCA) that used approximation as a way to allocate resources over time in response to information on data transmission completion status. These two methods are suggested to enhance the system performance in terms of PDR and average delivery latency. Then, it was compared with the geographic-based spray and relay routing scheme (GSaR) proposed in [36].
As illustrated in Figure 11, the packet delivery ratio (PDR) versus the speed of the vehicles is evaluated once again for the proposed model and compared with the model presented in [22]. As illustrated in Figure 11, when the vehicle’s speed is 40 km/h, the PDR of the proposed model is 95.8075% and the PDR of SDP, MPCA and GSaR are 91%, 90% and 88%, respectively. Furthermore, the PDR of the proposed model is 96.6647% when the vehicle’s speed is 70 km/h, while the PDR of SDP, MPCA and GSaR are 90%, 92% and 95%, respectively. In addition, it is shown that when the speed of vehicles increases, it does not significantly affect the system PDR, which means that the proposed model is suitable for any vehicle mobility and speed. Additionally, the average of delivery latency of the proposed model is compared with the schemes proposed in [22]. Figure 12 depicts the performance of the proposed model in terms of average delivery latency. As one can observe from Figure 12, the proposed model has much lower average delivery latency compared with the schemes presented in [22].
This result is due to the optimum and suitable choice of the vehicle position to communicate with other vehicles or to relay information between source-vehicle and infrastructure which increases the link reliability, retransmission time and consequently decreases the average delivery latency.
For performance assessment under varying vehicle velocity, in order to imitate real multi-vehicle multi-speed roads, the proposed model has been investigated once again in terms of S, PDR and PLR. The road vehicles are classified into three groups, corresponding to three speed-limited lanes, with different velocities.
Each group has a velocity with ±δ of the road average velocity, where δ is the variation in vehicle velocity. Based on the new consideration, the attested vehicles’ velocity is classified as 50 km/h, 60 km/h and 70 km/h for the first, second and third lane, respectively, to emulate the realistic road traffic that has multi-lanes with vehicles moving at variable velocities.
The throughput has been examined once again versus the number of vehicles as shown in Figure 13. As illustrated, even at this approach of imitating practical roads, the proposed technique reveals superior performance compared with the compared model in [12] under varying vehicles’ velocity. This result shows how the proposed model has an efficient and reliable communication in the realistic road traffic. Additionally, the PDR has been studied under the same assumed conditions as illustrated in Figure 14. It can be shown that the proposed model has much higher PDR compared with the model presented in [12]. The results demonstrated in these figures comply with the results shown in Figure 13. Additionally, the results can be justified due to the optimum and suitable choice of the vehicle position offered by the proposed technique. These optimum vehicle positions are to communicate with other vehicles or to relay information between source-vehicle and infrastructure, which increases the link reliability.
Finally, the proposed model has been inspected for the same conditions in terms of PLR. As can be observed from Figure 15, the proposed model has a noticeably lower PLR than the model presented in [12], as the proposed model succeeds in increasing the link reliability either between V2V or V2I, and consequently decreases the PLR. It can be concluded from the three previous figures that the proposed model is efficient and reliable, even when the realistic road traffic that has multi-lanes with vehicles moving at variable velocities is considered.
The performance evaluation presented in Figure 3, Figure 4, Figure 5, Figure 6, Figure 7, Figure 8, Figure 9, Figure 10, Figure 11, Figure 12, Figure 13, Figure 14 and Figure 15, based on comparison with other models available in literature, shows how the proposed model increases the reliability and the effectiveness of the connectivity between V2V and V2I. Additionally, it was noted that there are many factors affecting the connection between V2V and V2I such as path loss, channel condition, vehicle mobility, density and vehicle speed. Then, it was shown that one of the suitable and adequate solutions is the proposed model, by finding the best inter-vehicle position either to communicate with other vehicles or to relay the information to the infrastructure. Based on the vehicle position, transmission power (PV) and the required system QoS, the optimum transmission distance between V2V and V2I has been identified to improve the link reliability and reduce the number of retransmissions by the reduction of the probability of link failure. Moreover, it helps improve the overall system performance in terms of increasing throughput, increasing packet delivery ratio, decreasing packet loss rate and decreasing average delivery latency. Clearly, to enhance the system performance and achieve the preferable QoS as clarified in this paper, the best inter-vehicle position should be selected, and the optimum distance between V2V and V2I should be determined based on the system conditions and requirements such as the outage probability, Pout, transmission power, PV, and channel quality in terms of α, vehicle mobility, vehicle density and vehicle speed. The findings of this work can assist in deciding with which vehicle the connection should be established between vehicles-to-vehicles, and how the connection between vehicles-to-infrastructure should be employed to have a proper and reliable connection either between V2V or V2I to improve the overall system performance.

5. Conclusions and Suggestion for Future Work

This paper proposes an optimized framework for AV through cooperation communication in order to enhance the connectivity for vehicular communication to achieve efficient and reliable road traffic communications. The proposed model is based on an optimization model in terms of finding the best position of the inter-vehicles to efficiently communicate with AV or to relay messages between autonomous vehicles and everything. Furthermore, based on this optimization model, the system performance is evaluated in terms of the reliability and effectiveness of the proposed model. It has been shown that the autonomous vehicle best position and the optimum transmission distance between V2V and V2I in a vehicular network can vary and change under certain environmental conditions such as outage probability, transmission power and path loss exponent, vehicle mobility, vehicle density and vehicle speed. The results presented in this paper can be used to form an adaptive intelligent transmission system, where each autonomous vehicle, based on the changing environmental conditions, will be able to decide which the appropriate inter-vehicle to communicate with is. Additionally, this enables determination of the optimum required transmission distance between AV2V and V2X to achieve the preferable QoS in a dynamic way, in terms of achieving the highest throughput, packet delivery ratio and fairness index with the lowest possible packet loss rate and average delivery latency, which makes this proposed model a very promising solution for future development of vehicular communication systems. The proposed model is built based on assumption and network parameters that may change due to channel conditions. The model is suitable for choosing one relay node, but multiple relay nodes should be considered in future work to show what system enhancement can be achieved. Furthermore, the proposed model can be used for traffic control and course plotting for AV in an urban area demanding continuous course correction, leading to a decrease of AV accidents by obtaining continuous reliable and efficient information. However, further investigation is needed for more practical related applicability assessment, as several aspects can deteriorate the system performance, like distance detection proximity sensor dependency, crossings/bridge road changes in maps, and interference with power line towers, etc.

Author Contributions

Conceptualization, R.A.O. and A.K.A.; methodology, R.A.O.; software, R.A.O.; validation, R.A.O.; formal analysis, R.A.O. and A.K.A.; investigation, R.A.O. and A.K.A.; resources, R.A.O. and A.K.A.; data curation, R.A.O.; writing—original draft preparation, R.A.O.; writing—review and editing, R.A.O. and A.K.A.; visualization, R.A.O.; supervision, A.K.A. All authors have read and agreed to the published version of the manuscript.

Funding

This research received no external funding.

Institutional Review Board Statement

Not applicable.

Informed Consent Statement

Not applicable.

Data Availability Statement

Not applicable.

Conflicts of Interest

The authors declare no conflict of interest.

Symbols

B System bandwidth
B A V V 1 The bandwidth of the uplink channel between autonumous vehicle-to-vehicle
B V 1 X The bandwidth of the uplink channel between vehicle-to-everyhing
C1,C2,C3Lagrangian optimization constraints
DRoad length
DLAverage delivery latency
dAVXDistance between autonomous vehicle and everything
dAV1Distance between autonomous vehicle and relay-vehicle
dV1XDistance between relay-vehicle and everything
GNumber of vehicle
h A V V 1 Fading channel coefficient between autonomous vehicle-relay-vehicle
h A V X Fading channel coefficient between autonomous vehicle-everything
h V 1 X Fading channel coefficient between rely-vehicle-everything
h I k X Fading co-channel interference at the destination due to AVX link
h I r X Fading co-channel interference at the destination due to relay-vehicle-destination link
h S D Fading channel coefficient between any source-destination
h S D o Complex Gaussian random variable to model fading phenomena
I 1 X Interference at trsnsmission link between autonomous vehicle-everything
I 2 X Interference at trsnsmission link between relay-vehicle-everything
I V 1 Interference at trsnsmission link between autonomous vehicle-relay-vehicle
N O Noise power spectral density
ρDensity of vehicle
PDRPacket delivery ratio
PLRPacket loss rate
PLSDPath loss of S-D link
PLAVV1Path loss between autonomous vehicle and relay-vehicle
PLAVXPath loss between autonomous vehicle any destination
PLV1XPath loss between relay-vehicle and any destination
PVTransmitted power of any vehicle or autonomous vehicle
PVmaxMaximum transmitted power of any vehicle or autonomous vehicle
PIkInterference transmission power of the devices which share AVX link
PIrInterference transmission power of the devices which share relay-vehicle-destination link
PLoPath loss constant
qThe weight position of the inter-vehicles
R A V V 1 Data rate between autonomous vehicle and relay-vehicle
R A V X Data rate between autonomous vehicle and everything
R V 1 X Data rate between relay-vehicle and relay-vehicle
R A V X V 1 X Overalll system data rate
SThroughput
S I N R t h Signal-to-interference-plus-noise-ratio -threshold
S I N R A V m a x Maximum required signal-to-interference-plus-noise for AVX link
S I N R A V X , V 1 X Total signal-to-interference-plus-noise-ratio from AVX link and V1X link
S I N R A V V 1 Signal-to-interference-plus-noise-ratio from AVV1 link
ζ, μ, λNon-negative Lagrangian multipliers
αPath loss exponent
δTolerance variation in vehicle speed

References

  1. Guevara, L.; Cheein, F.A. The Role of 5G Technologies: Challenges in Smart Cities and Intelligent Transportation Systems. Sustainability 2020, 12, 6469. [Google Scholar] [CrossRef]
  2. Gohar, A.; Nencioni, G. The Role of 5G Technologies in a Smart City: The Case for Intelligent Transportation System. Sustainability 2021, 13, 5188. [Google Scholar] [CrossRef]
  3. Galarza, M.; Paradells, J. Improving road safety and user experience by employing dynamic in-vehicle information systems. IET Intell. Transp. Syst. 2019, 13, 738–744. [Google Scholar] [CrossRef]
  4. Ahangar, M.N.; Ahmed, Q.Z.; Khan, F.A.; Hafeez, M. A Survey of Autonomous Vehicles: Enabling Communication Technologies and Challenges. Sensors 2021, 21, 706. [Google Scholar] [CrossRef]
  5. Wu, X.; Subramanian, S.; Guha, R.; White, R.G.; Li, G.; Lu, K.W.; Bucceri, A.; Zhang, T. Vehicular communications using DSRC: Challenges, enhancements, and evolution. IEEE J. Sel. Area Commun. 2013, 31, 399–408. [Google Scholar]
  6. Yang, Y.; Fei, D.; Dang, S. Inter-Vehicle Cooperation Channel Estimation for IEEE 802.11p V2I Communications. IEEE Commun. Netw. 2017, 19, 227–238. [Google Scholar] [CrossRef]
  7. Vinel, A.; Lyamin, N.; Isachenkov, P. Modeling of V2V Communications for C-ITS Safety Applications: A CPS Perspective. IEEE Commun. Lett. 2018, 22, 1600–1603. [Google Scholar] [CrossRef]
  8. Wang, R.; Xu, Z.; Zhao, X.; Hu, J. V2V-based method for detection of road traffic congestion. IET Intell. Transp. Syst. 2019, 13, 880–885. [Google Scholar] [CrossRef]
  9. Yang, L.; Li, H. Vehicle-to-vehicle communication based on a peer-to-peer network with graph theory and consensus algorithm. IET Intell. Transp. Syst. 2019, 13, 280–285. [Google Scholar] [CrossRef]
  10. Chen, J.; Mao, G.; Li, C.; Zafar, A.; Zomaya, A.Y. Throughput of Infrastructure-Based Cooperative Vehicular Networks. IEEE Trans. Int. Trans. Syst. 2017, 18, 2964–2979. [Google Scholar] [CrossRef] [Green Version]
  11. Abbas, F.; Fan, P.; Khan, Z. A novel reliable low-latency multipath routing scheme for vehicular ad hoc networks. EURASIP J. Wirel. Commu. Net. 2018, 1, 1–19. [Google Scholar] [CrossRef] [Green Version]
  12. Osman, R.A.; Peng, X.-H.; Omar, M.A. Adaptive cooperative communications for enhancing QoS in vehicular networks. Phys. Commun. 2019, 34, 285–294. [Google Scholar] [CrossRef] [Green Version]
  13. Chen, J.; Mao, G.; Li, C.; Liang, W.; Zhang, D.-g. Capacity of Cooperative Vehicular Networks with Infrastructure Support: Multiuser Case. IEEE Trans. Veh. Commun. 2018, 67, 1546–1560. [Google Scholar] [CrossRef] [Green Version]
  14. Wang, T.; Wang, X.; Cui, Z. Survey on cooperatively V2X downloading for intelligent transport systems. IET Intell. Transp. Syst. 2019, 13, 13–21. [Google Scholar] [CrossRef]
  15. Haque, K.F.; Abdelgawad, A.; Yanambaka, V.P.; Yelamarthi, K. LoRa Architecture for V2X Communication: An Experimental Evaluation with Vehicles on the Move. Sensors 2020, 20, 6876. [Google Scholar] [CrossRef] [PubMed]
  16. Ge, X.; Cheng, H.; Mao, G.; Denis, B.; Raulefs, R.; Wymeersch, H. Implicit Cooperative Positioning in Vehicular Networks. IEEE Trans. Intell. Transp. Syst. 2018, 19, 3964–3979. [Google Scholar]
  17. Xiao, H.; Chen, Y.; Zhang, Q.; Chronopoulos, A.T.; Zhang, Z.; Ouyang, S. Joint Clustering and Power Allocation for the Cross Roads Congestion Scenarios in Cooperative Vehicular Networks. IEEE Trans. Intell. Transp. Syst. 2018, 20, 2267–2277. [Google Scholar] [CrossRef]
  18. Zhang, L. Cooperative adaptive cruise control in mixed traffic with selective use of vehicle-to-vehicle communication. IET Intell. Transp. Syst. 2018, 12, 1243–1254. [Google Scholar] [CrossRef]
  19. Celes, C.; Silva, F.A.; Boukerche, A.; de Castro Andrade, R.M.; Loureiro, A.A. Improving VANET Simulation with Calibrated Vehicular Mobility Traces. IEEE Trans. Mob. Comput. 2017, 16, 3376–3389. [Google Scholar] [CrossRef]
  20. Zhang, Z.; Xu, K.; Gan, C. The Vehicle-To-Vehicle Link Duration Scheme Using Platoon-Optimized Clustering Algorithm. IEEE Access 2019, 7, 78584–78596. [Google Scholar] [CrossRef]
  21. Trien, L.T.; Adachi, K.; Yamao, Y. Packet relay-assisted V2V communication with sectorised relay station employing payload combining scheme. IET Commun. 2018, 12, 458–465. [Google Scholar] [CrossRef]
  22. Madasamy, B.; Balasubramanian, P. Geographical angular zone-based optimal resource allocation and efficient routing protocols for vehicular ad hoc networks. IET Intell. Transp. Syst. 2018, 12, 242–250. [Google Scholar] [CrossRef]
  23. Jiang, F.; Li, C.; Gong, Z. Low Complexity and Fast Processing Algorithms for V2I Massive MIMO Uplink Detection. IEEE Trans. Veh. Technol. 2018, 67, 5054–5068. [Google Scholar] [CrossRef]
  24. Benabdallah, F.; Hamza, A.; Becherif, M. On the use of non-orthogonal multiple access for V2V message dissemination. IET Intell. Transp. Syst. 2019, 13, 1125–1129. [Google Scholar] [CrossRef]
  25. Feteiha, M.F.; Ahmed, M.H. Multihop Best-Relay Selection for Vehicular Communication over Highways Traffic. IEEE Trans. Veh. Technol. 2018, 67, 9845–9855. [Google Scholar] [CrossRef]
  26. Osman, R.A.; Zaki, A.I.; Abdelsalam, A.K. Novel Road Traffic Management Strategy for Rapid Clarification of the Emergency Vehicle Route Based on V2V Communications. Sensors 2021, 21, 5120. [Google Scholar] [CrossRef] [PubMed]
  27. Road Engineering Design Guidelines, Lane Width Guideline (City of Toronto, Transportation Services, June 2017). pp. 1–11. Available online: https://www.toronto.ca/ (accessed on 6 September 2021).
  28. CEDR Report. Safe Distance between Vehicles (La Grande Arche, Sud 19, April 2010). pp. 1–9.
  29. Wang, S.; Wang, D.; Li, C.; Xu, W. Full Duplex AF and DF Relaying Under Channel Estimation Errors for V2V Communications. IEEE Access 2018, 6, 65321–65332. [Google Scholar] [CrossRef]
  30. Kiela, K.; Barzdenas, V.; Jurgo, M.; Macaitis, V.; Rafanavicius, J.; Vasjanov, A.; Kladovscikov, L.; Navickas, R. Review of V2X–IoT Standards and Frameworks for ITS Applications. Appl. Sci. 2020, 10, 4314. [Google Scholar] [CrossRef]
  31. Wang, Y.; Sheng, M.; Wang, X.; Wang, X.; Wang, L.; Li, J. Mobile-edge computing: Partial computation offloading using dynamic voltage scaling. IEEE Trans. Commun. 2016, 64, 4268–4282. [Google Scholar] [CrossRef]
  32. Alkhalifa, I.S.; Almogren, A.S. Performance Analysis of Cooperative Relaying Systems with Power-Domain Non-Orthogonal Multiple Access. IEEE Access 2018, 6, 39839–39848. [Google Scholar]
  33. Wei, L.; Hu, R.Q.; Qian, Y.; Wu, G. Energy efficiency and spectrum efficiency of multihop device-to-device communications underlaying cellular networks. IEEE Trans. Veh. Technol. 2016, 65, 367–380. [Google Scholar] [CrossRef]
  34. Alkhalifa, I.S.; Almogren, A.S. NSSC: Novel Segment Based Safety Message Broadcasting in Cluster-Based Vehicular Sensor Network. IEEE Access 2020, 8, 34299–34312. [Google Scholar] [CrossRef]
  35. Da Silva, C.A.G.; Pedroso, C.M. MAC-Layer Packet Loss Models for Wi-Fi Networks: A Survey. IEEE Access 2019, 7, 180512–180531. [Google Scholar] [CrossRef]
  36. Cao, Y.; Sun, Z. Geographic based spray and relay (GSAR): An efficient routing scheme for DTNs. IEEE Trans. Veh. Technol. 2015, 64, 1548–1564. [Google Scholar] [CrossRef] [Green Version]
Figure 1. Flow chart for the proposed adaptive model.
Applsci 11 09089 g001
Figure 2. Vehicle communication through (a) AV2V communication, and (b) AV2X communication.
Applsci 11 09089 g002
Figure 3. Distance between AV2X vs. best relay-vehicle position.
Applsci 11 09089 g003
Figure 4. Required SINRthVX vs. best relay-vehicle position.
Applsci 11 09089 g004
Figure 5. Vehicle transmission power vs. best relay-vehicle position.
Applsci 11 09089 g005
Figure 6. Required SINRthVX vs. overall system data rate (bps).
Applsci 11 09089 g006
Figure 7. Vehicle transmission power vs. overall system data rate.
Applsci 11 09089 g007
Figure 8. System throughput vs. number of vehicles.
Applsci 11 09089 g008
Figure 9. Packet delivery ratio (PDR) vs. number of vehicles.
Applsci 11 09089 g009
Figure 10. Packet loss rate (PLR) vs. number of vehicles.
Applsci 11 09089 g010
Figure 11. Packet delivery ratio vs. number of vehicles.
Applsci 11 09089 g011
Figure 12. Average delivery latency (DL) vs. speed of the vehicles.
Applsci 11 09089 g012
Figure 13. System throughput (S) vs. number of vehicles at variable vehicles’ velocity.
Applsci 11 09089 g013
Figure 14. Packet delivery ratio (PDR) vs. number of vehicles at variable vehicles’ velocity.
Applsci 11 09089 g014
Figure 15. Packet loss rate (PLR) vs. number of vehicles at variable vehicles’ velocity.
Applsci 11 09089 g015
Table 1. Comparison between different related works and the proposed model.
Adopted TechniqueOptimization ProblemSystem Evaluation MetricInvestigation Scenario
[12]Cooperative communications for a combined V2I with V2V approach.Minimizing the total energy consumed per bit given an outage probability target, or maximizing the end-to-end throughput.
  • Energy consumption.
  • Throughput.
  • Packet delivery ratio.
  • Packet loss rate.
  • Average end-to-end-delay.
  • Direct V2I communication.
  • Multihop V2I communication.
  • Cooperative V2I communication.
[13]Cooperative communication for a combined use of V2I and V2V.Maximizing average data rate.Capacity achieved.Vehicles assist the transmission between V2I.
[15]Cooperative caching approach with mobility prediction in vehicular named data networking.N/A
  • Average access delay.
  • Average hit distance.
  • Sever request ratio.
  • Average hit ratio
Communication among vehicles using intra-cluster and inter-cluster communication over vehicle clusters.
[16]Implicit cooperative positioning algorithm that exploits the V2V connectivity.N/AThe vehicle location accuracy.Direct communication between V2V and between neighbors such as people, traffic light and vehicles.
[17]Cooperative communication between V2V.Optimization power allocation strategy.Outage probability.Communication among vehicles through cluster heads.
[18]Cooperative adaptive cruise control (CACC).N/A
  • Distances between V2V.
  • Velocity.
  • Tracking error.
Direct communication between V2V.
[20]Clustering algorithms.Platoon-optimized clustering.
  • Connectivity probability.
  • Average platoon size.
  • Spacing difference.
  • Speed.
Direct communication between V2V.
[21]Sectorised relay-assisted V2V communications.N/A
  • PDR.
  • Average PDR.
  • Average packet reception rate.
  • Direct communication between V2V.
  • Omnidirectional relay-assisted V2V communications.
[22]Relaxed approximation-based SDP.N/A
  • PDR.
  • Average delivery latency.
  • Overhead ratio.
Direct communication between V2V and between vehicles to roadsides.
[23]Massive multiple-input multiple-output (MIMO).N/A
  • Bit error rate.
  • Processing time.
Direct communication between V2V and between vehicles to roadsides.
[24]Non-orthogonal multiple access technique.N/A
  • System power control.
  • Throughput.
  • User fairness.
Communication between V2I using relay-vehicles.
[25]Multihop relaying into vehicular communication in highways.N/A
  • Probability of Error.
  • Bit error rate.
  • Outage probability.
Multihop relaying for V2V transmission.
Proposed modelMultihop relaying between V2X, direct V2X and V2V communications.Enhancing system QoS by finding the optimum autonomous inter-vehicle position to communicate with or to relay information to any destination.
  • Best relay-vehicle position between AV2X.
  • PDR.
  • Throughput.
  • Packet loss rate.
  • Average delivery latency.
Relaying communication between AV2X with direct communication between V2V.
Table 2. Simulation parameters.
ParametersValue
No−174 dBm
B10 MHz [26]
Rs1 bit/s/Hz
PVmax23 dBm [26]
Packet size512 bytes
fc5.9 GHz
α3
Simulation time1000 s
Node5–100
Speed20–70 km/h [22]
Traffic agentTCP
QueuePriQueue with size of 50 packets
Propagation modeTwo Ray Model
AntennaOmni-directional with height of 1 m
Routing ProtocolDSRC
Number of seed3
NoiseAWGN
ρmax100 vehicle/km
Publisher’s Note: MDPI stays neutral with regard to jurisdictional claims in published maps and institutional affiliations.

