
Low Thermal Expansion Machine Frame Designs Using Lattice Structures


Abstract
:1. Introduction

| Paper Reference | Structure Type | Material(s) | Effective CTE (10−6 K−1) |
|---|---|---|---|
| [8] | Lightweight cellular metal composites | Aluminium and Invar | −14 to 17.1 |
| [11] | Composites with extremal CTEs using topology optimisation | Invar and nickel | −4.97 to 35.0 |
| [12] | A porous material with planar negative CTE | VeroWhitePlus and TangoBlack Plus | −434 to 396 |
| [13] | Porous composites with tunable CTE | VeroWhitePlus and TangoBlack Plus | −300 to 1000 |
| [14] | A repeating hexagonal lattice with bi-material ribs | Two materials with CTE difference of 10−5 K−1 | Large positive, zero, and large negative |
| [24] | A honeycomb lattice with bi-material ribs | Invar and steel | Zero |
| [15] | 2D and 3D lattices with bi-material elements | Aluminium and copper | −68.1 |
| [25] | Planar chiral lattices and cylindrical shells | Stainless steel 431 or Al7075, and Invar | −65.77 to 91.64 |
| [16] | A continuous honeycomb structure with inserts | Two different CTE materials | Near-zero |
| [17] | An Octet bi-materials | Al6061 and Ti–6Al–4V | 0.17 |
| [26] | 2D metamaterials using bi-material re-entrant planar lattice structures | Stainless steel 431 or Al7075, and Invar | −3 to 2.5 |
| [27] | 3D metamaterials using bi-material re-entrant planar lattice structures | Stainless steel 431 or Al7075, and Invar | −8.69 to −5.22 |
| [28] | Micro-lattice composite structure | Two different CTE materials | Negative or zero |
| [20] | Stretch-dominated planar lattices with the low CTE with high stiffness | Al7075 and Ti–6Al–4V | Zero with high stiffness |
| [23] | Stretch-dominated planar lattices in the micro-scale (thin film) | Aluminium and titanium | −0.6 |
| [18] | 1D to 3D multi-stable architected materials with zero Poisson’s ratio and controllable CTE | Polyamide 12 and glass beads reinforced polyamide 12 | Large positive, zero, and large negative |
| [29] | Lattice cylindrical shells with tailorable axial and radial CTE | Stainless steel 431 or Al7075, and Invar | −64.6 to 88.0 |
2. Methodology
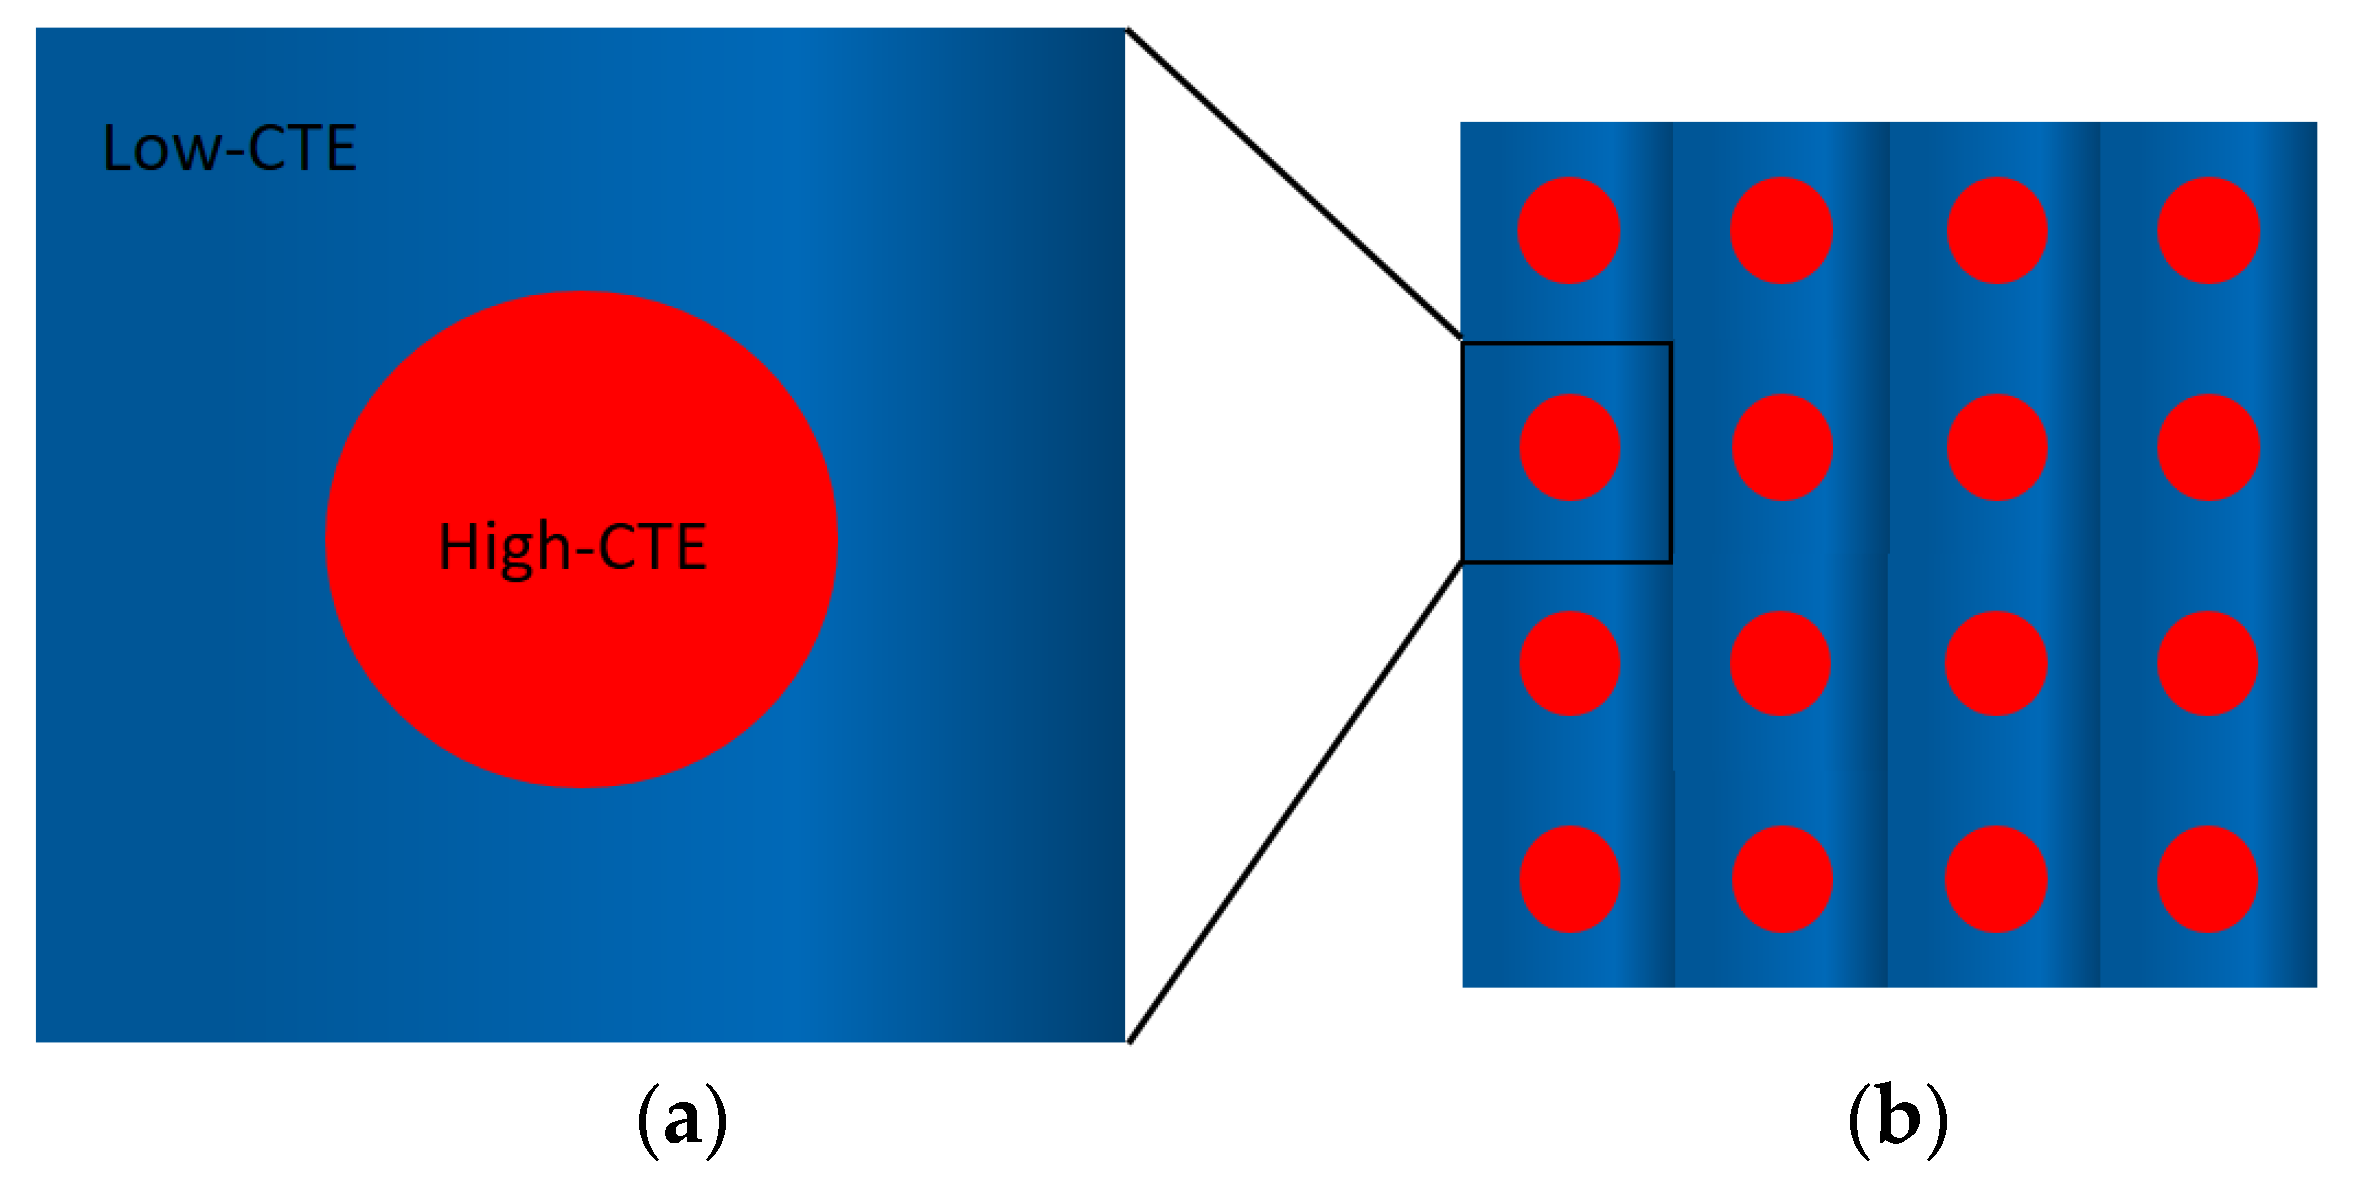
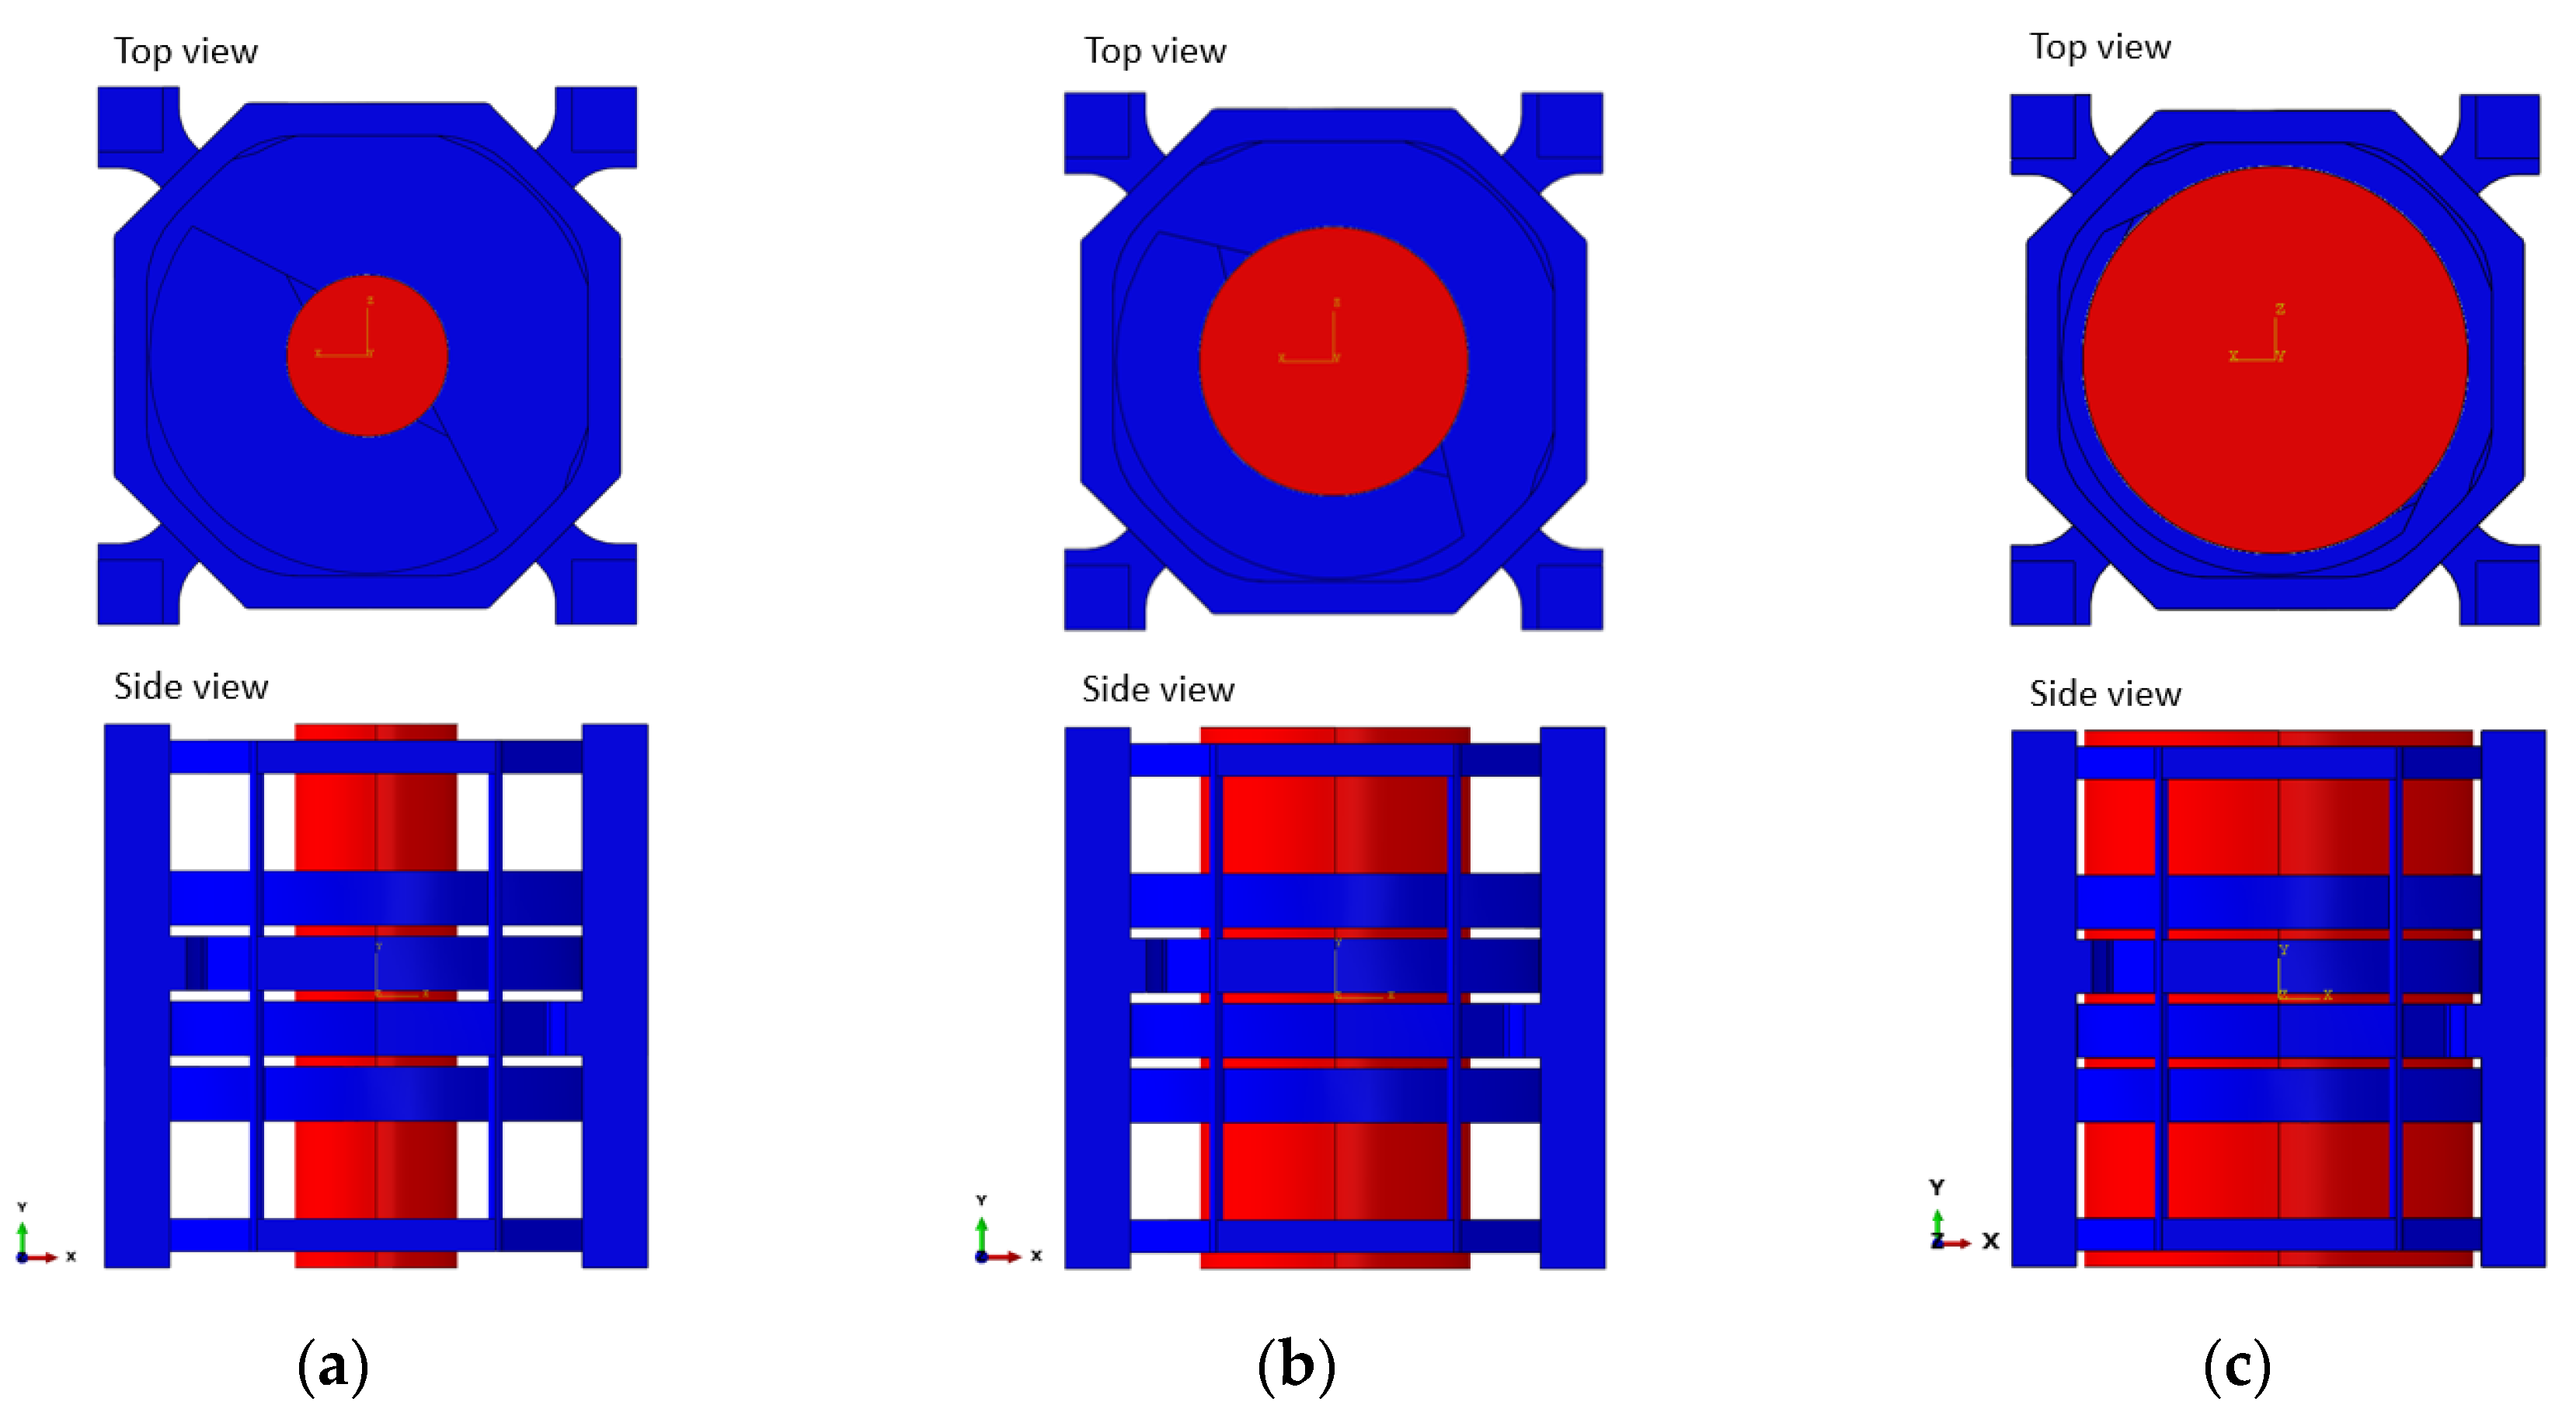
2.1. Motivation and Lattice Design Concept
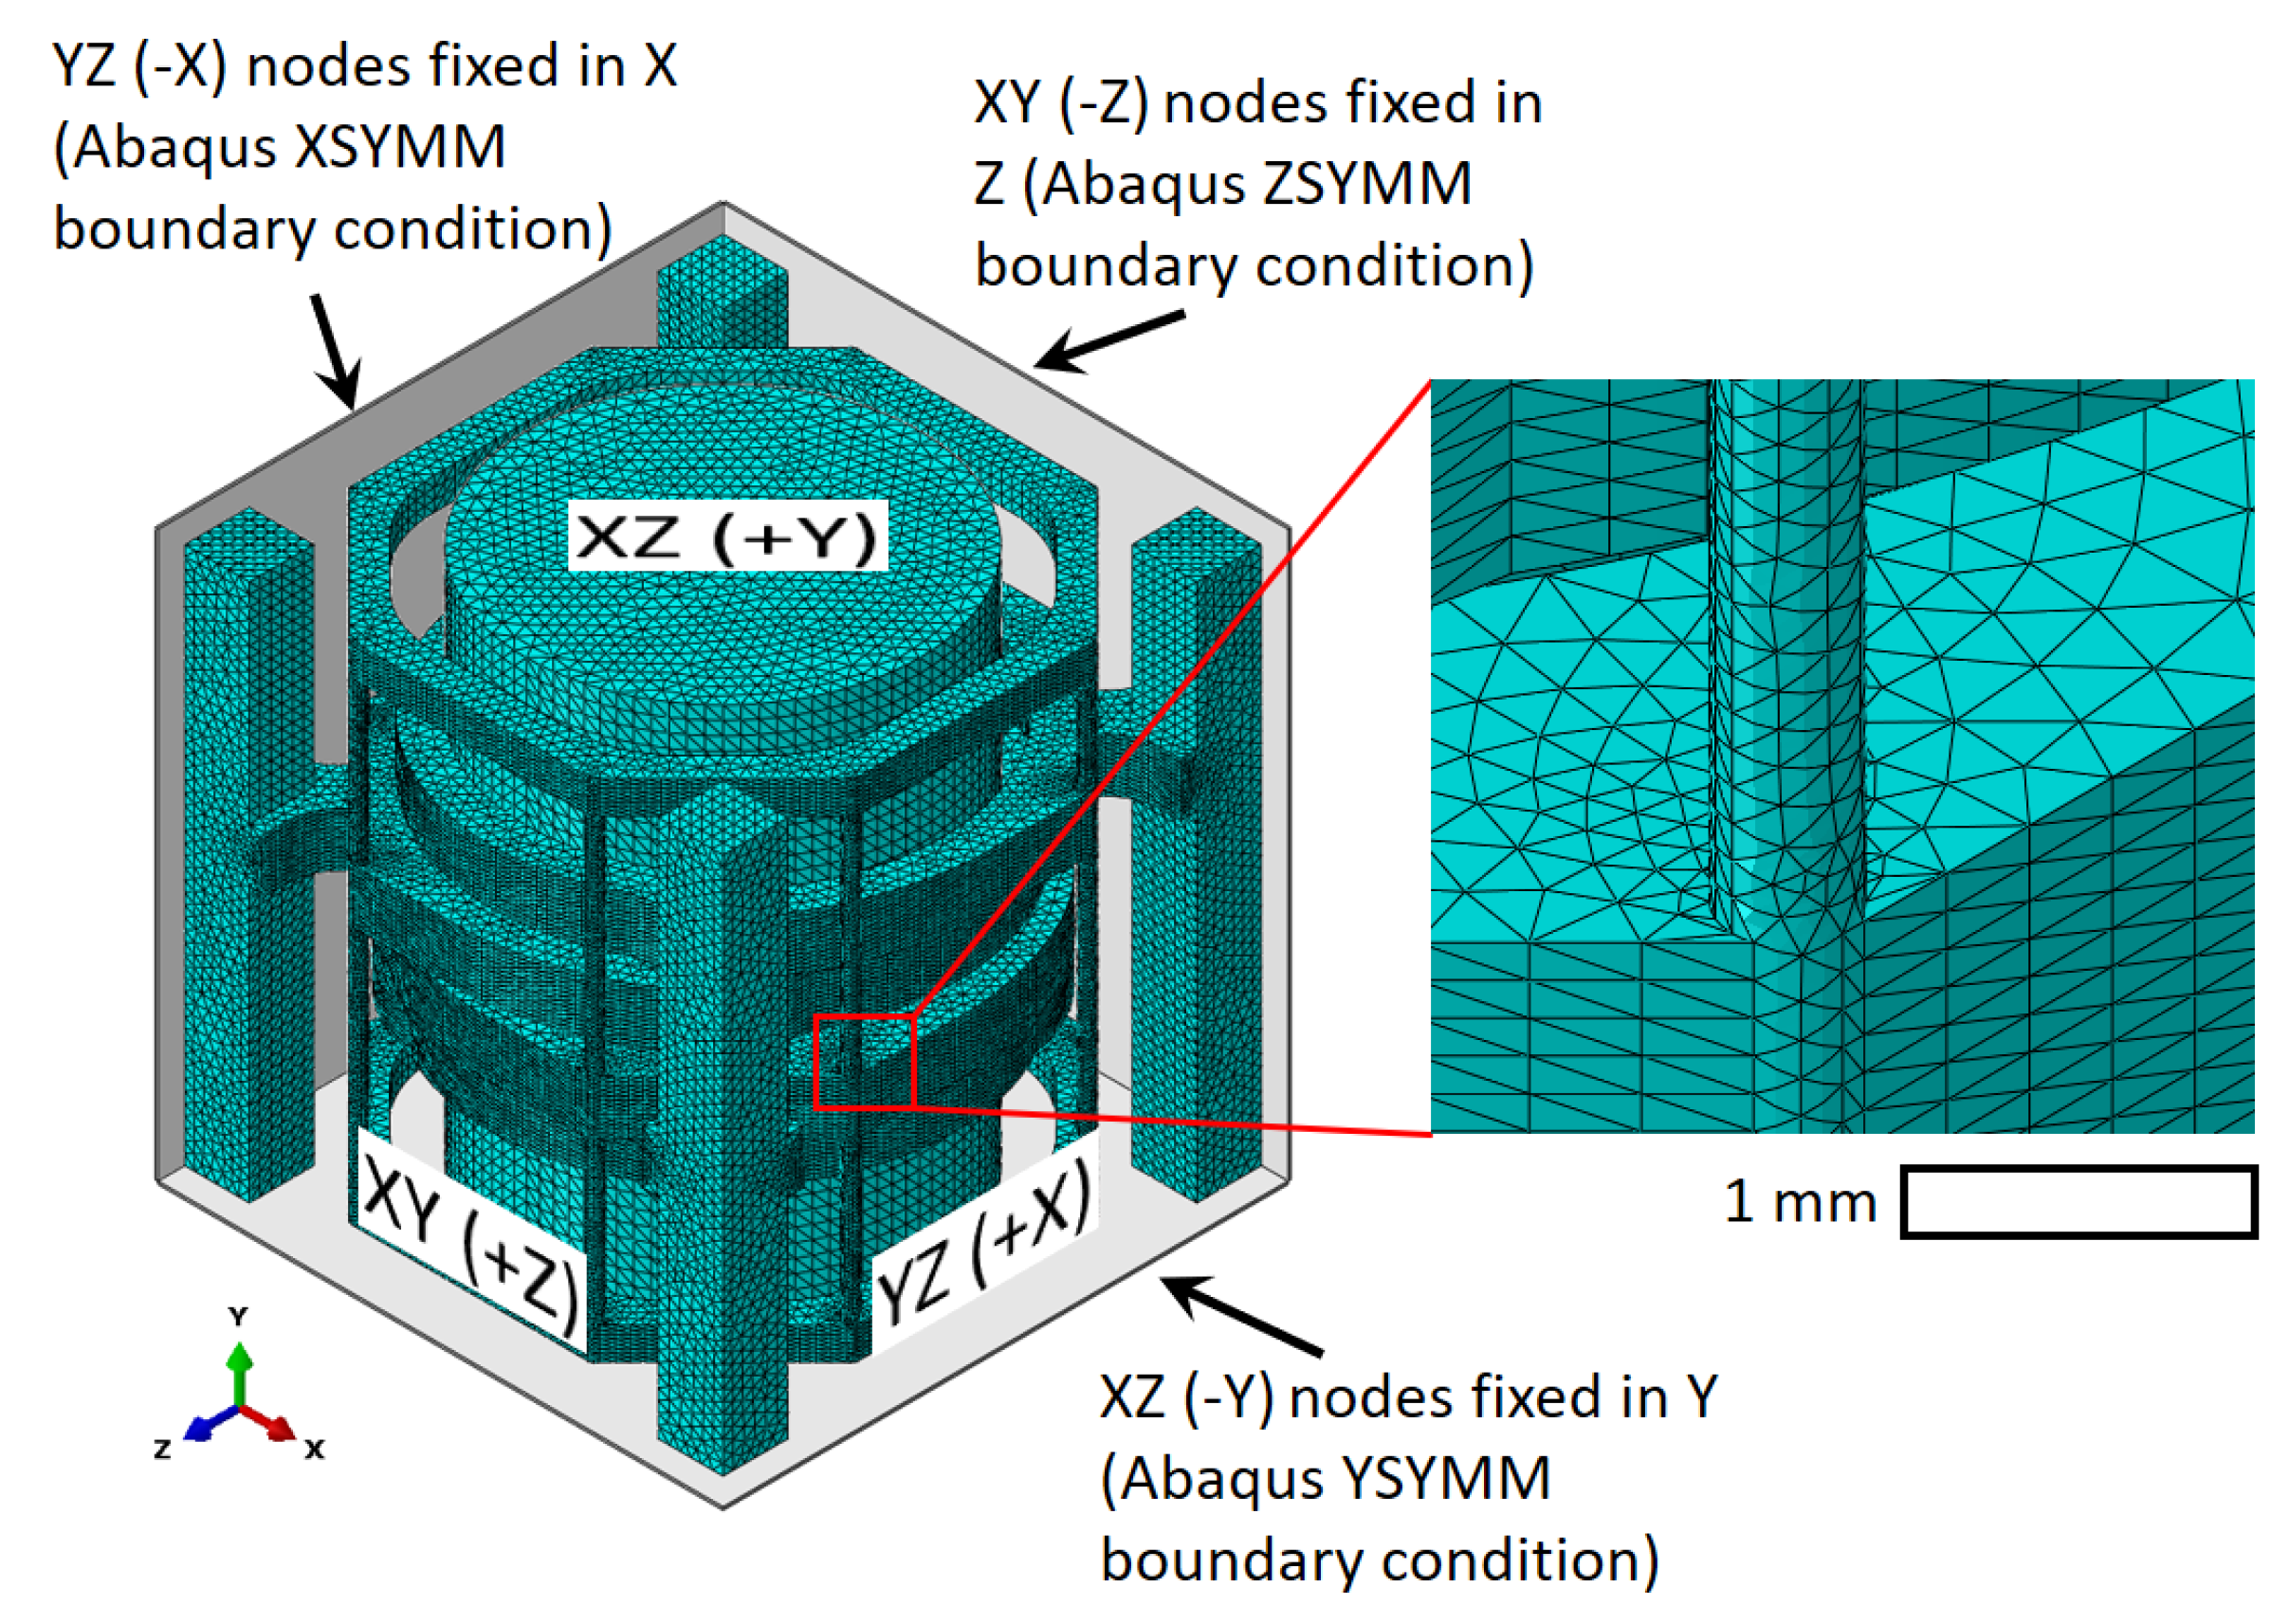
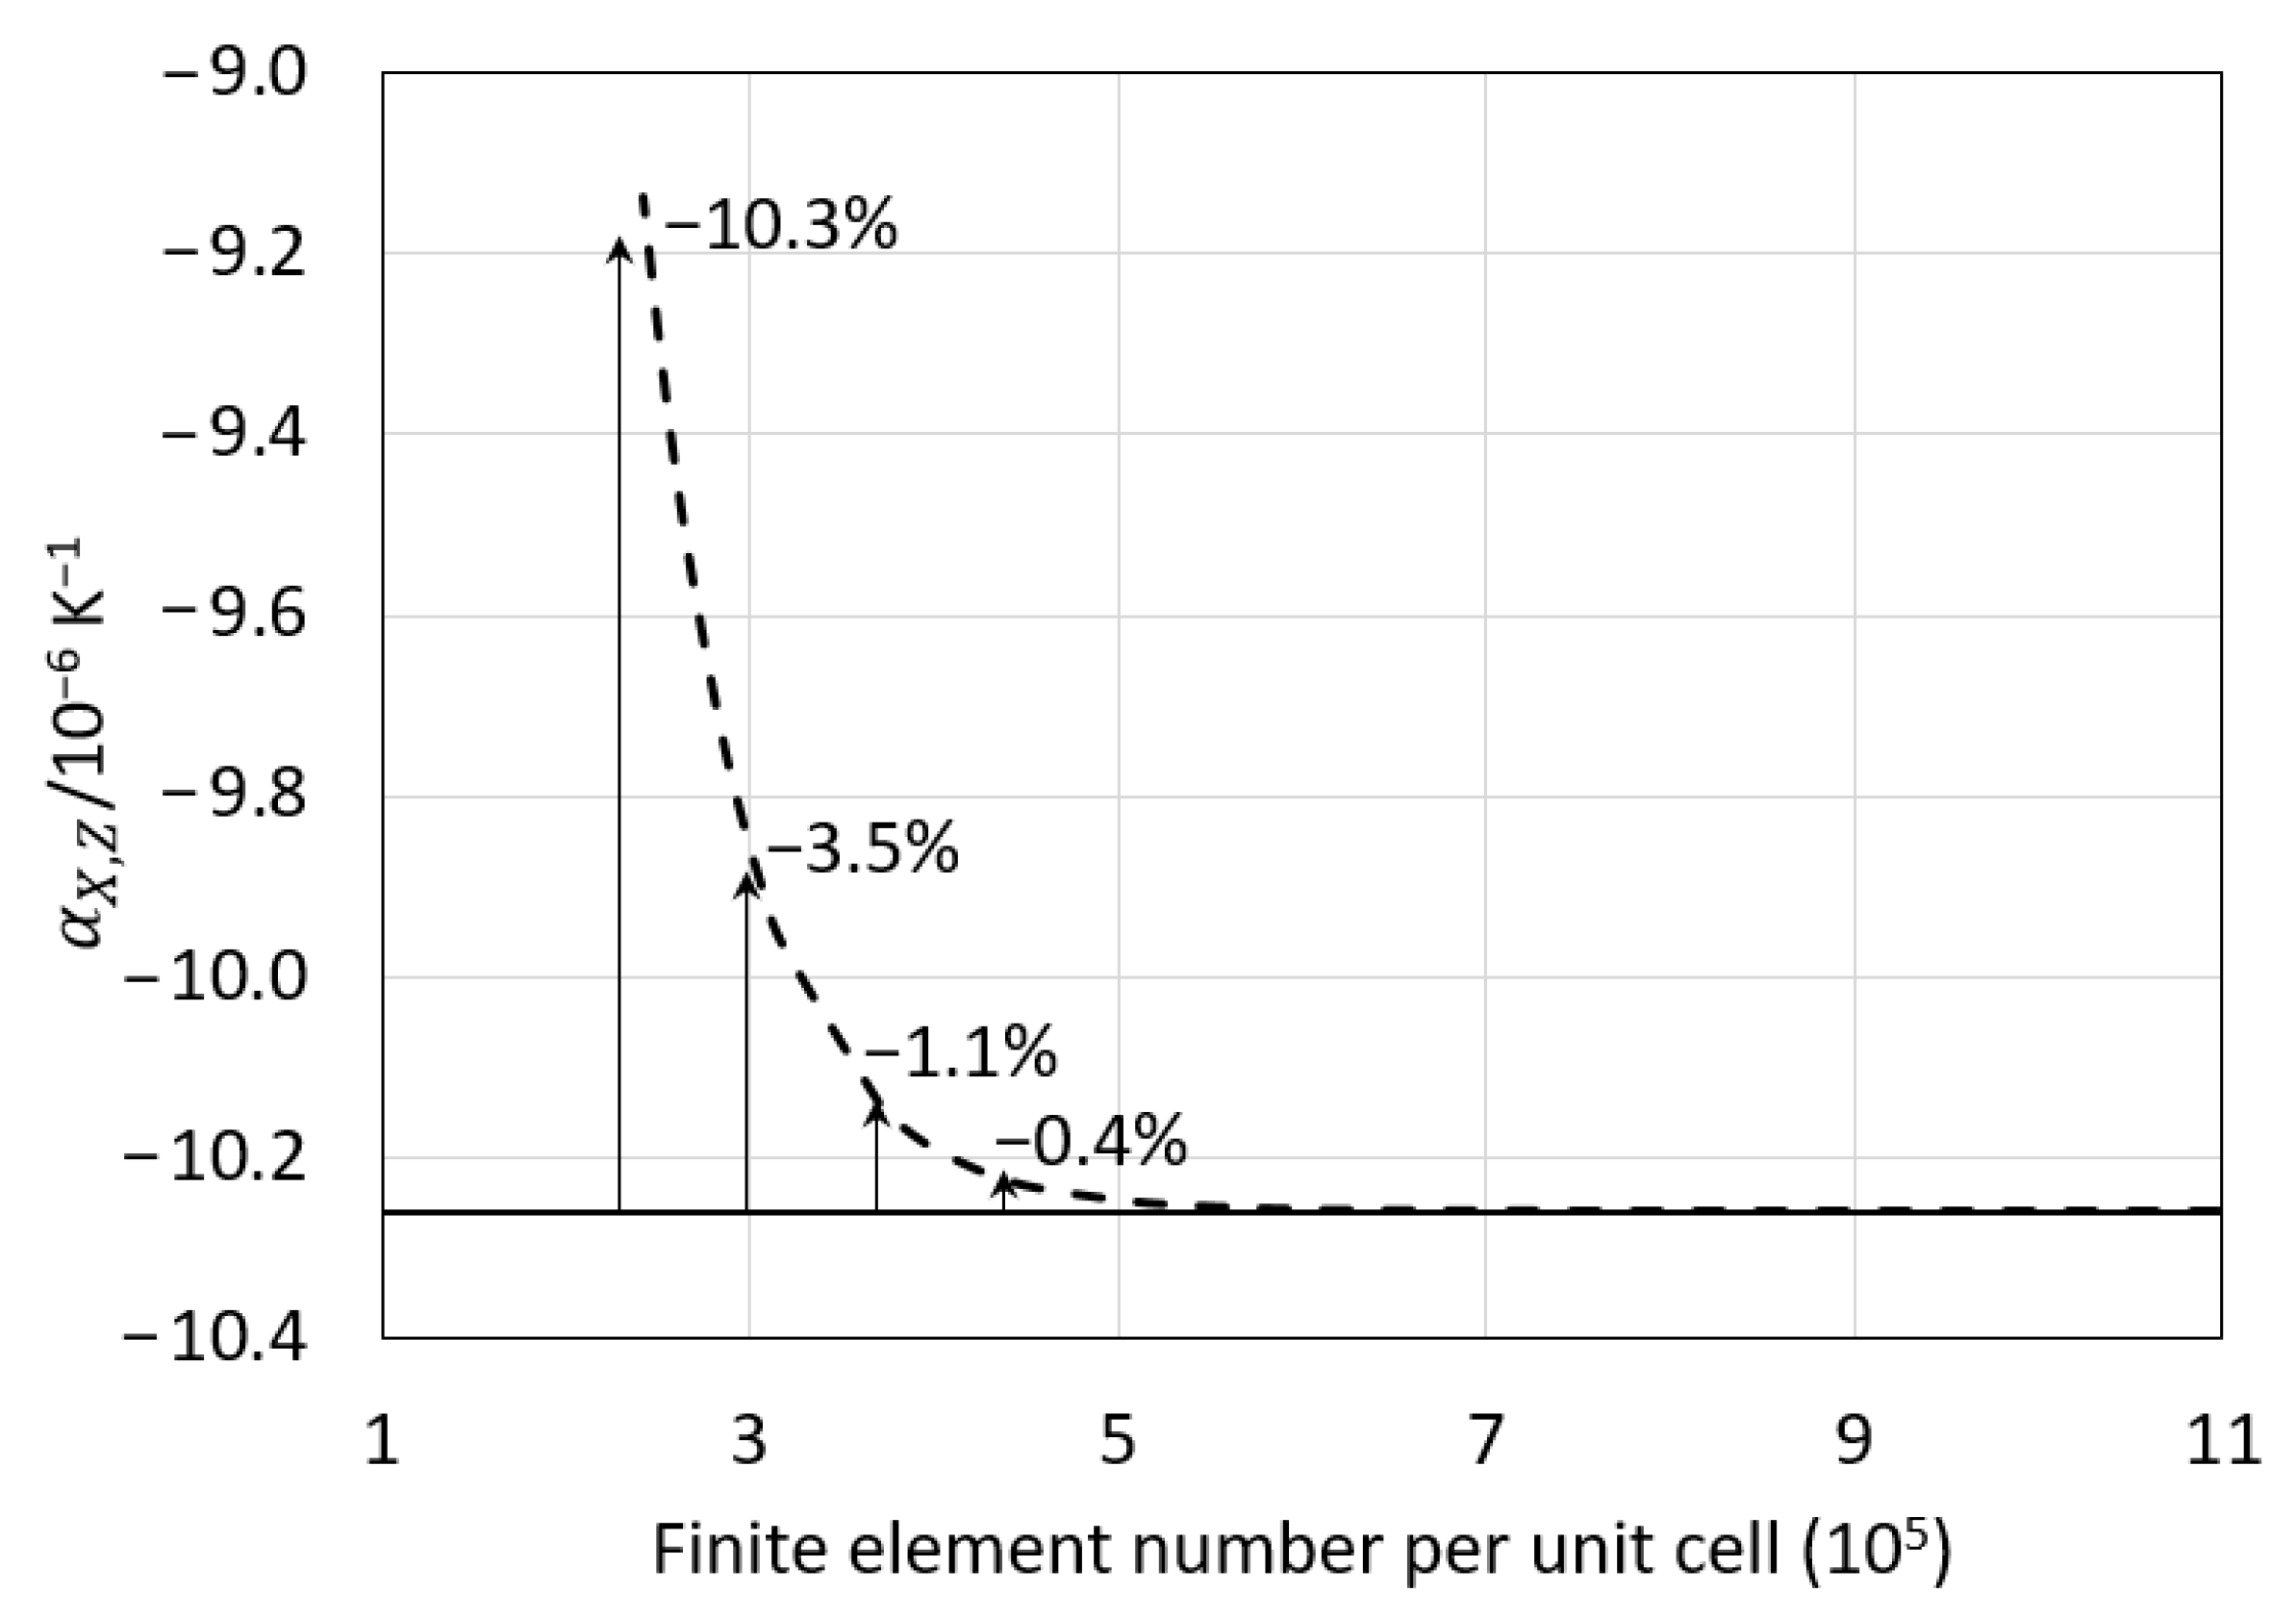
2.2. The Finite Element Method
3. Results
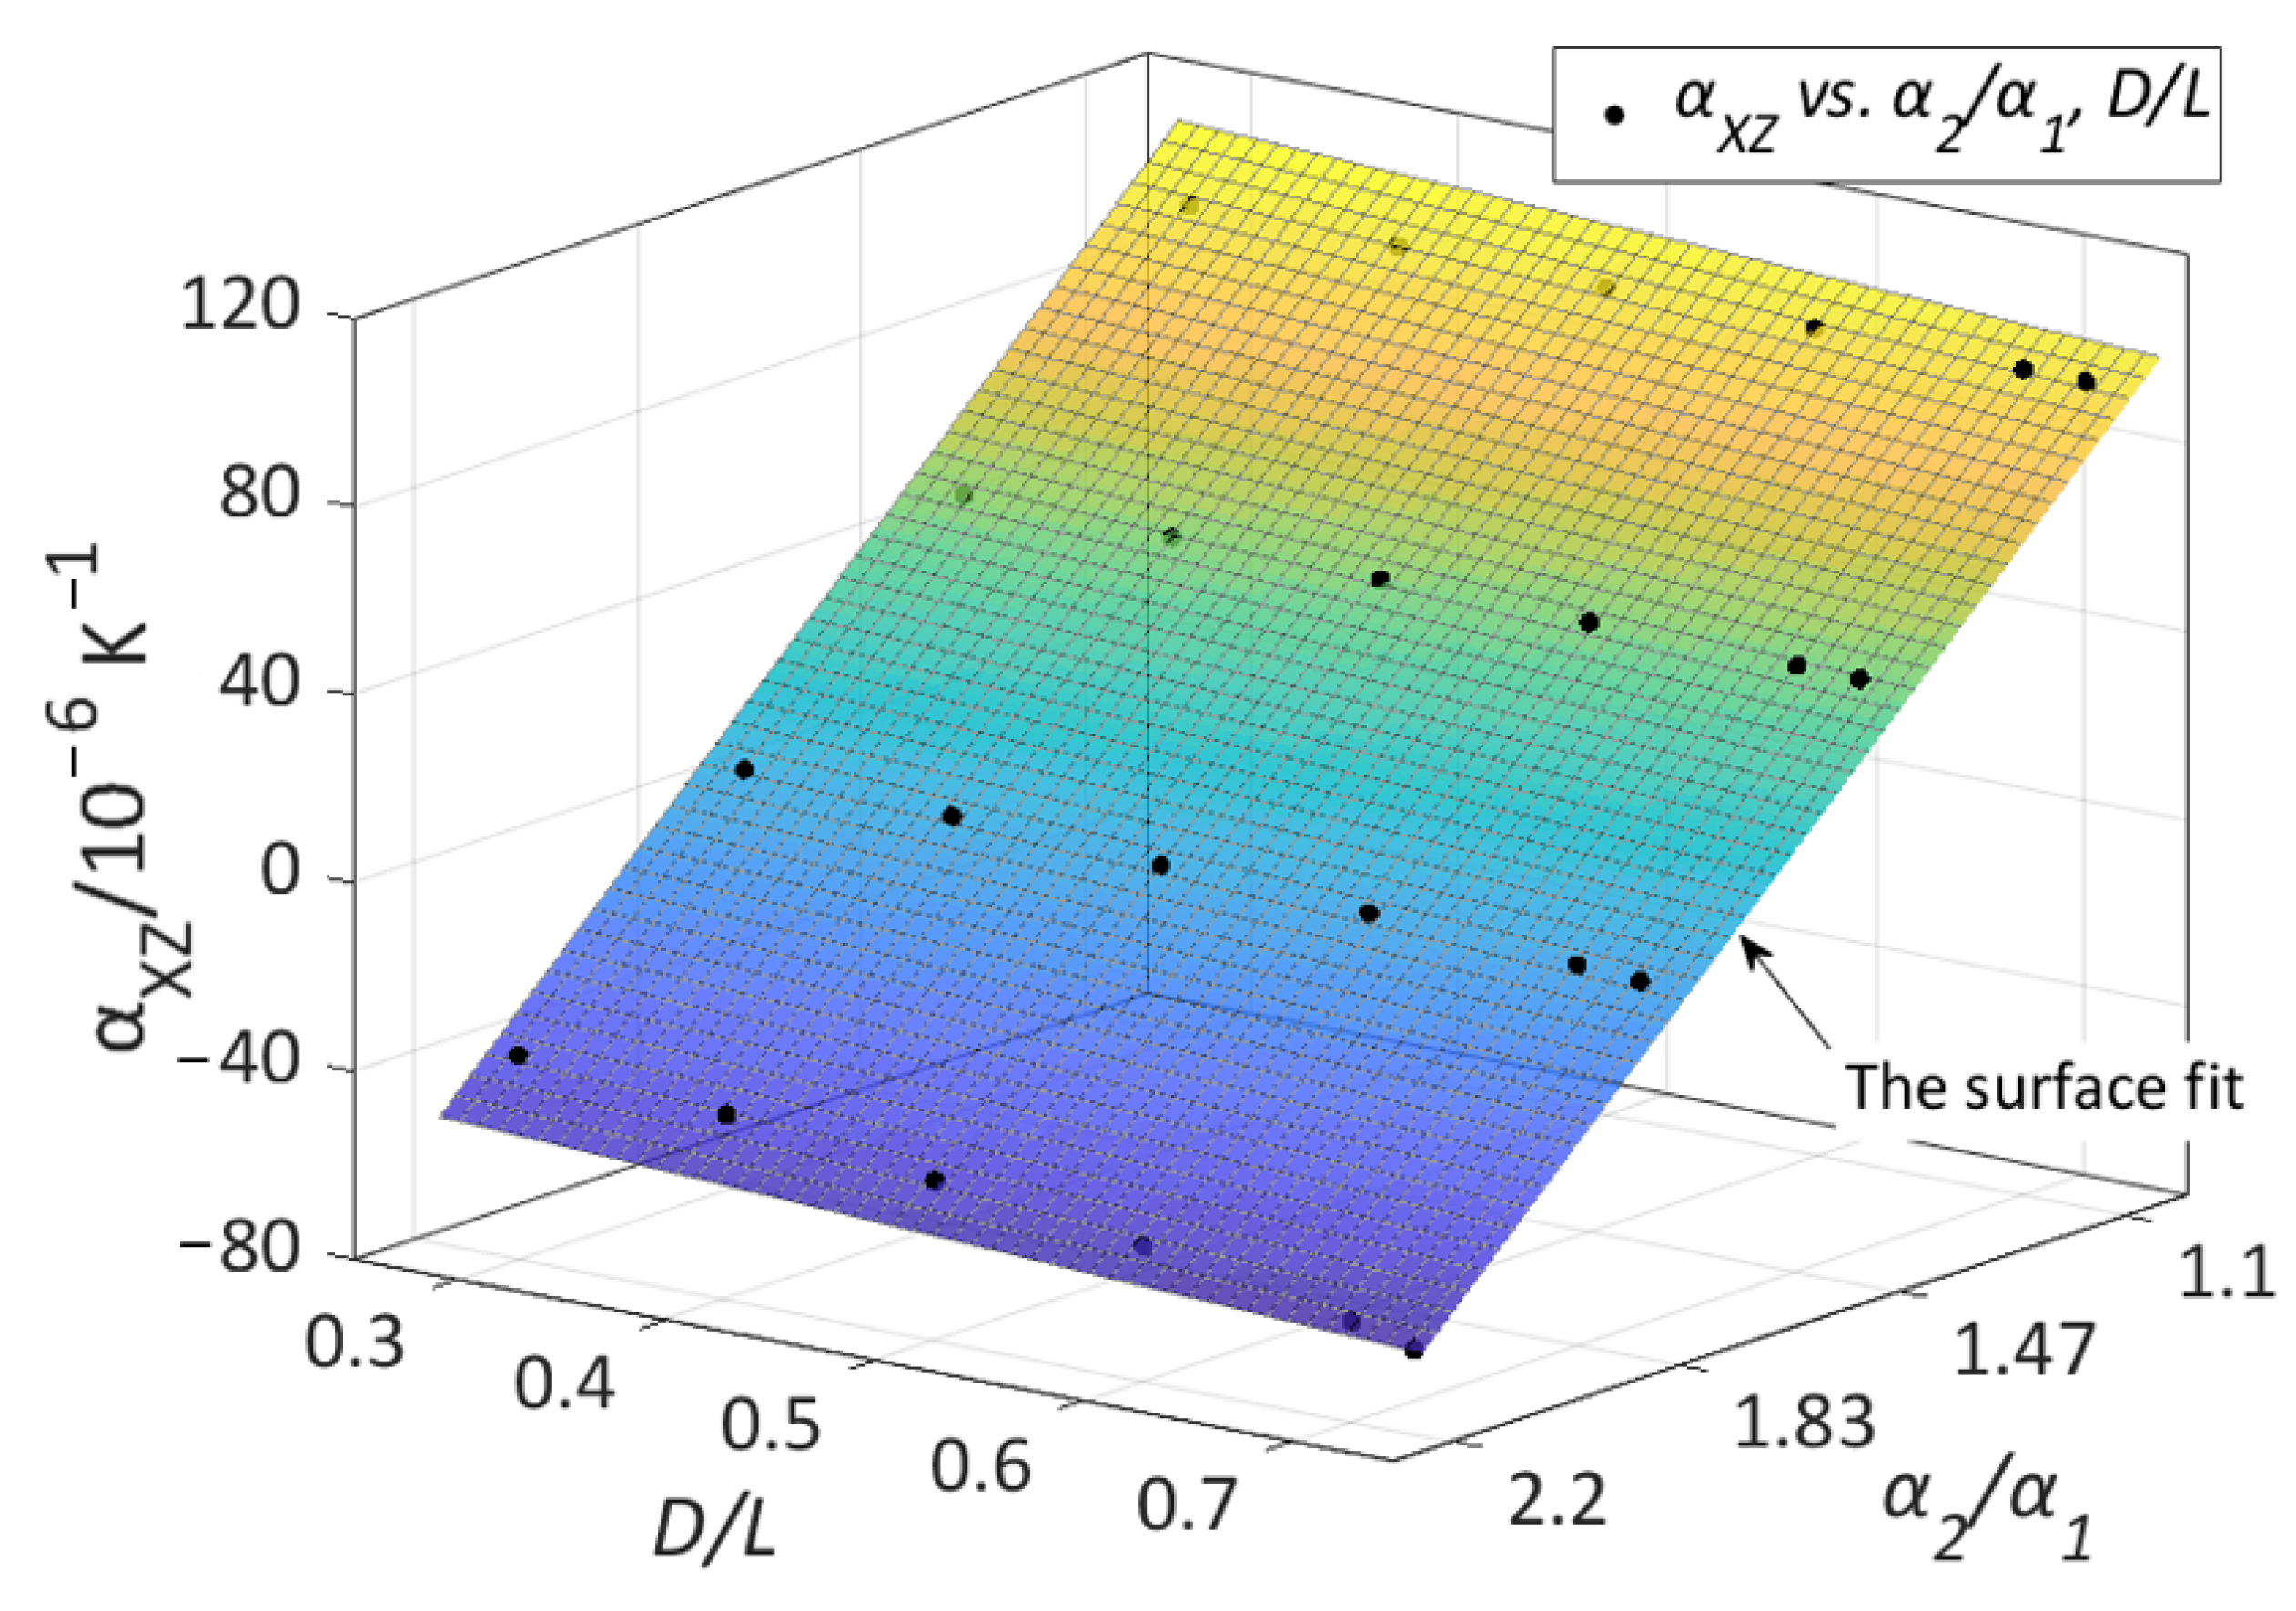
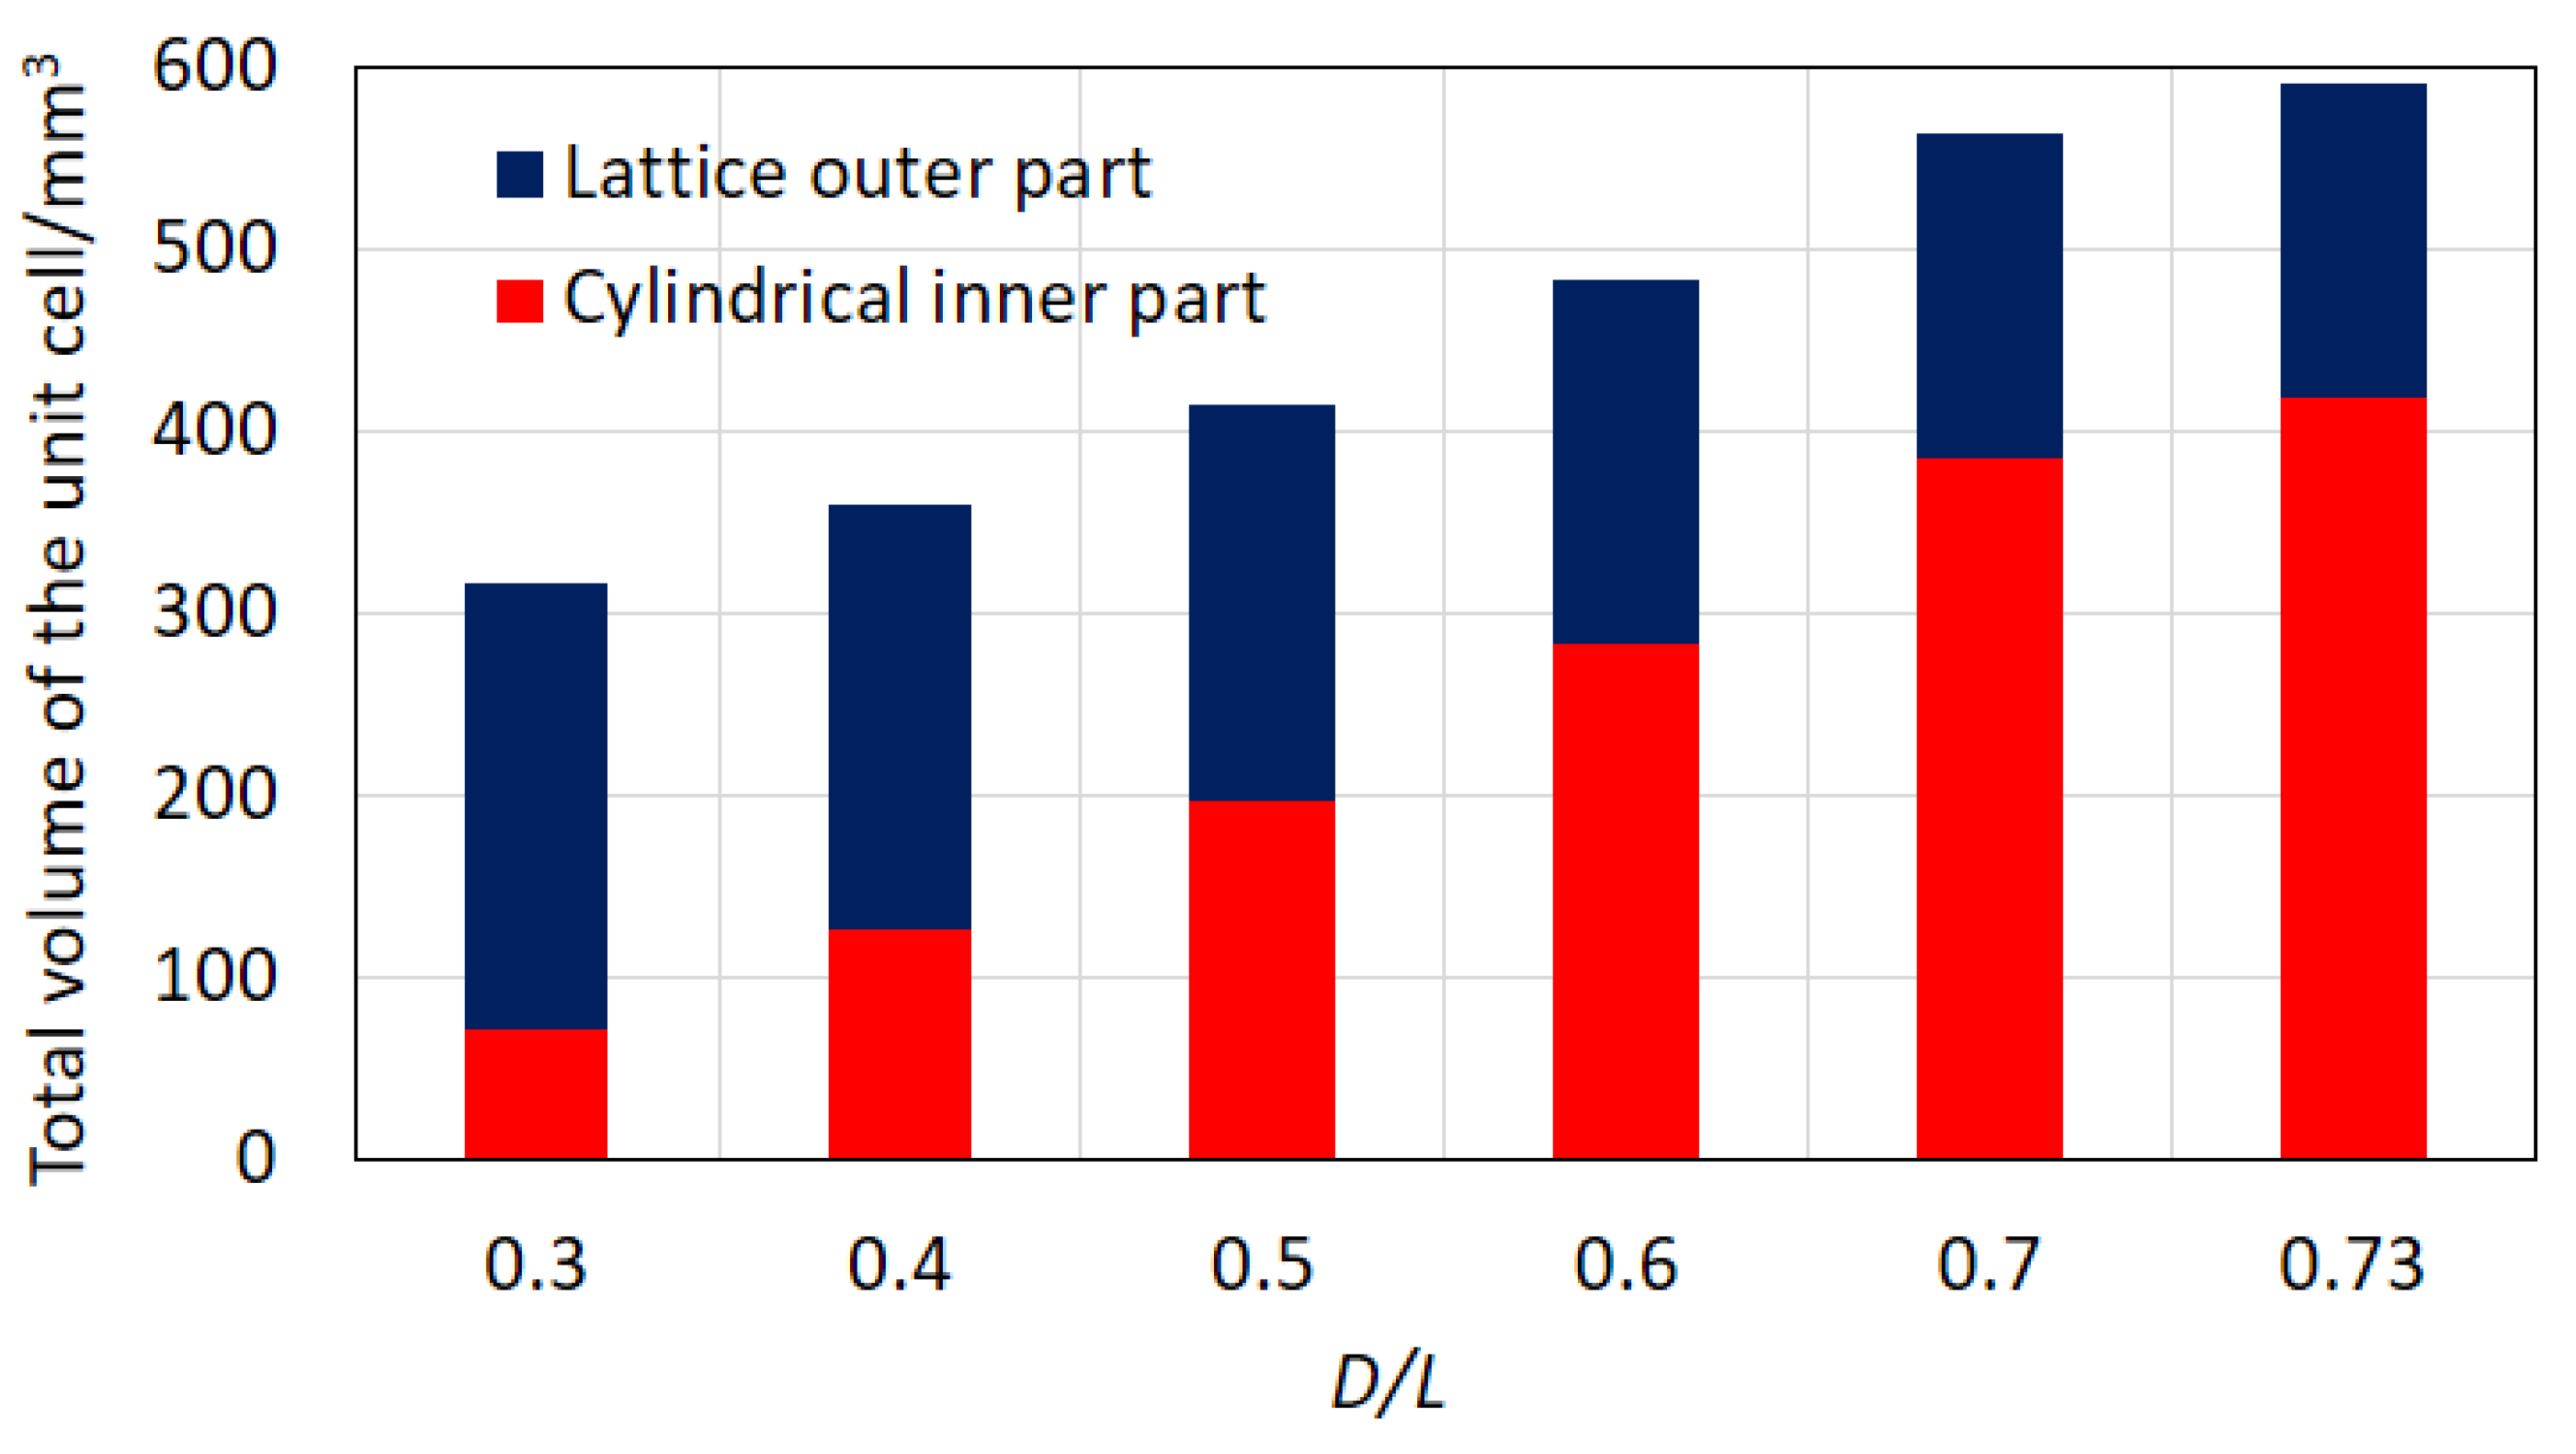
3.1. Low Planar CTE Lattice Results
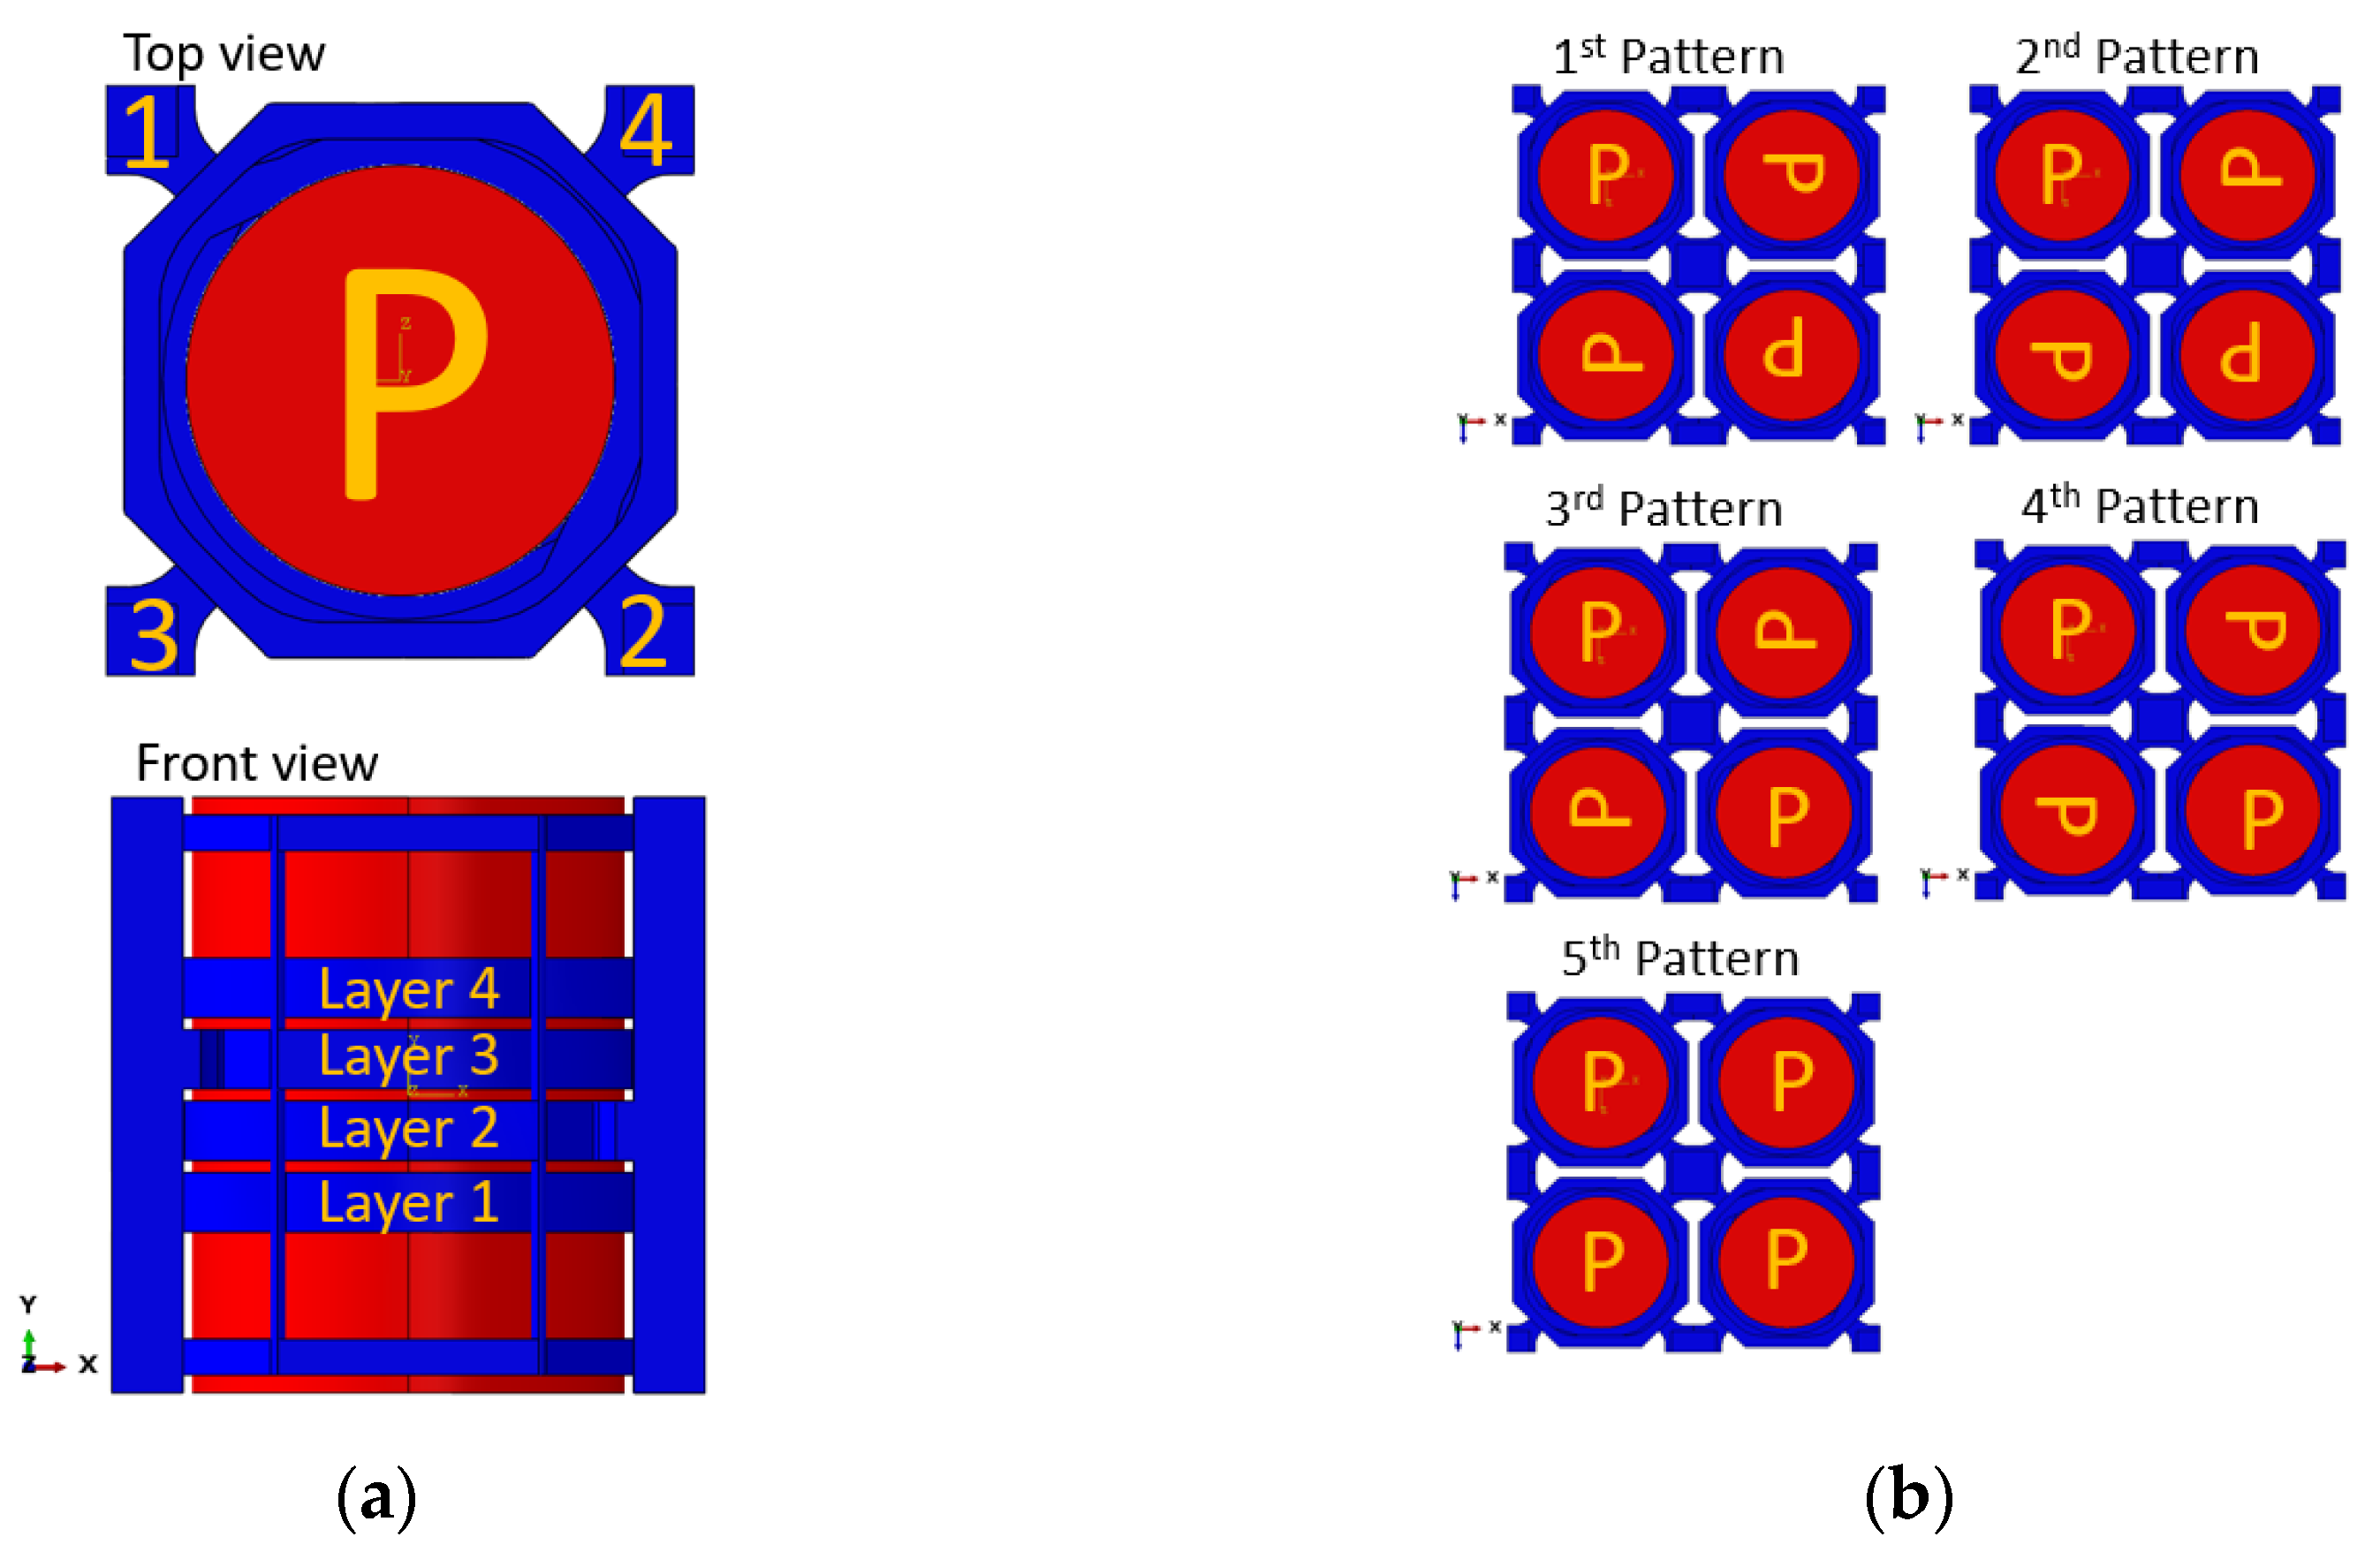
3.2. Pattern Selection for Low-CTE Lattice Design
4. Discussion
5. Conclusions
6. Future Work
Author Contributions
Funding
Institutional Review Board Statement
Informed Consent Statement
Data Availability Statement
Conflicts of Interest
References
- Bosmans, N.; Reynaerts, D. Force Loops. In Basics of Precision Engineering; Leach, R.K., Smith, S.T., Eds.; CRC Press: Boca Raton, FL, USA, 2018; pp. 493–518. [Google Scholar]
- Haitjema, H. Measurement Uncertainty. In Basics of Precision Engineering; Leach, R.K., Smith, S.T., Eds.; CRC Press: Boca Raton, FL, USA, 2018; pp. 413–448. [Google Scholar]
- Pan, C.; Han, Y.; Lu, J. Design and optimization of lattice structures: A review. Appl. Sci. 2020, 10, 6374. [Google Scholar] [CrossRef]
- Lopez Taborda, L.L.; Maury, H.; Pacheco, J. Design for additive manufacturing: A comprehensive review of the tendencies and limitations of methodologies. Rapid Prototyp. J. 2021, 27, 918–966. [Google Scholar] [CrossRef]
- Riedle, H.; Ghazy, A.; Seufert, A.; Seitz, V.; Dorweiler, B.; Franke, J. Generic design of an anatomical heart model optimized for additive manufacturing with silicone. Rapid Prototyp. J. 2021, 27, 217–222. [Google Scholar] [CrossRef]
- Gonzalez Alvarez, A.; Evans, P.L.; Dovgalski, L.; Goldsmith, I. Design, additive manufacture and clinical application of a patient-specific titanium implant to anatomically reconstruct a large chest wall defect. Rapid Prototyp. J. 2021, 27, 304–310. [Google Scholar] [CrossRef]
- Qin, Q.; Huang, J.; Yao, J.; Gao, W. Design and optimization of projection stereolithography additive manufacturing system with multi-pass scanning. Rapid Prototyp. J. 2021, 27, 636–642. [Google Scholar] [CrossRef]
- Parsons, E.M. Lightweight cellular metal composites with zero and tunable thermal expansion enabled by ultrasonic additive manufacturing: Modeling, manufacturing, and testing. Compos. Struct. 2019. [Google Scholar] [CrossRef]
- Economidou, S.N.; Karalekas, D. Optical sensor-based measurements of thermal expansion coefficient in additive manufacturing. Polym. Test. 2016, 51, 117–121. [Google Scholar] [CrossRef]
- Werner, M.R.; Fahrner, W.R. Review on materials, microsensors, systems and devices for high-temperature and harsh-environment applications. IEEE Trans. Ind. Electron. 2001, 48, 249–257. [Google Scholar] [CrossRef]
- Sigmund, O.; Torquato, S. Composites with extremal thermal expansion coefficients. Appl. Phys. Lett. 1996, 69, 3203–3205. [Google Scholar] [CrossRef]
- Akihiro, T.; Makoto, K.; Mitsuru, K. Porous composite with negative thermal expansion obtained by photopolymer additive manufacturing. APL Mater. 2015, 3, 076103–076106. [Google Scholar] [CrossRef]
- Takezawa, A.; Kobashi, M. Design methodology for porous composites with tunable thermal expansion produced by multi-material topology optimization and additive manufacturing. Compos. Part B 2017, 131, 21–29. [Google Scholar] [CrossRef]
- Lakes, R. Cellular solids with tunable positive or negative thermal expansion of unbounded magnitude. Appl. Phys. Lett. 2007, 90. [Google Scholar] [CrossRef] [Green Version]
- Wu, L.; Li, B.; Zhou, J. Isotropic Negative Thermal Expansion Metamaterials. ACS Appl. Mater. Interfaces 2016, 8, 17721. [Google Scholar] [CrossRef] [Green Version]
- Jefferson, G.; Parthasarathy, T.A.; Kerans, R.J. Tailorable thermal expansion hybrid structures. Int. J. Solids Struct. 2009, 46, 2372–2387. [Google Scholar] [CrossRef]
- Hang, X.; Damiano, P. Structurally Efficient Three-dimensional Metamaterials with Controllable Thermal Expansion. Sci. Rep. 2016, 6, 1–8. [Google Scholar] [CrossRef]
- Yang, H.; Ma, L. 1D to 3D multi-stable architected materials with zero Poisson’s ratio and controllable thermal expansion. Mater. Des. 2020, 188, 108430. [Google Scholar] [CrossRef]
- Hopkins, J.; Song, Y.; Lee, H.; Fang, N.; Spadaccini, C. Polytope Sector-Based Synthesis and Analysis of Microstructural Architectures With Tunable Thermal Conductivity and Expansion. J. Mech. Des. (Trans. ASME) 2016, 138, 051401. [Google Scholar] [CrossRef] [Green Version]
- Steeves, C.A.; dos Santos e Lucato, S.L.; He, M.; Antinucci, E.; Hutchinson, J.W.; Evans, A.G. Concepts for structurally robust materials that combine low thermal expansion with high stiffness. J. Mech. Phys. Solids 2007, 55, 1803–1822. [Google Scholar] [CrossRef] [Green Version]
- Wei, K.; Chen, H.; Pei, Y.; Fang, D. Planar lattices with tailorable coefficient of thermal expansion and high stiffness based on dual-material triangle unit. J. Mech. Phys. Solids 2016, 86, 173–191. [Google Scholar] [CrossRef]
- Wei, K.; Peng, Y.; Wen, W.; Pei, Y.; Fang, D. Tailorable thermal expansion of lightweight and robust dual-constituent triangular lattice material. J. Appl. Mech. Trans. ASME 2017, 84. [Google Scholar] [CrossRef]
- Yamamoto, N.; Gdoutos, E.; Toda, R.; White, V.; Manohara, H.; Daraio, C. Thin Films with Ultra-low Thermal Expansion. Adv. Mater. 2014, 26, 3076–3080. [Google Scholar] [CrossRef] [Green Version]
- Lehman, J.; Lakes, R. Stiff lattices with zero thermal expansion. J. Intell. Mater. Syst. Struct. 2012, 23, 1263–1268. [Google Scholar] [CrossRef]
- Yu, H.; Wu, W.; Zhang, J.; Chen, J.; Liao, H.; Fang, D. Drastic tailorable thermal expansion chiral planar and cylindrical shell structures explored with finite element simulation. Compos. Struct. 2019, 210, 327–338. [Google Scholar] [CrossRef]
- Ai, L.; Gao, X.L. Metamaterials with negative Poisson’s ratio and non-positive thermal expansion. Compos. Struct. 2017, 162, 70–84. [Google Scholar] [CrossRef] [Green Version]
- Ai, L.; Gao, X.L. Three-dimensional metamaterials with a negative Poisson’s ratio and a non-positive coefficient of thermal expansion. Int. J. Mech. Sci. 2018, 135, 101–113. [Google Scholar] [CrossRef]
- Jin, Z.H. A microlattice material with negative or zero thermal expansion. Compos. Commun. 2017, 6, 48–51. [Google Scholar] [CrossRef]
- Wei, K.; Yang, Q.; Ling, B.; Qu, Z.; Pei, Y.; Fang, D. Design and analysis of lattice cylindrical shells with tailorable axial and radial thermal expansion. Extrem. Mech. Lett. 2018, 20, 51–58. [Google Scholar] [CrossRef]
- Harding, K. Optical Metrology Overview. In Handbook of Optical Dimensional Metrology; Harding, K., Pike, E.R., Brown, R.G.W., Eds.; Series in Optics and Optoelectronics; CRC Press: Boca Raton, FL, USA, 2013; pp. 3–35. [Google Scholar]
- Gibson, L.J.; Ashby, M.F. Cellular Solids: Structure and Properties, 2nd ed.; Cambridge University Press: Cambridge, UK, 1997. [Google Scholar]
- Hesse, N.; Dechet, M.A.; Bonilla, J.S.G.; Lübbert, C.; Roth, S.; Bück, A.; Schmidt, J.; Peukert, W. Analysis of tribo-charging during powder spreading in selective laser sintering: Assessment of polyamide 12 powder ageing effects on charging behavior. Polymers 2019, 11, 609. [Google Scholar] [CrossRef] [Green Version]
- Tao, G.; Chen, Y.; Mu, J.; Zhang, L.; Ye, C.; Li, W. Exploring the entangled state and molecular weight of UHMWPE on the microstructure and mechanical properties of HDPE/UHMWPE blends. J. Appl. Polym. Sci. 2021, 138, 50741. [Google Scholar] [CrossRef]
- Lo, S.H. Optimization of tetrahedral meshes based on element shape measures. Comput. Struct. 1997, 63, 951–961. [Google Scholar] [CrossRef]
- Borouchaki, H.; George, P.L.; Lo, S.H. Optimal delaunay point insertion. Int. J. Numer. Methods Eng. 1996, 39, 3407–3437. [Google Scholar] [CrossRef]
- Polikim ULPOLEN® 500 UHMWPE Standard. Available online: http://www.matweb.com/search/DataSheet.aspx?MatGUID=e6f135cc9c044ae888668c396453307b&ckck=1 (accessed on 10 August 2020).


| Pattern | In-Plane CTE (10−8 K−1) |
|---|---|
| 1 | 5.4 |
| 2 | 12.8 |
| 3 | 8.9 |
| 4 | 29.0 |
| 5 | 9.5 |
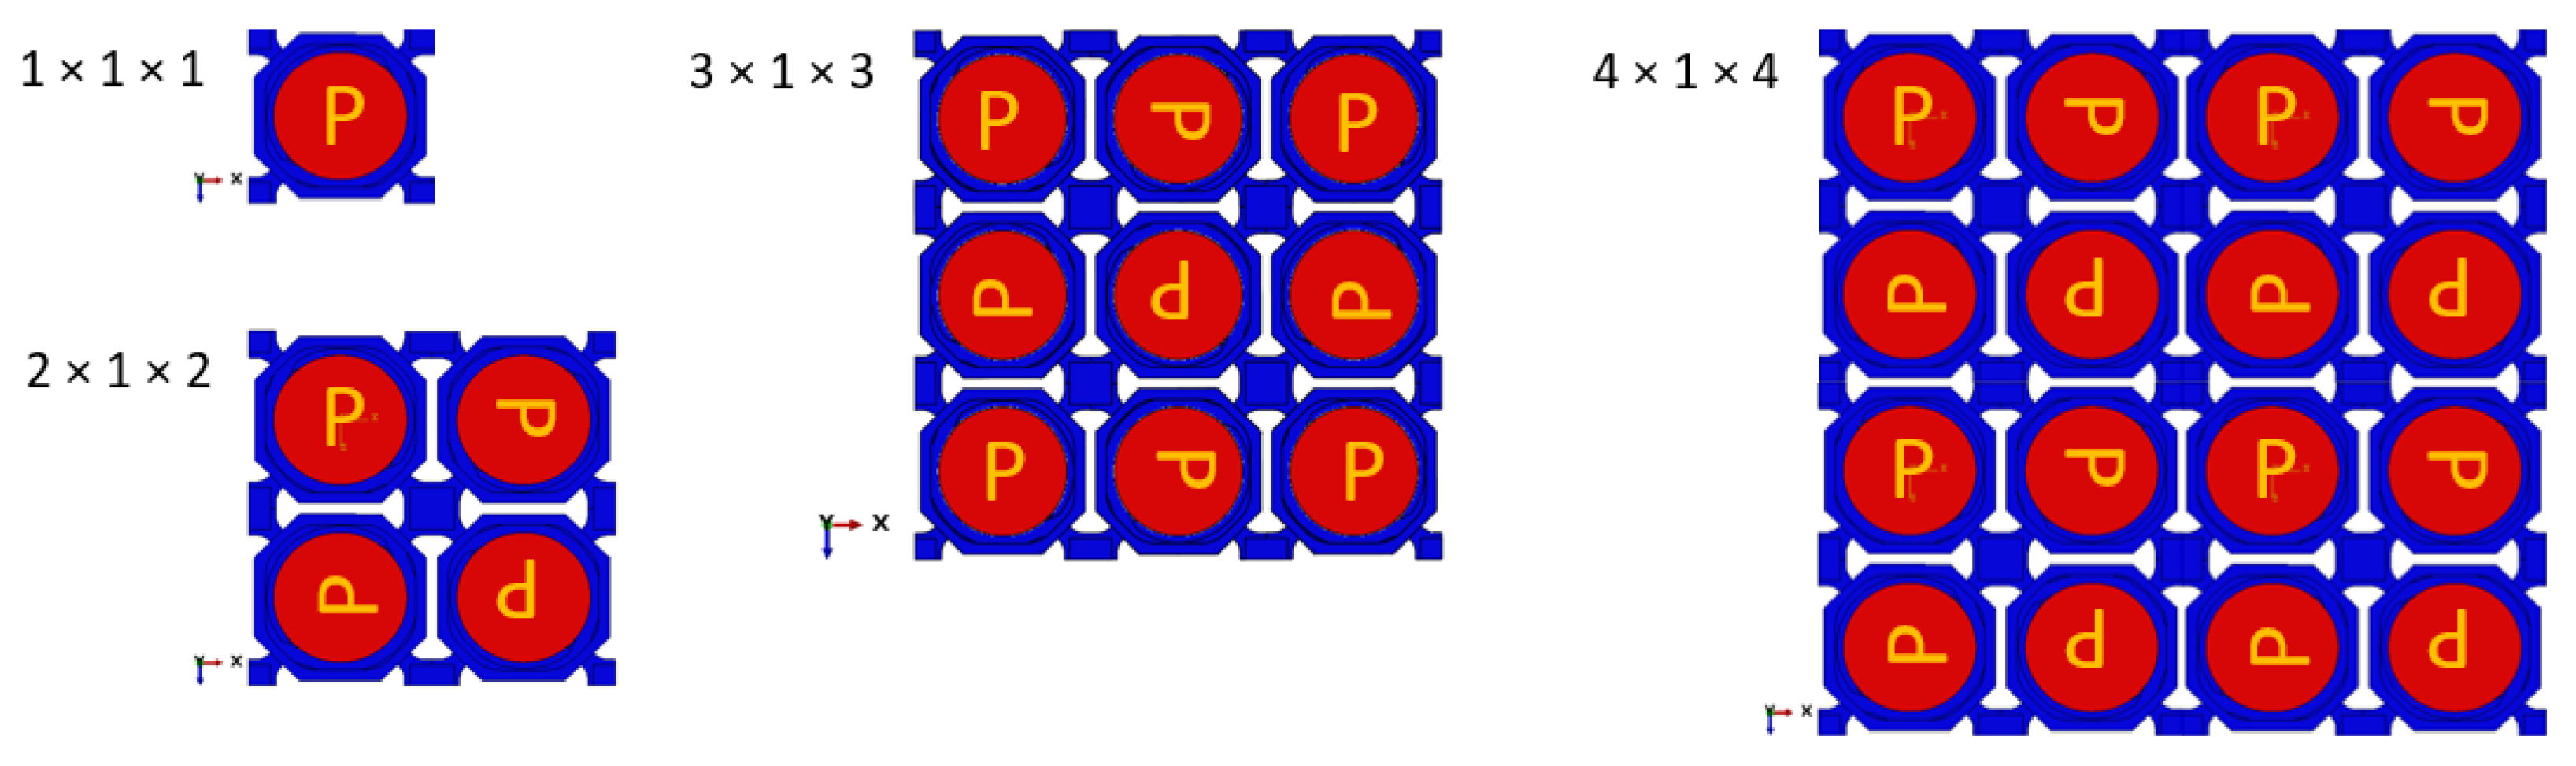
| Lattice | In-Plane CTE (10−8 K−1) | In-Plane CTE Anisotropy (10−8 K−1) |
|---|---|---|
| 1 × 1 × 1 | 0.1 | 1379 |
| 2 × 1 × 2 | 5.4 | 3 |
| 3 × 1 × 3 | 8.7 | 149 |
| 4 × 1 × 4 | 0.03 | 1 |
Publisher’s Note: MDPI stays neutral with regard to jurisdictional claims in published maps and institutional affiliations. |
© 2021 by the authors. Licensee MDPI, Basel, Switzerland. This article is an open access article distributed under the terms and conditions of the Creative Commons Attribution (CC BY) license (https://creativecommons.org/licenses/by/4.0/).
Share and Cite
Juasiripukdee, P.; Maskery, I.; Ashcroft, I.; Leach, R. Low Thermal Expansion Machine Frame Designs Using Lattice Structures. Appl. Sci. 2021, 11, 9135. https://doi.org/10.3390/app11199135
Juasiripukdee P, Maskery I, Ashcroft I, Leach R. Low Thermal Expansion Machine Frame Designs Using Lattice Structures. Applied Sciences. 2021; 11(19):9135. https://doi.org/10.3390/app11199135
Chicago/Turabian StyleJuasiripukdee, Poom, Ian Maskery, Ian Ashcroft, and Richard Leach. 2021. "Low Thermal Expansion Machine Frame Designs Using Lattice Structures" Applied Sciences 11, no. 19: 9135. https://doi.org/10.3390/app11199135