Article

Influence of Examiners’ Experience and Region of Interest Location on Semiquantitative Elastography Validity and Reliability

by
Juan Antonio Valera-Calero
1,*,
César Fernández-de-las-Peñas
2,3,
Tomás Fernández-Rodríguez
1,
José Luis Arias-Buría
2,3,
Umut Varol
4 and
Gracia María Gallego-Sendarrubias
1
1
Department of Physiotherapy, Faculty of Health, Universidad Camilo José Cela, Villanueva de la Cañada, 28692 Madrid, Spain
2
Department of Physical Therapy, Occupational Therapy, Rehabilitation and Physical Medicine, Universidad Rey Juan Carlos, Alcorcón, 28922 Madrid, Spain
3
Cátedra Institucional en Docencia, Clínica e Investigación en Fisioterapia: Terapia, Manual, Punción Seca y Ejercicio Terapéutico, Universidad Rey Juan Carlos, Alcorcón, 28922 Madrid, Spain
4
IE School of Human Sciences and Technology, IE Business School, 28006 Madrid, Spain
*
Author to whom correspondence should be addressed.
Appl. Sci. 2021, 11(19), 9247; https://doi.org/10.3390/app11199247
Submission received: 16 September 2021 / Revised: 28 September 2021 / Accepted: 2 October 2021 / Published: 5 October 2021
(This article belongs to the Special Issue Advances in Imaging Techniques for Biomedical Applications)

Abstract

:
Semi-quantitative elastography is a promising imaging technique to evaluate tissue stiffness differences, providing data regarding relative stiffness differences between two targets. The aims of this study were to assess the validity, inter-examiner reliability and variability of semi-quantitative elastography for calculating strain ratios (SR) in a homogeneous gel phantom in different locations within the image. A diagnostic accuracy study was performed in a homogeneous stiffness phantom. Four examiners participated (two novice and two experienced). Each examiner assessed the SR in two locations. Difference between examiners, variability of measurements, SR error and absolute error, mean error of the measurements and coefficient of variation were calculated. The agreement between examiners, validity and variability of measurements were higher in the central area than the lateral areas of the images. Thus, the experience of the examiner was relevant for the concordance of the measurements in the lateral areas of the images (SR difference of 0.14 ± 0.05; p < 0.001), but not for the central area (SR difference of 0.05 ± 0.02; p > 0.05). Our data suggested that semi-quantitative elastography is an accurate tool for assessing small magnitude stiffness differences within the same image in central areas, but the experience of the examiner is a determinant factor.

1. Introduction

Ultrasound imaging (US) is a safe, portable, low-cost imaging method for assessing soft tissues, including skeletal muscle or viscera, and is widely used by different specialties (e.g., physiotherapists, cardiologists, radiologists, hepatologists or gynecologists) [1]. During the last years, several studies have developed technical reports to assess the validity and/or reliability of different imaging procedures [2] and imaging methods [3,4].
Elastography is a US physics-based imaging technology sensitive to tissue stiffness. It has been further developed and refined in recent years to make quantitative assessments of tissue stiffness [5]. Although the first elastography method was “strain imaging” (which consists of manual compression on the tissue with an ultrasound transducer), the most recent technology is the “shear wave imaging” method, which measures physical tissue displacement generated by shear waves perpendicular to the direction of the force produced with the transducer [6].
Recent developments have made strain elastography more accurate by providing real-time feedback regarding the optimal pressure needed, with an indication bar scaled from 1 to 6 (where 1 is not appropriate and 6 is the most appropriate) [7]. Thus, strain elastography provides qualitative information based on a color map and semi-quantitative information expressed as the stiffness comparison between two areas within the same image. This strain ratio (SR) is calculated as the mean strain in the reference divided by the mean strain in the target.
Prior evidence assessing SR accuracy by using both strain and shear wave elastography in calibrated phantoms presented greater accuracy in the shear wave method [8,9]. One of the reasons explaining these findings is that strain elastography applies an unknown compression to the tissue and the deformation obtained is relative. Although shear wave elastography does not depend on the manual compression of the operator, as in strain elastography, it is more expensive, less accessible and it should be considered that all US methods are susceptible to be biased by shadowing, reverberation, clutter artifacts or operator experience [10].
Therefore, considering (1) the accessibility advantages of strain elastography and (2) inconsistency in semi-quantitative SR results (evaluated methods, the system used and the position of the reference region of interest) [8], an important preliminary step for semi-quantitative elastography to be used and interpreted correctly in research or clinical practice is establishing validity, reliability and variability of measurements.
The rationale for conducting this study is based on two reasons. Firstly, the accuracy of SR is directly dependent on the magnitude of the stiffness difference between both targets [11]. Although strain elastography has been widely assessed in phantoms under optimal conditions previously, these reports compared the stiffness difference between targets and backgrounds in big magnitudes ranging from 11–55 kPa [8,9,10,11]. However, a recent study assessing stiffness differences between active and latent myofascial trigger points (MTrP) with control points within the same muscle showed smaller differences than those assessed in vitro (ranging from 0.04–2.76 kPa) [12]. Therefore, further research assessing the accuracy of SR calculation in tissues with similar stiffness is needed. Secondly, the influence of the examiners’ experience for assessing SR is not consistent [8,11,13].
The aims of this study were to determine semi-quantitative elastography SR validity, inter-examiner reliability and variability of measurements considering different locations within the images and the operators’ experience using a phantom with homogeneous stiffness (since homogeneous tissues are characterized by zero stiffness difference) under optimal conditions.

2. Materials and Methods

2.1. Study Design

This is a diagnostic accuracy study which was conducted between September 2020 and November 2020 in a private university located in Madrid (Spain), which consists of a construct validity, variability of measurement and inter-examiner reliability analysis. This type of study focuses on judgement based on the accumulation of evidence using a specific measuring instrument (e.g., semi-quantitative elastography SR).
This methodology requires assessing the relationship between the evaluated target and a variable score (an homogeneous stiff gel phantom with known SR (SR = 1)) to be known to be related to the construct measured by the instrument for calculating the construct validity, performing repeated measurements to the same target at different points in time to calculate the variability of measurement and analyzing the equivalence of ratings obtained by different observers with different experience levels to calculate the inter-examiner reliability [14].
This study followed the Standards for Reporting of Diagnostic Accuracy Studies (STARD) guidelines and checklist [15]. No ethics committee approval was needed since neither animals nor humans were involved for this research.

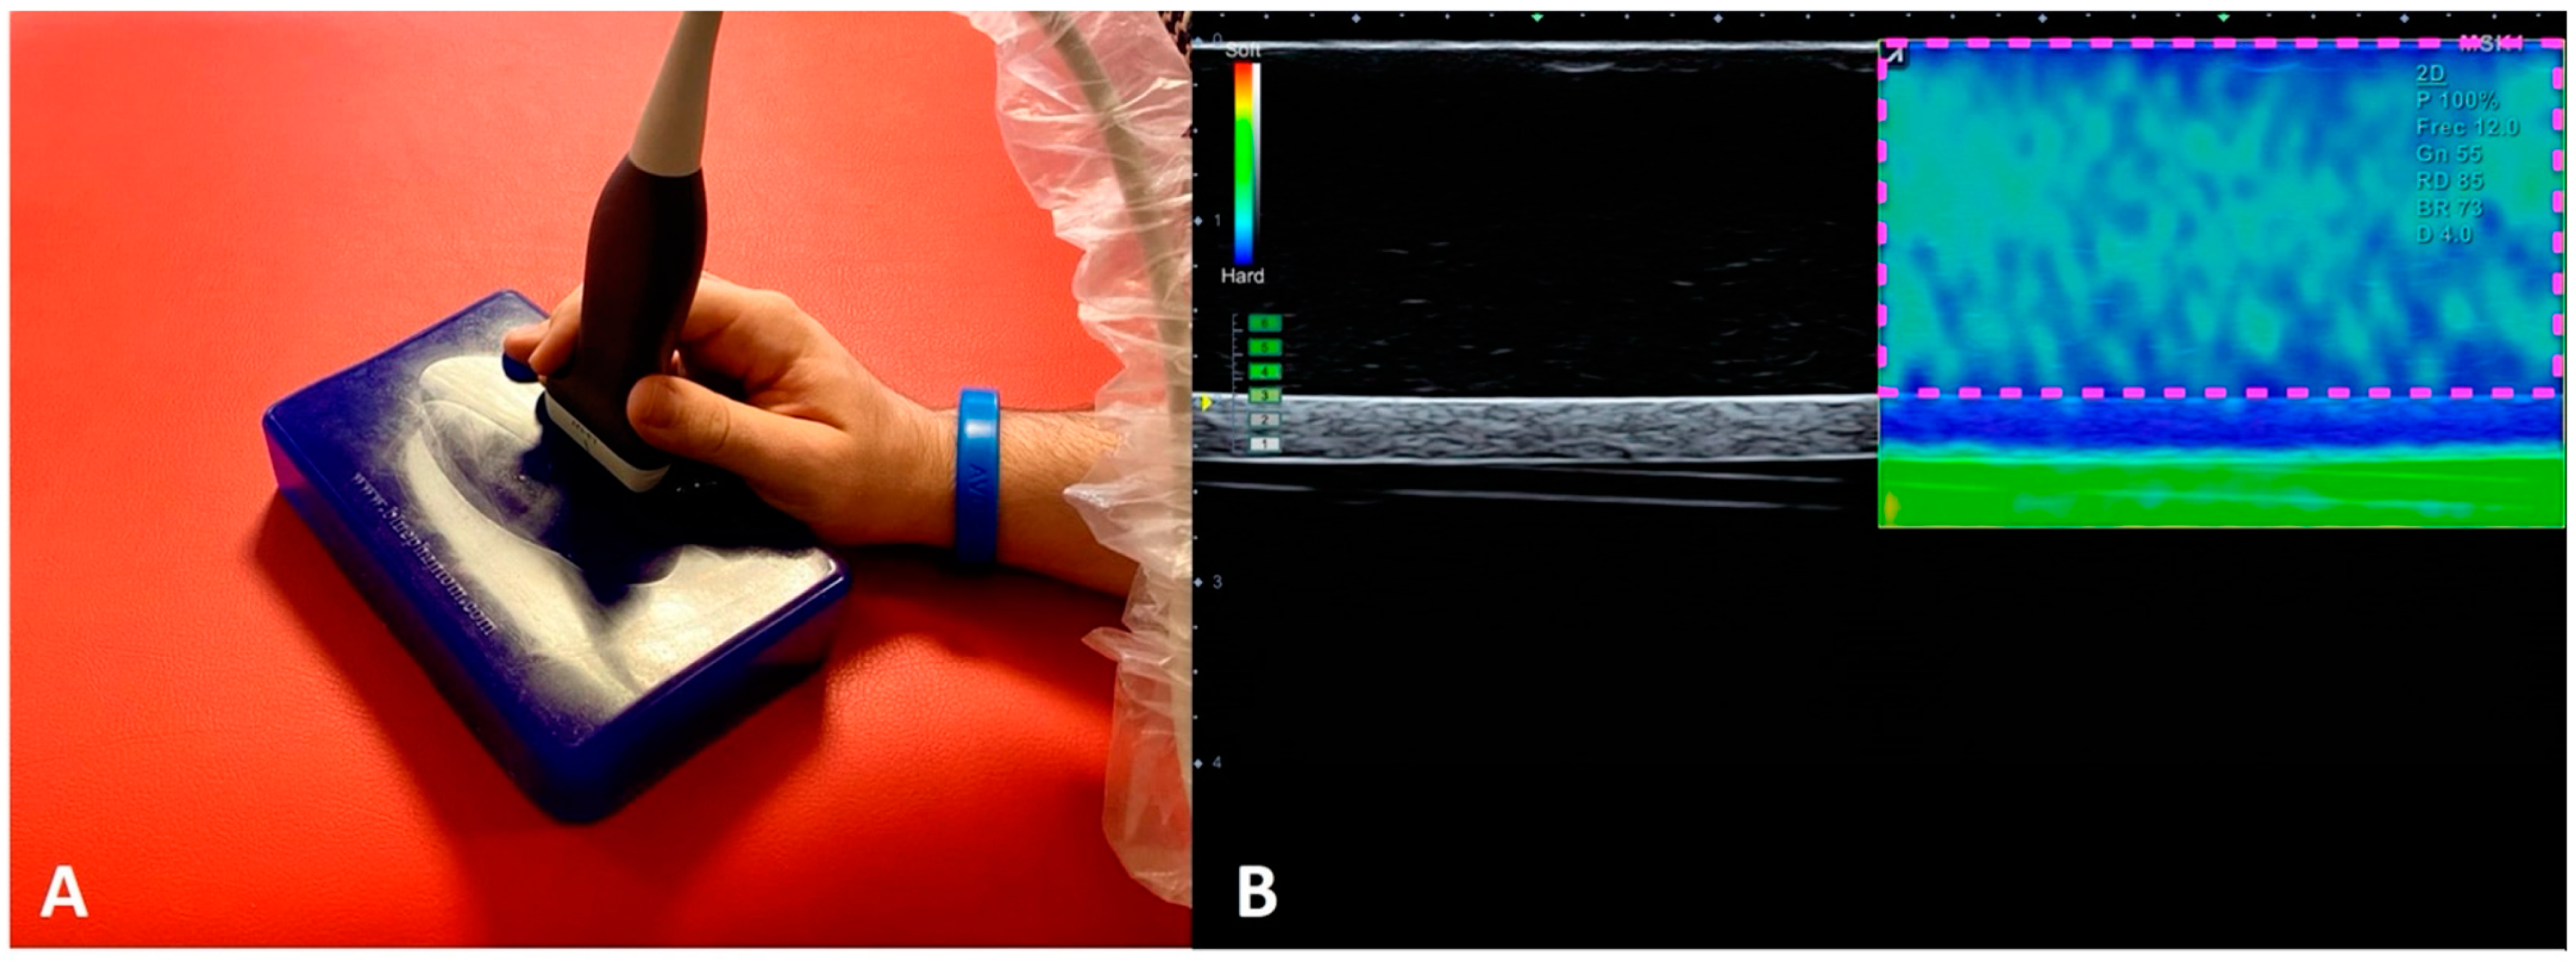
2.2. Imaging Acquisition Procedures

A SonoSite Blue PhantomTM (Sarasota, FL, USA) Vascular Access BPO100 with homogeneous stiffness was placed on a rigid table. A single model was chosen since SR = 1 for all homogeneous phantoms. All images were acquired with an Alpinion eCube i8 (Anyang-si, Gyeonggi-do, Ltd., Korea) with a 4 cm width linear transducer E8-PB-L3-12T (frequency bandwidth 3–12 MHz). A linear transducer was chosen since convex probes generally have higher intra-observer variability [11].
Room light, temperature and all the US parameters were set under the same conditions for both examiners. Frequency was set to 12.0 MHz, gain to 55 dB, dynamic range to 85, brightness to 17 and depth to 4 cm. To ensure optimal sound wave incidence, the transducer was placed perpendicular to the surface of the phantom locating a long-axis image of the internal cylindrical structure while avoiding its inclination and capturing the lumen of the cylinder with the maximum amplitude throughout the image (Figure 1a).
This US equipment shows a 1 to 6 scale bar in the upper-left part of the image regarding the quality of the applied pressure (uniformity of the compression in all areas) to optimize the elastography measurement. Therefore, the transducer pressure was carefully calculated according to this scale to apply the optimal pressure during the obtainment of all the images (Figure 1b).
A total of four examiners participated in this procedure; two were experienced (10 years of practice in the use of US imaging) and two were novice (1 year of practice). All examiners performed the transducer placement and each captured 50 images as described. Acquisitions were performed in 5 series of 10 captures with 1 min difference between captures and 30 min difference between series.

2.3. Measurement Assessment Procedures

Once captured, all the images were assessed using offline measurement tools of the US equipment to calculate the SR. Relative SRs were calculated as the stiffness of the reference area divided by the stiffness of the comparator area. Two different SRs were calculated as follows (Figure 2):
(1)
Lateral areas of the image: First, the caliper was used to measure 1 cm from the top right corner of the image to the left. Then the area selector tool was utilized to contour a rectangle with 1 cm width and a height equal to the distance between the most superficial limit of the phantom to the most superficial limit of the cylindrical structure. Finally, another rectangle with same measurements (height and width) was placed in the top left corner of the image to obtain the SR.
(2)
Central areas of the image: Within the central 2 cm that were not included in the previous measurement, the distance from the surface of the phantom and the upper limit of the cylindrical structure was divided by 2. Following this, a rectangle was contoured with a width of 2 cm and the upper half of the distance previously calculated from the surface to the fake vessel. Finally, the SR between the upper rectangle and the lower rectangle was calculated.
All the measurements were performed by the same operator with 10 years of experience. Every image was coded to blind the rater using alphanumerical codes in a randomized order.

2.4. Statistical Analysis

Data analysis was conducted with the Statistical Package for the Social Science (SPSS) Version 21 for Mac OS. Normal distribution of the SR data was verified using the Shapiro–Wilk test. Inter-examiner reliability of SR calculation was assessed by calculating the mean of the measurements with the upper and lower limits (95% CI) in terms of examiner experience and taking the mean difference between examiners (DBE = SR scored by the experienced examiner − SR scored by the novice examiner). Variability of the measurements (SoM% = standard deviation of the error × 100) and validity was also assessed, taking the examiner experience into account by calculating the mean error (E = known SR − SR obtained by the examiner = 1 − SR obtained by the examiner), the mean absolute error (AE = absolute value of E), the mean error of the measurements (MEM = (mean AE of the experienced examiner + mean AE of the novice examiner)/2), the mean percent error (PE% = AE/mean error of the measurements ×100) and the mean coefficient of variation (CV% = Standard Deviation/mean). All the analyses were performed for both SRs calculated in the lateral areas and center of the images. Student’s t-test for independent samples was utilized to determine examiners, location areas and reference differences. All tests were two-tailed and p-values < 0.05 considered significant.

3. Results

A total of 200 images were captured and included for analysis, 50 per experienced examiner and 50 per novice examiner. From these 200 images, 200 measurements were obtained from the lateral areas and 200 measurements from the central area of the images.
Table 1 shows inter-examiner reliability (agreement between two examiners expressed as the difference between their measurements to obtain information regarding the extent to which the results can be reproduced under the same conditions) and instrument variability data of SR calculations (considered as the extent to which measurements diverge from the average value). In general, the agreement between examiners and variability of measurements was higher in the central area than in the lateral areas of the images (the difference between examiners for each location ranged between 0.00–0.13 and 0.00–0.01, respectively). Thus, the experience of the examiner was relevant for the concordance of the measurements in the lateral areas of the images (p < 0.05), but not for the central area (p > 0.05).
Like reliability, validity is another concept used to evaluate the quality research. Even if an instrument shows excellent reliability and results are reproducible, they might not be correct. Therefore, validity provides information regarding the accuracy of one instrument comparing a known value with the obtained value. Validity estimates of semi-quantitative elastography for calculating SR within the same image are reported in Table 2. In general, the experience level of the examiner does not seem to be an influential factor since the error and absolute error differences showed no significant differences between novice and experienced examiners (p > 0.05). However, the mean error of measurements was significantly higher (p < 0.001) in the lateral areas compared to the central area of the image (0.14 ± 0.05 and 0.05 ± 0.02 respectively). SR calculations of the experienced and novice examiners in the central area showed no statistically significant differences with the known reference (p > 0.05). Both novice examiners showed significant differences between the known SR and their measurements (p < 0.001), unlike the experienced examiners (p > 0.05).

4. Discussion

This study assessed the reliability, variability of measurements and validity of semi-quantitative elastography SR calculation under optimal conditions (controlling the 90º transducer position and pressure by using as reference a cylindrical mimicking vessel) considering the experience level of the examiners. In general, reliability, variability of measurements and validity of semi-quantitative elastography SR calculation were acceptable. Elastography could be one of the most important technological breakthroughs in the field of ultrasound imaging (since development of Doppler imaging or Panoramic US) including the main advantages of US compared to other imaging techniques (e.g., low cost, short examination time, noninvasiveness and accessibility) [16].
After an extensive literature search, several recently published studies were found that assessed the reliability estimates for elastography in different soft tissues structures, Ref. [17] including nerves [18], muscles [19], tendons [20,21] and arteries [22]. Features were assessed with quantitative elastography (including transverse velocity, transverse stiffness, cranio-caudal velocity and cranio-caudal stiffness, showing a poor repeatability of measurements with wide limits of agreement) and semi-quantitative elastography assessing SRs [8,9].
Previous phantom studies [8,11] reported that qualitative, semi-quantitative and quantitative data collected with strain and shear wave elastography can classify the targets as harder or softer than backgrounds properly. However, SRs were more accurate in shear wave elastography compared to strain. Aligned with this study, our results showed central areas of the images to be more accurate, reliable and stable than lateral areas for calculating SR. In addition, the influence of the examiner experience was controversial [11,13]. We found lower SR inter-examiner reliability and validity for novice examiners once the region of interest was focused on lateral areas. Two possible reasons explaining these phenomena could be the higher number of cross-sound waves in the middle of the transducer, yielding a greater accuracy in the greyscale and elastography quality and a more uniform pressure.
There is also evidence supporting better SR accuracy and CVs (CV = 0.08–0.65 for SR ranging 1.57–2.47) when the stiffness difference between a target and a control point is big, whereas CVs are higher in small differences (CV = 1.22–1.7 for SR ranging 0.40–0.60) [8]. This could be explained by relativity of SRs. Therefore, if the difference between two points is small, the equipment might not be sensitive enough for this difference, whereas greater ranges can be detected easily. In this study, our phantom was homogeneous and the known was SR = 1. Our results showed smaller CVs in the center of the image compared with the lateral areas (0.05–0.06 and 0.14–0.15, respectively). Thus, experience does not seem to be a limitation for obtaining reproducible and valid measurements in central areas of the image.

4.1. Clinical Implications

This study could be useful considering the calculation of SR for developing specific protocols in musculoskeletal tissues for both research and clinical practice by using semi-quantitative methodologies in the future. The most assessed musculoskeletal tissue with elastography is probably the tendon, based on the hypothesis of altered stiffness in the presence of tendon injury [23]. Although a previous study reported patterns in healthy tendon elastography, describing them as a uniformly firm structure or heterogeneous tissue with interwoven longitudinal or spindle-shaped soft tissue strands [24], it is still controversial how the changes in B-mode US with no abnormalities in elastography or changes in elastography with no altered B-mode image [25] should be interpreted.
In addition, elastography imaging has been used to assess many muscle pathologies, including muscular dystrophy [26] or myositis [27], stiffness differences after exercise [28], or between patients and controls [29]. Furthermore, myofascial trigger points (MTrPs) have been assessed with different US imaging methods, since the manual identification of MTrP shows a poor reliability [30] and imaging techniques to visualize MTrP twitch response and changes in the stiffness are needed. Previous studies observing MTrPs using B-mode US were consistent in describing MTrPs as hypoechoic regions [31] and using Doppler US found specific puslatility index response in MTrPs [32].
Furthermore, one study conducted by Jafari et al. [33] assessed MTrP stiffness by using elastography imaging to quantitatively distinguish MTrP from normal tissue and obtained significant differences between MTrPs and the normal part of the muscle. However, a recent study found no stiffness differences between active and latent MTrPs or control points with MTrPs [12]. The methodology assessed on this study could be applied to calculate the SR between an MTrP control point or two control points (since it showed a good validity and reliability), its correlation with pain pressure thresholds and SR changes after treatment.
Like in tendons, a previous study reported poor reproducibility of elastography in skeletal muscles [34], probably due to non-standardized contraction/relaxation state of the muscle or image soft tissue anisotropy.

4.2. Limitations

Finally, this study has some limitations. This study was performed assessing an artificial material under optimal conditions. We do not know if similar results would be observed in real subjects (e.g., image anisotropy due to round morphology of muscle bellies or vessels, or non-standardized state of the muscle and subject). Although reliability of SR calculation using strain elastography can be calculated in real subjects, validity cannot be analyzed with semi-quantitative elastography as all data obtained are relative and the real stiffness difference is unknown. Therefore, it is important to emphasize the need for further research comparing these semi-quantitative analyses with quantitative results expressed in metric units in real subjects.
In addition, just one homogeneous material, one ultrasound machine and one transducer were used. There is a need of evaluation in more homogeneous materials using different machines/probes to confirm our findings.

5. Conclusions

Although previous studies have assessed utility aspects of semi-quantitative strain elastography to calculate SR, most studies tackled references and targets with significant stiffness differences [8,9,11,13]. However, recent research focusing on MTrPs demonstrated that the magnitudes of the stiffness differences in real tissues are smaller than the ones analyzed in phantoms [12]. As previous reports demonstrated that the accuracy of strain elastography is directly proportional to the stiffness difference between two points, the main novelty of this study lies in the selection of a homogeneous material to calculate the reliability between examiners and the instrument validity considering the region of interest location and the experience of the examiners. We found that semi-quantitative elastography SR calculation shows an acceptable inter-examiner reliability, validity and variability of measurement. Reliability, validity and variability were similar independent of the examiner ultrasound and transducer use experience. However, our results suggested that central areas are more reliable and accurate than lateral areas of the image. This paper proposes technical considerations regarding the experience of the examiners and the most accurate region of interest for future studies assessing SRs of soft tissues with small stiffness differences.

Author Contributions

Conceptualization, J.A.V.-C. and U.V.; methodology, J.A.V.-C., U.V. and T.F.-R.; software, J.A.V.-C. and U.V.; investigation, J.A.V.-C.; resources, J.L.A.-B.; data curation, J.A.V.-C. and U.V.; writing—original draft preparation, J.A.V.-C.; writing—review and editing, C.F.-d.-l.-P.; visualization, G.M.G.-S.; supervision, J.A.V.-C.; project administration, U.V.; funding acquisition, G.M.G.-S. All authors have read and agreed to the published version of the manuscript.

Funding

This research and the APC were funded by Camilo José Cela University, grant number ELECTROP.

Institutional Review Board Statement

Not applicable.

Informed Consent Statement

Not applicable.

Data Availability Statement

The data that support the findings of this study are available from the corresponding author (JA Valera-Calero), upon reasonable request.

Conflicts of Interest

The authors declare no conflict of interest and the funders had no role in the design of the study; in the collection, analyses, or interpretation of data; in the writing of the manuscript, or in the decision to publish the results.

References

  1. Whittaker, J.L.; Teyhen, D.S.; Elliott, J.M.; Cook, K.; Langevin, H.M.; Dahl, H.H.; Stokes, M. Rehabilitative Ultrasound Imaging: Understanding the Technology and Its Applications. J. Orthop. Sports Phys. Ther. 2007, 37, 434–449. [Google Scholar] [CrossRef]
  2. Valera-Calero, J.A.; Sánchez-Jorge, S.; Alvarez-González, J.; Ortega-Santiago, R.; Cleland, J.A.; Fernández-De-Las-Peñas, C.; Arias-Buría, J.L. Intra-rater and inter-rater reliability of rehabilitative ultrasound imaging of cervical multifidus muscle in healthy people: Imaging capturing and imaging calculation. Musculoskelet. Sci. Pract. 2020, 48, 102158. [Google Scholar] [CrossRef] [PubMed]
  3. Valera-Calero, J.A.; Gallego-Sendarrubias, G.; Fernández-De-Las-Peñas, C.; Cleland, J.A.; Ortega-Santiago, R.; Arias-Buría, J.L. Cross-Sectional Area of the Cervical Extensors assessed with Panoramic Ultrasound Imaging: Preliminary Data in Healthy People. Musculoskelet. Sci. Pract. 2020, 50, 102257. [Google Scholar] [CrossRef] [PubMed]
  4. Valera-Calero, J.A.; Arias-Buría, J.L.; Fernández-De-Las-Peñas, C.; Cleland, J.A.; Gallego-Sendarrubias, G.M.; Cimadevilla-Fernández-Pola, E. Echo-intensity and fatty infiltration ultrasound imaging measurement of cervical multifidus and short rotators in healthy people: A reliability study. Musculoskelet. Sci. Pract. 2021, 53, 102335. [Google Scholar] [CrossRef]
  5. Gennisson, J.-L.; Deffieux, T.; Fink, M.; Tanter, M. Ultrasound elastography: Principles and techniques. Diagn. Interv. Imaging 2013, 94, 487–495. [Google Scholar] [CrossRef]
  6. Sigrist, R.M.; Liau, J.; El Kaffas, A.; Chammas, M.C.; Willmann, J.K. Ultrasound Elastography: Review of Techniques and Clinical Applications. Theranostics 2017, 7, 1303–1329. [Google Scholar] [CrossRef] [PubMed]
  7. Oh, J.H.; Kim, J.Y.; Kim, D.H.; Kim, Y.I.; Cho, J.H. Sonoelastography on Supraspinatus Muscle-Tendon and Long Head of Biceps Tendon in Korean Professional Baseball Pitchers. Korean J. Sports Med. 2016, 34, 28–35. [Google Scholar] [CrossRef] [Green Version]
  8. Franchi-Abella, S.; Elie, C.; Correas, J.-M. Performances and Limitations of Several Ultrasound-Based Elastography Techniques: A Phantom Study. Ultrasound Med. Biol. 2017, 43, 2402–2415. [Google Scholar] [CrossRef] [PubMed]
  9. Kishimoto, R.; Suga, M.; Koyama, A.; Omatsu, T.; Tachibana, Y.; Ebner, D.K.; Obata, T. Measuring shear-wave speed with point shear-wave elastography and MR elastography: A phantom study. BMJ Open 2017, 7, e013925. [Google Scholar] [CrossRef]
  10. Ozturk, A.; Grajo, J.R.; Dhyani, M.; Anthony, B.W.; Samir, A.E. Principles of ultrasound elastography. Abdom. Radiol. 2018, 43, 773–785. [Google Scholar] [CrossRef]
  11. Mulabecirovic, A.; Vesterhus, M.; Gilja, O.H.; Havre, R.F. In Vitro Comparison of Five Different Elastography Systems for Clinical Applications, Using Strain and Shear Wave Technology. Ultrasound Med. Biol. 2016, 42, 2572–2588. [Google Scholar] [CrossRef] [Green Version]
  12. Valera-Calero, J.; Sánchez-Jorge, S.; Buffet-García, J.; Varol, U.; Gallego-Sendarrubias, G.; Álvarez-González, J. Is Shear-Wave Elastography a Clinical Severity Indicator of Myofascial Pain Syndrome? An Observational Study. J. Clin. Med. 2021, 10, 2895. [Google Scholar] [CrossRef] [PubMed]
  13. Carlsen, J.F.; Ewertsen, C.; Saftoiu, A.; Lönn, L.; Nielsen, M.B. Accuracy of Visual Scoring and Semi-Quantification of Ultrasound Strain Elastography—A Phantom Study. PLoS ONE 2014, 9, e88699. [Google Scholar] [CrossRef]
  14. Kimberlin, C.L.; Winterstein, A.G. Validity and reliability of measurement instruments used in research. Am. J. Health-Syst. Pharm. 2008, 65, 2276–2284. [Google Scholar] [CrossRef] [PubMed]
  15. Bossuyt, P.M.; Reitsma, J.B.; Bruns, D.E.; Gatsonis, C.A.; Glasziou, P.; Irwig, L.; Lijmer, J.G.; Moher, D.; Rennie, D.; De Vet, H.C.W.; et al. STARD 2015: An updated list of essential items for reporting diagnostic accuracy studies. BMJ 2015, 351, h5527. [Google Scholar] [CrossRef] [Green Version]
  16. Whittaker, J.L.; Ellis, R.; Hodges, P.W.; Osullivan, C.; Hides, J.; Carnero, S.F.; Arias-Buria, J.L.; Teyhen, D.S.; Stokes, M.J. Imaging with ultrasound in physical therapy: What is the PT’s scope of practice? A competency-based educational model and training recommendations. Br. J. Sports Med. 2019, 53, 1447–1453. [Google Scholar] [CrossRef]
  17. Nicholls, J.; Alfuraih, A.; Hensor, E.M.A.; Robinson, P. Inter- and intra-reader reproducibility of shear wave elastography measurements for musculoskeletal soft tissue masses. Skelet. Radiol. 2020, 49, 779–786. [Google Scholar] [CrossRef] [PubMed] [Green Version]
  18. Zhu, B.; Yan, F.; He, Y.; Wang, L.; Xiang, X.; Tang, Y.; Yang, Y.; Qiu, L. Evaluation of the healthy median nerve elasticity: Feasibility and reliability of shear wave elastography. Medicine 2018, 97, e12956. [Google Scholar] [CrossRef]
  19. Bachasson, D.; Dubois, G.J.; Allenbach, Y.; Benveniste, O.; Hogrel, J.Y. Muscle Shear Wave Elastography in Inclusion Body Myositis: Feasi-bility, Reliability and Relationships with Muscle Impairments. Ultrasound Med. Biol. 2018, 44, 1423–1432. [Google Scholar] [CrossRef]
  20. Hackett, M.; Aveledo, R.; Lam, P.H.; Murrell, G.A. Reliability of shear wave elastography ultrasound to assess the supraspinatus tendon: An intra and inter-rater in vivo study. Shoulder Elb. 2020, 12, 18–23. [Google Scholar] [CrossRef]
  21. Corrigan, P.; Zellers, J.A.; Balascio, P.; Silbernagel, K.G.; Cortes, D.H. Quantification of Mechanical Properties in Healthy Achilles Tendon Using Continuous Shear Wave Elastography: A Reliability and Validation Study. Ultrasound Med. Biol. 2019, 45, 1574–1585. [Google Scholar] [CrossRef]
  22. Thomas, L.; Low, J.; Chan, K.; Durbridge, G. Shear wave elastography of the cervical arteries: A novel approach to the assess-ment of cervical arterial wall stiffness. An investigation of psychometric properties and intra-rater reliability. Musculoskelet. Sci. Pract. 2019, 40, 96–100. [Google Scholar] [CrossRef] [PubMed] [Green Version]
  23. Paluch, Ł.; Nawrocka-Laskus, E.; Wieczorek, J.; Mruk, B.; Frel, M.; Walecki, J. Use of Ultrasound Elastography in the Assessment of the Mus-culoskeletal System. Pol. J. Radiol. 2016, 81, 240–246. [Google Scholar] [CrossRef] [PubMed] [Green Version]
  24. Drakonaki, E.E.; Allen, G.M.; Wilson, D.J. Real-time ultrasound elastography of the normal Achilles tendon: Reproducibility and pattern description. Clin. Radiol. 2009, 64, 1196–1202. [Google Scholar] [CrossRef]
  25. Klauser, A.S.; Faschingbauer, R.; Jaschke, W.R. Is sonoelastography of value in assessing tendons? Semin. Musculoskelet. Radiol. 2010, 14, 323–333. [Google Scholar] [CrossRef]
  26. Drakonaki, E.E.; Allen, G.M. Magnetic resonance imaging, ultrasound and real-time ultrasound elastography of the thigh muscles in congenital muscle dystrophy. Skelet. Radiol. 2010, 39, 391–396. [Google Scholar] [CrossRef] [PubMed]
  27. Botar-Jid, C.; Damian, L.; Dudea, S.M.; Vasilescu, D.; Rednic, S.; Badea, R. The contribution of ultrasonography and sonoelastography in assessment of myositis. Med Ultrason. 2010, 12, 120–126. [Google Scholar]
  28. Yanagisawa, O.; Niitsu, M.; Kurihara, T.; Fukubayashi, T. Evaluation of human muscle hardness after dynamic exercise with ul-trasound real time tissue elastography: A feasibility study. Clin. Radiol. 2011, 66, 815–819. [Google Scholar] [CrossRef]
  29. Botanlioglu, H.; Kantarci, F.; Kaynak, G.; Unal, Y.; Ertan, S.; Aydingoz, O.; Erginer, R.; Unlu, M.C.; Mihmanli, I.; Babacan, M. Shear wave elastography properties of vastus lateralis and vastus me-dialis obliquus muscles in normal subjects and female patients with patellofemoral pain syndrome. Skelet. Radiol. 2013, 42, 659–666. [Google Scholar] [CrossRef] [PubMed]
  30. Gerwin, R.D.; Shannon, S.; Hong, C.-Z.; Hubbard, D.; Gevirtz, R. Interrater reliability in myofascial trigger point examination. Pain 1997, 69, 65–73. [Google Scholar] [CrossRef]
  31. Sikdar, S.; Shah, J.P.; Gebreab, T.; Yen, R.H.; Gilliams, E.; Danoff, J.; Gerber, L.H. Novel applications of ultrasound technology to visualize and characterize myofascial trigger points and surrounding soft tissue. Arch. Phys. Med. Rehabil. 2009, 90, 1829–1838. [Google Scholar] [CrossRef] [PubMed] [Green Version]
  32. Sikdar, S.; Ortiz, R.; Gebreab, T.; Gerber, L.H.; Shah, J.P. Understanding the vascular environment of myofascial trigger points using ultrasonic imaging and computational modeling. In Proceedings of the 2010 Annual International Conference of the IEEE Engineering in Medicine and Biology, Buenos Aires, Argentina, 31 August–4 September 2010; Volume 2010, pp. 5302–5305. [Google Scholar]
  33. Jafari, M.; Bahrpeyma, F.; Mokhtari-Dizaji, M.; Nasiri, A. Novel method to measure active myofascial trigger point stiffness using ultrasound imaging. J. Bodyw. Mov. Ther. 2018, 22, 374–378. [Google Scholar] [CrossRef] [PubMed]
  34. Winn, N.; Lalam, R.; Cassar-Pullicino, V. Sonoelastography in the musculoskeletal system: Current role and future directions. World J. Radiol. 2016, 8, 868–879. [Google Scholar] [CrossRef] [PubMed]
Figure 1. (A) Ultrasound transducer placement over the phantom. (B) Ultrasound image showing the phantom and measuring area (pink) above the internal artificial vessel.
Applsci 11 09247 g001
Figure 2. Strain ratio (SR) calculation of lateral and central areas. Central area 1 (reference) was compared with Central area 2 (target). Lateral area 1 (reference) was compared with Lateral area 2 (target).
Applsci 11 09247 g002
Table 1. Inter-examiner reliability and variability of semi-quantitative elastography stiffness ratio measurements.
Examiner 1
(Experienced)
(n = 50 Images)
Examiner 2
(Experienced)
(n = 50 Images)
Examiner 3
(Novice)
(n = 50 Images)
Examiner 4
(Novice)
(n = 50 Images)
Lateral areas of the image
SR obtained 0.960.981.091.10
95% CI (Lower; upper limits)0.92; 1.000.90; 1.051.04; 1.141.03; 1.16
Variability of the measurements (%)14.7517.5017.4015.42
Difference between examiners0.01 ± 0.04 a0.11 ± 0.05 d,†
0.12 ± 0.03 b,†0.12 ± 0.04 e,†
0.13 ± 0.04 c,†0.00 ± 0.04 f
Central area of the image
SR obtained0.970.970.960.97
95% CI0.95; 0.980.95; 0.990.94; 0.980.94; 1.00
Variability of the measurements (%)5.615.386.947.80
Difference between examiners0.00 ± 0.01 a 0.01 ± 0.01 d
0.00 ± 0.01 b0.00 ± 0.01 e
0.00 ± 0.02 c 0.01 ± 0.02 f
Differences between measurement locations
SR difference0.00 ± 0.020.00 ± 0.040.13 ± 0.02 *0.11 ± 0.03 *
a Examiner 1–Examiner 2; b Examiner 1–Examiner 3; c Examiner 1–Examiner 4; d Examiner 2–Examiner 3; e Examiner 2–Examiner 4; f Examiner 3–Examiner 4; * Significant differences between measurements in the lateral areas and the central area (p < 0.001); Significant differences between examiners were found (p < 0.05).
Table 2. Validity of semi-quantitative elastography for calculating stiffness ratios within the same image.
Examiner 1
(Experienced)
(n = 50 Images)
Examiner 2
(Experienced)
(n = 50 Images)
Examiner 3
(Novice)
(n = 50 Images)
Examiner 4
(Novice)
(n = 50 Images)
Lateral areas of the image
SR obtained 0.96 0.981.09 *,1.10 *,
Error 0.03 ± 0.140.02 ± 0.170.09 ± 0.170.10 ± 0.15
Absolute Error 0.11 ± 0.090.14 ± 0.080.15 ± 0.120.14 ± 0.06
Coefficient of Variation (%)0.140.170.150.13
Percent Error (%)11.8014.2815.1612.72
Mean Error of Measurements0.14 ± 0.05 *
Central areas of the image
SR obtained0.97 0.970.960.97
Error 0.02 ± 0.050.03 ± 0.060.03 ± 0.060.04 ± 0.06
Absolute Error 0.04 ± 0.030.05 ± 0.030.05 ± 0.050.06 ± 0.03
Coefficient of Variation (%)0.050.060.060.06
Percent Error (%)4.895.155.526.18
Mean Error of Measurements0.05 ± 0.02 *
* Significant differences between lateral areas and central areas (p < 0.001); Significant differences with reference SR were found (p < 0.001).
Publisher’s Note: MDPI stays neutral with regard to jurisdictional claims in published maps and institutional affiliations.

