Article

Webcam Eye Tracking for Monitoring Visual Attention in Hypothetical Online Shopping Tasks

Laboratory for Behavioural and Neuroeconomics, Department of Agriculture, South Westphalia University of Applied Sciences, Lübecker Ring 2, 59494 Soest, Germany
*
Author to whom correspondence should be addressed.
Appl. Sci. 2021, 11(19), 9281; https://doi.org/10.3390/app11199281
Submission received: 8 September 2021 / Revised: 25 September 2021 / Accepted: 30 September 2021 / Published: 6 October 2021

Abstract

:
Online retailers are challenged to present their products in an appropriate way to attract customers’ attention. To test the impact of product presentation features on customers’ visual attention, webcam eye tracking might be an alternative to infrared eye tracking, especially in situations where face-to-face contact is difficult. The aim of this study was to examine whether webcam eye tracking is suitable for investigating the influence of certain exogenous factors on customers’ visual attention when visiting online clothing shops. For this purpose, screenshots of two websites of two well-known online clothing retailers were used as stimuli. Linear regression analyses were conducted to determine the influence of the spatial position and the presence of a human model on the percentage of participants visiting a product depiction. The results show that products presented by human models and located in the upper middle area of a website were visited by more participants. From this, we were able to derive recommendations for optimising product presentation in online clothing shops. Our results fit well with those of other studies on visual attention conducted with infrared eye tracking, suggesting that webcam eye tracking could be an alternative to infrared eye tracking, at least for similar research questions.

1. Introduction

Trading of goods and services via the internet is growing continuously. In Europe, B2C e-commerce turnover has increased from EUR 279.3 billion in 2013 to EUR 636 billion in 2019 [1]. The COVID-19 pandemic has reinforced this this trend, by increasing the frequency of online purchases and by affecting the structure of online customers, with a growing proportion of older people using the internet for purchases as well [2]. However, not only customers have changed their purchasing behaviour in favour of e-commerce, but the retail sector has also responded to the amended conditions. Due to the pandemic-related restrictions on access to shops, stationary retailers started selling their products online or extended their existing online business [3], and many of them intend to expand their online activities in the future. This puts these companies in direct competition with pure online retailers, who have years of experience with web presence and are constantly developing their online shops [4]. In order to survive this strong competition, it is necessary to understand the behaviour of online customers and to use this knowledge to improve the attractiveness of one’s own online shop [5].
In this context, the customers’ gaze behaviour is of particular importance, since visual attention is often a prerequisite to subsequent processes which lead customers to purchase a product [5,6,7]. Usually, infrared eye tracking systems in a laboratory setting are applied to monitor visual attention. However, technological advances have led to the development of eye tracking systems that require only a webcam and software to record gaze behaviour and thus are not bound to laboratories and specific eye tracking devices. Although webcam eye tracking is considered a promising method that has the potential to transform usability and market research [8], only an extremely limited number of scientific studies exist that employed this method. These studies provide initial evidence that webcam eye tracking might be an alternative to infrared eye tracking, but without any specific reference to market research questions [8,9].
With this study, we contribute to the literature by applying webcam eye tracking to a specific market research question. The aim is to investigate the simultaneous influence of different design elements of an online shop on the visual attention of potential customers and, based on the results, to assess whether webcam eye tracking could be suitable for this kind of research. We focus on the clothing retail sector as an example, since clothing belongs to the top-selling product groups online, accounting for more than a quarter on the B2C e-commerce turnover in Germany in 2020 [10]. Taking websites of two well-known online clothing retailers, three design-related (exogenous) factors that might influence customers’ visual attention on these websites are investigated:
  • Horizontal position of the product on the online shop’s website;
  • Vertical position of the product on the online shop’s website;
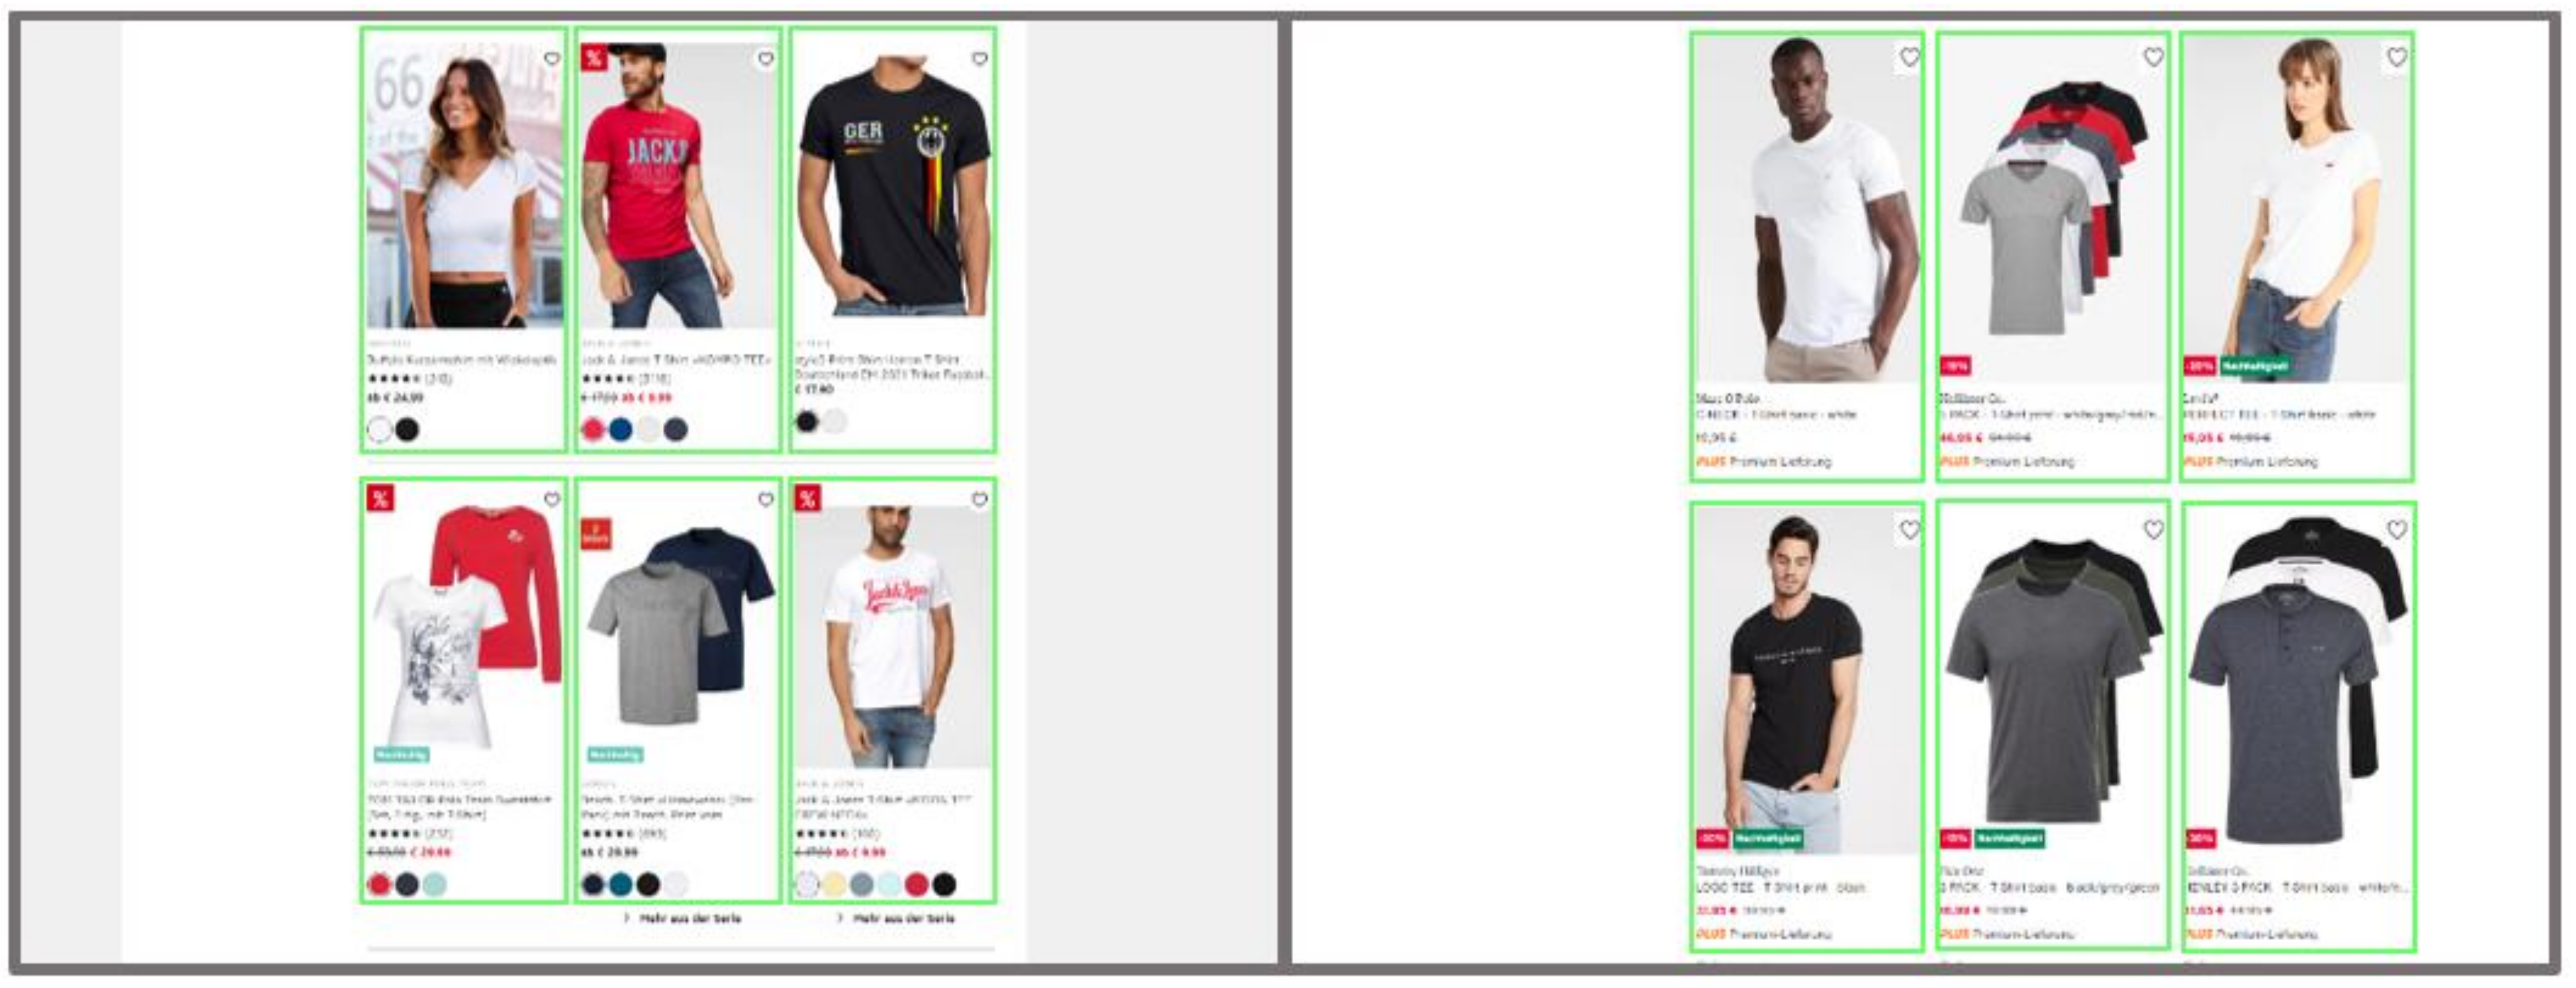
  • Product picture displaying the clothes worn by a person vs. product picture displaying only the clothes.
Although the above exogenous factors have been shown to have an impact on visual attention during website visits, to the best of our knowledge there has not yet been a study that examines the impact of all three factors on visual attention during an online shopping task simultaneously, nor has there been a study doing this using webcam eye tracking. In this paper, we close this research gap by analysing the visual attention of 20 potential customers to products in online clothing shops via webcam eye tracking. Statistical analysis shows that the spatial position and the presentation of the clothes by a human model influenced visual attention in a way that is largely consistent with the existing literature, suggesting that webcam eye tracking could be a suitable tool for capturing visual attention.

2. Literature Review

There are a variety of techniques for monitoring human–computer interactions while visiting a website. On the server site, sever logs can be collected. On the client site, user behaviour can be monitored in more detail with mouse and event tracking. Mouse clicks and moves, scrolling, keyboard inputs or selecting, copying or printing content can be recorded and analysed [11]. Applications such as the e-commerce preference monitoring (ECPM) behaviour-tracking tool allow capturing a spectrum of online customer activities [12]. However, to obtain information about the website user’s visual attention, eye tracking is an essential tool [13].
Traditionally, eye tracking devices based on infrared technology are used, either in the form of eye tracking glasses or remote eye trackers. They enable non-invasive eye movement recording under largely natural conditions with high precision and at manageable costs [14]. Besides applications, e.g., in medicine, psychology, learning, and reading research [15,16,17], eye tracking is widely used in marketing and user experience research [8,14]. However, the use of traditional eye trackers requires participants to visit an eye tracking laboratory [9] or researchers to visit participants to take the eye tracking recordings, resulting in time and travel costs and requiring organisational preparation [8]. In addition, the researchers have to handle the eye tracking devices and supervise each participant from the beginning to the end of an experiment, as they must at least start and stop the eye tracking recording. They also have to educate participants about potential (admittedly extremely rare) health impairments that might be triggered by the infrared eye tracking devices [18]. Another issue that emerged with the COVID-19 pandemic outbreak are pandemic-related recommendations and orders to avoid physical contacts. This, of course, also hinders eye tracking studies that require face-to-face contact between researchers and participants.
An alternative to overcome the financial, logistical, and organisational challenges might be webcam-based eye tracking. The technology does not require any specific eye tracking equipment, only a webcam and software, which gives researchers access to a large number of potential participants who would be otherwise too far away [8]. Nowadays, a webcam is often already integrated into computer or laptop screens, so participants can take part in a webcam eye tracking study from home using their own equipment and without having to interact with a researcher face-to-face, avoiding health risks from infrared light and infection risks in times of a pandemic. However, existing webcam eye tracking solutions suffer from lower accuracy of the eye tracking data compared with traditional eye trackers [8,19]. In addition, it is questionable if each participant can ensure optimal and reproducible experimental conditions, e.g., with regard to the quality of the webcam, the incidence of light on the camera and eyes, or the appropriate distance to the computer screen, without a researcher supervising the experimental procedure. Thus, the online approach raises some questions about the validity of the experimental process [9,19]. Despite these challenges, webcam eye tracking is considered by various authors to be a promising technology for the future. This applies in particular to studies that primarily aim to determine which elements attract user’s visual attention on a website, as long as extremely high accuracy is not required, e.g., if the elements are large enough and have sufficient distance from each other [8,9,20].
Visual attention is driven both by endogenous or top-down factors such as an individual’s goals, preferences, expectations, task, cognitive load and mood and by exogenous or bottom-up factors that are beyond the individual’s control such as visual salience, surface size or position of an object [7,21,22]. Which factors dominate in guiding visual attention are controversially discussed. While some studies suggest that endogenous factors have a stronger influence, others point to the decisive importance of exogenous factors [7,22,23,24]. Regardless of this discussion, however, it is clear that endogenous factors of potential customers can hardly be controlled by e-commerce retailers, but they can indeed control exogenous factors in relation to their own online shop. Knowing in which way these exogenous factors are associated with visual attention of customers visiting an online shop could help to optimise visual aspects of the shop or the presentation of its products.
Position effects of objects on visual attention has already been studied both in virtual and in real environments using traditional eye tracking (e.g., [7,22,25,26]). In horizontal orientation, higher visual attention is paid to the centrally located option, e.g., the centrally located item within a product category in a virtual supermarket shelf or within a website scene [25]. Bindemann [27] describes a scene and screen centre bias when visual stimuli are presented on a computer screen. However, Espigares-Jurado et al. [26] report that pictures placed in the upper area of a hotel booking website capture more visual attention than the same pictures when positioned farther away from the top of the website. Analysing viewport (the part of a webpage that is visible at any given time to a user) data, Lagun and Lalmas [28] demonstrate that participants pay considerably more attention to upper parts of a website than to lower parts when reading online news. Sulikowski et al. [13] describe positions effects on visual attention within recommendation interfaces of e-commerce websites, with the upper positions of a vertical layout and the middle positions of a horizontal layout receiving more visual attention.
Wang et al. [29], who investigated the effect of incorporating human images into B2C websites on visual attention using traditional eye tracking, conclude that the effect of human images on gaze behaviour depends on the type of product. On websites selling entertainment products such as clothing, human images attract more visual attention, but not on websites selling utilitarian products [29]. Boardman and McCormick [30] report similar findings: models are the product presentation feature which most strongly influences visual attention on websites selling clothing.

3. Materials and Methods

3.1. Participants

The study was conducted in June 2021 as practical part of a master course in Behavioural and Neuroeconomics at the South Westphalia University of Applied Sciences. All participants were recruited by the students of the course among their relatives, friends, and acquaintances and were not financially rewarded for their participation. Before participating in the study, all subjects were provided with background information about the experiment and privacy policy and gave their informed consent to the procedure. All subjects participated from home.
A total of twenty-six participants were recruited, with two participants dropping out of the study due to technical problems. Four additional subjects were excluded from analysis due to inadequate tracking of gaze behaviour (eye tracking quota < 70%), resulting in data from twenty participants being available for analysis. Of these remaining participants, 45% were female and 50% were male. The mean age was 35.3 (SD 13.2) years. One participant preferred not to provide gender and age.

3.2. Software and Hardware

The cloud-based software EYEVIDO Lab was employed to set up and run the experiment. The software enables collaborative online creation and analysis of screen-based eye tracking studies and offers additional features such as embedding questionnaire elements. The software’s cloud architecture also allows simultaneous online data collection from multiple participants. The typical workflow of a cloud eye tracking study with EYEVIDO Lab is outlined in the following. First, a study is created in the web portal, i.e., the stimuli and accompanying questions, if any, are entered, and the areas of interest (AOIs) are set according to the hypotheses. Subsequently, the study is launched. The participants take part in the study via the recording tool (tester software), which must be downloaded to the participants’ computer beforehand. The tester software identifies the eye movements of the participants, stores all inputs, records the screen content, and transmits all data encrypted to the server of the EYEVIDO GmbH via the internet. This means that participation can take place from any location, as long as an Internet connection is available. The investigator can view and analyse the results at any time in the web portal and export reports in CSV format. Reports can be generated for each individual participant as well as across participants. The reports contain numerical information based on fixations within the defined AOIs, such as number and percentage of fixations, fixation duration or number of visits within an AOI. The across-participant report additionally shows the number of participants who had at least one fixation within an AOI. Visualisations (heatmaps, gazeplots) can also be generated and exported [31].
The software can be used in conjunction with both infrared eye trackers and webcams [31]. Since our goal was to address the question of whether webcam eye tracking could be suitable for analysing users’ visual attention while visiting online shops, we used only the webcam function in this study for tracking the participants’ gaze behaviour. All participants used their own equipment, i.e., their own computers and webcams, for participating in the study.

3.3. Stimuli and Task

Two screenshots, each taken from a website of well-known online retailers, served as stimuli. The product category was narrowed down to the single product category T-shirts in order to exclude effects that could arise from searching for specific items of clothing (e.g., trousers, blouses). The product category T-shirts was chosen because T-shirts are a ubiquitous clothing item worn by a large number of people of many age groups.
When selecting the online shops for the screenshots, care was taken that they would allow analysing the factors expected to influence visual attention, i.e., spatial location and the inclusion of human images. In both online shops, product depictions were arranged in a table-like manner with three columns and multiple rows (online shop A 16 rows; online shop B 28 rows), and both online shops included human models in some of their product depictions (cf. Figure 1). In online shop A, 75.0% (36 out of 48) of the product depictions involved a human model wearing the T-shirts, online shop B included human models in 58.3% (49 out of 84) of the product depictions. To enable quantitative analysis, each product depiction was defined as an area of interest (AOI). Each AOI was uniquely labelled, with the label containing the name of the website, row and column number and whether a human model was depicted. Within each stimulus, all AOIs were set exactly to the same size, with all AOIs of online shop A having a width of 274 px and a height of 560 px, and all AOIs of website B having a width of 308 px and a height of 560 px.
The online eye tracking experiment started with a 9-point calibration procedure provided by the EYEVIDO Lab software. After successfully completing the calibration process, participants were asked to imagine that they were buying a T-shirt for a friend at an online store. They were instructed to behave as they normally would when shopping online. By clicking on the corresponding product, they should mark their choice of a T-shirt (which was not recorded), and then proceed with the study. After seeing the screenshot of the first online store and selecting a T-shirt, participants responded to the four items of the short version of the Visual Aesthetics of Websites Inventory (VisAWI-S) described by Moshagen and Thielsch [32]. Each question captured one of the four facets of visual aesthetics, which are Simplicity, Diversity, Colourfulness, and Craftsmanship [32]. Following the work of Moshagen and Thielsch [32] and Hirschfeld and Thielsch [33], participants were asked to indicate their level of agreement to each item on a 7-point Likert scale (ranging from 1 ‘strongly disagree’ to 7 ‘strongly agree’). Participants’ assessment of the visual aesthetics of the online shop was surveyed, since different perceptions of visual aesthetics might be associated with different gaze patterns [34]. The same procedure was applied the second online shop. Eye tracking data was recorded only while the participants were looking at the online shop screenshots.

3.4. Data Analysis

All statistical analyses were realised with the software STATA, version 16 [35].
The assessments of the visual aesthetics of the two online shops were compared using the Wilcoxon signed rank test. The test was applied to compare each facet of the VisAWI-S and the overall mean (i.e., the mean value calculated from all facets) between the shops.
Linear regression analysis was used to estimate separately for each online shop the influence of the exogenous factors vertical position (row; continuous variable), horizontal position (three categories: left/middle/right), and presentation of a human model (two categories: yes/no) on the percentage of participants who visited the defined AOIs, i.e., the product depictions. The percentage of participants visiting an AOI is interpreted as a sign of attention-grabbing properties of an interface element [36] and could thus serve as a measure of visual attention driven by bottom-up factors.

4. Results

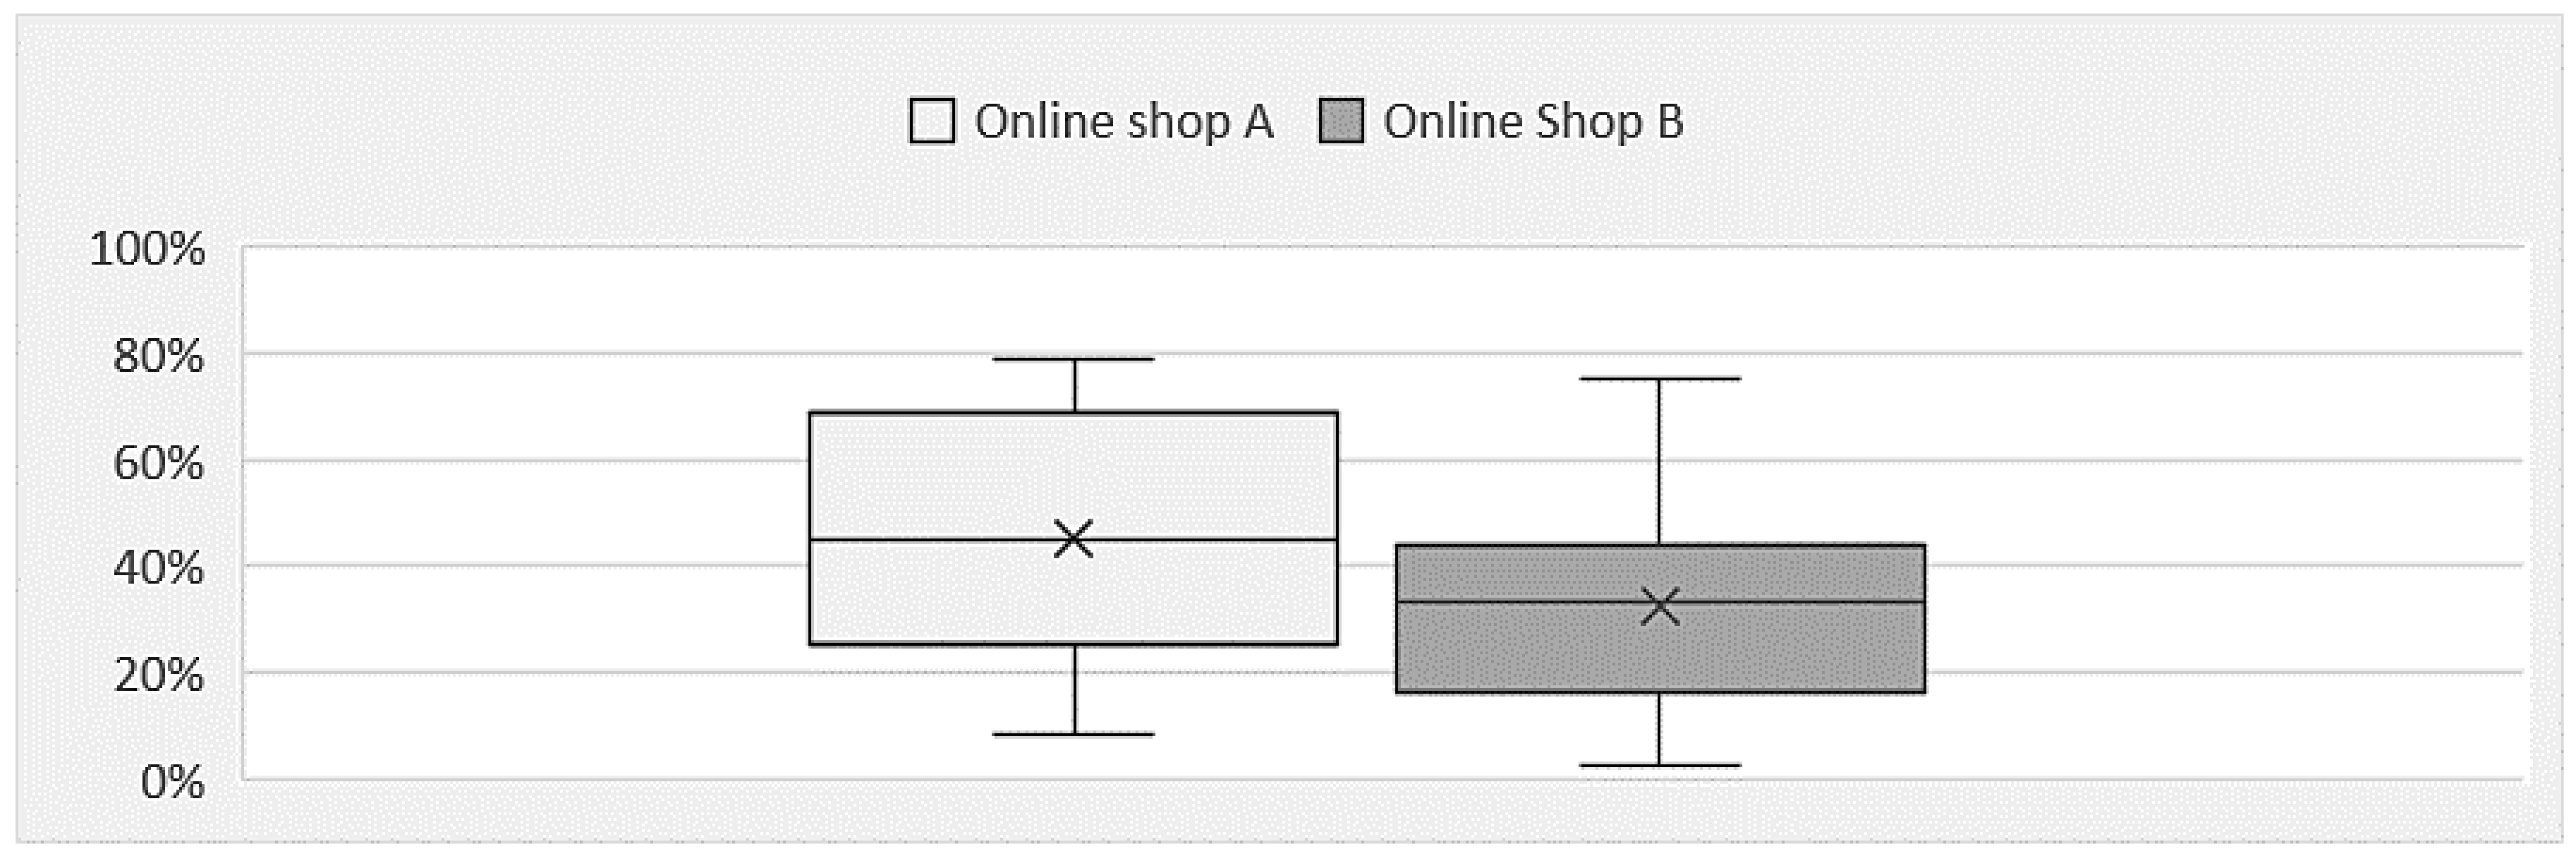
4.1. Eye Tracking Quota

The eye tracking quota indicates the ratio of valid eye tracking data to faulty data with a high eye tracking quota being a sign for a good quality of the eye tracking data. Faulty data can be caused, for example, by an inappropriate sitting position or reflection in participants’ glasses [31]. The eye tracking quotas of the four participants excluded from the analysis ranged from 2.8% to 58.6%. The remaining twenty participants included in the analysis achieved eye tracking quotas ranging from a minimum of 72.9% to a maximum of 99.4%, with a mean of 91.7 (±7.65)%.

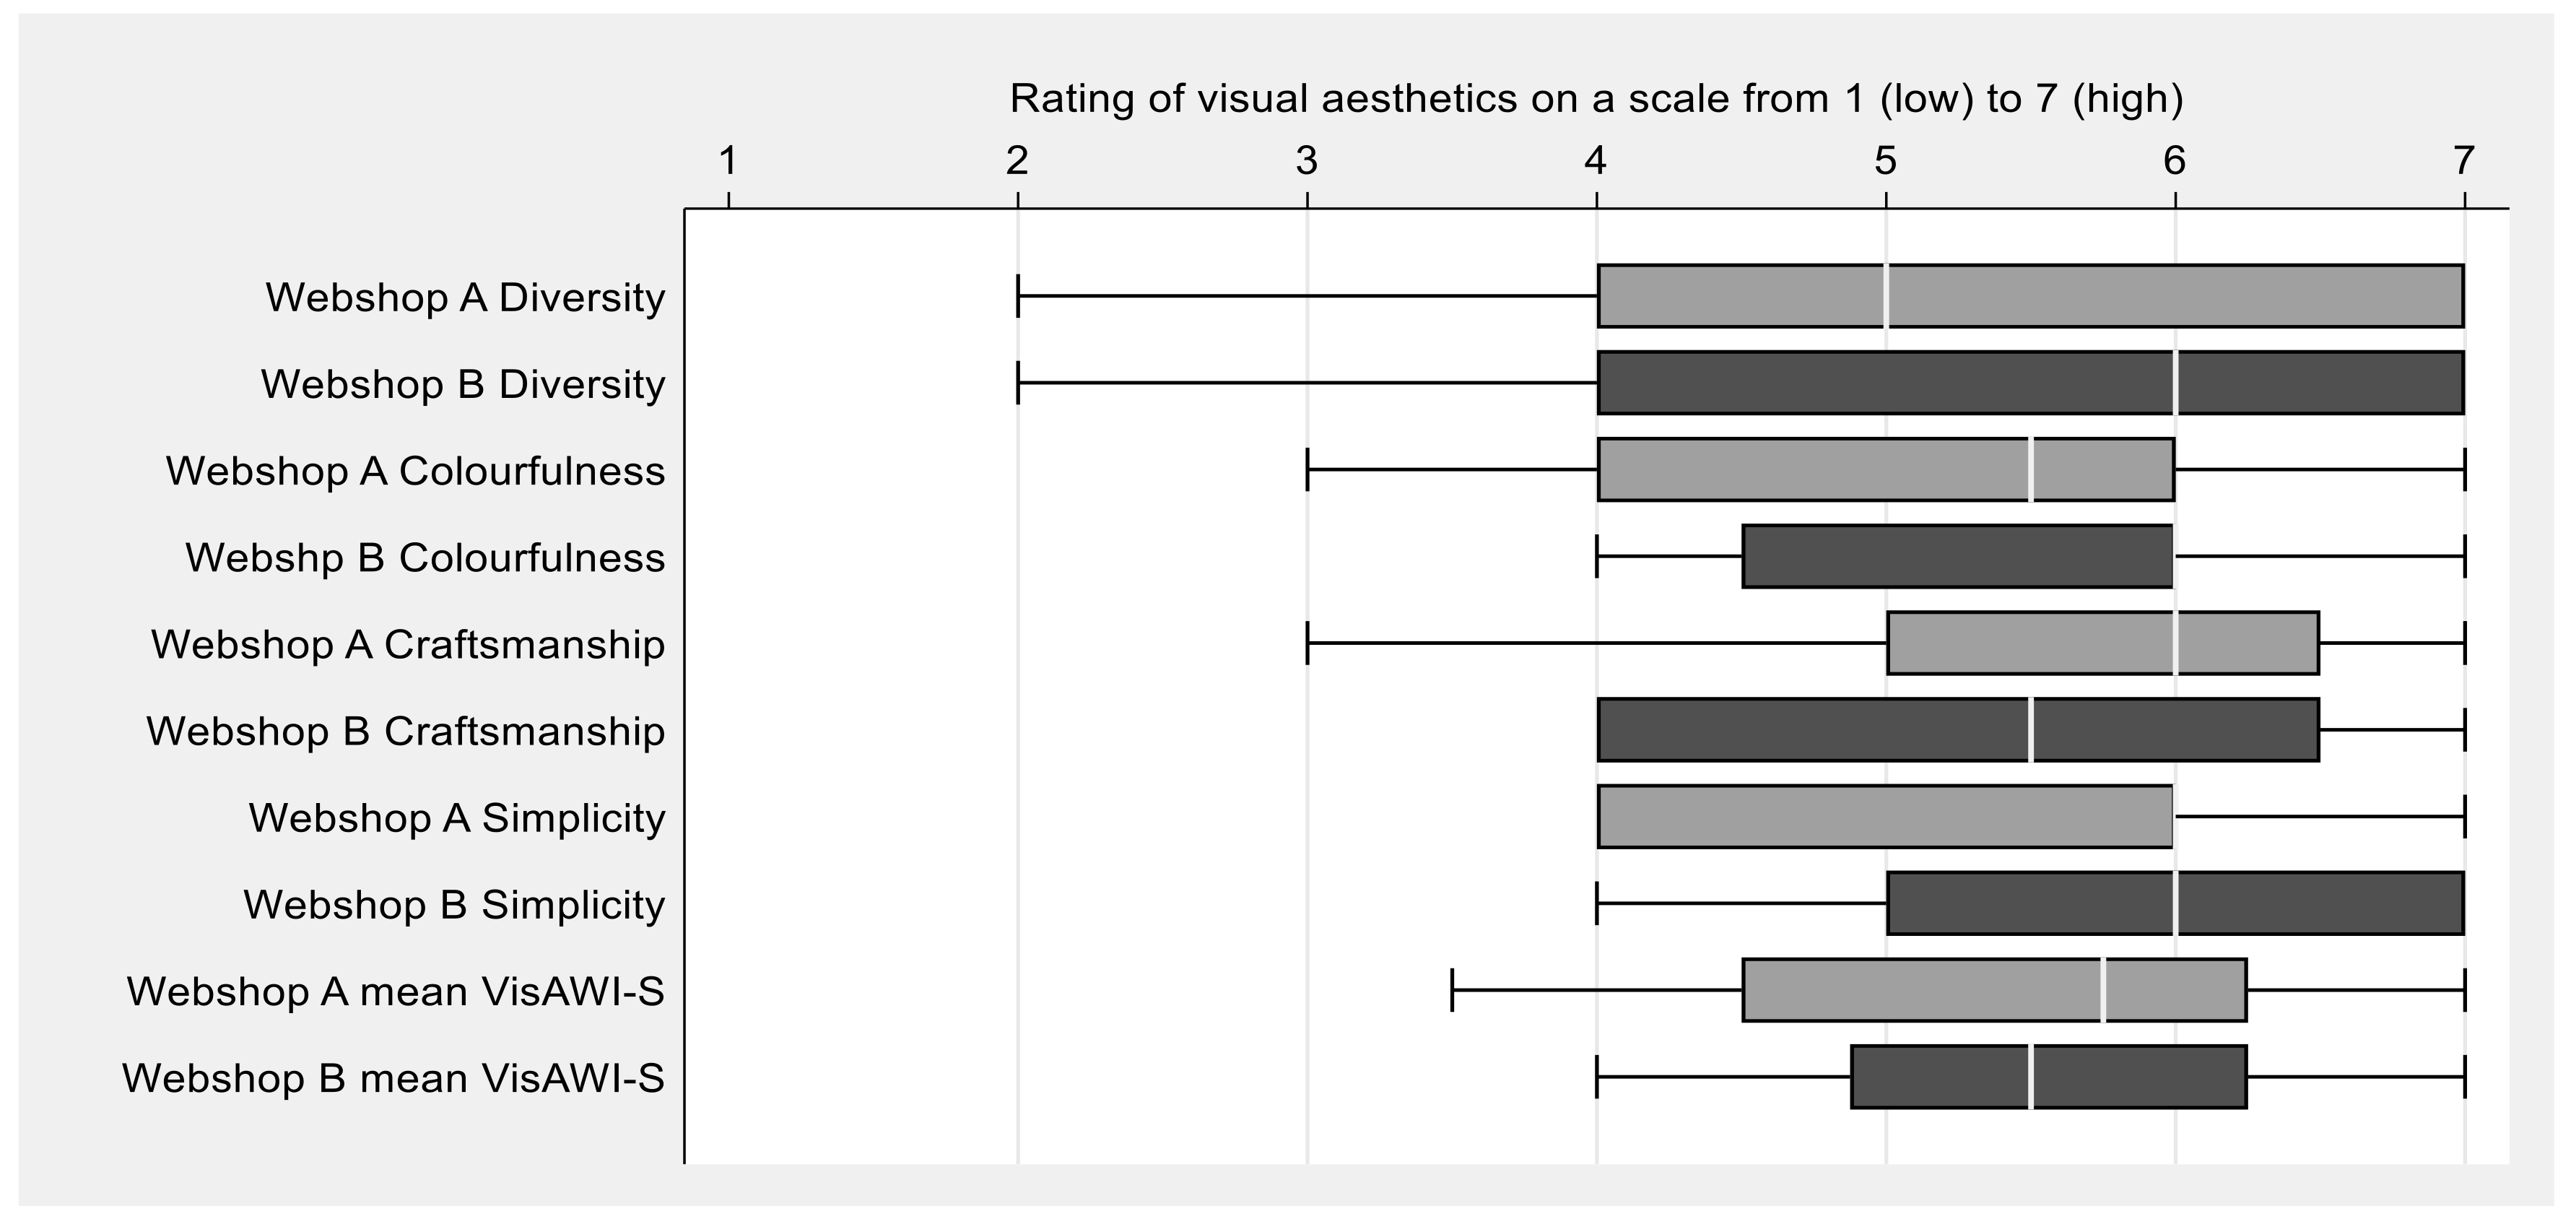
4.2. Assessment of the Online Shops’ Visual Aesthetics

Figure 2 presents the participants’ assessment of the facets of visual aesthetics. For both web-shops, the median of all facets was at least at the value of 5, meaning that it was always above the mean value of the scale. All Wilcoxon signed-rank tests were non-significant (Diversity z = −0.98, p = 0.33; Colourfulness z = −0.53, p = 0.60; Craftsmanship z = 0.17, p = 0.86; Simplicity z = −1.88, p = 0.06; mean VisAWI-S z = −1.33, p = 0.18), indicating that online shop A and online shop B did not differ in terms of visual aesthetics.

4.3. Visual Attention Paid to the Product Depictions

Figure 3 gives an overview on the proportion of AOIs (i.e., the product depictions) that received visual attention. The boxplots show that there were considerable differences between the participants. In addition, in online shop B, which contained almost twice as many product depictions compared with shop A, a smaller proportion of product depictions received visual attention than in online shop A. In online shop A, the lower quartile was 26.6%, the median was 44.8%, and the upper quartile was 64.6%. In online shop B, the lower quartile amounted to 18.2%, the median to 33.3% and the upper quartile to 40.8%. This means that in online shop A, half of the people looked at less than 50% of the product depictions. In online shop B, even three quarters of the people looked at less than 50% of the product depictions.
Factors that could explain differences in the visual attention the product depictions received were included in linear regression analyses. Table 1 presents the results of the linear regression analyses for both online shops. Both models were significant (p < 0.001). The independent variables explained more than 80% of the variance of the dependent variable, i.e., the percentage of participants visiting an AOI consisting of a product depiction.
The independent variables affected the dependent variable in a similar way in both models. With an increasing number of the row (i.e., the further down on the website the product depiction was located), the percentage of participants who looked at the product decreased. In online shop A, an increase in one row was associated with a decrease of 4%, and in online shop B with a decrease of 2%. In other words, with 16 rows in online shop A, the model indicated that 64% less participants looked at the product depictions in the last row compared with the first row; in shop B with 28 rows, the decrease amounted to 56%.
A product depiction in the middle of the three columns was associated with 16% (online shop A) and 10% (online shop B) more participants looking at the product depiction compared with the left column. In online shop A, significantly more participants also looked at product depictions in the right column compared with the left column. In online shop B, however, no differences were found between the right and left columns. A human model in the product depiction was associated with an increase of 8% (online shop A) and 4% (online shop B) participants who looked at the product depiction.

5. Discussion

Using webcam eye tracking, this research examined the influence of horizontal and vertical position and the inclusion of human models in product depictions on visual attention during an online shopping task. The results met our expectations and were largely in line with existing literature.
The visual aesthetics of both online stores was rated as high with a median of 5 for all four facets of the VisAWI-S. According to [33], a score higher than 4.5 on the Visual Aesthetics of Websites Inventory is associated with an overall good impression of a website. No significant differences were found between the stores, so that differences in gaze behaviour between online shop A and B that might be attributed to visual aesthetics can be largely excluded.
The results of the linear regression analyses suggest that the three exogenous factors included in the analyses drove visual attention in a similar way in both online shops. Product depictions placed higher up on the website, located in the middle row, and containing a human model were visited by more participants.
A similar influence of the vertical position of an item on a website as in our study is described by several authors. Eye tracking results of Espigares-Jurado et al. [26] as well as viewport and eye tracking data of Lagun and Lalmas [28] indicate that upper parts of a website receive more attention than lower parts. Shrestha and Lenz [37] point out that web page sections of an online shop that are visible when the website is accessed receive more visual attention than sections that are only visible by scrolling down. Chen and Pu [38] compared gaze patterns across three online stores with differently designed websites. Their eye tracking data clearly show that the further down a product depiction is located on a website, the less visual attention it receives, with this effect being considerably stronger for a pure list layout. A more structured layout, where product depictions are grouped into categories and the website is thus divided into several sections, increases visual attention in the lower sections [38].
Higher visual attention to the centre of the scene has been repeatedly reported (e.g., [6,27,39]). This spatial bias is believed to have physiological causes related to the oculomotor system [39]. However, research by Chen and Pu [38] shows that when products in an online store are presented in a list layout (i.e., one product per row) or with two columns, this tendency towards the centre does not emerge as clearly. Then, the spatial bias is shifted to the upper left areas of the list or of each column [38].
The effect of human models attracting visual attention observed in our study matches findings of other studies examining gaze behaviour on e-commerce websites offering clothing. Research by Menon et al. [40] and Boardman and McCormick [30] show that product depictions of clothing worn by human models receive more visual attention than product depictions with clothing presented on torso mannequins. This means that online shoppers are visually stimulated by model images [30], at least when the model is of high visual appeal; that is, if it fits well with the product to be sold [41]. The clothes displayed on a human model help consumers to assess the shape and the fit better than on a torso mannequin, which may evoke positive emotional responses and support customers’ decision making [30,42]. In addition, it can increase purchase intention [43]. Whether or not the models’ heads are shown seems to be of secondary importance in this context [43,44]. Research by Lindström et al. [44], contrasting realistic mannequins with and without heads, shows that while in physical stores mannequins with heads increase purchase intention and help customers to better evaluate the clothing presented, the style of the mannequin has no influence when products are presented in an online store.
A few recommendations can be derived from the above. First, online retailers selling clothing should consider position effects when presenting their products. Depending on the objective, online retailers have several options: Since both horizontal and vertical position affect visual attention, they might consider changing the positions [45], i.e., the row and the column, of product depictions periodically if they want to promote all products equally. Clothing that needs to be particularly promoted could be placed in areas that receive the most visual attention, that is, in the upper middle parts of a website. It might also be useful to arrange product depictions in only two columns to reduce a bias to the centre, and categorize them to direct more visual attention to the lower parts of a website (cf. [38]).
Second, online retailers should bear in mind that presenting clothing on human models can increase customers’ visual attention. If the goal is to promote sales of certain products, these products should be presented by human models, not just by torso mannequins. If no product should be highlighted, then all products should be presented in the same way. In this respect, it could be a competitive advantage over other online retailers if all clothing items are presented on models, as this form of presentation makes it easier for customers to assess the fit and to make a purchase decision [30]. Whether realistic mannequins achieve the same effect in terms of directing visual attention as human models was not investigated in this study.
Our findings could also help (private) sellers of second hand clothing. Here, too, it could be beneficial to present the clothing items on human models instead of on a hanger or lying flat. Possibly, this could help to encourage more people to buy second-hand clothes, which would be desirable for sustainability reasons.
Finally, online retailers might consider using webcam eye tracking to test the impact of different modes of product presentation on customers’ visual attention. The impact of exogenous factors on visual attention observed in our study is largely consistent with existing literature. Therefore, our study confirms the findings of Burton et al. [8] that webcam eye tracking seems suitable for marketing and usability research that aim to determine where the user’s visual attention is drawn, provided the stimulus is of reasonable size and the number of participants is sufficient to compensate for losses due to low eye tracking quotas. Webcam eye tracking could be particularly advantageous when face-to-face contacts are not possible or should be avoided (e.g., in pandemic situations) or in case arranging face-to-face contacts would cause prohibitive costs. Webcam eye tracking could have the potential to facilitate cross-country comparative eye tracking studies since it is neither bound to a specific (expensive) device, nor to a laboratory, nor to physical contact between researchers and participants.

Limitations and Further Research

This study has some limitations which need to be discussed and could serve as a basis for further research. First, our judgement of webcam eye tracking being a suitable tool is based on the observation that our data recorded with the software EYEVIDO Lab are in line with results obtained with infrared eye tracking by other researchers. To substantiate this statement, and to further assess the potential of webcam eye tracking, comparative studies could be conducted with webcam and infrared eye tracking using the same stimuli and tasks. In this context, other providers of webcam eye tracking software could also be included.
In further studies, various factors potentially influencing gaze behaviour could be manipulated in an experimental setting. Thus, it could be investigated how the aspects mentioned in the discussion, e.g., changing positions or different partitioning of the website, influence visual attention. In addition, other conditions could be changed, such as exposure times or task. Considering participant characteristics such as age, gender, or attitudes in the statistical analyses could further contribute to explain differences in visual attention.
Product depictions should be characterised not only by showing a human model or not but also by the number of product variants. In product depictions with human models, in most cases only one product variant is shown, which is worn by the human model. In other product depictions, more than one product variant is shown. Including the number of variants shown in a specific product depiction as an additional independent variable might be a useful estimation strategy to separate these two effects.
The differentiation of product depictions into two categories with vs. without human models may mask more details of the role of the human model: How important is the display of the face of the human model? How important is the sex of the human model? How important is the physical attractiveness of the human model? Are real humans necessary to achieve more visual attention or might realistic mannequins have the same effect? The later might be relevant if participants are especially interested to see how the clothing fits with body shape.
Our study does not allow inferring from the participants’ gaze behaviour their choice of clothing or their purchase behaviour. A high number of participants visiting an AOI might not correspond to purchase intention or real purchase behaviour. Future studies should test for these relationships. For this purpose, it might be interesting to integrate the experiment in a real-life online shopping experiment in which visitors of an online shop are asked to participate in the experiment.
Finally, even though any influence by artificial laboratory conditions or the presence of a researcher on gaze behaviour was excluded by our study approach, neither the behaviour of the participants during study participation (e.g., appropriate distance to the webcam; avoiding head movements) nor the adequacy of their equipment could be controlled. This might have negatively affected the eye tracking recordings and thus the results of this study. Better control over the general conditions could be achieved if webcam eye tracking studies were conducted in the laboratory or in the field in the presence of a researcher. However, this would eclipse the described advantages of webcam eye tracking in terms of spatiotemporal and personal independence.

6. Conclusions

This study shows that webcam eye tracking could be an alternative to eye tracking studies conducted with infrared eye trackers for investigating the impact of specific exogenous factors on visual attention in an online shopping environment. It could be demonstrated that the horizontal and vertical position of a product depiction as well as the presence of a human model for presenting the clothing items had an influence on visual attention. Products positioned higher up on the website, horizontally in the middle position, and worn by a model received greater visual attention. From these findings, specific recommendations could be derived for online clothing retailers regarding the presentation of their products in online stores. Further research is needed to validate the results of this study. In particular, follow-up studies should include both webcam and infrared eye tracking for a more comprehensive assessment of the advantages and disadvantages of webcam eye tracking compared with infrared eye tracking.

Author Contributions

Conceptualization, N.R.G., B.M., M.K.L., B.O. and F.S.; methodology, N.R.G., B.M., M.K.L., B.O., F.S. and I.S.; validation, I.S.; formal analysis, I.S.; investigation, N.R.G., B.M., M.K.L., B.O. and F.S.; resources, M.M.; data curation, I.S.; writing—original draft preparation, I.S.; writing—review and editing, I.S. and M.M.; visualization, I.S.; supervision, I.S. and M.M.; project administration, I.S. and M.M. All authors have read and agreed to the published version of the manuscript.

Funding

The publication is funded by the Open Access Publication Fund of South Westphalia University of Applied Sciences.

Institutional Review Board Statement

The study was conducted according to the guidelines of the Declaration of Helsinki. Ethical review and approval was waived for this study as this type of study does not require approval according to our university’s guidelines, as the respondents are not harmed or adversely affected in any way by participating in the study.

Informed Consent Statement

Informed consent was obtained from all subjects involved in the study.

Data Availability Statement

The data presented in this study are available on request from the corresponding author. The data are not publicly available due to our university’s privacy policy.

Conflicts of Interest

The authors declare no conflict of interest.

References

  1. Statista. E-Commerce in Europa: Dossier; did-23510-1. Available online: https://de.statista.com/statistik/studie/id/23510/dokument/e-commerce-in-europa-statista-dossier/ (accessed on 4 October 2021).
  2. Bauerová, R. Online grocery shopping is a privilege of millennial customers. Still truth in COVID-19 pandemic? Acta Acad. Karviniensia 2021, 21, 15–28. [Google Scholar] [CrossRef]
  3. Riz, N.; Partacini, L.; Becker, U.; Lun, G.; Dibiasi, A.; Pechlaner, H. Die Effekte der COVID-19-Pandemie in Südtirol. Die Sicht Südtiroler Unternehmen: WIFO Bericht. 2020. Available online: https://webassets.eurac.edu/31538/1622811251-die-effekte-der-covid-19-pandemie-in-sudtirol-die-sicht-der-sudtiroler-unternehmen.pdf (accessed on 22 July 2021).
  4. Rudolph, T.; Kralle, N. Detailhändler investieren in Onlineshops. Die Volkswirtschaft 2020, 93, 12–14. [Google Scholar]
  5. Behe, B.K.; Bae, M.; Huddleston, P.; Sage, L. The effect of involvement on visual attention and product choice. J. Retail. Consum. Serv. 2015, 24, 10–21. [Google Scholar] [CrossRef]
  6. Atalay, A.S.; Bodur, H.O.; Rasolofoarison, D. Center of shelf attention: Understanding the role of visual attention on product choice. N. Am. Adv. Consum. Res. 2012, 40, 809–810. [Google Scholar]
  7. Gidlöf, K.; Anikin, A.; Lingonblad, M.; Wallin, A. Looking is buying. How visual attention and choice are affected by consumer preferences and properties of the supermarket shelf. Appetite 2017, 116, 29–38. [Google Scholar] [CrossRef]
  8. Burton, L.; Albert, W.; Flynn, M. A Comparison of the Performance of Webcam vs. Infrared Eye Tracking Technology. In Proceedings of the Human Factors and Ergonomics Society Annual Meeting, Los Angeles, CA, USA, 4 November 2014; Volume 58, pp. 1437–1441. [Google Scholar] [CrossRef]
  9. Semmelmann, K.; Weigelt, S. Online webcam-based eye tracking in cognitive science: A first look. Behav. Res. Methods 2018, 50, 451–465. [Google Scholar] [CrossRef] [PubMed] [Green Version]
  10. Statista Research Department. E-Commerce in Deutschland: Daten und Fakten zum boomenden Onlinegeschäft. Available online: https://de.statista.com/themen/247/e-commerce/ (accessed on 27 August 2021).
  11. Zdziebko, T.; Sulikowski, P. Monitoring human website interactions for online stores. In New Contributions in Information Systems and Technologies; Rocha, A., Correia, A.M., Costanzo, S., Reis, L.P., Eds.; Springer International Publishing: Cham, Switzerland, 2015. [Google Scholar]
  12. Sulikowski, P.; Zdziebko, T. Horizontal vs. Vertical Recommendation Zones Evaluation Using Behavior Tracking. Appl. Sci. 2020, 11, 56. [Google Scholar] [CrossRef]
  13. Sulikowski, P.; Zdziebko, T.; Coussement, K.; Dyczkowski, K.; Kluza, K.; Sachpazidu-Wójcicka, K. Gaze and Event Tracking for Evaluation of Recommendation-Driven Purchase. Sensors 2021, 21, 1381. [Google Scholar] [CrossRef] [PubMed]
  14. Wedel, M.; Pieters, R. A review of eye-tracking research in marketing. In Review of Marketing Research, 4th ed.; Malhotra, N.K., Ed.; Sharpe Inc.: New York, NY, USA, 2008; pp. 123–147. ISBN 978-0-7656-2092-7. [Google Scholar]
  15. Cardoso, T.V.; Michelassi, G.C.; Franco, F.O.; Sumiya, F.M.; Portolese, J.; Brentani, H.; Machado-Lima, A.; Nunes, F.L.S. Autism Spectrum Disorder diagnosis based on trajectories of eye tracking data. In Proceedings of the 2021 IEEE 34th International Symposium on Computer-Based Medical Systems (CBMS), Aveiro, Portugal, 7–9 June 2021; pp. 50–55. [Google Scholar] [CrossRef]
  16. Tatler, B.W.; Kirtley, C.; Macdonald, R.G.; Mitchell, K.M.; Savage, S.W. The active eye: Perspectives on eye movement research. In Current Trends in Eye Tracking Research; Horsley, M., Eliot, M., Knight, B.A., Reilly, R., Eds.; Springer International Publishing: Cham, Switzerland, 2014; pp. 3–16. [Google Scholar]
  17. Knight, B.A.; Horsley, M.; Eliot, M. Eye Tracking and the Learning System: An Overview. In Current Trends in Eye Tracking Research; Springer: Cham, Switzerland, 2014; pp. 281–285. [Google Scholar]
  18. Tobii Pro AB. Pro Nano User Manual: Version 2.0. 2020. Available online: https://www.tobiipro.com/siteassets/tobii-pro/user-manuals/tobii-pro-nano-user-manual.pdf/?v=2.0 (accessed on 28 July 2021).
  19. Krassanakis, V.; Cybulski, P. Eye Tracking Research in Cartography: Looking into the Future. ISPRS Int. J. Geo-Inf. 2021, 10, 411. [Google Scholar] [CrossRef]
  20. Papoutsaki, A.; Laskey, J.; Huang, J. SearchGazer: Webcam eye tracking for remote studies of web search. In Proceedings of the 2017 Conference on Conference Human Information Interaction and Retrieval. CHIIR ’17: Conference on Human Information Interaction and Retrieval, Oslo, Norway, 7–11 March 2017; Nordlie, R., Pharo, N., Freund, L., Larsen, B., Russel, D., Eds.; ACM: New York, NY, USA, 2017; pp. 17–26, ISBN 9781450346771. [Google Scholar]
  21. Geise, S. Eyetracking in der Kommunikations- und Medienwissenschaft: Theorie, Methode und kritische Reflexion. Stud. Commun. Media 2011, 2, 149–263. [Google Scholar] [CrossRef] [Green Version]
  22. Orquin, J.L.; Bagger, M.P.; Lahm, E.S.; Grunert, K.G.; Scholderer, J. The visual ecology of product packaging and its effects on consumer attention. J. Bus. Res. 2020, 111, 187–195. [Google Scholar] [CrossRef]
  23. Tatler, B.W.; Hayhoe, M.M.; Land, M.F.; Ballard, D.H. Eye guidance in natural vision: Reinterpreting salience. J. Vis. 2011, 11, 5. [Google Scholar] [CrossRef] [Green Version]
  24. Orquin, J.L.; Lagerkvist, C.J. Effects of salience are both short- and long-lived. Acta Psychol. 2015, 160, 69–76. [Google Scholar] [CrossRef]
  25. Atalay, A.S.; Bodur, H.O.; Rasolofoarison, D. Shining in the Center: Central Gaze Cascade Effect on Product Choice. J. Consum. Res. 2012, 39, 848–866. [Google Scholar] [CrossRef]
  26. Espigares-Jurado, F.; Muñoz-Leiva, F.; Correia, M.B.; Sousa, C.; Ramos, C.M.; Faísca, L. Visual attention to the main image of a hotel website based on its position, type of navigation and belonging to Millennial generation: An eye tracking study. J. Retail. Consum. Serv. 2020, 52, 101906. [Google Scholar] [CrossRef]
  27. Bindemann, M. Scene and screen center bias early eye movements in scene viewing. Vis. Res. 2010, 50, 2577–2587. [Google Scholar] [CrossRef] [Green Version]
  28. Lagun, D.; Lalmas, M. Understanding User Attention and Engagement in Online News Reading. In Proceedings of the Ninth ACM International Conference on Web Search and Data Mining. WSDM 2016: Ninth ACM International Conference on Web Search and Data Mining, San Francisco, CA, USA, 22–25 February 2016; Bennett, P.N., Josifovski, V., Neville, J., Radlinski, F., Eds.; ACM: New York, NY, USA, 2016; pp. 113–122, ISBN 9781450337168. [Google Scholar]
  29. Wang, Q.; Yang, Y.; Wang, Q.; Ma, Q. The effect of human image in B2C website design: An eye-tracking study. Enterp. Inf. Syst. 2012, 8, 582–605. [Google Scholar] [CrossRef]
  30. Boardman, R.; McCormick, H. The impact of product presentation on decision-making and purchasing. Qual. Mark. Res. Int. J. 2019, 22, 365–380. [Google Scholar] [CrossRef]
  31. EYEVIDO GmbH. EYEVIDO Lab. 2021. Available online: https://eyevido.de/en/ (accessed on 4 October 2021).
  32. Moshagen, M.; Thielsch, M. A short version of the visual aesthetics of websites inventory. Behav. Inf. Technol. 2013, 32, 1305–1311. [Google Scholar] [CrossRef]
  33. Hirschfeld, G.; Thielsch, M.T. Establishing meaningful cut points for online user ratings. Ergonomics 2014, 58, 310–320. [Google Scholar] [CrossRef] [PubMed]
  34. Pappas, I.; Sharma, K.; Mikalef, P.; Giannakos, M. Visual Aesthetics of E-Commerce Websites: An Eye-Tracking Approach. In Proceedings of the 50th Hawaii International Conference on System Sciences, Waikoloa Village, HI, USA, 4–7 January 2017. [Google Scholar]
  35. StataCorp. Stata Statistical Software; StataCorp LLC.: College Station, TX, USA, 2019. [Google Scholar]
  36. Jacob, R.J.; Karn, K.S. Eye tracking in human-computer interaction and usability research: Ready to deliver the promises. In The Mind’s Eye: Cognitive and Applied Aspects of Eye Movement Research; Hyönä, J., Radach, R., Deubel, H., Eds.; North-Holland: Amsterdam, The Netherlands, 2003. [Google Scholar]
  37. Shrestha, S.; Lenz, K. Eye gaze patterns while searching vs. browsing a website. Usability News 2007, 9, 1–9. [Google Scholar]
  38. Chen, L.; Pu, P. User’s eye gaze pattern in organization-based recommender interfaces. In Proceedings of the ACM International Conference on Intelligent User Interfaces, Palo Alto, CA, USA, 13–16 February 2011; Pu, P., Pazzani, M., Eds.; Association for Computing Machinery: New York, NY, USA, 2011; pp. 311–314. [Google Scholar]
  39. Gameiro, R.R.; Kaspar, K.; König, S.U.; Nordholt, S.; König, P. Exploration and Exploitation in Natural Viewing Behavior. Sci. Rep. 2017, 7, 2311. [Google Scholar] [CrossRef] [PubMed] [Green Version]
  40. Menon, R.V.; Sigurdsson, V.; Larsen, N.M.; Fagerstrøm, A.; Foxall, G.R. Consumer attention to price in social commerce: Eye tracking patterns in retail clothing. J. Bus. Res. 2016, 69, 5008–5013. [Google Scholar] [CrossRef]
  41. Seo, Y.W.; Chae, S.W.; Lee, K.C. The Impact of Human Brand Image Appeal on Visual Attention and Purchase Intentions at an E-commerce Website. In Computer Vision; Springer: Berlin/Heidelberg, Germany, 2012; Volume 7198, pp. 1–9. [Google Scholar]
  42. Chae, S.W. Exploring the effect of the human brand on consumers’ decision quality in online shopping. Online Inf. Rev. 2013, 37, 83–100. [Google Scholar] [CrossRef]
  43. Bagatini, F.Z.; Rech, E.; Wagner, R. Human model pictures in e-commerce: Exploring the effect of self-image on product choice and consumers’ purchase intention. In Proceedings of the CLAV 2019 12th Latin American Retail and Consumption Conference𠅅Digital Transformation in Retailing, Sao Paolo, Brazil, 24–25 October 2019. [Google Scholar]
  44. Lindström, A.; Berg, H.; Nordfält, J.; Roggeveen, A.L.; Grewal, D. Does the presence of a mannequin head change shopping behavior? J. Bus. Res. 2016, 69, 517–524. [Google Scholar] [CrossRef]
  45. Poole, A.; Ball, L.J. Eye Tracking in HCI and Usability Research. In Encyclopedia of Human Computer Interaction; IGI Global: Hershey, PA, USA, 2006; pp. 211–219. [Google Scholar]
Figure 1. Excerpts from the screenshot of online shop A (left) and online shop B (right) with areas of interest outlined in green.
Applsci 11 09281 g001
Figure 2. Assessment of visual aesthetics of the two online shops.
Applsci 11 09281 g002
Figure 3. Proportion (in percent) of AOIs (product depictions) participants looked at.
Applsci 11 09281 g003
Table 1. Results of the linear regression analyses estimating the influence of the independent variables (factors) on the percentage of participants visiting an AOI (product depiction).
Online Shop A
Number of observations
p-Value
R-squared
Adjusted R-squared

=48
<0.001
=0.85
=0.84
Online Shop B
Number of observations
p-Value
R-squared
Adjusted R-squared

=84
<0.001
=0.84
=0.83
FactorCategoryCoefficientp-ValueFactorCategoryCoefficientp-Value
RowContinuous, 1–16−0.04<0.001RowContinuous, 1–28−0.02<0.001
ColumnLeftbase ColumnLeftbase
Middle0.16<0.001Middle0.10<0.001
Right0.070.01Right−0.010.72
Human modelNobase Human ModelNobase
Yes0.08<0.001Yes0.040.02
Constant0.62<0.001 Constant0.54<0.001
Publisher’s Note: MDPI stays neutral with regard to jurisdictional claims in published maps and institutional affiliations.

