Abstract
To promote the development of thermal energy storage (TES), the sodium acetate trihydrate (SAT) presents interesting thermal properties. However, this material may suffer from aging throughout thermal cycles. Various solutions were explored in the literature to limit this aging, mainly based on the use of additives such as water. In this study, two samples were prepared. The first one consisted of raw SAT material whereas 3 wt.% of supplementary water has been added to the second one. They were then poured into 350 cm3 bricks, which were placed in an experimental test bench. After 35 cycles between 20 and 70 °C, a drop of about 10% of the latent heat was observed for the first sample. This behavior was like the literature data. For the second sample, the decrease of latent heat was more rapid (about 30%). Contrary to our expectations, the water addition seems not beneficial for the improvement of thermal stability. Interestingly, we noticed that the drop of the latent heat was fully reversible after sample stirring. This degradation might not be related to a thermal destructive mechanism but rather to a global segregation phenomenon. This segregation may be due to the breaking of hydrogen bonding between anhydrous sodium acetate and water, resulting in the separation of the two species.
1. Introduction
Phase change materials (PCMs) appear as an attractive solution for thermal energy storage and for the development of renewable energies. Indeed, they can be used for both domestic hot water production [1] and passive heating/cooling of buildings [2]. For a better ratio of production vs. volume, daily melting and solidification are generally wished. Thus, many thermal cycles may be applied to the material that may suffer from aging, resulting in a decrease of the latent heat.
In particular, salt hydrates have an appropriate range of melting points (between −5 and +120 °C) for building applications and a range of interesting latent heat capacity (100–350 J·g−1) [3]. The solid phase of this class of PCMs presents a density of approximately 1700 kg/m−3 and a specific heat capacity around 1650 J·kg−1·K−1 [3], which may ensure relevant heat storage capabilities. One of the most interesting materials issued from this class of PCMs is sodium acetate trihydrate (SAT,). However, the SAT may present a large supercooling degree up to 100 K [4]. This high value of supercooling is generally perceived as a drawback but could be turned into a benefit if a reliable solidification-triggering technique could be developed [3]. This would lead to the discharge of the stored heat on demand [5]. The heat release amplitude will depend on the triggering temperature (as losses may occur during the cooling of the supercooled SAT).
This quantity of stored heat in the supercooled SAT may be degraded by aging throughout successive thermal cycles, a process already explored for other PCMs [6,7]. As the SAT is heated until 58 °C, an incongruent melting is observed according to the phase diagram [8] because of the break of hydrogen bonds. The SAT decomposes into two components: sodium acetate () and water () that have different densities. If a temperature of 77 °C is reached, different behavior is observed upon cooling, with a solution (45.7 wt.% of water instead of 39.7 wt.%) and the segregation of sodium acetate. Kong et al. showed that the concentration of a non-stirred SAT mixture depends on the height of the container [9]. The separation of species will increase with cycles, as the mobility is limited both in liquid (no agitation) and in solid state as the remaining SAT in the middle-height will crystallize and hinder the contact between the two species. This would decrease the latent heat released by the material, leading to a reduction of its storage capacity. It was observed by Kong et al. [9] that a deeper container (more than 5 cm in height) would limit the gathering of the two components to again form a trihydrate material. The aging of the SAT was analyzed by several authors such as Pálffy et al. [10] who experienced that a raw sample of SAT had lost about a third of its initial value after 300 cycles. The evolution throughout more cycles (600 cycles) was also performed by Wada et al. [8], showing that aging could be reduced owing to impurities.
Several solutions were investigated to limit this aging [8,11,12], and one of them (addition of water) was found interesting as it also decreases the solidification temperature and thus promotes the supercooling degree [4]. Indeed, aging would be limited by an excess of water from the extra water principle, a concept developed by Furbo et al. [13]. Then, this phenomenon was observed by Kong et al. [9,11] as they increased the quantity of water, moving its mass concentration in SAT from 39.7 to 45.7 wt.% (0 to 6 wt.% extra water). A constant quantity of latent heat was released by the solidification of material even after 130 days of supercooling. Dannemand et al. [14,15] have shown that a sample of SAT with 48.7 wt.% of water (9 wt.% of extra water) can suffer from aging during thermal cycling. Indeed, it was observed a decrease of 8% of its latent heat, from 194 to 179 kJ/kg−1 after 14 cycles. The same authors observed in [16] that a sample with 43.5 wt.% mass concentration of water (3.8 wt.% extra water) presented a decrease from 177 to 140 J/g−1 (−21%) after 17 cycles, but no comparison was made with raw material.
Such a comparison was performed in this study. First, the properties of raw material, and their evolution throughout thermal cycles, were investigated. A sample containing an addition of water was then analyzed. On the one hand, because water addition can increase the supercooling degree, this would limit the appearance of a non-whished solidification and a subsequent heat release which is relevant for an application. The monitoring of aging was based on the measurement of latent heat accumulated and released throughout the successive phase change. On the other hand, as the supercooling was so stable in the sample having extra-water, a way of solidification triggering needed to be developed. Thus, a seeding method by contacting a welding rod to the supercooling SAT was finally selected to induce solidification. As solidification could be triggered, it was possible to compare the degradation of the latent heat in both samples.
2. Materials and Methods
2.1. Preparation of Macro-Encapsulated Sodium Acetate Trihydrate Samples
The material characterized in this study was SAT (Sigma Aldrich, BioXtra, 99% purity). Two different samples have been prepared:
- A reference sample (SAT60%) with a raw fraction of 60.3 wt.% of for a comparison with the data from the literature.
- A second sample (SAT58%) where water was added. In addition to a limitation of aging, this concentration was expected to bring stability regarding the supercooling phenomenon [11].
The samples were prepared from about 330 g of the raw material. For the second sample, the material was heated at a temperature of 70 °C for melting. This would allow for a better homogenization of the added deionized water (35 g). The sample was vigorously shaken to homogenize the repartition of water in the volume. The second sample was then solidified for transportation.
As they were solid, the real concentrations of both samples were measured. To do so, a thermogravimetric analysis device (Netzsch, Pegasus 449 F1) was used. About 50 mg of material was taken from preparation and heated until 200 °C that was above the evaporation temperature of the water and allows for the analysis of a fully dry sample. For the SAT60% sample, the experiment was repeated three times for reliability, and the residual mass was included between 59.6 wt.% and 61.5 wt.% (in comparison with a theoretical concentration of 60.3 wt.%). In the second sample, the experiments were repeated two times for reliability, and the residual mass of sodium acetate was found to be between 57.2 and 58.3 wt.%, for an average value of 57.7 wt.%. Such differences are assumed to be due to uncertainties.
After transportation, the samples were again melted for pouring by a syringe into 250 cm3 bricks (210 × 140 × 18 mm3, 4 mm of thickness) that can contain 350 g of SAT. They were made of polymethyl methacrylate (PMMA) that was found to have good chemical compatibility with SAT [17]. The bricks were sealed in order to limit the evaporation of water. The quantity of material was higher than the value used in the usual devices such as DSC (up to 40 µL) or calorimeter (about 10 mL). Its behavior is assumed to be more representative of that of a real system, having usually more than 1 L of PCM [18,19]. Once the material was solid, the brick was put into the experimental bench, and the analysis was launched.
2.2. Experimental Set-Up Description
The behavior of the material was studied by thermal cycling, which was representative of the behavior of a real application. This method is also the most currently used to study aging, according to Ferrer et al. [20]. However, these authors showed that mainly DSC devices or calorimeters were used. Therefore, a test ring that allows for better measurement of latent heat [17] was preferred in this work, (Figure 1a). The sample was surrounded by fluxmeters where both heat flux and temperatures were measured (Figure 1b). Therefore, the heat released by the sample was precisely recorded, which permits an adequate interpretation of the material behavior.
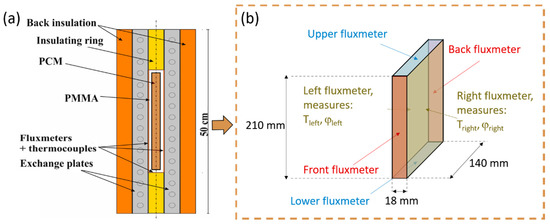
Figure 1.
(a) Global description of the experimental bench and (b) focus on the sample, adapted from [21,22].
Two thermo-regulated water baths were used for temperature regulation of the exchange plates. From preliminary experiments, it was observed that a heating and cooling rate of 20 °C·h−1 gives repeatable conditions between left and right plates (±0.1 °C·h−1) and throughout cycles. This cooling rate was chosen and thermal cycles of 8 h were applied from 20 to 70 °C. The maximal temperature was chosen to be above the melting temperature, approximately 58 °C for the SAT compositions considered here according to Green [23]. This temperature was also chosen below 77 °C [24] to ensure the occurrence of solidification on the next cooling, which allows for the experimental determination of the latent heat. In parallel, it was observed that the SAT generally solidifies around 50 °C in the prior experiments, therefore a minimal temperature close to the ambient conditions (20 °C) was arbitrarily chosen.
2.3. Data Analysis
The thermal behavior of the material during a full cycle (heating, cooling, and constant temperature steps), using the previously presented experimental bench, is described in Figure 2. Whereas all the surfaces are covered by sensors, only the record of the left and right fluxmeters ( mm2) is given. Indeed, the measurements of the four other surfaces are not considered significant as they represent about 4% of the total heat flux recorded.
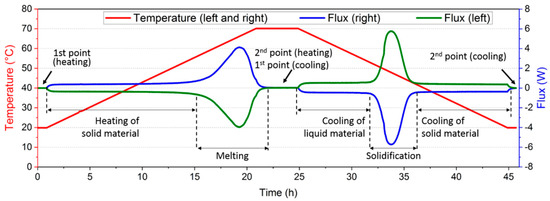
Figure 2.
Description of a full thermal cycle.
Here, the analysis was performed between two points (1st and 2nd point) on both sides of a temperature variation (heating or cooling). These two points were chosen at the end of the thermal plateau in order to have a stabilized heat flux. Hence, a baseline below 0.01 W could be obtained. The value of latent heat could then be obtained from an integration of the heat flux between these two points, after subtracting the sensible heat.
This sensible heat was stored in the container, made of PMMA, whose specific heat capacity has been determined by blank tests to be approximately 1.45 kJ·kg−1·°C−1. The sensible heat was also stored in the solid and liquid SAT’s specific heats. They can be calculated using linear approximations, given in Equation (1), based on the data from Araki et al. [25]. These equations were considered valid for a mass fraction from 54.3 to 60.3 wt.% and a temperature between 27 and 58 °C for solid and between 27 and 77 °C for liquid (valid also in supercooled state), with an error of 5% maximum.
where is the temperature (°C). The empirical parameters A, B, C, and D are given in Table 1 for both solid and liquid specific heats.

Table 1.
Empiric parameters for solid and liquid specific heat determination.
These two specific heats allow for the calculation of the latent heat. This evaluation is based on the subtraction of the sensible energies to the global heat flux measured on the different surfaces, as shown in Equation (2).
where and are the time for the 1st and 2nd point (Figure 2), and is the melting temperature (58 °C). Equation (2) is focused on the melting of the material because it was assumed that the energy released during solidification was influenced by the possible presence of a non-repeatable supercooling degree. This equation could be compared with an empirical relation from Araki et al. [25], given in Equation (3) that is valid for a mass fraction of sodium acetate from 47.5 to 60.3 wt.% with an error of 5% maximum.
Moreover, the determination of the crystallization temperatures was necessary for a correct analysis of the material’s solidification and its impact on the next melting. For each cycle (as presented in Figure 2), the onset temperature was determined in three steps. (1) The onset time was determined by the intersection of 2 tangents represented by black dash lines in Figure 3; (2) the crystallization temperature was then identified by a blue arrow; and (3) its value was read on the left axis.
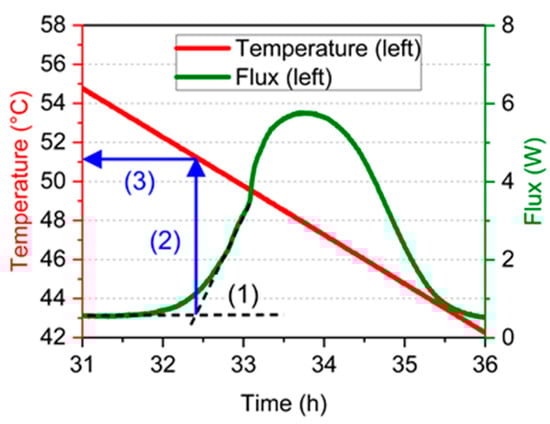
Figure 3.
Method for crystallization onset temperature determination.
This procedure was then applied to the study of the two samples (SAT60% and SAT58%).
3. Aging Study of Sodium Acetate Trihydrate
3.1. Experimental Validation of the Empirical Equations
The validity of the previous equations was verified by the application of heating and cooling cycles on a fully solid (between 20 and 28 °C) and fully liquid (between 63 and 70 °C) SAT60% sample. During these tests, the supercooling state was not observed in this sample as the necessary conditions were not reached. However, the supercooling degree in the SAT58% was increased by the addition of water (reduction of the temperature of solidification) as noted by Wada et al. [4]. Experimentally, the SAT58% sample did not crystallize even at a temperature as low as 5 °C. As the solidification was not obtained by a temperature reduction, it was decided to trigger it by an external mean (insertion of a copper welding rod), as presented in Figure 4.
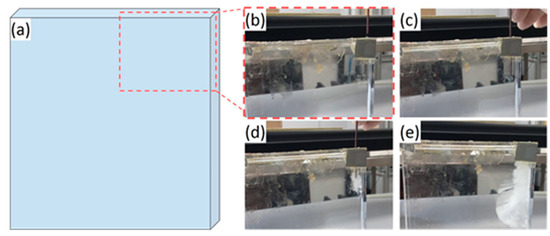
Figure 4.
Seeding of sodium acetate trihydrate (SAT) with a welding rod. (a) Schematic draw of the brick and detailed pictures (after the brick was taken out of the experimental bench) (b) initial state; (c) insertion throughout the grey tape; (d) beginning of crystallization; and (e) growth of the crystal.
The crystallization of the supercooled SAT was observed after the introduction of this additional metal rod. In addition, it continues appearing in the following cycles even after the rod had been removed. As SAT may corrode copper [26], some particles were assumed to be spread in the liquid PCM. These particles may act as nucleating agents as a new surface was provided from where the nuclei would grow as lower energy is required [3]. Therefore, the addition of a small number of particles can strongly promote the solidification of the SAT. This repeatable crystallization allows performing preliminary thermal cycles with a phase change. The values of the latent heat, completed by the specific heats measured for the SAT60% (solid and liquid) and the SAT58% (supercooled), are given in Table 2. Indeed, the characterization of SAT58%, which was performed before the triggering of the solidification by a metal rod, only gave properties for the supercooled state. The uncertainties were calculated to include 99.7% of the values (). The number of experiments for each measurement was also added.
Table 2.
Initial properties of the sample before aging.
The measured specific heat was found consistent with the literature data [25] as a difference of less than 10% was found regarding Equation (1). The same observation was done for the latent heat determined from Equation (2) (maximal difference 2% regarding Equation (3) from the literature). Nevertheless, only a few experiments could be performed, as they may induce the aging of the sample.
3.2. The Initial Drop of Latent Heat during Preliminary Cycles
In order to verify the repeatable apparition of solidification and melting before the aging analyses and compare the measured latent heat with Equation (3), preliminary cycles were performed on SAT58%. From Equation (2), the latent heat of melting could be determined and its evolution is given in Figure 5. The uncertainties are given in Table 2.
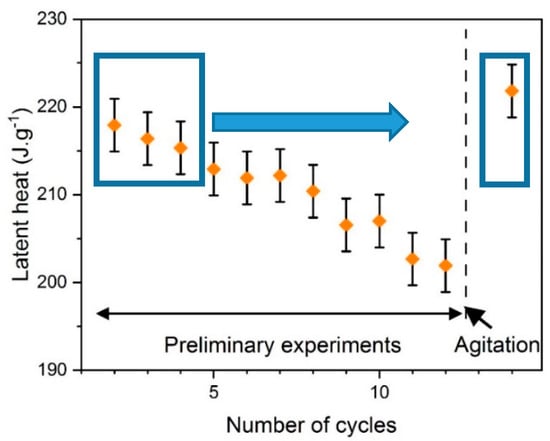
Figure 5.
Preliminary evaluation of latent heat of SAT58%. The arrow symbolizes a reset of the properties by agitation (the two rectangles allow for comparison of the latent heat at the beginning of the experiment and after agitation).
It was observed that a phase change (melting and solidification) occurred at every preliminary cycle. In the first three cycles (left blue rectangle), the latent heat determined by Equation (2) differed by a maximum of 2% from Equation (3) from Araki et al. [25]. However, it was suspected that these preliminary thermal cycles had induced the aging of the material. Indeed, a decrease of the latent heat from 220 to 200 J·g−1 was observed after 12 thermal cycles. In parallel, the bricks containing the different samples were taken out of the experimental bench at the end of the preliminary stage. The segregation of anhydrous salt could be observed at the bottom of the brick. This segregation can either be due to the melting before the filling of the brick (SAT60%, Figure 6a) or the preliminary aging cycles (SAT58%, Figure 6b).
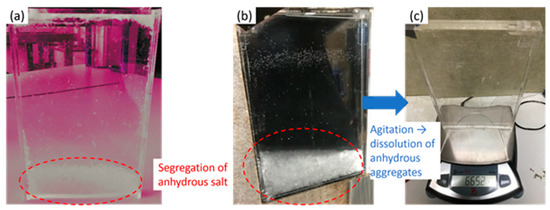
Figure 6.
Formation of anhydrous salt segregation in (a) SAT60% (the colors were modified for contrast accentuation), (b) SAT58%, and (c) SAT58% after agitation, before insertion in the experimental bench.
According to the phase diagram of sodium acetate—water [23], a peritectic transformation exists during melting of the material for a concentration above . This transformation is associated with the formation of anhydrous salt and water. Indeed, these two molecules are linked in SAT by a hydrogen bond [27] that can easily be broken. The anhydrous sodium acetate, denser, may fall at the bottom of the brick, whereas water is generally found in the upper part [9]. Thus, the quantities of water and anhydrous salt are increased in the global volume, as presented in Figure 7. This phenomenon of aging continues with cycles and reduces the capacity of the global volume to release the latent heat.
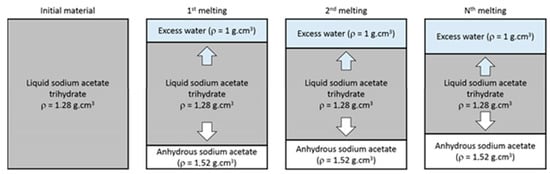
Figure 7.
Schematic diagram of SAT aging throughout melting cycles.
Thus, it can be considered that the height of the sample also influences aging. As experimented by Kong et al. [9], a sample with a height of 8 cm was more subjected to aging than other samples of 4 or 5 cm. Indeed, the gravity phenomenon and the separation of species would be accentuated for samples of important heights. In existing application prototypes (250 L) the heights of the cells were limited to 5-cm height to reduce the separation phenomenon [19].
As it was observed that the latent heat could be regenerated by agitation, the bricks were then vigorously shaken by hands. This results in a visual elimination of segregation as presented in Figure 6c. This can be correlated to the fact that the latent heat measured on the following thermal cycle (after agitation) was similar to the initial value of the sample. The agitation, that was here manual, could be done by mechanical means such as nucleation triggering technique like ultrasounds [3] or bubbling [28]. This solution may also allow the release of heat on demand by inducing the solidification of a supercooled SAT. After the segregated salt had been dissolved by shaking, the bricks containing the different SAT samples were then ready for aging analysis.
3.3. Study of the Raw Material (SAT60%)
To evaluate the potential of the use of water in order to attenuate the aging of the SAT, the behavior of raw material was first evaluated. Therefore, 35 cycles between 20 and 70 °C were applied to the sample. These cycles may be summarized in Figure 8. It may be noted that a discontinuity appears between the 5th and 6th cycle that corresponds to the change of heating and cooling rate.
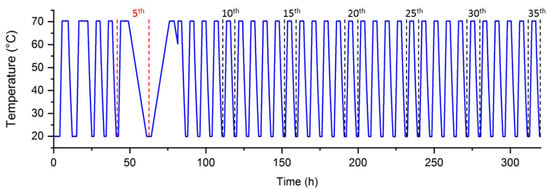
Figure 8.
Temperature evolution along the experiment performed on SAT60%.
The 1st cycle of the series was not considered here because of a different thermal history. Besides, some cycles were applied with a different heating and cooling rate (5th cycle) whose results were used in another study [19]. This led to a different thermal history for the 6th cycle. Therefore, 1st, 5th, and 6th were not considered in the analysis and plotted as stars in the following graphs to perceive the influence of different experimental parameters.
The latent heat of the remaining cycles could be determined from Equation (2), leading to the monitoring of aging. However, some crystallizations that occurred at a lower temperature would influence the latent heat measurement, such as the 34th cycle of this experiment, which is plotted in Figure 9.
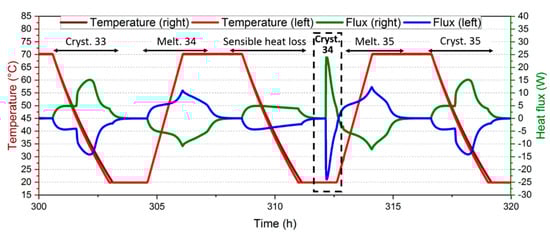
Figure 9.
Singular crystallization at 20 °C for the 34th cycle of the experiment. Cryst.: crystallization. Melt.: melting.
During this 34th crystallization, the heat flux was not stabilized and the core of the material may still be cooling as the temperature started to re-increase. As the material remained hot, the energy needed to bring the material back to 70 °C for the 35th melting may be lowered. In parallel, it was assumed in the calculation of the sensible heat subtracted (Equation (2)) that the whole material was heated from 20 to 70 °C. Therefore, the latent heat, determined from Equation (2) during the 35th melting, may be underestimated. Even if this is an extreme case, the next melting may be impacted by a delay in the solidification of singular points. Besides, a faster solidification was observed when the supercooling degree was larger [29]. This may induce a larger number of porosities [30] and influence its properties and the progression of the melting front on the next heating step. For these reasons, the melting that follows a low-temperature crystallization has been considered as singular data.
Before the determination of latent heat, the first step was to measure the crystallization temperatures, based on the procedure given in Figure 3. The histogram of crystallization temperatures is given in Figure 10 with a step of 1 °C, where the values for the 1st, 5th, and 6th cycles are excluded.
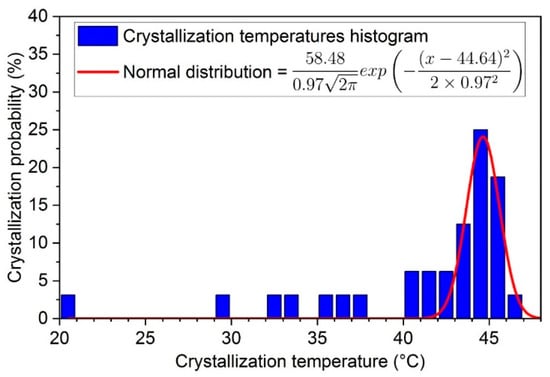
Figure 10.
Probability distribution of crystallization temperatures for SAT60%.
It can be seen that the crystallization temperatures are not homogeneous, but they can be approximated by a normal distribution (in red). The mean value is here equal to 44.64 °C and the standard deviation is about 0.97 °C. The crystallization temperatures out of a range of ( °C) were considered as singular data. In the present case, about 11 over a total number of 32 solidifications (34%) were concerned, after the exclusion of 1st, 5th, and 6th cycles.
The second step consisted of the latent heat monitoring for these non-singular points. Its evolution throughout cycles is given in Figure 11a. The singular data (open symbols) were separated from other values of latent heat, whose decrease should only be related to aging. However, a fluctuation in the remaining crystallization temperatures (between 41 and 47 °C) was still noticed, and the latent heat of the next melting may still be influenced. It was assumed from Figure 7 that the quantity of SAT was decreasing throughout cycles. This led to the assumption that the probability of a SAT’s molecule to be separated (into water and anhydrous sodium acetate) was constant. This is characteristic of an exponential decrease fit. To find a trend of aging, the latent heat for non-singular data were fitted by an exponential decrease law (dashed curve), given in Equation (4).
where is the latent heat for any cycle . The crystallization temperatures are also plotted at the bottom (Figure 11b). Thus, the relation between singular crystallization temperatures (below the black dashed curve) and lower latent heat values on the next cycle (open symbol) would be highlighted.
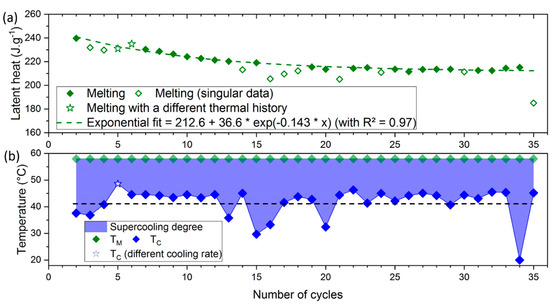
Figure 11.
Evolution of (a) the latent heat and (b) the supercooling degree over 35 cycles of a raw SAT sample (). Values for the 5th and 6th symbol (from different thermal history) are plotted as stars. The open symbols (following a low-temperature crystallization) will not be considered for exponential fit and aging analysis. and respectively represent melting and crystallization temperatures.
In addition to the 5th cycle that was cooled more slowly (2.5 °C·h−1 instead of 20 °C·h−1) and crystallized at a higher temperature (50 °C), several singular points ( °C) were observed. The gap between those temperatures and the mean one seems to increase throughout cycles. Indeed, it was low at the beginning, with a crystallization temperature of 38 °C (a supercooling degree 28 °C) different from the mean value of 45 °C ( °C). Then, an increase in the gap was found over the number of cycles as a crystallization temperature of 30 °C ( °C) is reached after the 15th cycle and is minimal after the 34th cycle (crystallization temperature of 20 °C ( °C)). This increase of the gap directly impacts the latent heat and may be related to aging as the quantity of material presenting a stoichiometric concentration () decreases over cycles. It is assumed that this reduction of volume would lead to the reduction of the number of potential sites for nucleation of the SAT and the rise of the supercooling degree. This was supported by the work of Guion et al. [31], who noticed an increase of this supercooling degree throughout the aging cycle of the SAT.
Without considering these singular crystallizations, the latent heat on the second cycle was about 240 J·g−1, close to literature data [25,32]. Then, the latent heat decreases and stabilizes around 213 J·g−1 after 35 cycles, which represents a drop of about 10%. A comparison was done with the results from other studies, performed over more cycles. Figure 12 presents the evolution of latent heat throughout aging from Pálffy et al. [10] and Wada et al. [33], combined with the results obtained from SAT60%. The exponential decrease fits from the data of the different authors are represented by dashed curves.
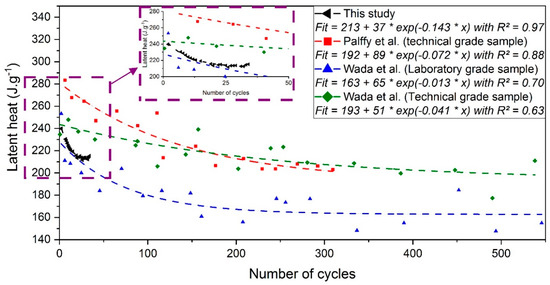
Figure 12.
Evolution of latent heat adapted from Pálffy et al. [10] (in red), Wada et al. [8] for a technical grade (in green), and laboratory-grade (in blue) combined with the results obtained here (in black). The symbols represent the value obtained by authors. The dashed line corresponds to the exponential fit that was performed in this study. An inset is given from 0 to 50 cycles.
The sample tested here presents an initial latent heat around 240 J·g−1 that reaches approximately 213 J·g−1 (−11%) after 35 cycles applied between 20 and 70 °C. In comparison, an analysis performed by Wada et al. [8] (green curve) showed that the latent heat of the SAT technical-grade sample seemed to stabilize around 200 J·g−1 (−17.4%) after 300 cycles applied between 40 and 70 °C. The results were comparable for Pálffy et al. [10] (red curve) where a drop of the latent heat from 280 to 200 J·g−1 (−28.5%) of a SAT technical grade sample was found after 300 cycles applied between 23 and 65 °C. Besides, Wada et al. have tested a laboratory-grade sample (blue curve) where aging was stronger, as latent heat in the range from 150 to 170 J·g−1 was reached after 300 cycles. It was assumed by [8] that the impurities, which are more present in the technical-grade sample, may be absorbed onto the surface of anhydrous salt particles and limit their aggregation.
A high drop of latent heat was obtained in the first cycles for the sample tested (99% purity), similar to the laboratory-grade sample (blue curve) of Wada et al. Then, it differs from the blue curve after about 20 cycles, as the exponential fit stabilized around 213 J·g−1. Moreover, it can be observed that the R2 values are higher in this study. This shows the efficiency of the particular experimental bench in the determination of a consistent value of the latent heat stored.
As a conclusion, the aging behavior of SAT60% is roughly similar to the literature data. It appeared that this decrease of the latent heat is important and cannot be neglected in the development of applications. The addition of water as a solution to aging would then be studied.
3.4. Resistance to the Aging of a Sample Having Additional Water
To evaluate the influence of water on the aging of SAT, similar cycles were applied to the SAT58% sample. For better clarity, the temperature evolution of this experiment is given in Figure 13.
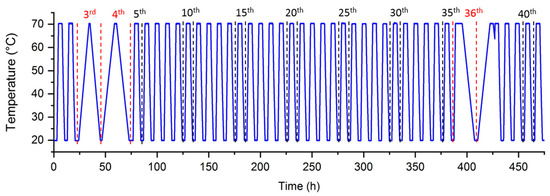
Figure 13.
Evolution of temperature throughout aging cycles.
As before, the 3rd, 4th, and 36th cycles, whose heating and cooling rate were about 2.5 °C·h−1, were dedicated to the study of latent heat evolution under different conditions [19]. Because of their different thermal history, the data could not be included in the global analysis and will be later plotted as stars. This also concerns the 5th and 37th cycles, whose thermal history was impacted by the previous heating and cooling steps. These five cycles were not considered for the probability distribution of the crystallization temperatures that are presented in Figure 14 with a 1 °C step.
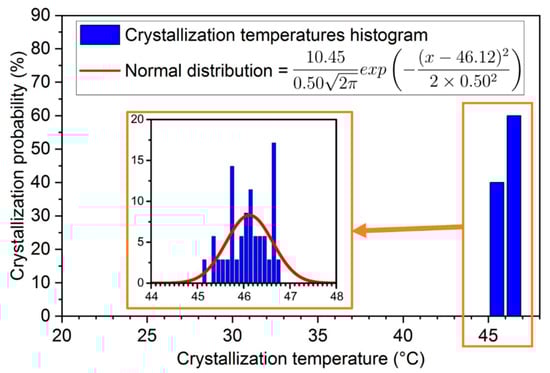
Figure 14.
Probability distribution of crystallization temperatures for SAT58%. In the inset, the crystallization temperature has a 0.1 °C temperature step.
Better repeatability of the crystallization temperature was found in these 35 cycles (after exclusion of the 1st, 3rd, 4th, 5th, 36th, and 37th) with values between 45 and 47 °C. It can be noted that the temperature distribution is more homogeneous. As shown in Figure 4, a copper welding rod was previously inserted in the liquid SAT58%. Copper may have been corroded by SAT and particles may be present in the SAT’s solution, promoting the solidification of the material.
The mean temperature obtained was °C, with a standard deviation °C. The whole crystallization temperatures are included in the distribution range and the consideration of singular points would not be needed for this SAT58% sample. The evolution of the latent heat throughout cycles was then determined, and the results are shown in Figure 15.
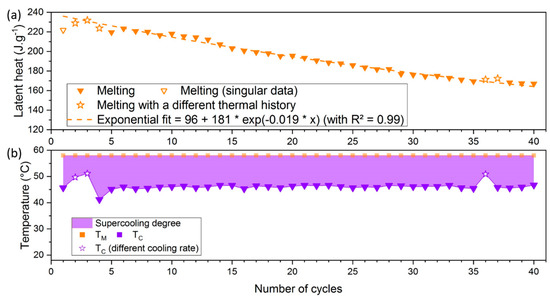
Figure 15.
Evolution of (a) the latent heat and (b) the supercooling degree over 40 cycles of a SAT58% sample (). Values for 3rd, 4th, 5th, 36th, and 37th are plotted as stars. As the open symbols (following a low-temperature crystallization), they will not be considered for exponential fit and aging analysis. and respectively represent melting and crystallization temperatures.
This sample presents an initial latent heat between 220 and 230 J·g−1 while the first cycles are difficult to consider because of a different thermal history. The trend is more obvious for this sample containing an addition of water, with a coefficient of determination . The decrease of latent heat is also more important, up to 25% of its initial value throughout 35 cycles, and continues for the 5 remaining cycles. Besides, this trend was verified for a slower cooling rate (2.5 °C·h−1) for the 3rd, 4th, and 36th cycles, plotted as stars. Their crystallization temperatures were close to each other (respectively 49.7 °C, 51.1 °C and 50.9 °C). This behavior was similar to the observations of Dannemand et al. [14] where a decrease of 8% (from 194 to 179 J·g−1) was found after 20 cycles for a concentration =56.5 wt.%.
The water addition, rather than increasing the aging stability of the SAT as proposed by Kong et al. [9], tends to diminish it. Then, to explain the behavior of the different samples, visual observations of the aged samples were performed.
4. Discussion on the Visual Aspect of the Samples
After the thermal cycles were applied to the different samples, they were taken out of the experimental bench, without shaking to avoid the contact between anhydrous salt and water. It was first noted that a large quantity of anhydrous salt had segregated at the bottom of the box, as presented in Figure 16. For SAT58%, some cycles were done at a higher temperature (80 °C). To take this into account, a picture of SAT60% that has undergone similar temperature cycles (up to 80 °C) was also added for better comparison.
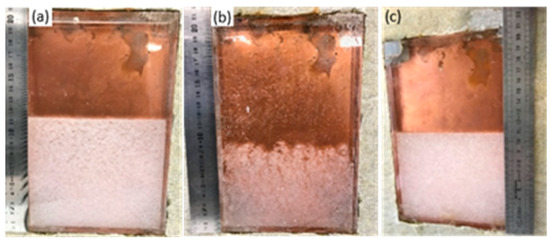
Figure 16.
Visual appearance of (a) SAT60% after 35 cycles at 70 °C, (b) the same sample after 46 more cycles until 80 °C and (c) SAT58% after 41 cycles until 70 °C and 10 cycles until 80 °C.
The height of the anhydrous sodium acetate aggregate, considered as an indicator of aging, was measured in the three samples:
- 11.5 cm over a total of 20 cm (57%) in the SAT60% that underwent a maximal temperature (Tmax) of 70 °C (35 cycles);
- 9 cm over a total of 20 cm (45%) in the SAT60% that underwent a Tmax of 80 °C (83 cycles);
- 11 cm over a total of 20 cm (55%) for the SAT58% after 41 cycles until 70 °C and 10 cycles until 80 °C (52 cycles).
A reduction of the anhydrous sodium acetate volume and an increase of its porosity with a higher temperature can first be qualitatively observed from Figure 16b. Indeed, the solubility of sodium acetate increases with temperature, from 149 g/100 g of water at 72 °C to 154.3 g/100 g of water at 83 °C [23]. After heating above 80 °C, the SAT60% (Figure 16b) seems to contain a lower quantity of segregated anhydrous salt (about 9 cm) than the SAT58% (11 cm, Figure 16c). In addition, the SAT60% appears more porous that may accentuate the difference between the heights of segregated salts in both samples. Measuring the height of the segregated sample may help quantify aging. However, it should be used with caution, as a part of sodium acetate trihydrate may be mixed with the porous anhydrous sodium acetate.
5. Conclusions and Outlook
This study was dedicated to the analysis of the aging of sodium acetate trihydrate. It was found that the reference sample (SAT60%) had lost 10% of its latent heat quantity, from 235 to 215 J·g−1 after about 35 cycles. After these cycles, the evolution seemed asymptotic, reaching a constant value that was supposed to be close to the final latent heat after aging. Besides, some crystallization occurred at a lower temperature and were considered as singular behaviors. The supercooling degree of these solidifications increased throughout cycles that may be considered as a factor of aging, unwanted for applications. Indeed, a reduction of the SAT quantity at stoichiometric concentration would result in a degradation of the properties. This would limit the use of this material as a storage medium.
Therefore, the addition of water as a solution to aging was investigated. In contrary to our expectations, the sample containing water in excess (SAT58%) was less stable after 35 cycles. Indeed, the latent heat had lost 25% of its initial value moving from about 225 to 170 J·g−1. In addition, the achievement of the stability is slower, as the exponential fit gives a final value of 96 J·g−1 (vs. 213 J·g−1 for SAT60%).
Moreover, preliminary experiments have also shown that the agitation of the sample could “reset” the value of latent heat. This agitation could be induced by any mechanical movements in the liquid, such as shaking, bubbling, or ultrasound that may also present interest as nucleation triggering techniques. Indeed, the limitation of the supercooling degree is generally targeted in phase change materials to improve their heat release capability.
Finally, for an application, the use of a high and narrow container could induce a more rapid aging behavior. Indeed, after the separation of the two species (sodium acetate and water) during heating, it may be more difficult to put them in contact during cooling. It would then be recommended to use a container of low height (h < 5 cm) to limit the separation of species due to gravity to facilitate the rehydration of the SAT.
Author Contributions
Conceptualization, N.B., U.S. and L.Z.; methodology, N.B., U.S. and L.Z.; investigation, N.B. and L.Z.; writing—original draft preparation, N.B.; writing—review and editing, N.B., U.S. and L.Z. All authors have read and agreed to the published version of the manuscript.
Funding
This research received no external funding.
Institutional Review Board Statement
Not applicable.
Informed Consent Statement
Not applicable.
Data Availability Statement
Data available on request.
Conflicts of Interest
The authors declare no conflict of interest.
Abbreviations
| Name | Symbol | Unit |
| Sodium Acetate Trihydrate | SAT | |
| Latent Heat | J·m−3 | |
| Mass | kg | |
| Specific Heat Capacity | J·kg−1·K−1 | |
| Surface | m2 | |
| Temperature | K | |
| Melting Temperature | K | |
| Mass Fraction of Sodium Acetate () | - | |
| Heat Flux | W·m−2 | |
| Subscript | ||
| Related to Solid | ||
| Related to Liquid |
References
- Systems & Components. Available online: http://comtes-storage.eu/publications/presentations/development-line-c/systems-components/ (accessed on 3 September 2018).
- Cabeza, L.F.; Castell, A.; Barreneche, C.; de Gracia, A.; Fernández, A.I. Materials Used as PCM in Thermal Energy Storage in Buildings: A Review. Renew. Sustain. Energy Rev. 2011, 15, 1675–1695. [Google Scholar] [CrossRef]
- Beaupere, N.; Soupremanien, U.; Zalewski, L. Nucleation Triggering Methods in Supercooled Phase Change Materials (PCM), a Review. Thermochim. Acta 2018, 670, 184–201. [Google Scholar] [CrossRef]
- Wada, T.; Kimura, F.; Matsuo, Y. Studies on Salt Hydrates for Latent Heat Storage. IV. Crystallization in the Binary System CH3CO2Na–H2O. Bull. Chem. Soc. Jpn. 1983, 56, 3827–3829. [Google Scholar] [CrossRef]
- Beaupere, N.; Soupremanien, U.; Zalewski, L. Experimental Measurements of the Residual Solidification Duration of a Supercooled Sodium Acetate Trihydrate. Int. J. Therm. Sci. 2020, 158, 106544. [Google Scholar] [CrossRef]
- Mazzeo, D.; Oliveti, G.; de Gracia, A.; Coma, J.; Solé, A.; Cabeza, L.F. Experimental Validation of the Exact Analytical Solution to the Steady Periodic Heat Transfer Problem in a PCM Layer. Energy 2017, 140, 1131–1147. [Google Scholar] [CrossRef]
- Mazzeo, D.; Oliveti, G. Thermal Field and Heat Storage in a Cyclic Phase Change Process Caused by Several Moving Melting and Solidification Interfaces in the Layer. Int. J. Therm. Sci. 2018, 129, 462–488. [Google Scholar] [CrossRef]
- Wada, T.; Yamamoto, R.; Matsuo, Y. Heat Storage Capacity of Sodium Acetate Trihydrate during Thermal Cycling. Sol. Energy 1984, 33, 373–375. [Google Scholar] [CrossRef]
- Kong, W.; Dannemand, M.; Brinkø Berg, J.; Fan, J.; Englmair, G.; Dragsted, J.; Furbo, S. Experimental Investigations on Phase Separation for Different Heights of Sodium Acetate Water Mixtures under Different Conditions. Appl. Therm. Eng. 2019, 148, 796–805. [Google Scholar] [CrossRef]
- Pálffy, E.G.; Prépostffy, E.; Zöld, A.; Bajnóczy, G. Thermal Properties of a Heat Storage Device Containing Sodium Acetate Trihydrate. Period. Polytech. Chem. Eng. 1995, 39, 129–135. [Google Scholar]
- Kong, W.; Dannemand, M.; Johansen, J.B.; Fan, J.; Dragsted, J.; Englmair, G.; Furbo, S. Experimental Investigations on Heat Content of Supercooled Sodium Acetate Trihydrate by a Simple Heat Loss Method. Sol. Energy 2016, 139, 249–257. [Google Scholar] [CrossRef]
- Kong, W.; Dannemand, M.; Johansen, J.B.; Fan, J.; Dragsted, J.; Furbo, S. Ageing Stability of Sodium Acetate Trihydrate with and Without Additives for Seasonal Heat Storage. In Proceedings of the ISES Solar World Congress 2015, Daegu, Korea, 8–12 November 2015; International Solar Energy Society: Daegu, Korea, 2016; pp. 1–10. [Google Scholar]
- Furbo, S. Heat Storage with an Incongruently Melting Salt Hydrate as Storage Medium Based on the Extra Water Principle. In Thermal Storage of Solar Energy; Springer: Dordrecht, The Netherlands, 1981; pp. 135–145. ISBN 978-94-009-8304-5. [Google Scholar]
- Dannemand, M.; Dragsted, J.; Fan, J.; Johansen, J.B.; Kong, W.; Furbo, S. Experimental Investigations on Prototype Heat Storage Units Utilizing Stable Supercooling of Sodium Acetate Trihydrate Mixtures. Appl. Energy 2016, 169, 72–80. [Google Scholar] [CrossRef]
- Dannemand, M.; Kong, W.; Fan, J.; Johansen, J.B.; Furbo, S. Laboratory Test of a Prototype Heat Storage Module Based on Stable Supercooling of Sodium Acetate Trihydrate. Energy Procedia 2015, 70, 172–181. [Google Scholar] [CrossRef]
- Dannemand, M.; Johansen, J.B.; Kong, W.; Furbo, S. Experimental Investigations on Cylindrical Latent Heat Storage Units with Sodium Acetate Trihydrate Composites Utilizing Supercooling. Appl. Energy 2016, 177, 591–601. [Google Scholar] [CrossRef]
- Zalewski, L.; Franquet, E.; Gibout, S.; Tittelein, P.; Defer, D. Efficient Characterization of Macroscopic Composite Cement Mortars with Various Contents of Phase Change Material. Appl. Sci. 2019, 9, 1104. [Google Scholar] [CrossRef]
- Desgrosseilliers, L. Design and Evaluation of a Modular, Supercooling Phase Change Heat Storage Device for Indoor Heating. Ph.D. Thesis, Université Dalhousie, Halifax, NS, Canada, 2017. [Google Scholar]
- Dannemand, M. Compact Seasonal PCM Heat Storage for Solar Heating Systems. Ph.D. Thesis, Technical University of Denmark, Lyngby, Denmark, 2015. [Google Scholar]
- Ferrer, G.; Solé, A.; Barreneche, C.; Martorell, I.; Cabeza, L.F. Review on the Methodology Used in Thermal Stability Characterization of Phase Change Materials. Renew. Sustain. Energy Rev. 2015, 50, 665–685. [Google Scholar] [CrossRef]
- Yehya, A. Contribution to the Experimental and Numerical Characterization of Phase-Change Materials: Consideration of Convection, Supercooling, and Soluble Impurities. Ph.D. Thesis, Université d’Artois, Arras, France, 2015. [Google Scholar]
- Beaupère, N. Pilotage de La Libération de Chaleur et Étude Du Vieillissement de Matériaux à Changement de Phase. Ph.D. Thesis, Université d’Artois, Arras, France, 2019. [Google Scholar]
- Green, W.F. The “Melting-Point” of Hydrated Sodium Acetate: Solubility Curves. J. Phys. Chem. 1907, 12, 655–660. [Google Scholar] [CrossRef]
- Johansen, J.B.; Dannemand, M.; Kong, W.; Fan, J.; Dragsted, J.; Furbo, S. Thermal Conductivity Enhancement of Sodium Acetate Trihydrate by Adding Graphite Powder and the Effect on Stability of Supercooling. Energy Procedia 2015, 70, 249–256. [Google Scholar] [CrossRef]
- Araki, N.; Futamura, M.; Makino, A.; Shibata, H. Measurements of Thermophysical Properties of Sodium Acetate Hydrate. Int. J. Thermophys. 1995, 16, 1455–1466. [Google Scholar] [CrossRef]
- Cabeza, L.F.; Roca, J.; Nogués, M.; Mehling, H.; Hiebler, S. Immersion Corrosion Tests on Metal-Salt Hydrate Pairs Used for Latent Heat Storage in the 48 to 58°C Temperature Range. Mater. Corros. 2002, 53, 902–907. [Google Scholar] [CrossRef]
- Efremov, V.A.; Endeladze, N.O.; Agre, V.M.; Trunov, V.K. Refinement of the Crystal Structure of Sodium Acetate Trihydrate. J. Struct. Chem. 1986, 27, 498–501. [Google Scholar] [CrossRef]
- Duquesne, M.; Palomo Del Barrio, E.; Godin, A. Nucleation Triggering of Highly Undercooled Xylitol Using an Air Lift Reactor for Seasonal Thermal Energy Storage. Appl. Sci. 2019, 9, 267. [Google Scholar] [CrossRef]
- Munakata, T.; Nagata, S. Electrical Initiation of Solidification and Preservation of Supercooled State for Sodium Acetate Trihydrate. In Proceedings of the 14th International Heat Transfer Conference, Washington, DC, USA, 8–13 August 2010; ASME: Washington, DC, USA, 2010; Volume 7, pp. 383–388. [Google Scholar]
- Dannemand, M.; Delgado, M.; Lazaro, A.; Penalosa, C.; Gundlach, C.; Trinderup, C.; Johansen, J.B.; Moser, C.; Schranzhofer, H.; Furbo, S. Porosity and Density Measurements of Sodium Acetate Trihydrate for Thermal Energy Storage. Appl. Therm. Eng. 2018, 131, 707–714. [Google Scholar] [CrossRef]
- Guion, J.; Teisseire, M. Nucleation of Sodium Acetate Trihydrate in Thermal Heat Storage Cycles. Sol. Energy 1991, 46, 97–100. [Google Scholar] [CrossRef]
- Zalba, B.; Marín, J.M.; Cabeza, L.F.; Mehling, H. Review on Thermal Energy Storage with Phase Change: Materials, Heat Transfer Analysis and Applications. Appl. Therm. Eng. 2003, 23, 251–283. [Google Scholar] [CrossRef]
- Wada, T. Study of Sodium Acetate Trihydrate for Latent Heat Storage. Ph.D. Thesis, Osaka University, Osaka, Japan, 1985. [Google Scholar]
Publisher’s Note: MDPI stays neutral with regard to jurisdictional claims in published maps and institutional affiliations. |
© 2021 by the authors. Licensee MDPI, Basel, Switzerland. This article is an open access article distributed under the terms and conditions of the Creative Commons Attribution (CC BY) license (http://creativecommons.org/licenses/by/4.0/).