Article

Research on Improved OEE Measurement Method Based on the Multiproduct Production System

School of Economics and Management, Tongji University, Shanghai 200092, China
*
Author to whom correspondence should be addressed.
Appl. Sci. 2021, 11(2), 490; https://doi.org/10.3390/app11020490
Submission received: 14 December 2020 / Revised: 31 December 2020 / Accepted: 3 January 2021 / Published: 6 January 2021
(This article belongs to the Special Issue Applied Engineering to Lean Manufacturing and Production Systems 2020)

Abstract

:

Featured Application

This study aims to measure and improve the effectiveness of the multiproduct production system in the manufacturing enterprises precisely.

Abstract

The multiproduct production system has been applied extensively in factories worldwide due to the diverse consumption habits of consumers. However, current Overall Equipment Effectiveness (OEE) measurement methods are not suitable for it properly. With the prevailing of multiproduct production system, it is essential to measure the effectiveness accurately in this kind of production system. In order to fill this gap, based on analyzing former OEE models, we propose the multiproduct production system effectiveness (MPSE), including the calculating steps and application framework, in this paper using the heuristic method. This MPSE is verified by a case study. The principal results show that the proposed MPSE can significantly enhance overall production effectiveness and improve the measurement of indicators in the multiproduct production system, which enriches the theory of OEE at the theoretical level and proposes a novel way to measure and improve the effectiveness of the multiproduct production system effectively at the practical level.

1. Introduction

The COVID-19 pandemic has influenced our life on so many levels [1,2]. Recently the second explosion of the virus has caused a sharp increase in the demand of different kinds of medical equipment in a short time again, such as adult masks and children’s masks. These fast market changes push the manufacturing factories to upgrade their traditional manufacturing system, which means that products in different colors, diverse forms, and various purposes should be manufactured in one equipment or one production line. In addition, the ability to promptly and efficiently meet the diverse external demands has become one of the most important evaluation criteria of a business’s core competitiveness, especially under the fierce competition [3,4]. Therefore, the multiproduct production system has been introduced by the modern factories increasingly in order to improve their production effectiveness. What’s more, with the increasing demands for mass customized manufacturing and the prevailing of industry 4.0, a multiproduct production system would be applied into the manufacturing enterprises further in the future [5].
Overall Equipment Effectiveness (OEE), an approach to measure the losses of a machine or production facility, has been regarded as one of the core elements of production control and Total Productive Maintenance (TPM) [6,7]. It consists of three subindicators: availability rate, performance effectiveness and quality rate [8]. For many years, OEE has been adopted to identify the untapped potential of the production capacity and improve the production effectiveness [9]. Therefore, OEE has been widely used in the industrial management to measure the efficiency of the production system. However, is OEE suitable for the multiproduct production environment? How can we apply the OEE into the multiproduct production system and improve the system continuously? In this study, we would like address these questions. This paper would focus on the application of OEE in the multiproduct production system, which has the benefits of measuring the losses and improving the production effectiveness in the multiproduct production environment, thereby enhancing the core competitiveness of the manufacturing enterprises.
The application of OEE theory has been discussed in different research fields, including internet of things (IoT), tool management, sustainable manufacturing and so on. As seen in Table 1. Hwang et al. developed a novel production performance model to measure real-time performance indicators based on the IoT and OEE [10]. Similarly, Dovere et al. applied the OEE into the radio frequency identification (RFID) system and developed an assessment model in tool management [11]. Poorya at al. extended OEE theory into the sustainable manufacturing in Industry 4.0 [12]. Maideen et al. proposed a practical framework to apply OEE in the manufacturing process environment [13]. Domingo and Aguado expanded the concept of OEE with the sustainability and presented the overall environmental equipment effectiveness (OEEE) as a metric of the lean and green manufacturing system [14].
Besides, some scholars focused on the multiproduct production system, which mainly involves the production planning, implementation strategy, maintenance planning, scheduling problem, quality improvement and the like. Mahmound et al. developed a new optimization model for a multiperiod and multiproduct production planning system with uncertain product demand [15]. Similarly, Talay and Ozdemirakyildirim analyzed a multiproduct and multistage system subject to uncertain yield and developed a novel solution algorithm for procurement and production amounts [16]. To avoid inadequate maintenance and excessive maintenance in the manufacturing system, the optimization model of the production planning problem of discrete manufacturing industry and noncyclical preventive maintenance was proposed by Liu et al. [17]. Ettaye et al. optimized the integrated planning of preventive maintenance and production in the multiproduct production system [18]. Lu et al. proposed an integrated scheduling for the hybrid manufacturing and recovering system in a multiproduct and multistage environment [19]. Rauf et al. found that a raccoon family optimization algorithm could be used to solve the planning and scheduling problems of multiobjective manufacturing projects with limited sharing resources [20]. Oyebolu et al. presented a discrete-event simulation of continuous bioprocesses in a scheduling environment and proposed a novel look-ahead scheduling policy [21]. Du et al. identified the machine and/or parameters which could lead to the largest improvement on quality by extending the Markov model and carrying out the product sequence analysis [22]. Zhang et al. proposed a dynamic modeling method for task reliability in the multistate manufacturing system with multiproduction line [23].
However, few pieces of research considered the application of OEE in the multiproduct production system, especially for measuring production effectiveness from a holistic perspective. With the necessity of the multiproduct production system in modern factories, the research about the application of OEE in this system has become quite urgent. Thus, this study would like to address this gap. In this paper, based on the heuristic design idea, multiproduct production system effectiveness (MPSE), a novel method to calculate the effectiveness of the multiproduct production system, is proposed. Besides, this study further undertakes an empirical study to verify the reliability of this method. The research results broaden the application of OEE theory in the multiproduct production system and ameliorate OEE’s measurement methods. Besides, the results are conducive to the measurement and improvement in the effectiveness of the multiproduct production system in practice.
The main contributions of this paper can be listed as:
  • The deficiencies of mainstream OEE measurement methods in the multiproduct production system are concluded, and the characteristics of the multiproduct production system are summarized;
  • MPSE is proposed to measure the production effectiveness of the multiproduct production system, improving the production effectiveness and operation performances of the multiproduct production system;
  • The application framework of MPSE is introduced, which is based on the Plan-Do-Check-Action cycle (PDCA), is available for the improvement of the multiproduct production system continuously.
The structure of this paper is organized as follows. Current OEE measurement methods and their deficiencies in the multiproduct production system are shown in Section 2. In Section 3, the methodology, which includes the characteristics of the multiproduct production system and the design ideas of MPSE, is discussed. Then, the MPSE measurement methods and the application framework are proposed in Section 4. In Section 5, the case study about the MPSE’s application in enterprise Q is analyzed. In the end, the discussion about the main findings, research implications, and possible further research directions are mentioned in Section 6.

2. Mainstream OEE Measurement Methods and Their Deficiencies

In this chapter, the original OEE and some mainstream OEE measurement methods are briefly introduced in Section 2.1, including their basic equations, characteristics, and so on. In Section 2.2, the deficiencies of these OEE measurement methods are analyzed and concluded in the context of the multiproduct production system.

2.1. Introduction of Mainstream OEE Measurement Methods

Overall Equipment Efficiency. OEE was officially put forward by Seiichi Nakajima [24]. The primary arithmetic of OEE is:
O E E   =   A R   ×   P E   ×   Q R
A R   =   O T L T
P E   =   S C T   ×   T O O T
Q R   =   Q P T O
where,
A R is Availability Rate (the degree of utilization of production planning time).
P E is Performance Effectiveness (the degree of exertion of equipment’s design performance).
Q R is Quality Rate (the proportion of qualified products in all of the products produced).
L T is Loading Time (calculated by Factory Planning Working Time minus Factory Planning Downtime).
S C T is Single Cycle Time.
O T is Operating Time (calculated by that Loading Time minus Equipment Downtime including Adjustment Time, Failure Time, and so on).
T O is Total Output.
Q P is Qualified Products (given by Total Output minus Defect Amount).
Therefore, the detailed arithmetic of OEE is:
O E E   =   O T L T   ×   S C T   ×   T O O T   ×   Q P T O
The arithmetic can be simplified as:
O E E   =   S C T   ×   Q P L T
The further simplified form is:
O E E   =   Q O C T L T
Q O C T means Qualified Output Cycle Time. The ultimate arithmetic is a ratio of time, which is used to reflect the production effectiveness of the factory within the statistical time. OEE, as a tool to measure actual production effectiveness by focusing on single equipment or single production line, is universally acknowledged all over the world [25].
The Total Equipment Effectiveness Performance (TEEP) was put forward by Invancic I [26] and the arithmetic of TEEP is:
T E E P   =   E U   ×   O E E
E U means Equipment Utilization. TEEP can reflect the equipment effectiveness comprehensively by considering all the factors. It can also assess whether the utilization of the equipment is maximized.
Production Equipment Effectiveness (PEE). Raouf proposed the concept of PEE by assigning weight coefficients to the three indicators in the OEE arithmetic in 1994 [27] and the specific calculation is:
P E E   =   A R   ×   w 1   ×   P E   ×   w 2   ×   Q R   ×   w 3
Overall Factory Effectiveness (OFE). Scott and Pisa developed the OFE [28], which focused on the existing correlation among the equipment, production process, order plan, and so on. It could be used to measure the overall production effectiveness of the factory and arrange the production process. In addition, it could be adopted to coordinate the production line scheduling and factory scheduling. Actually, there is no general calculation method for OFE until now. Scott and Pisa hold the idea that composite indicators (rework rate, inventory turnover rate, on-time delivery, and the like) should be set and weighted. In 2003, Huang et al. developed an OFE metric and adopted simulation analysis to integrate these metrics for the improvement of manufacturing productivity based on the analysis of metrics [29].
Overall Asset Effectiveness (OAE) and Overall Production Effectiveness (OPE). Based on OEE, OAE and OPE were expanded, which were widely used to identify and measure losses in the overall manufacturing environment [30].
Total Equipment Effectiveness (TEE). Daniel and Sheu designed TEE in 2006. From the TEE, it could be learned that various resource inputs were considered in the production process [31]:
T E E   =   i = 1 I ω i e i   ×   O E E
where, e i   is the ratio of actual input resources and theoretical input resources in the i th process, I represents the number of all processes, and ω i   is its weight (   ω i   =   1 ).
Modified OEE. In 2005, Ron and Rooda improved the OEE arithmetic with two indicators of Rate Effectiveness (RE) and Operating Effectiveness (OE) [32] and the modified OEE arithmetic was:
O E E   =   A R   ×   R E   ×   O E   ×   Q R
It offers a new way to measure the production effectiveness, and this measurement eliminates the influence of irrelevant factors from the equipment.
Generally speaking, the previous OEE measurement methods indicate two main directions of OEE’s improvement: optimization of measurement accuracy and larger measurement scope, which contribute to OEE’s theory and promote their application in modern factories.

2.2. The Defficiencies of Mainstream OEE Measurement Methods

Although the above OEE measurement methods have been applied in many fields extensively, there are still some deficiencies when they are adopted in the multiproduct production system. The deficiencies are listed as follows. In addition, the descriptions of current OEE measurement methods and their disadvantages are displayed in Table 2.
  • Inadequacy. Some of the measurement methods above focus on single equipment or single production line rather than the whole production system which would cause the omission of measurement values [33]. Therefore, these measurement methods cannot be used to calculate the indicators of the multiproduct production system precisely, such as production effectiveness and measuring losses [34]. Hence, a specific indicator representing the whole effectiveness of the production system should be established in order to eliminate the measurement errors [35].
  • Inflexibility. The indicators in these measurement methods are fixed. Therefore, they cannot be adjusted quickly when the production conditions change. In a real manufacturing environment, the production plans in the multiproduct production system are flexible and changeable. Consequently, the actual losses would be concealed, and the measured production effectiveness in the system may be inexact if these measurement methods are still adopted in the multiproduct production system, which would cause that the observational values are in an abnormal fluctuation. Thus, the measurement methods should be dynamic to adapt to a dynamic environment [36,37].
  • Difficulties in continuous improvement of the production system. It is reasonable to diagnose the negative factors which lead to the losses in the production system and propose the countermeasures to the managers in order to improve the overall production system continuously [38]. However, the negative factors in the multiproduct production system cannot be reflected by former measurement methods sufficiently since these measurement methods did not take into account the complex manufacturing process in the multiproduct production system. As a result, the negative factors in the system are difficult to find [39] and related managerial enlightenments are hardly indicated, which is not beneficial to the continuous improvement of the multiproduct production system.

3. Methodology

In this paper, a heuristic method is adopted. Based on the deficiencies of mainstream OEE measurement methods and the characteristics of the multiproduct production system, the design ideas are proposed. MPSE’s measurement methods and the application framework are developed. In the end, both of them are verified by the case study. The research scheme is shown in Figure 1.

3.1. Characteristics of the Multiproduct Production System

In order to ensure the compatibility of a new OEE measurement method in the multiproduct production system, the characteristics of the system should be analyzed. Based on previous literature, thus, the main characteristics of the system are concluded to be as follows.
  • Organizational complexity. Multiproduct production system is composed of the diverse manufacturing equipment, products, and so on. Therefore, there are more manufacturing strategies compared with a single product manufacturing system because of the customized demands, which implies a more complex production system [40,41,42].
  • Bottleneck variability. The production system, which produces a variety of products, has different production bottlenecks [43,44], such as the machines, raw materials, specifications, production speeds, and the like. Even in the same production line, different bottlenecks may appear because of the changes in the manufacturing environment, the device types, and equipment status [45]. Thus, the bottlenecks in the multiproduct production system are variable and may bring an adverse effect on the flow of products [46].
  • Product specification diversity. In a multiproduct production system, the products with different specifications including colors, sizes, and other attributes should be manufactured in one production line [47]. Hence, the product specifications are quite varied and diverse based on the perspective of the holistic system.

3.2. Design Ideas of MPSE

Considering the characteristics of the multiproduct production system and the disadvantages of current OEE measurement methods, we conclude the design ideas based on the research in other fields, such as project management, programming, flexible manufacturing, and statistics. This heuristic method could match the requirements in the multiproduct production system and improve the current OEE measurement methods.
  • Integration idea. The idea of integration has been widely adopted in many other research fields, such as business, programming, and so on. In the process of manufacturing, the idea of integration can be effectively used in multitasking project management, system design, and the like [48,49,50]. Similarly, in the multiproduct production system, the idea of integration is often applied in the manufacturing industry by solving multiple subproblems to achieve an overall goal, such as the capacity improvement and quality improvement [51,52]. Therefore, based on the integration idea, we can simplify the measurement for whole system indicators by measuring several subsystem indicators, which is more accessible in the multiproduct production environment. Hence, the integration idea should be applied into the design of MPSE.
  • Dynamic idea. The dynamic disturbance is commonly found in production systems because of unpredictable real-time events. In the environment of the production system, the occurrence of some random internal and external noises, such as machine tool failure, new order entry, would cause the infeasibility of original optimal scheduling [53,54,55]. Thus, we have to adjust the scheduling plan dynamically. If we still adopt the static measurement method, the data we collect would not be accurate. Therefore, the dynamic idea is often used to solve these problems by designing a dynamic management system to adapt to the manufacturing environment’s change, especially in the multiproduct production system [56,57]. In addition, the dynamic idea can still support the dynamic measurement index of MPSE although there are some changes in the bottleneck, load time, and so on.
  • Standardization idea. In the statistical model, data should be standardized to eliminate the impact of dimension [58]. Similarly, the measurement indicators of different dimensions, which are caused by the different product’s technologies, the different units of measurement for bottleneck velocity, and so on, should be converted in the same dimension since the data in manufacturing system may in different units, for example the output of product with different specifications. Therefore, the standardization idea should be used in MPSE to eliminate the negative effect caused by the variety of products in the multiproduct production system [59].

4. MPSE

In this chapter, we combine the design ideas with the original measurement method and then MPSE, a novel measurement method for the multiproduct production system, is proposed. In addition, the calculation steps and related information are presented. Moreover, the application framework of MPSE is displayed based on the PDCA cycle, which can be used to continuous improvement for the manufacturing system.

4.1. Calculation Steps of MPSE

OEE is a useful measurement method in the industrial management. Similarly, MPSE is the application of OEE in multiproduct production system, thus, it should be expressed by a formula. Here, the detailed calculation steps are displayed.
Indices
i Index for the products,   1 i I
j Index for the manufacturing procedures,   1 j J
Parameters
y i Theoretical bottleneck speed of the i th product in multiproduct production system
s i j Theoretical production speed of the i th product in the j th procedure
x i Actual bottleneck speed of the i th product in multiproduct production system
s i j Actual production speed of i th product in the j th procedure
z i Theoretical load time of the i th product
P W T i   Planned working time of the i th product
P D i Planned downtime of the i th product
t i Actual load time of the i th product
U D i Unplanned downtime of the i th product
P C i   Production capacity of the i th product
q i Quantity of defective products within the process of manufacturing the i th product
M P S E   Multiproduct Production System Effectiveness
1.
To measure the theoretical bottleneck speed of each product:
y i   =   m i n ( s i j ) ;   i   =   1 I ;   j   =   1 J
2.
To measure the actual bottleneck speed of each product:
x i   =   m i n ( s i j ) ;   i   =   1 I ;   j   =   1 J
3.
To calculate theoretical load time of each product:
z i   =   P W T i P D i ;   i   =   1 I
4.
To calculate the actual load time of each product:
t i   =   z i U D i ;   i   =   1 I
5.
To calculate the production capacity:
P C i   =   x i   ×   t i q i y i   ×   z i ;   i   =   1 I
6.
To integrate all P C i into a complete arithmetic:
M P S E   =   i = 1 n ( x i   ×   t i q i ) i = 1 n ( y i   ×   z i ) ;   i   =   1 I

4.2. Information Obtained from MPSE

Based on the above formulas, more valuable information can be explored, and the information would provide the managers with more accurate data in the multiproduct production system, which can be beneficial to optimize the production system in the next stage. Thus, the information derived from MPSE is concluded and shown in Table 3.

4.3. Application Framework of MPSE

Considering the characteristics of the multiproduct production system, a dynamic application framework should be considered to improve the system’s effectiveness continuously. The PDCA cycle is a method of continuous improvement, and it can find out better improvement methods through a closed loop of ‘Plan-Do-Check-Action’ [60,61,62]. Combined with PDCA cycle and MPSE, the application framework is proposed and the steps are listed in Figure 2.
  • The production capacities of each product and the overall production effectiveness of the multiproduct production system in the statistical time are calculated by Equations (16) and (17).
  • In this step, the C C s and M C R s of products can be calculated based on Equations (32) and (33), respectively, and then, we can find the product with a minimum value based on the value of M C R s, which is selected as the object to be improved. Specifically, M C R is a comprehensive indicator that can be used to find those products with large gaps between the theoretical performances and actual performances in terms of P E ,   A R and Q R which are important criteria of the ability of product manufacturing [63]. Thus, M C R is chosen as the indicator to find the products to be improved in this paper.
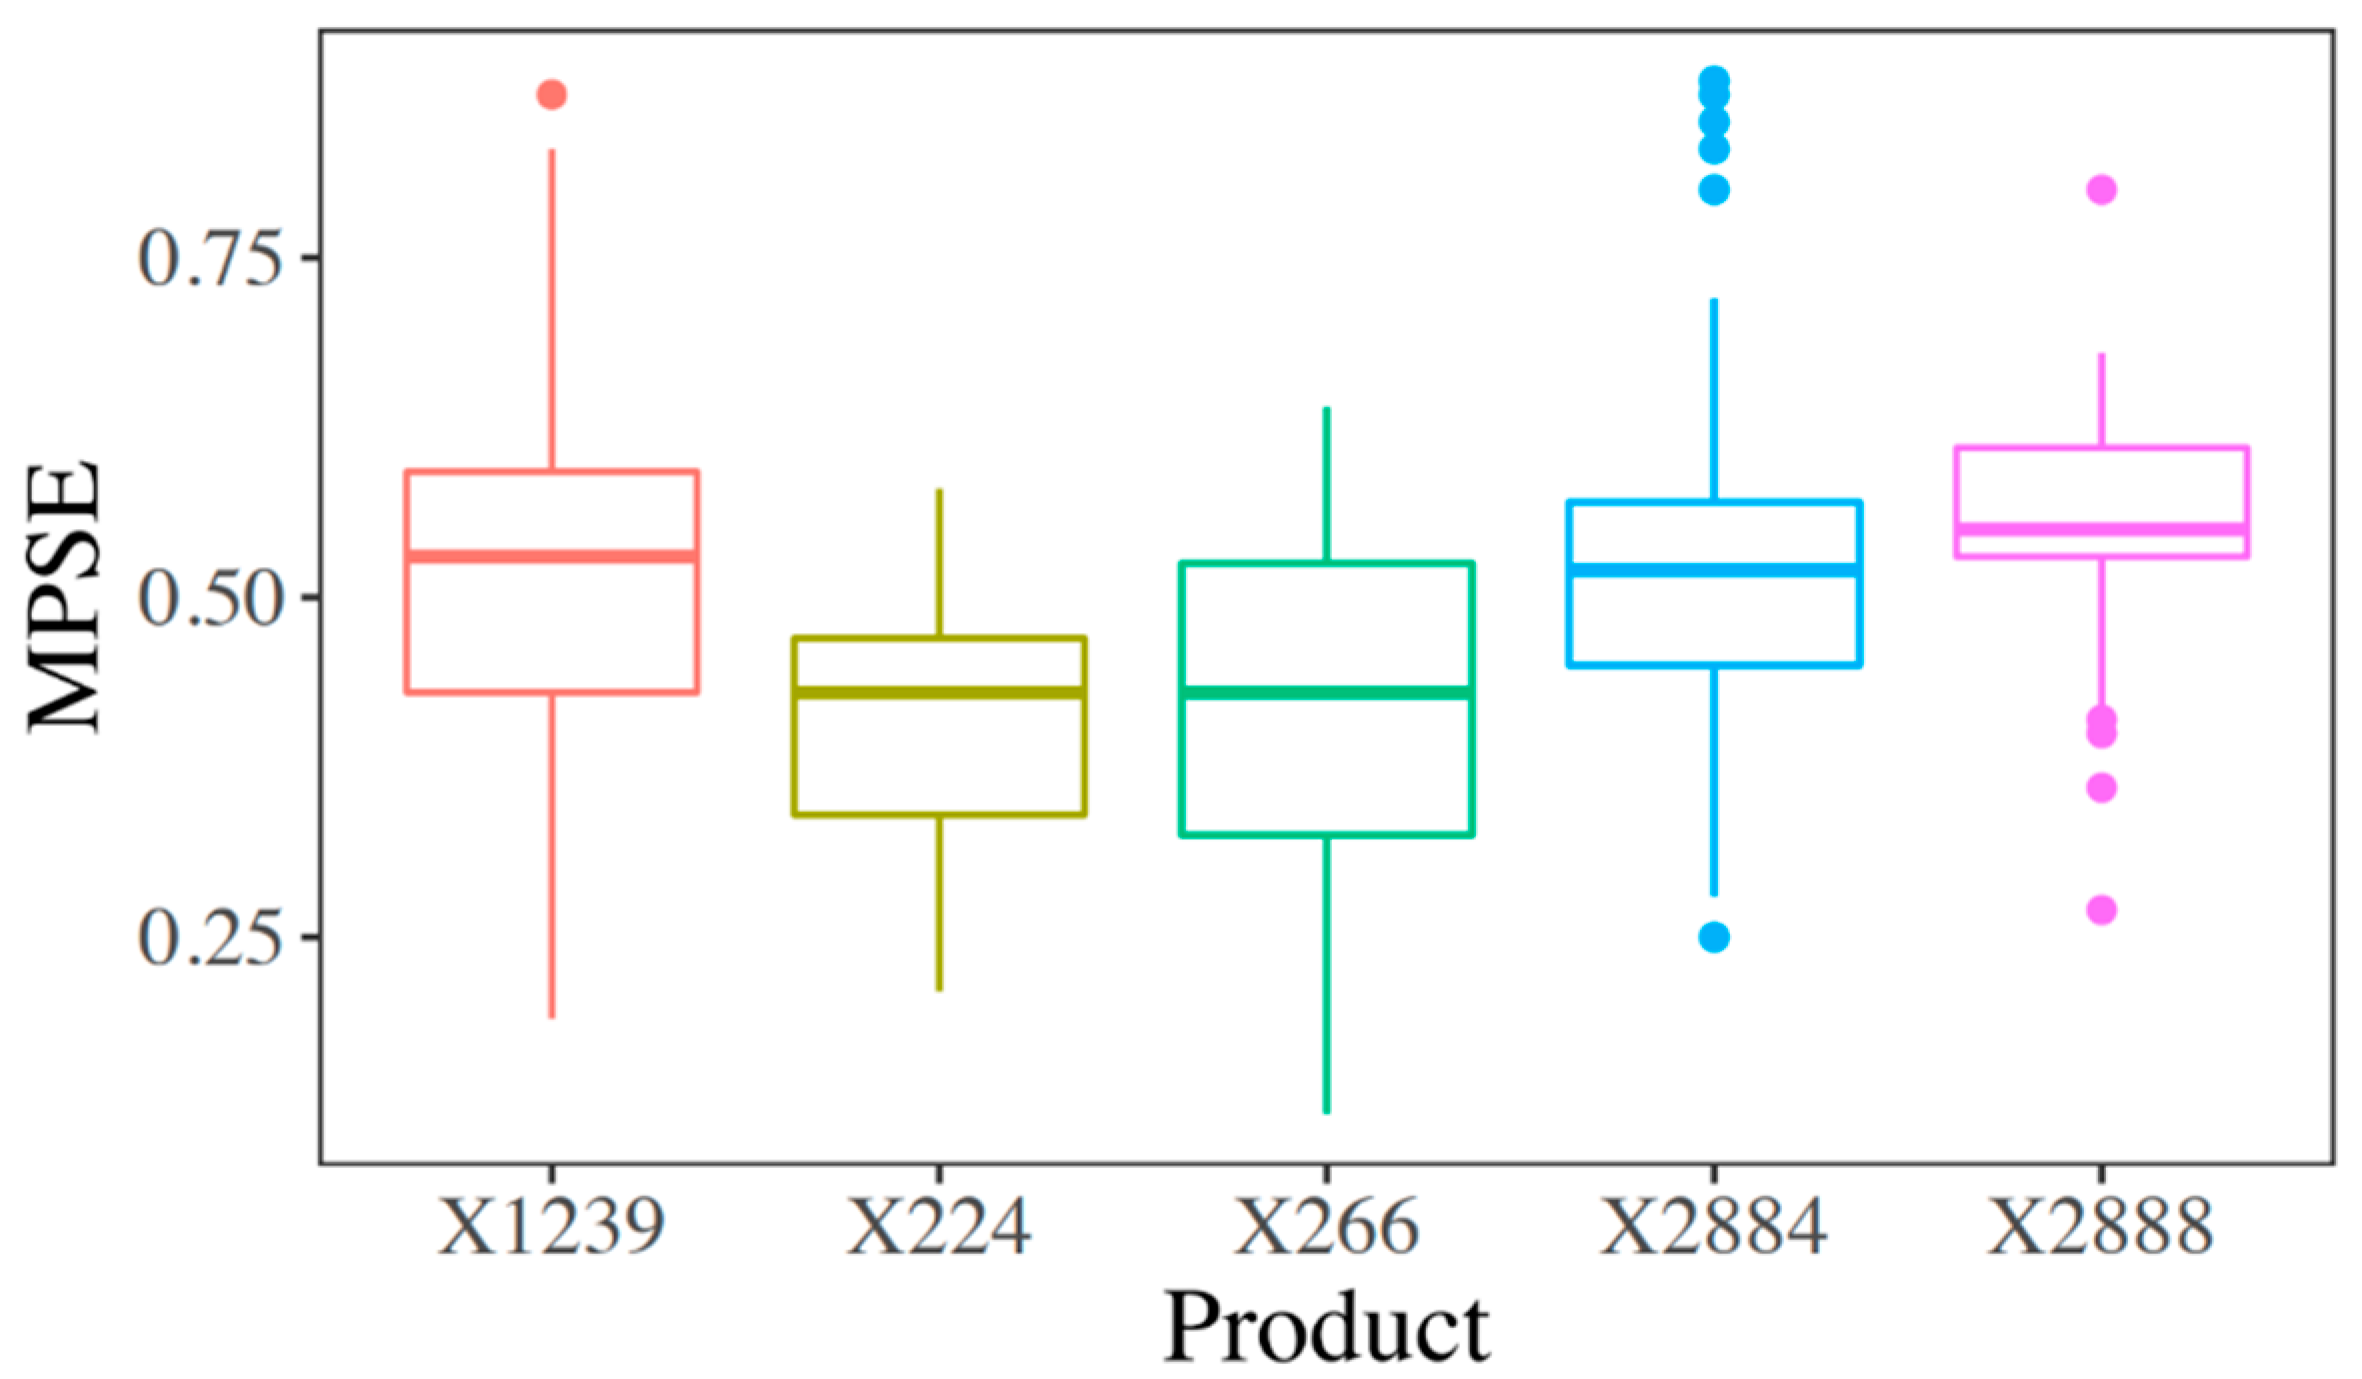
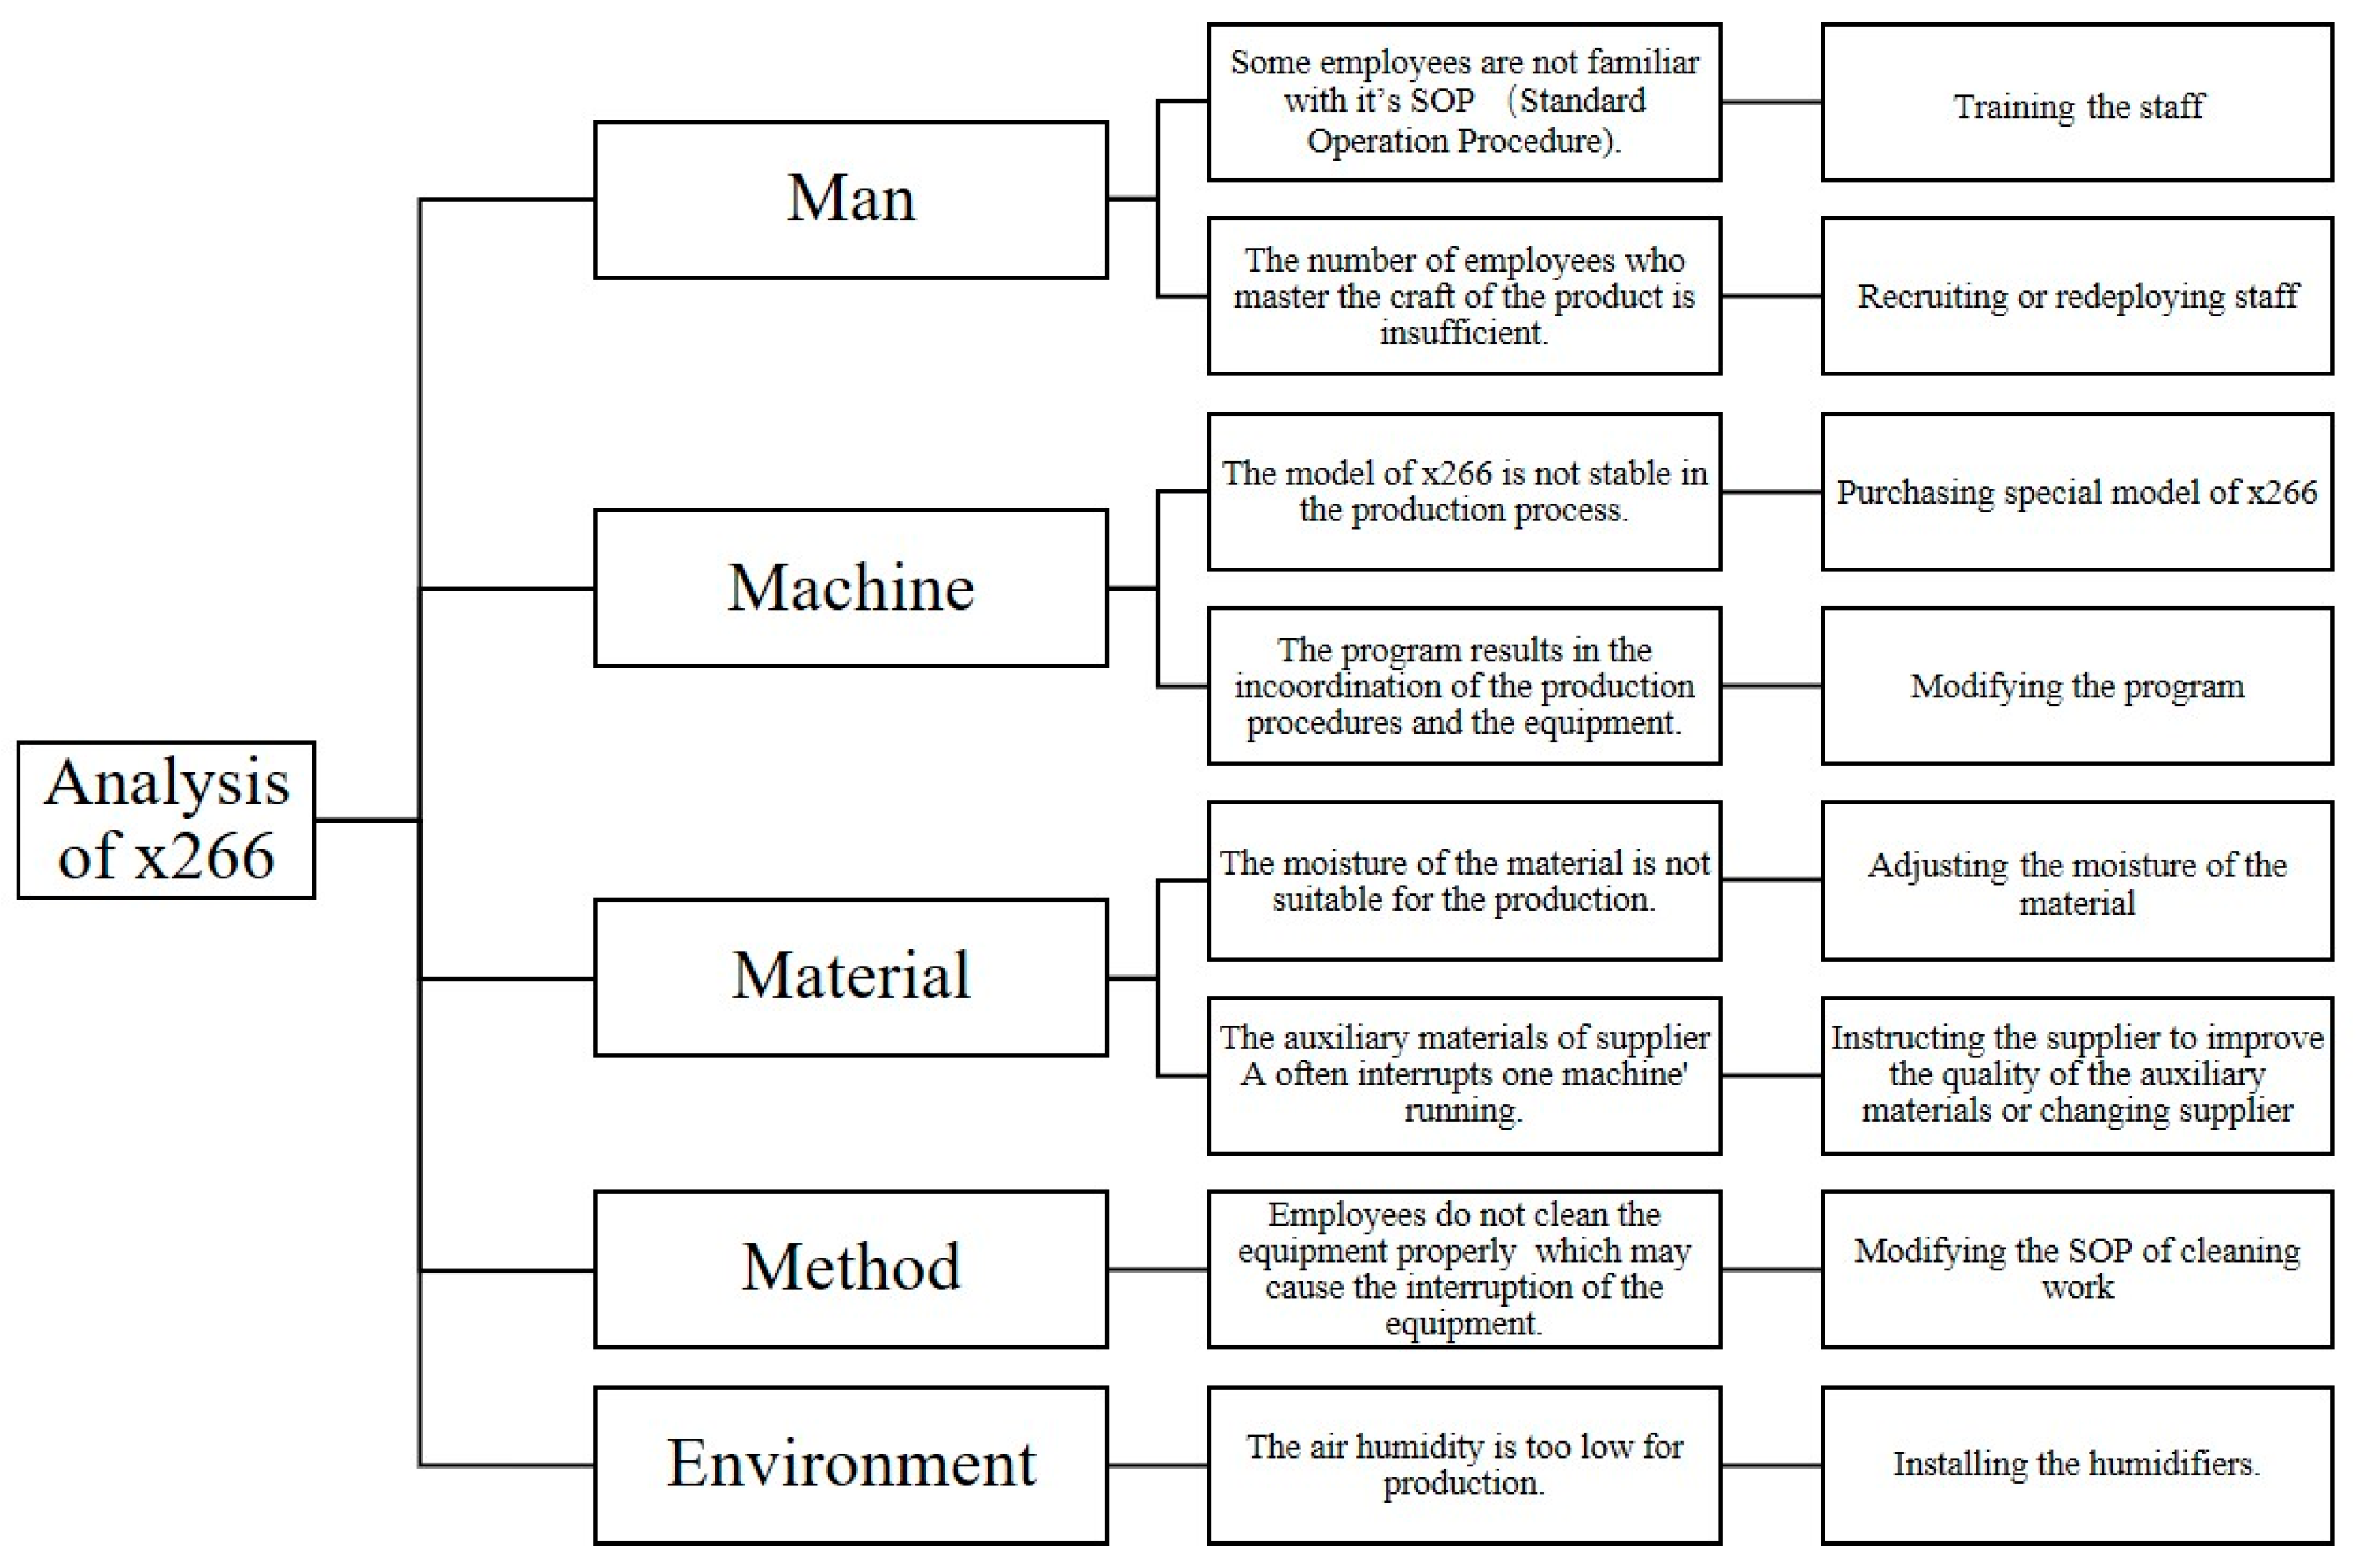
  • At this stage, some improvement plans for the products can be made by the analysis instruments, such as box plot and 4M1E analysis (analyzing problem by five factors, man, machine, material, method, and environment) [64]. In addition, these improvement plans should be executed.
  • The improvements are checked, and the process should return to step 3 if the improvements are dissatisfactory during this step.
  • A new cycle starts again by repeating step 1.

5. Case Study

In this chapter, a case study in a real world was conducted in order to verify the validation of MPSE and its application framework. A brief introduction about enterprise is shown in Section 5.1 and specific implementation process is displayed in Section 5.2.

5.1. Introduction of Enterprise Q

Enterprise Q was founded in the 1980s and it was a household paper manufacturer with a leading market share in China. In order to match external demand and its fast change, Enterprise Q upgraded its manufacturing system, and now it has 18 production lines which produce more than 200 kinds of household paper. The diagram is shown in Figure 3. In addition, these products are quite different in thickness, humidity, toughness and so on due to customized demands from the consumers although the raw materials are nearly same. Accordingly, these products vary in shape, size, pattern and the like, leading to different printing force, manufacturing temperature, cutting method in the manufacturing equipment, which mean that it is a typical multiproduct production system. Therefore, Enterprise Q was taken as the case to study, and from 2016 to 2018, OEE was used for measurement of production effectiveness. Since 2019, MPSE and the application framework were adopted to measure and improve the production effectiveness in the enterprise.

5.2. Implementation Process

5.2.1. Calculating the Overall Production Effectiveness in All Statistical Times

A work shift is considered as a statistical time ( S T ) (Enterprise Q works three shifts and 8 h per shift). The steps in Section 4.1. are used to calculate the overall production effectiveness in 93 statistical times. Product x 266 is randomly selected to be an example to understand the computational process.
  • The theoretical bottleneck speeds ( y i ) of each product are measured by Equation (12). There are six manufacturing procedures in the process of manufacturing x 266 and the designed production speeds in the procedures are 75 pieces/min, 61 pieces/min, 84 pieces/min, 53 pieces/min, 73 pieces/min, and 72 pieces/min respectively.
    y x 266   =   m i n ( 75 , 61 , 84 , 53 , 73 , 72 )   =   53   pieces/min
  • The actual bottleneck speeds ( x i ) are measured. In the actual process of manufacturing   x 266 , the speeds in these manufacturing procedures are 64 pieces/min, 41 pieces/min, 66 pieces/min, 44 pieces/min, 58 pieces/min, and 69 pieces/min. Therefore, according to Equation (13):
    x x 266   =   41   pieces/min
  • The theoretical load times are calculated. The planned working time of x 266 in a work shift is 480 min, and the planned downtime including cleaning time, maintenance time, adjustment time, and rest time is 55 min. According to Equation (14):
    z x 266   =   480     55   =   425   min
  • The actual load time of x 266 is measured by Equation (15). The unplanned downtime such as equipment failure time, supply delay time, and unplanned adjustment time, in total is 62 min, thus,
    t x 266   =   425     62   =   363   min
  • The production capacity of x 266 is calculated. The number of defective products in the statistical time is 63, and the figure can be calculated by Equation (16):
    P C x 266   =   41   ×   363     63 53   ×   425   =   0.65
  • All P C i s are integrated together by Equation (17). Actually, there are 43 kinds of products in the product production system during this statistical time. The M P S E is:
    M P S E S T 1   =   ( 41   ×   363     63   +   60   ×   388     69   +   37   ×   328     58 , ,   +   25   ×   136     33 ) ( 53   ×   425   +   77   ×   425   +   42   ×   360 , , +   55   ×   225 )   =   0.58
  • Using the steps of 1–6 to calculate the M P S E S T 2 ,   M P S E S T 3 , ,   M P S E S T 93 . These data are concluded in Table 4:

5.2.2. Selecting Products for Improvement

The M C R s of these products can be calculated by Equations (32) and (33), taking x 266 as an example.
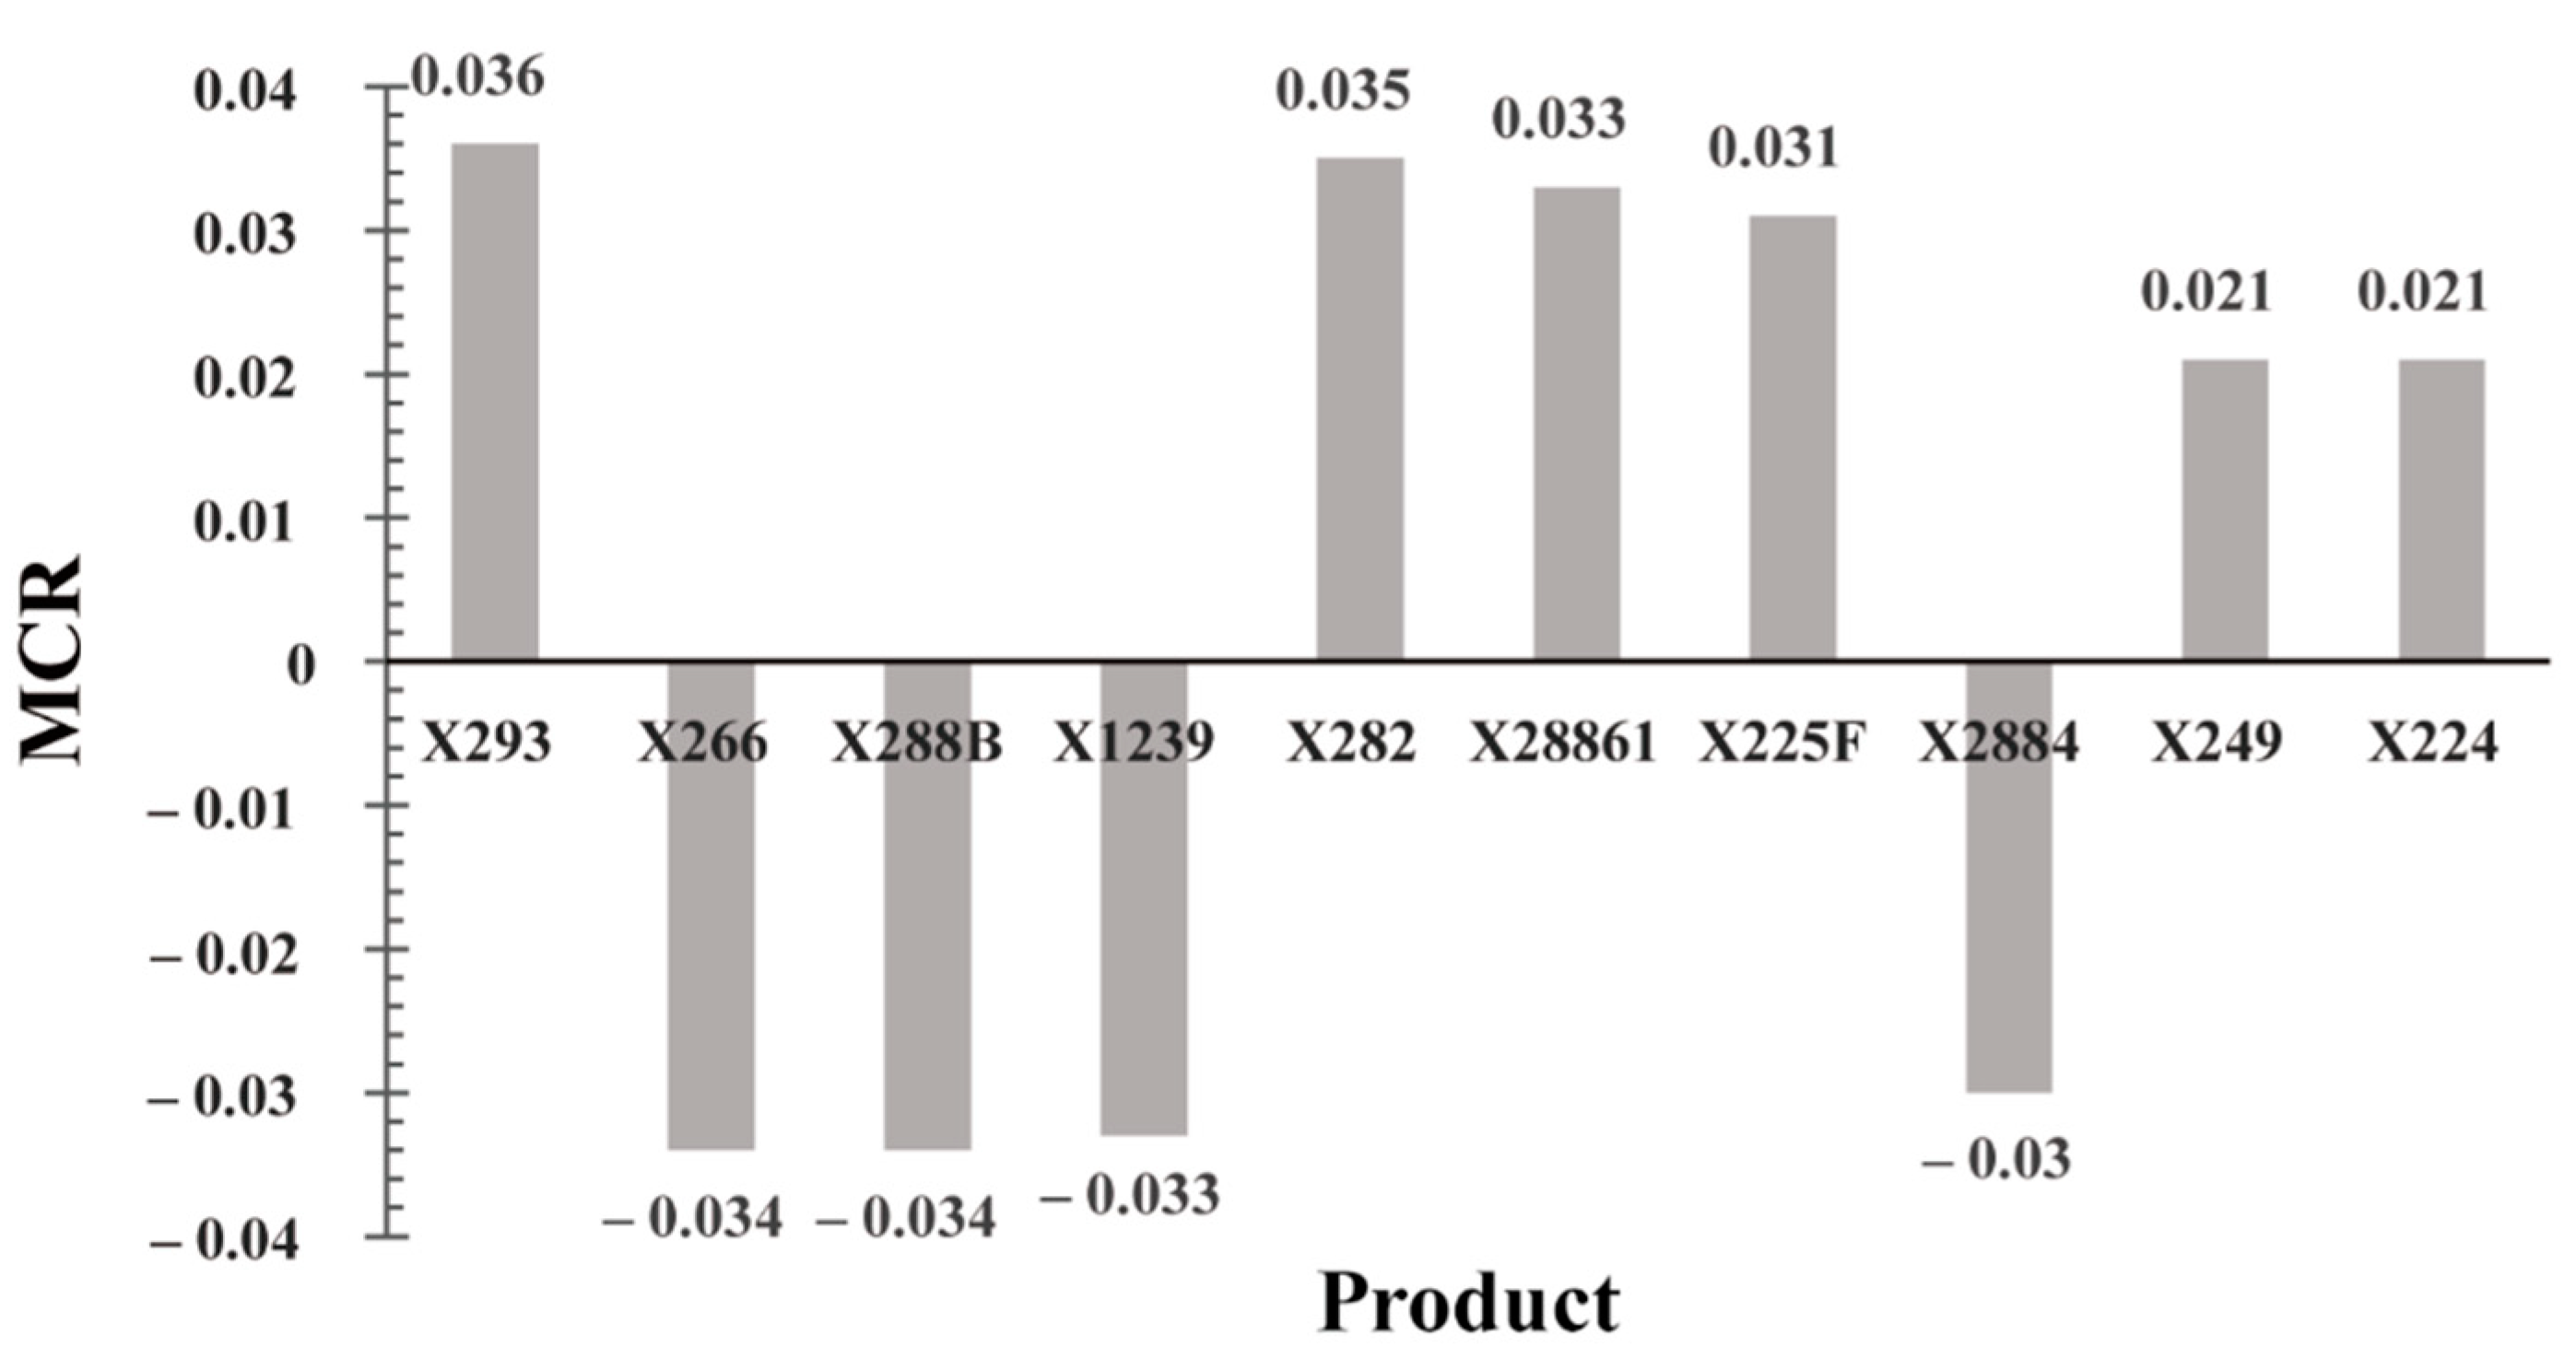
C C x 266   =   41   ×   33290     5699 41   ×   33290     5699 , . , +   42   ×   29008     6778     53   ×   39250 53   ×   39250 , , +   60   ×   35950   =   0.44 M C R x 266   =   0.44 | 0.44 |   +   | 0.27 |   +   | 0.29 | , ,   +   | 0.41 |   =   0.034
The C C s and M C R s of other products can be calculated in the same way, some of the results are shown in Figure 4. Then we can select some products to be improved according to the minimum value of MCR in the next step.

5.2.3. Making and Executing Improvement Plans

Firstly, the box plot is adopted to explore why there are significant losses on these products which are selected by previous step. After that, improvement plans for these products are proposed by the 4M1E method accordingly. In this stage, Product x 266 is randomly selected as an example and the results are shown in Figure 5 and Figure 6 respectively.

5.2.4. Checking the Improvements for All Selected Objectives

Based on the idea of PDCA cycle, all the improvements for the selected objectives should be checked. To be specific, the process would move on next stage if the results of improvement reach the intended target. Otherwise, the process should return to Section 5.2.3. and make a new improvement plan for these selected objectives.

5.2.5. Restarting a Cycle

In order to improve the manufacturing system continuously, the application framework of MPSE is a cyclical process. In addition, the multiproduct production system changes randomly with external and internal changes, such as the order changes, improvement of equipment, and so on. Therefore, the losses of equipment in the system and their causes could be variable. Hence, the cyclical process should be applied in order to improve the efficiency of whole system.

6. Result Analysis

In this chapter, the results of case study are presented. The results show that production effectiveness in the multiproduct production system has been significantly improved by MPSE. In addition, MPSE amends the deficiencies of previous OEE measurement methods in terms of accuracy, flexibility and continuous improvement.

6.1. Improvement of Production Effectiveness

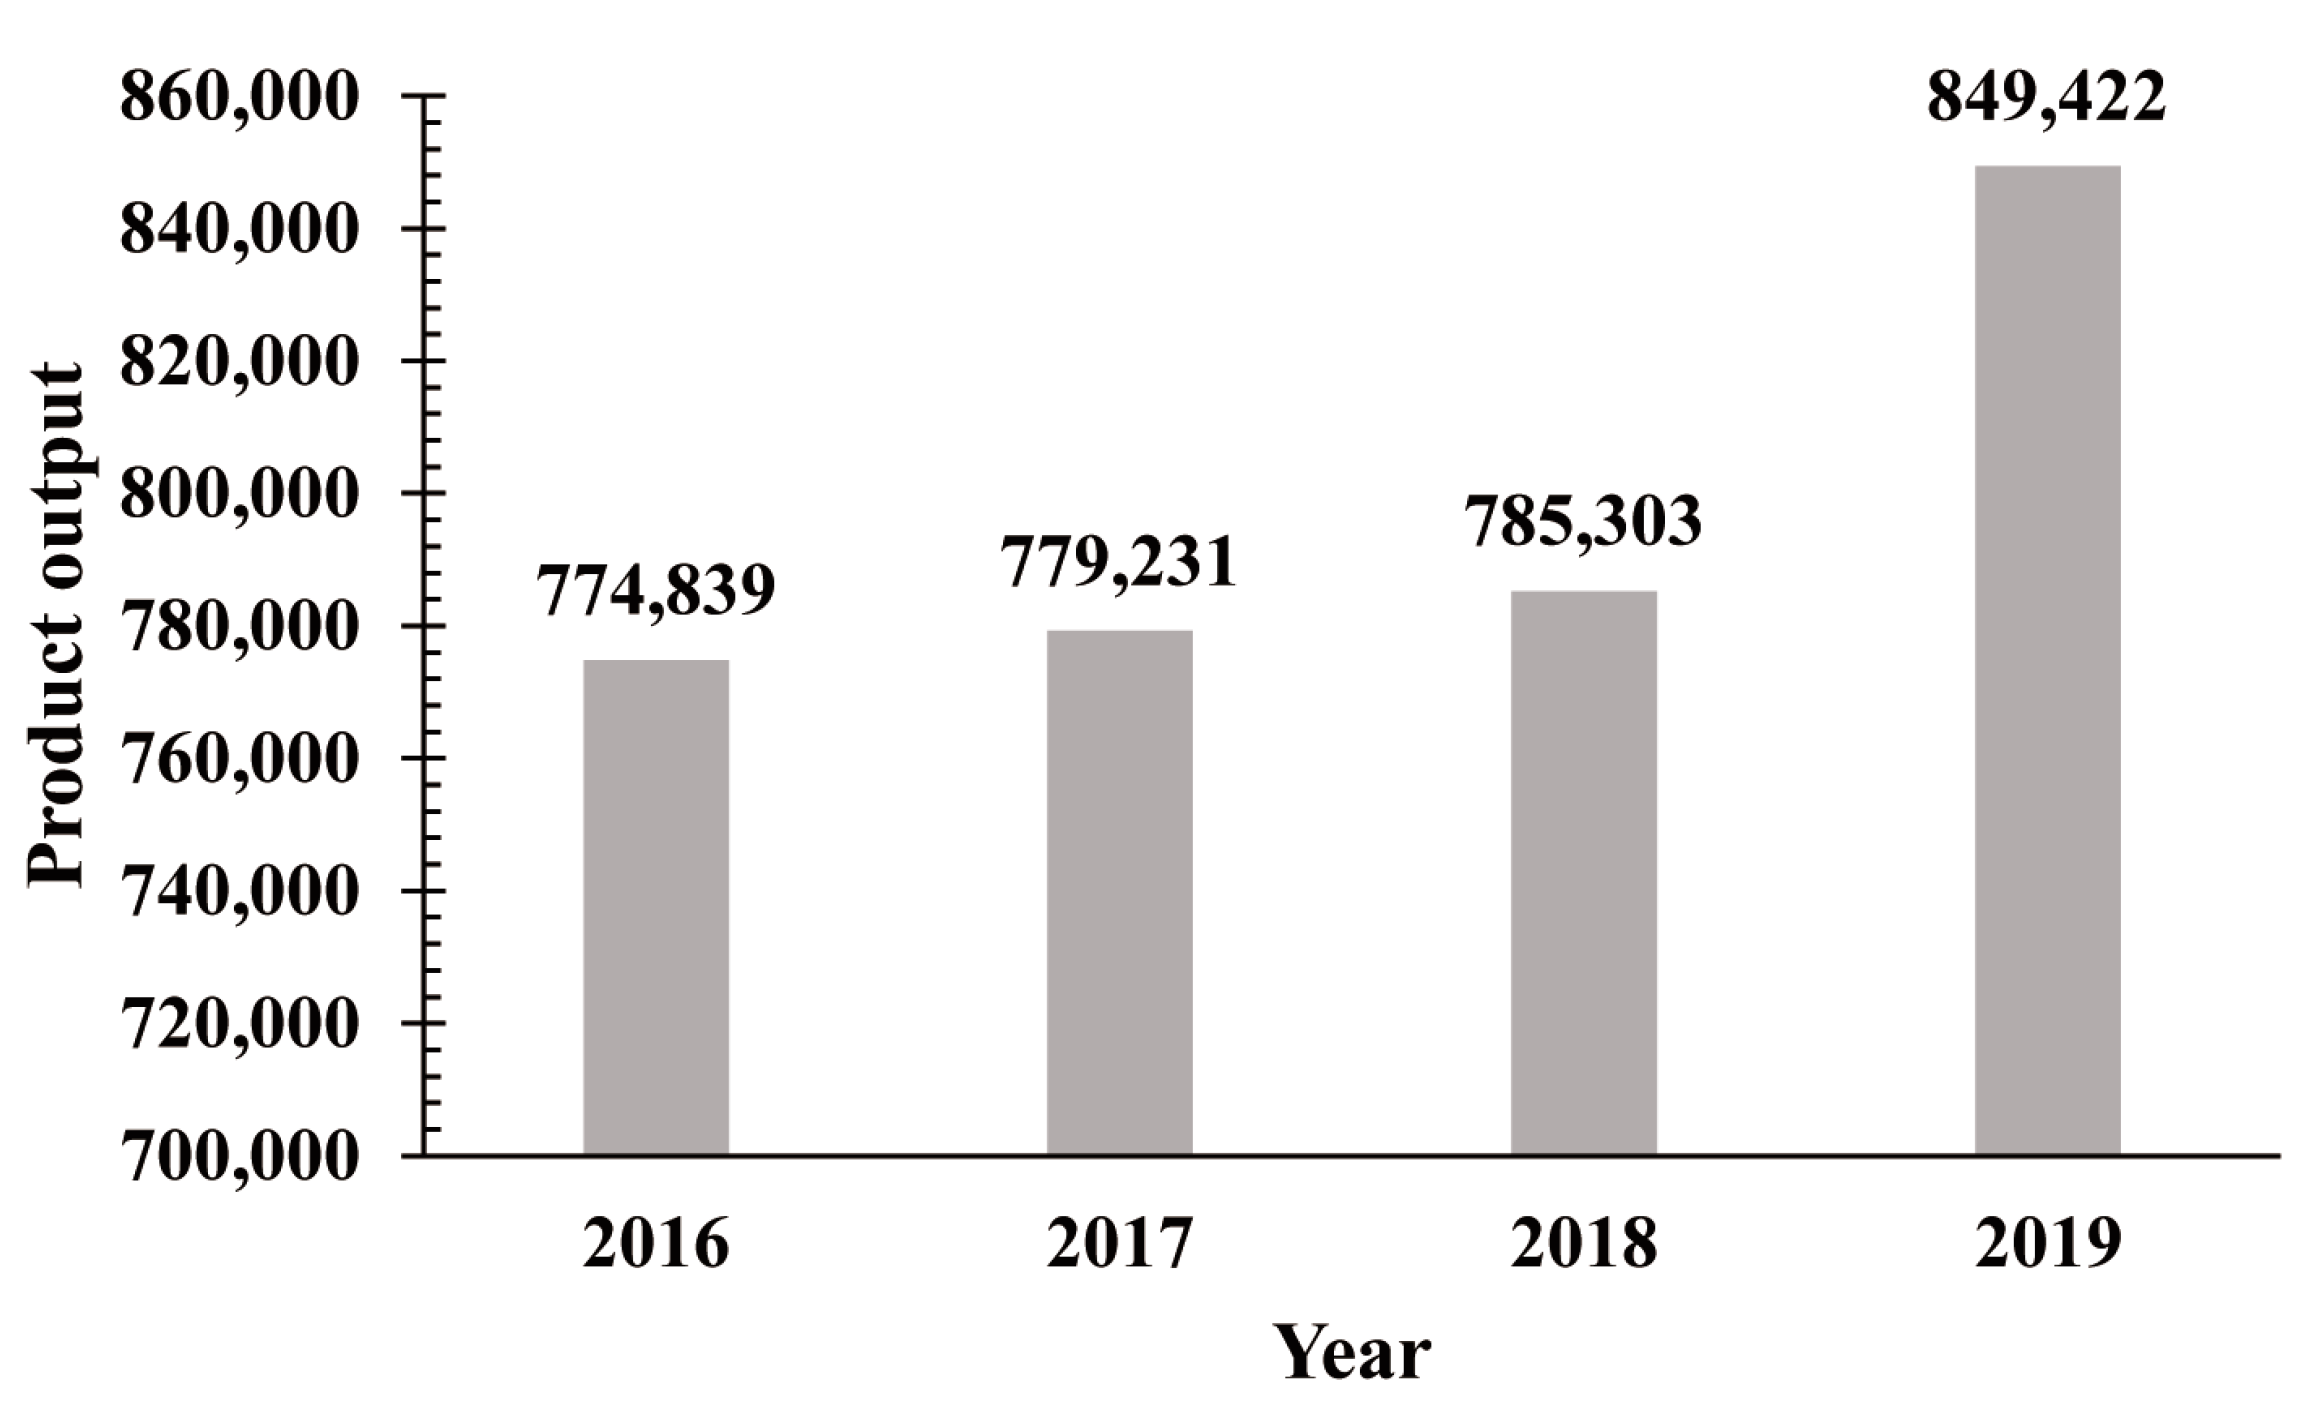
In order to verify the improvement results, the total production output, which is the main index to evaluate the production performance in the enterprise, is recorded. The total production outputs of Enterprise Q from 2016 to 2019 are shown in Figure 7 (theoretical load times in the four years are nearly the same). It can be seen that the production output in 2019 has a sharp increase, compared to the steady rise from 2016 to 2018.

6.2. Improvements in the Measurement Effects

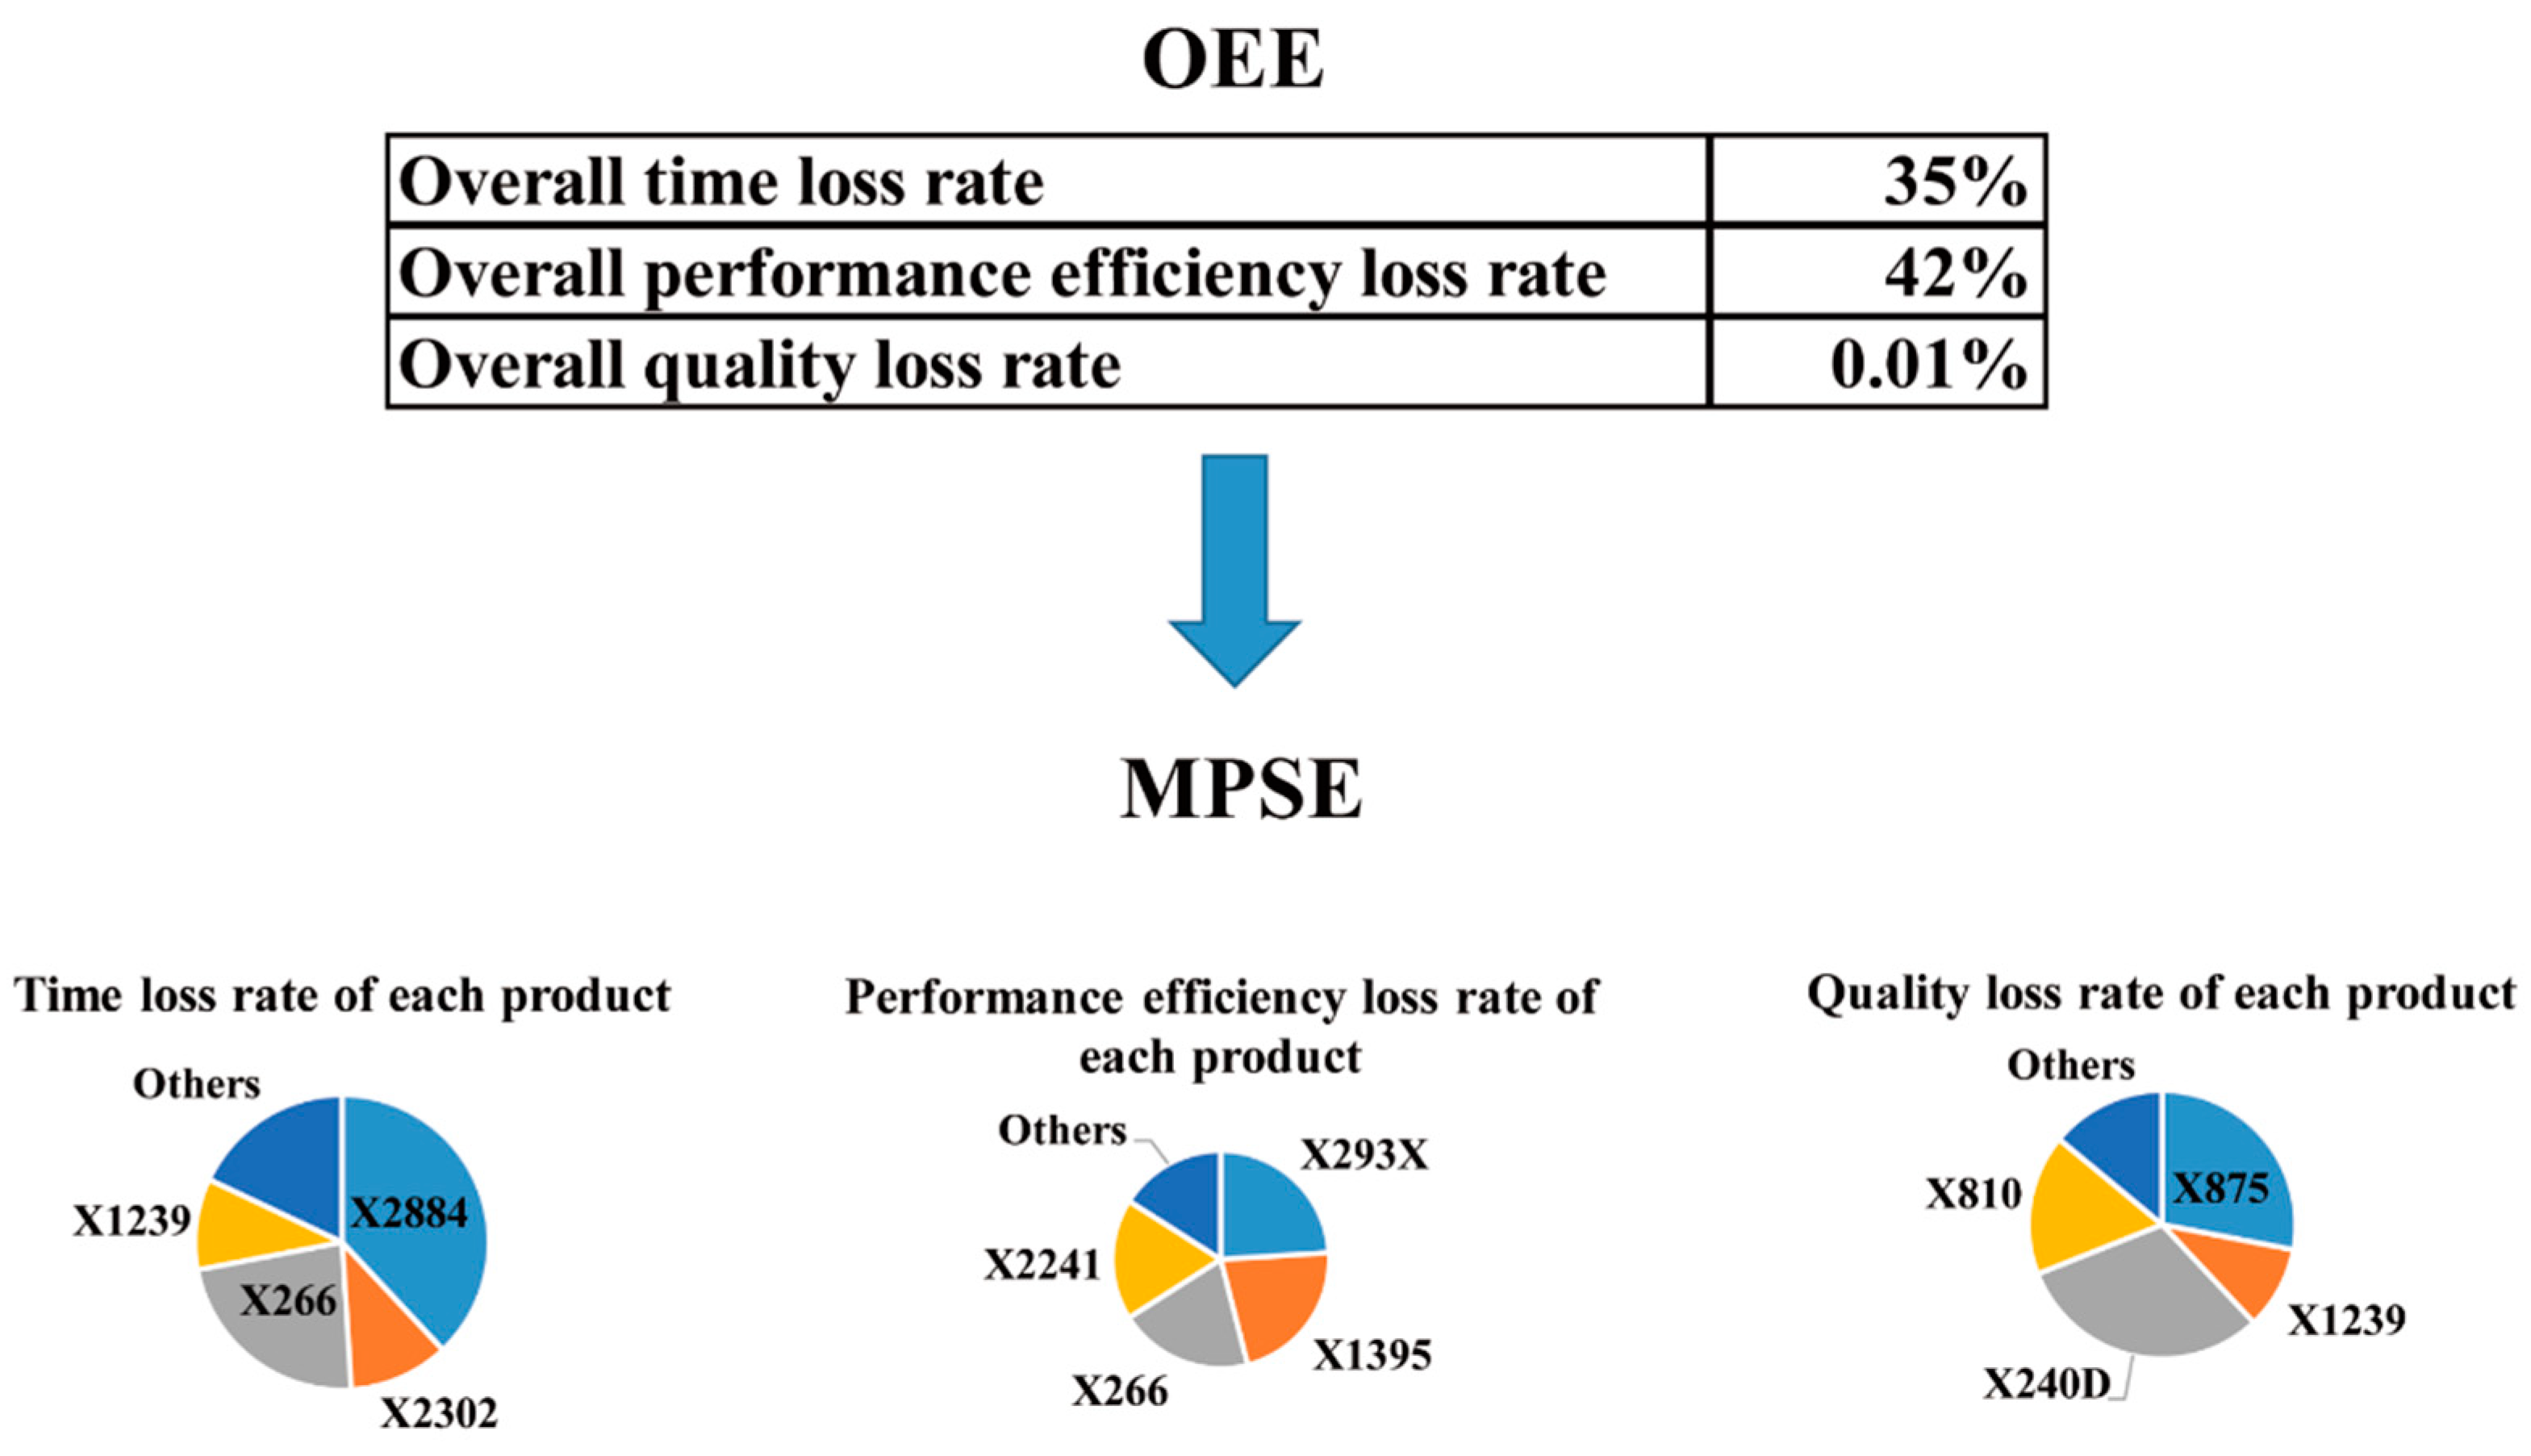
Adequacy. Based on MPSE, each item of product information such as the time loss rate, the performance effectiveness loss rate, and the quality loss rate could be calculated, besides the corresponding overall system indicator. However, we could only acquire the overall system indicator, including overall time loss rate, overall performance effectiveness loss rate, quality loss rate, and so on, in an imprecise way if we adopted the mainstream OEE measurement methods, such as PEE, TEEP, and so on. In addition, the specific information for each product could not be obtained, as shown in Figure 8.
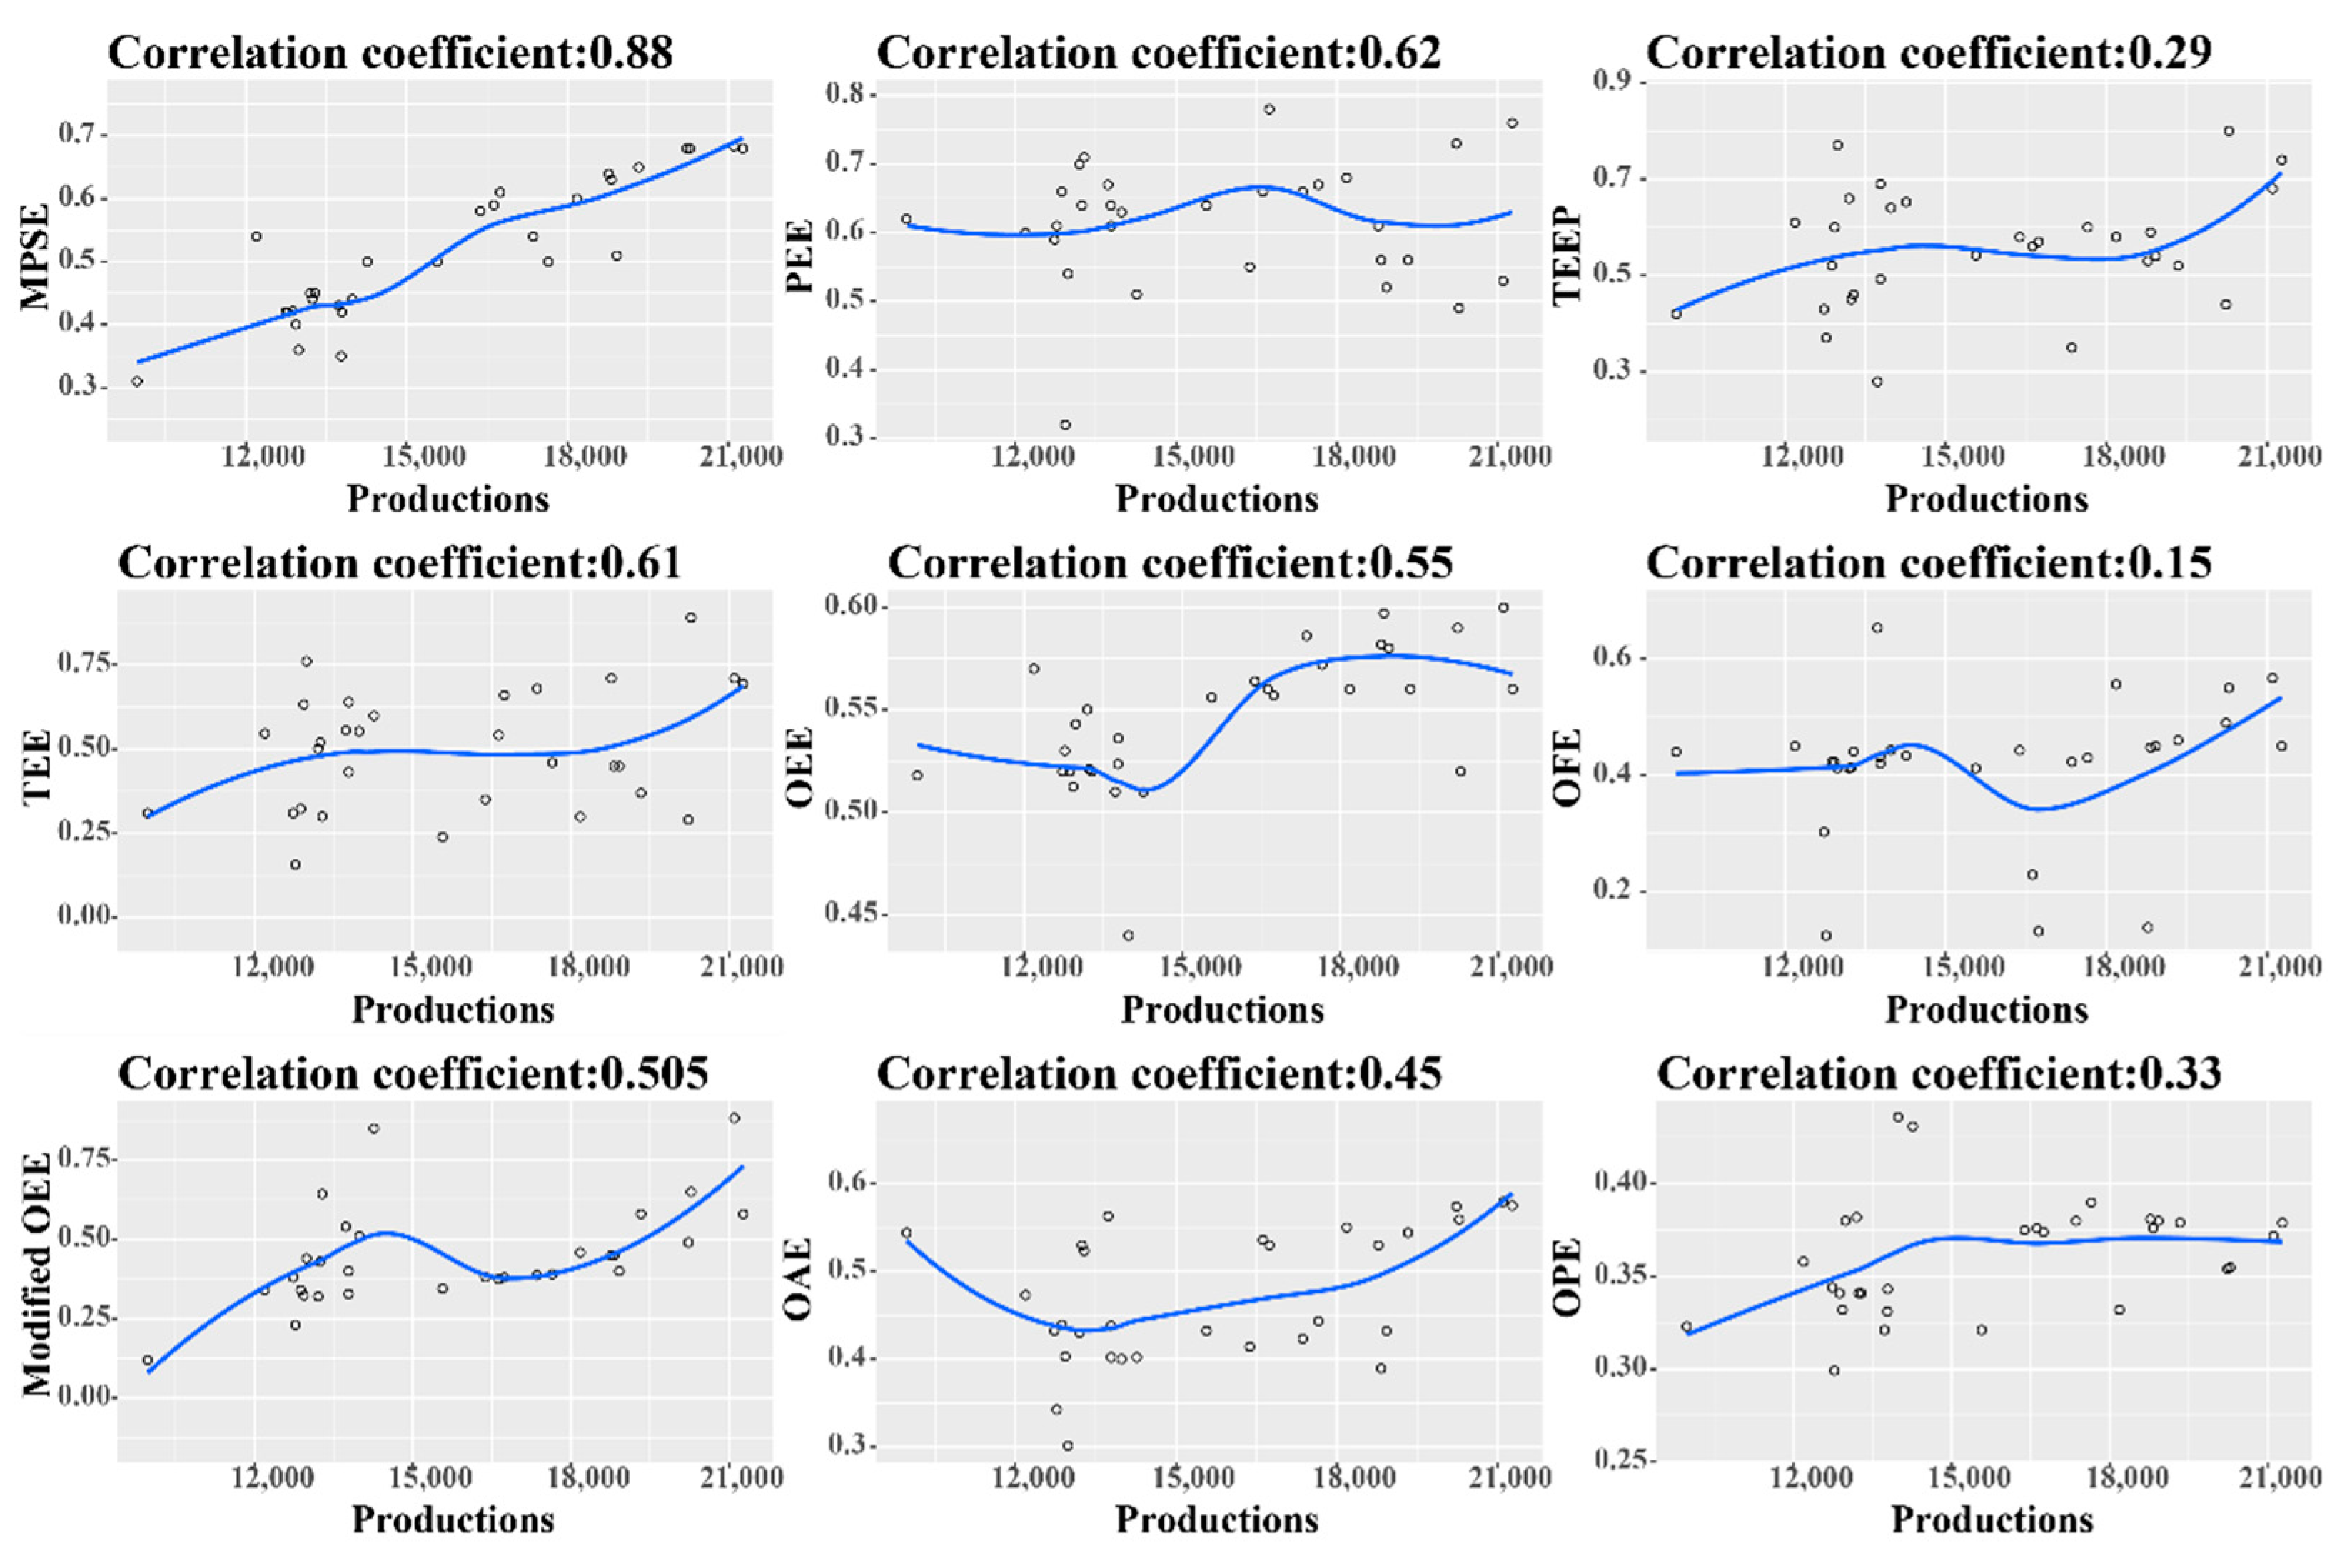
Flexibility. The Pearson correlation coefficient is a statistical index of the degree of linear correlation between variables [65,66]. In this paper, the Pearson correlation coefficient represents the correlation between the measured system’s production effectiveness in different measurement methods and the actual average hourly production. Therefore, we chose the Pearson correlation coefficient as the criterion to compare these different measurement methods. From Figure 9, it is clear that the Pearson correlation coefficient is 0.88 when we apply MPSE as the measurement method into the production system. By comparison, the figure for OEE is only 0.55. Besides, we can find the figure for MPSE is the largest, which means that MPSE is the most appropriate method to measure the multiproduct production system flexibly.
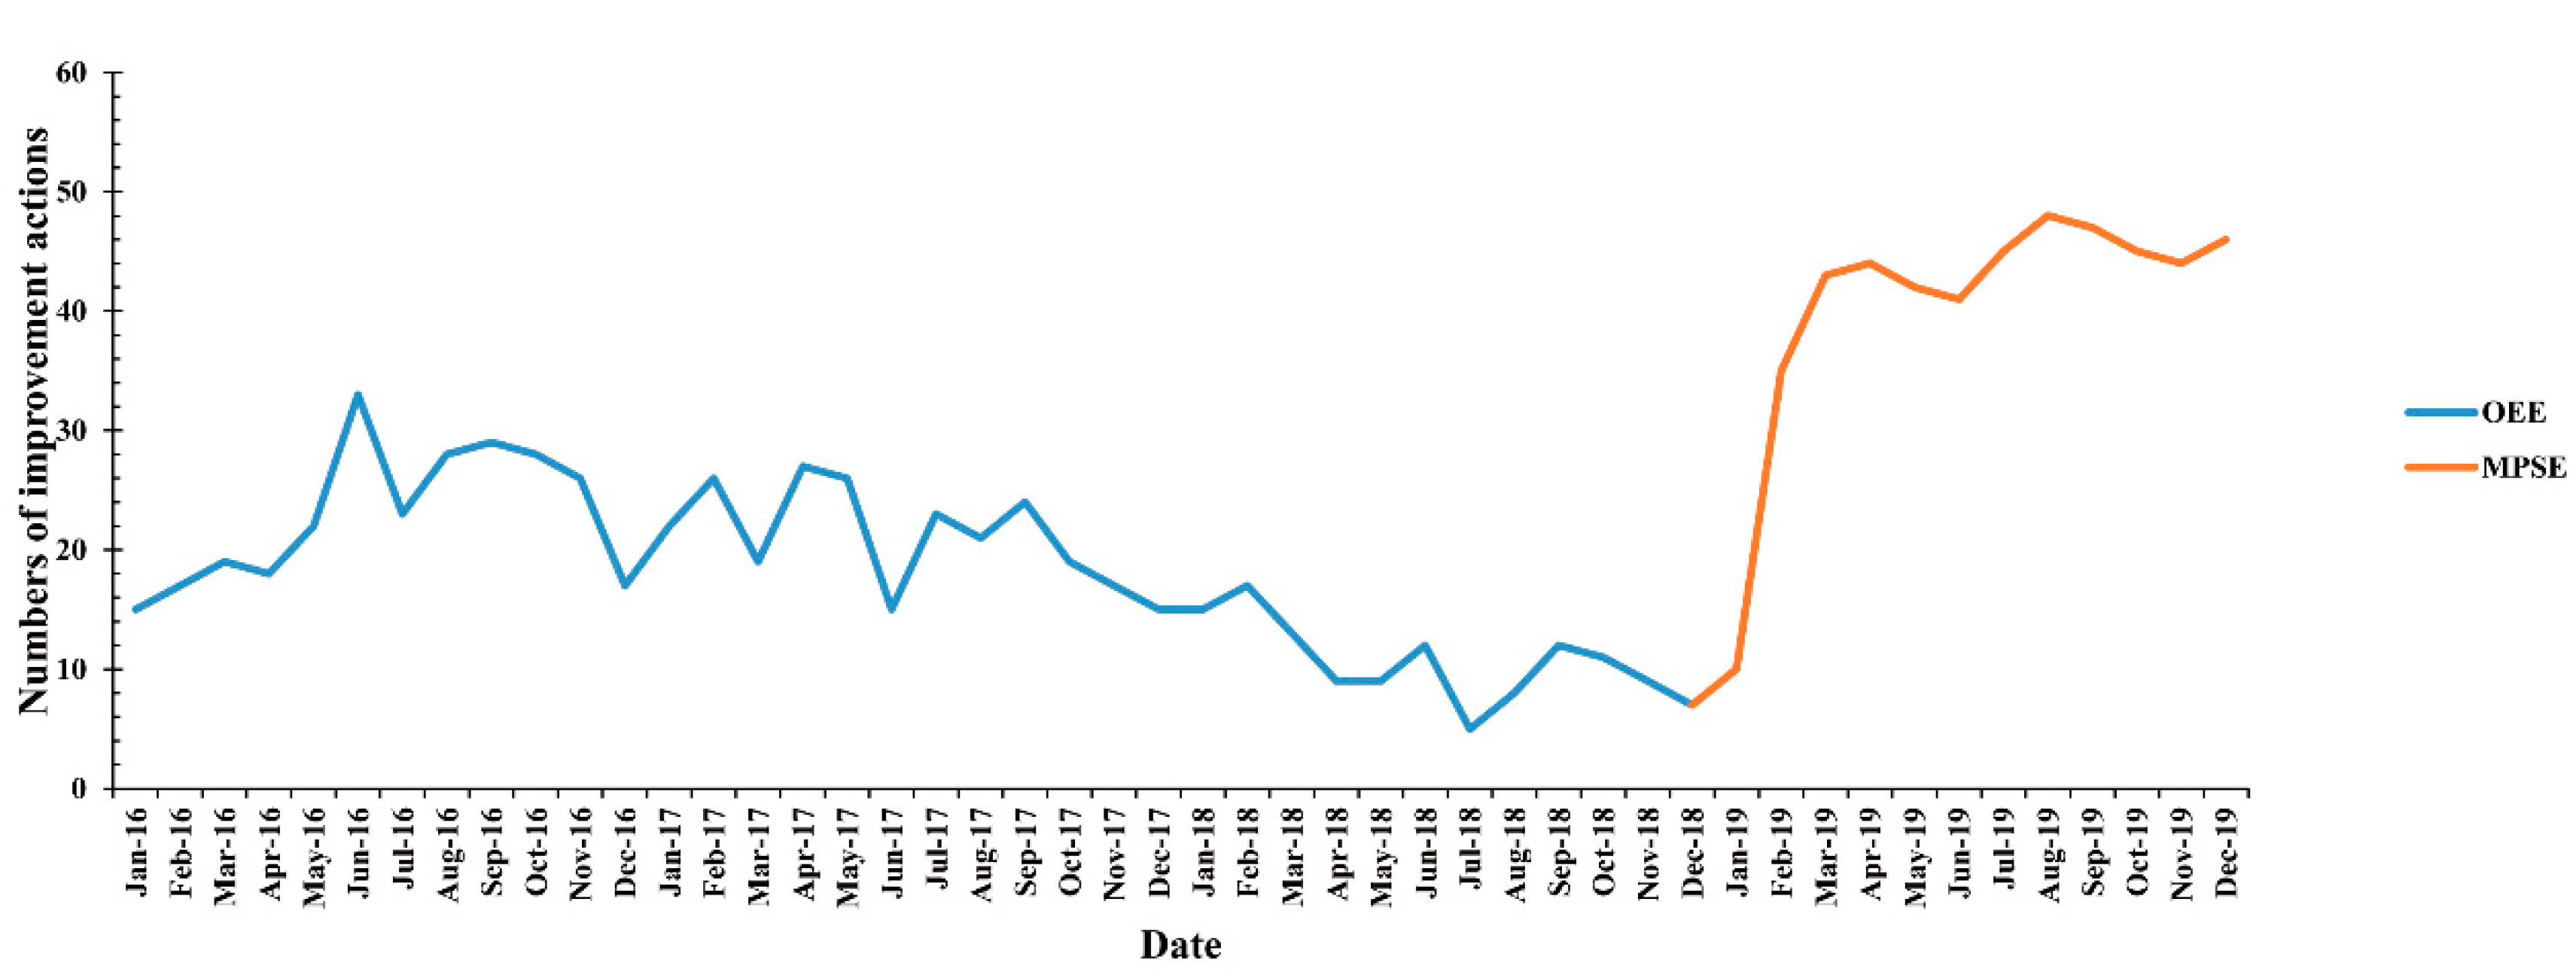
The number of improved actions. Based on MPSE and its application framework, the figure for improved actions has a great increase, as in Figure 10, which benefits the improvement and the continuous development of the multiproduct production system.

7. Discussion, Research Implications and Further Research Directions

7.1. Discussion

This study presented MPSE and its application framework that can be used for the effectiveness measurement of the multiproduct production system. The steps of MPSE were designed by a heuristic idea, also, the application framework was proposed based on the PDCA cycle. The validity of MPSE and its application framework were proved by a real case study in a manufacturing factory.
We found that the MPSE would provide the factories with the competitive benefits of production effectiveness measurement in terms of adequacy and flexibility. That is because the system would be divided into some subsystems when we calculate the indicators from the holistic perspective and the data in all subsystems would be recorded, thereby measuring the overall system performance adequately. Meanwhile, the dynamic indicators, such as the bottlenecks of products in different processes, are adopted to supervise the multiproduct production system, which would be beneficial to measure the production system flexibly. Besides, the number of improved actions increased obviously. The reason is that the application framework of MPSE is a closed-loop management system. It would focus on the whole manufacturing process and distinguish those products which influence the whole system most negatively, which is barely concluded by former OEE measurement methods. Meanwhile, some improved actions are proposed for the manufacturing process of these products. Therefore, the number of improved actions would increase as there are changes in the manufacturing environment and external demands, which would provide a continuous improvement for the multiproduct production system’s production effectiveness.

7.2. Research Implications

7.2.1. Theoretical Implications

Traditional OEE measurement methods significantly contribute to the factory’s measurement of production effectiveness. However, these measurement methods cannot be efficiently applied into the multiproduct production system because of its changeable manufacturing environment and complex production process. Previous studies failed to combine OEE with the multiproduct production system. In this study, we propose the MPSE, a novel measurement method, which could fit the multiproduct production system well. In addition, MPSE’s application framework, which enhances the continuous improvement of the manufacturing factory, is presented. This paper extends the literature in two significant ways. Firstly, it enriches OEE theory by extending the theory to the field of the multiproduct production system. Secondly, it contributes to the research of MPSE’s application framework which can be used to improve the performance of the system continuously. It is expected that these findings of the study will attract more focused studies on measurement and improvement of the multiproduct production system.

7.2.2. Managerial Implications

The multiproduct production system has been widely adopted in modern manufacturing factories in order to satisfy various demands from the consumers. However, mainstream measurement methods could not provide the detailed information of the system comprehensively, and the proposals of improvement to the system are ignored by these methods. This paper contributes a novel measurement method, MPSE, to reflect the detailed information of the multiproduct production system, and the information can be analyzed to support the manager’s decisions. Besides, the application framework of MPSE would select the product which needs to be improved and present a viable path to improve the manufacturing of the product, which provides the learnings to the managers. What’s more, MPSE can also be a useful tool to measure production systems with the rise of Industry 4.0.

7.3. Further Research Directions

The multiproduct production system is more complicated and changeable compared with the traditional single-product production system. Therefore, more precise information is needed for managing the multiproduct production system. This study has a few limitations that provide the research directions in the future.
Many data are needed when we apply MPSE in the multiproduct production system. Therefore, we have to collect the data from the equipment instantly. However, when the manufacturing system changes many times in a short period, we may not get instant data, leading to the inaccurate result. Thus, the combination of MPSE and IoT should be explored in the future.
In this paper, we assumed the measurement of the multiproduct production system would not be interfered by the restriction of the resource, such as the human, capital, and so on. We verified the validity of MPSE and its application framework by a real case study which is seldom restricted by the resources. However, in some other manufacturing environments, the resources may influence the measurement and improvement of the system. Therefore, measurement methods of the multiproduct production system with finite resource constraints could be considered.
Different businesses have different multiproduct production systems. This study only focuses on one kind of multiproduct production system. Thus, more kinds of multiproduct production systems and their characteristics should be included in future research, thereby ensuring boarder application of MPSE.

Author Contributions

Conceptualization, X.L.; methodology, X.L. and X.H.; software, X.L.; validation, X.L., X.H. and G.L.; formal analysis, X.L., X.H. and G.L.; investigation, X.L., X.H., and G.L.; resources, X.L., X.H. and G.L.; data curation, X.L., X.H. and G.L.; writing—original draft preparation, X.L.; writing—review and editing, X.L. and X.H.; visualization, X.L.; supervision, X.H. and G.L.; project administration, X.H. and G.L.; funding acquisition, G.L. All authors have read and agreed to the published version of the manuscript.

Funding

This research was funded by the Chinese National Funding of Social Sciences, grant number 15ZDC030 and the Social Science Planning Project of Shanghai, grant number 12002420546.

Institutional Review Board Statement

Not applicable.

Informed Consent Statement

Not applicable.

Data Availability Statement

The data presented in this study are available on request from the corresponding author. The data are not publicly available due to the business secret.

Acknowledgments

All authors gratefully acknowledge the support from Chinese National Funding of Social Sciences and the Shanghai Planning Office of Philosophy and Social Science. In addition, we appreciate the cooperation of Enterprise Q as well as the meticulous comments from reviewers.

Conflicts of Interest

The authors declare no conflict of interest.

References

  1. Torales, J.; O’Higgins, M.; Castaldelli-Maia, J.; Ventriglio, A. The outbreak of COVID-19 coronavirus and its impact on global mental health. Int. J. Soc. Psychiatr. 2020, 66, 317–320. [Google Scholar] [CrossRef] [PubMed] [Green Version]
  2. Ma, Y.; Zhao, Y.; Liu, J.; He, X.; Wang, B.; Fu, S.; Yan, J.; Niu, J.; Zhou, J.; Luo, B. Effects of temperature variation and humidity on the death of COVID-19 in Wuhan, China. Sci. Total Environ. 2020, 724, 138226. [Google Scholar] [CrossRef] [PubMed]
  3. Feng, L. Robustness Evaluation of Flexible Manufacturing System Considering the Static & Dynamic Manufacturing Environment. In Proceedings of the 2009 International Conference on Information Management, Innovation Management and Industrial Engineering, Xi’an, China, 26–27 December 2009. [Google Scholar]
  4. Zhu, X.P. Analysis and Improvement of Enterprise’s Equipment Effectiveness Based on OEE. In Proceedings of the 2011 International Conference on Electronics, Communications and Control (ICECC), Ningbo, China, 9–11 September 2011. [Google Scholar]
  5. Tang, H.; Li, D.; Wang, S.; Dong, Z. CASOA: An architecture for agent-based manufacturing system in the context of Industry 4.0. IEEE Access. 2018, 6, 12746–12754. [Google Scholar] [CrossRef]
  6. Koch, A. OEE für das Produktionsteam. Das Vollständige OEE-Benutzerhandbuch—Oder Wie Sie Die Verborgene Maschine Entdecken, 3rd ed.; CETPM Publishing: Herrieden, Germany, 2016. [Google Scholar]
  7. Schmitt, J.; Engelmann, B.; Brutigam, V.; Miller, E.; Schmitt, S. Advances in Machine Learning Detecting Changeover Processes in Cyber Physical Production Systems. J. Manuf. Mater. Process. 2020, 4, 108. [Google Scholar]
  8. Focke, M.; Steinbeck, J. Steigerung der Anlagenproduktivität Durch OEE-Management. Definitionen, Vorgehen und Methoden—Von Manuell bis Industrie 4.0, 1st ed.; Springer Gabler: Wiesbaden, Germany, 2018. [Google Scholar]
  9. Ng Corrales, L.C.; Lambán, M.P.; Hernandez Korner, M.E.; Royo, J. Overall Equipment Effectiveness: Systematic Literature Review and Overview of Different Approaches. Appl. Sci. 2020, 10, 6469. [Google Scholar] [CrossRef]
  10. Hwang, G.; Lee, J.; Park, J.; Chang, T. Developing performance measurement system for internet of things and smart factory environment. Int. J. Prod. Res. 2017, 55, 2590–2602. [Google Scholar] [CrossRef]
  11. Dovere, E.; Cavalieri, S.; Ierace, S. RFID systems for moveable asset management: An assessment model. Int. J. Prod. Res. 2017, 55, 1336–1349. [Google Scholar] [CrossRef]
  12. Poorya, G.Y.; Aydin, A.; Majid, H. An empirical investigation of the relationship between overall equipment efficiency (OEE) and manufacturing sustainability in industry 4.0 with time study approach. Sustainability 2018, 10, 3031. [Google Scholar]
  13. Maideen, N.C.; Sahudin, S.; Yahya, N.H.M.; Norliawati, A.O. Practical framework: Implementing OEE method in manufacturing process environment. In Proceedings of the 2015 2nd International Manufacturing Engineering Conference(iMEC)/3rd Asia-Pacific Conference on Manufacturing Systems (APCOMS), Kuala Lumpur, Malaysia, 12–14 November 2015. [Google Scholar]
  14. Domingo, R.; Aguado, S. Overall environmental equipment effectiveness as a metric of a lean and green manufacturing system. Sustainability 2015, 7, 1–17. [Google Scholar]
  15. Mahmoud, A.A.; Aly, M.F.; Mohib, A.M.; Afefy, I.H. New optimization model for multi-period multi-product production planning system with uncertainty. Ind. Eng. Manag. Syst. 2019, 18, 872–883. [Google Scholar] [CrossRef]
  16. Talay, I.; Ozdemirakyildirim, O.O. Optimal procurement and production planning for multi-product multi-stage production under yield uncertainty. Eur. J. Oper. Res. 2019, 275, 536–551. [Google Scholar] [CrossRef]
  17. Liu, X.J.; Zhao, F.; Ma, X.Y. Joint optimal multi-product production and non-cyclical preventive maintenance planning model. Chin. J. Manag. Sci. 2017, 25, 189–196. (In Chinese) [Google Scholar]
  18. Ettaye, G.; El Barkany, A.; Jabri, A.; El Khalfi, A. Optimizing the integrated production and maintenance planning using genetic algorithm. Int. J. Eng. Bus. Manag. 2018, 10, 1847979018773260. [Google Scholar] [CrossRef] [Green Version]
  19. Lu, S.; Xie, L.; Zhu, L.; Su, H.Y. Integrated scheduling of a hybrid manufacturing and recovering system in a multi-product multi-stage environment with carbon emission. J. Clean. Prod. 2019, 222, 695–709. [Google Scholar] [CrossRef]
  20. Rauf, M.; Guan, Z.; Yue, L.; Guo, Z.; Mumtaz, J.; Ullah, S. Integrated planning and scheduling of multiple manufacturing projects under resource constraints using raccoon family optimization algorithm. IEEE Access. 2020, 8, 151279–151295. [Google Scholar] [CrossRef]
  21. Oyebolu, F.B.; Allmendinger, R.; Farid, S.S.; Branke, J. Dynamic scheduling of multi-product continuous biopharmaceutical facilities: A hyper-heuristic framework. Comput. Chem. Eng. 2019, 125, 71–88. [Google Scholar] [CrossRef] [Green Version]
  22. Du, S.C.; Xu, R.; Li, L. Modeling and analysis of multiproduct multistage manufacturing system for quality improvement. IEEE Trans. Syst. Man Cybern. Syst. 2018, 48, 801–820. [Google Scholar]
  23. Zhang, Y.J.; Gu, C.C.; Wang, J.; Zhang, L.G.; Hu, X.; Ma, X.D. Dynamic modeling method of mission reliability of a multi-state manufacturing system with multiple production lines. IEEE Access 2020, 8, 57012–57023. [Google Scholar] [CrossRef]
  24. Nakajima, S. Introduction to TPM; Productivity Press: Portland, OR, USA, 1988. [Google Scholar]
  25. Kumar, U.; Galar, D.; Parida, A.; Stenstrom, C.; Berges, L. Maintenance performance metrics: A state-of-the-art review. J. Qual. Maint. Eng. 2013, 19, 233–277. [Google Scholar] [CrossRef] [Green Version]
  26. Ivancic, I. Development of maintenance in modern production. In Proceedings of the Euromaintenance’98 Conference, Dubrovnik, Hrvatska, 5–7 October 1998. [Google Scholar]
  27. Raouf, A. Improving capital productivity through maintenance. Int. J. Oper. Prod. Man. 1994, 14, 44–52. [Google Scholar] [CrossRef]
  28. Scott, D.; Pisa, R. Can overall factory effectiveness prolong Moore’s law? Solid State Technol. 1998, 41, 75–82. [Google Scholar]
  29. Huang, S.H.; Dismukes, J.P.; Shi, J.; Su, Q.; Razzak, M.A.; Bodhale, R.; Robinson, D.E. Manufacturing productivity improvement using effectiveness metrics and simulation analysis. Int. J. Prod. Res. 2003, 41, 513–527. [Google Scholar] [CrossRef]
  30. Jonsson, P.; Lesshammar, M. Evaluation and improvement of manufacturing performance measurement system—The role of OEE. Int. J. Oper. Prod. Man. 1999, 19, 55–78. [Google Scholar]
  31. Sheu, D.D. Overall input efficiency and total equipment efficiency. IEEE Trans. Semicond. Manuf. 2006, 19, 496–501. [Google Scholar] [CrossRef] [Green Version]
  32. Ron, A.J.D.; Rooda, J.E. Equipment effectiveness: OEE revisited. IEEE Trans. Semicond. Manuf. 2005, 18, 190–196. [Google Scholar]
  33. Chien, C.; Chen, H.; Wu, J.; Hu, C. Constructing the OGE for promoting tool group productivity in semiconductor manufacturing. Int. J. Prod. Res. 2007, 45, 509–524. [Google Scholar] [CrossRef]
  34. Raja, P.N.; Kannan, S.M.; Jeyabalan, V. Overall line effectiveness—A performance evaluation index of a manufacturing system. Int. J. Product. Qual. Manag. 2010, 5, 38–59. [Google Scholar] [CrossRef]
  35. Chen, W.; Chien, C. Measuring relative performance of wafer fabrication operations: A case study. J. Intell. Manuf. 2011, 22, 447–457. [Google Scholar]
  36. Ghalayini, A.M.; Noble, J.S. The changing basis of performance measurement. Int. J. Oper. Prod. Man. 1996, 16, 63–80. [Google Scholar] [CrossRef]
  37. Pinto, J.K.; Slevin, D.P. Critical factors in successful project implementation. IEEE Trans. Eng. Manag. 1987, 34, 22–27. [Google Scholar] [CrossRef]
  38. Ylipaa, T.; Skoogh, A.; Bokrantz, J.; Gopalakrishnan, M. Identification of maintenance improvement potential using OEE assessment. Int. J. Product. Qual. Manag. 2017, 66, 126–143. [Google Scholar] [CrossRef]
  39. Mathur, A.; Dangayach, G.S.; Mittal, M.L.; Sharma, M.K. Performance measurement in automated manufacturing. Meas. Bus. Excell. 2011, 15, 77–91. [Google Scholar] [CrossRef]
  40. Yu, M.C.; Greene, T.J. An operational measure of routing flexibility in a multi-stage multi-product production system. Int. J. Adv. Manuf. Technol. 2009, 43, 357–364. [Google Scholar] [CrossRef]
  41. Vogelheuser, B.; Schutz, D.; Frank, T.; Legat, C. Model-driven engineering of manufacturing automation software projects—A SysML-based approach. Mechatronics. 2014, 24, 883–897. [Google Scholar] [CrossRef]
  42. Weber, C.; Fayed, A. Scale, scope, and speed—managing the challenges of multiproduct manufacturing. IEEE Trans. Semicond. Manuf. 2009, 23, 30–38. [Google Scholar] [CrossRef]
  43. Nakata, T.; Matsui, K.; Miyake, Y.; Nishioka, K. Dynamic bottleneck control in wide variety production factory. IEEE Trans. Semicond. Manuf. 1999, 12, 273–280. [Google Scholar] [CrossRef]
  44. Zhao, C.; Li, J.S. Analysis and improvement of multiproduct Bernoulli serial lines: Theory and application. IEEE Trans. Syst. Man Cybern. Syst. 2015, 45, 1218–1230. [Google Scholar] [CrossRef]
  45. Rofstad, E.K. Microenvironment-induced cancer metastasis. Int. J. Radiat. Biol. 2000, 76, 589–605. [Google Scholar] [CrossRef]
  46. Hoshino, S.; Seki, H.; Naka, Y.; Ota, J. Multirobot coordination for flexible batch manufacturing systems experiencing bottlenecks. IEEE Trans. Autom. Sci. Eng. 2010, 7, 887–901. [Google Scholar] [CrossRef]
  47. Kotler, P.; Keller, K. Marketing Management, 15th ed.; Pearson Education Limited: Harlow, UK, 2015. [Google Scholar]
  48. Kirsila, J.; Hellstrom, M.; Wikstrom, K. Integration as a project management concept: A study of the commissioning process in industrial deliveries. Int. J. Proj. Manag. 2007, 25, 714–721. [Google Scholar] [CrossRef]
  49. Boschmauchand, M.; Belkadi, F.; Bricogne, M.; Eynard, B. Knowledge-based assessment of manufacturing process performance: Integration of product lifecycle management and value-chain simulation approaches. Int. J. Comput. Integ. M. 2013, 26, 453–473. [Google Scholar] [CrossRef]
  50. Kong, T.; Li, G.; Feng, T.W.; Sun, L.Y. Effects of marketing–manufacturing integration across stages of new product development on performance. Int. J. Prod. Res. 2015, 53, 2269–2284. [Google Scholar] [CrossRef]
  51. Mohammad, R.; Mostafa, N. Integration of Production Planning and Scheduling in Multi-Products Continuous Process Industries. Int. J. Prod. Econ. 2011, 22, 113–126. [Google Scholar]
  52. Swink, M.; Narasimhan, R.; Kim, S.W. Manufacturing Practices and Strategy Integration: Effects on Cost Efficiency, Flexibility, and Market-Based Performance. Decision. Sci. 2005, 36, 427–457. [Google Scholar] [CrossRef]
  53. Nejad, H.T.N.; Sugimura, N.; Iwamura, K. Agent-based dynamic integrated process planning and scheduling in flexible manufacturing systems. Int. J. Prod. Res. 2011, 49, 1373–1389. [Google Scholar] [CrossRef]
  54. Shen, X.N.; Yao, X. Mathematical modeling and multi-objective evolutionary algorithms applied to dynamic flexible job shop scheduling problems. Inform. Sci. 2015, 298, 198–224. [Google Scholar] [CrossRef] [Green Version]
  55. Mahadevan, S. Automated simulation analysis of overall equipment effectiveness metrics. Int. J. Numer. Methods Eng. 2004, 57, 1577–1602. [Google Scholar]
  56. Yao, Y.; Kaihara, T.; Fujii, N. 212 A Study on Integration of Interdivisional Scheduling in Dynamically Changing Manufacturing Environment: Cooperation of Divisional and Interdivisional Scheduling. J. Adv. Mech. Des. Syst. 2011, 6, 572–580. [Google Scholar] [CrossRef] [Green Version]
  57. Ma, J.; Chen, H.; Zhang, Y.; Guo, H.; Liu, L. A digital twin-driven production management system for production workshop. Int. J. Adv. Manuf. Tech. 2020, 110, 1385–1397. [Google Scholar] [CrossRef]
  58. Shanker, M.; Hu, M.Y.; Hung, M.S. Effect of data standardization on neural network training. Omega Int. J. Manage. S. 1996, 24, 385–397. [Google Scholar] [CrossRef]
  59. Mark, E.; Jan, C. Standardization and Certification Challenges for Biopharmaceutical Plants. Computer 2017, 50, 83–86. [Google Scholar]
  60. Jones, E.C.; Parast, M.M.; Adams, S.G. A framework for effective six sigma implementation. Total Qual. Manag. Bus. 2010, 21, 415–424. [Google Scholar] [CrossRef]
  61. Matsuo, M.; Nakahara, J. The effects of the PDCA cycle and OJT on workplace learning. Int. J. Hum. Resour. Man. 2013, 24, 195–207. [Google Scholar] [CrossRef]
  62. Ren, M.M.; Ling, N.; Wei, X.; Fan, S.H. The application of PDCA cycle management in project management. In Proceedings of the 2015 International Conference on Computer Science and Applications (CSA), Wuhan, China, 20–22 November 2015. [Google Scholar]
  63. Muchiri, P.; Pintelon, L. Performance measurement using overall equipment effectiveness (OEE): Literature review and practical application discussion. Int. J. Prod. Res. 2008, 46, 3517–3535. [Google Scholar] [CrossRef] [Green Version]
  64. Mao, Y.H.; Xu, T. Research of 4m1e’s effect on engineering quality based on structural equation model. Syst. Eng. Procedia. 2011, 1, 213–220. [Google Scholar]
  65. Wang, J.; Zheng, N. A novel fractal image compression scheme with block classification and sorting based on Pearson’s Correlation Coefficient. IEEE Trans. Image Process. 2013, 22, 3690–3702. [Google Scholar] [CrossRef]
  66. Mu, Y.; Liu, X.; Wang, L. A Pearson’s Correlation Coefficient based decision tree and its parallel implementation. Inf. Sci. 2018, 435, 40–58. [Google Scholar] [CrossRef]
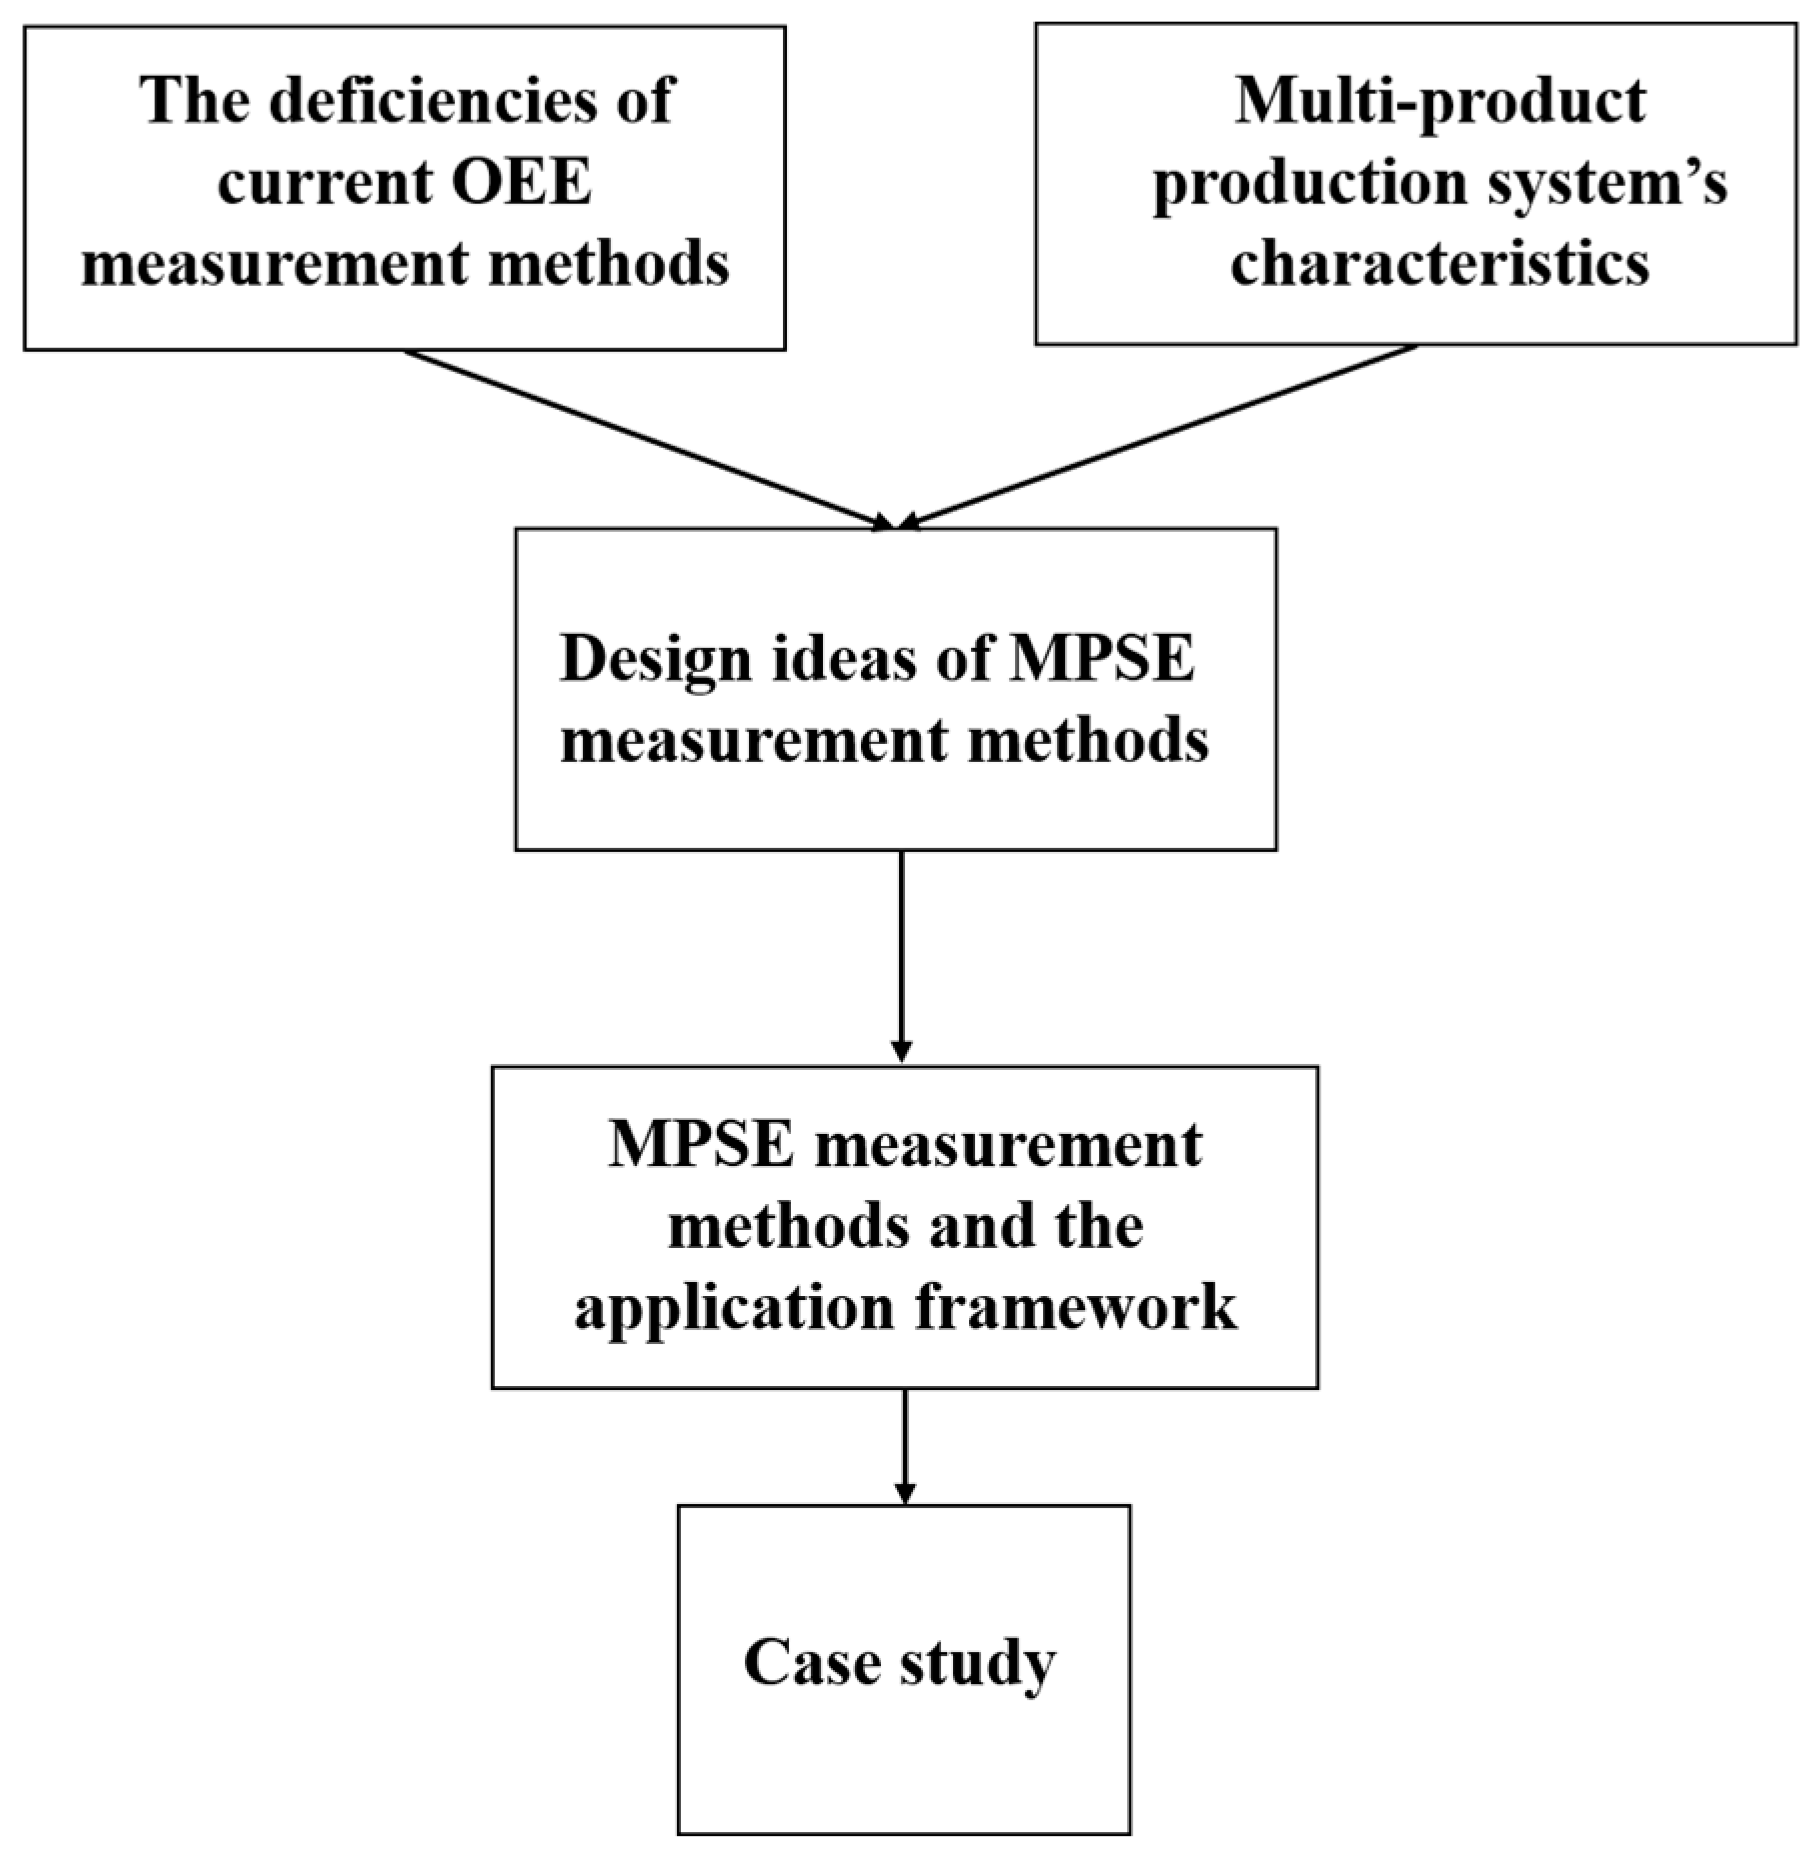
Figure 1. The research scheme.
Applsci 11 00490 g001
Figure 2. Flow chart of application framework.
Applsci 11 00490 g002
Figure 3. Manufacturing system diagram of Enterprise Q.
Applsci 11 00490 g003
Figure 4. The value of M C R s for different products.
Applsci 11 00490 g004
Figure 5. Boxplots of some products to be improved.
Applsci 11 00490 g005
Figure 6. 4M1E analysis of x 266 and improvement plans.
Applsci 11 00490 g006
Figure 7. Enterprise Q’s total output from 2016 to 2019 (standardized product count).
Applsci 11 00490 g007
Figure 8. The changes of the adequacy after using MPSE.
Applsci 11 00490 g008
Figure 9. Pearson correlation coefficients between different measurement methods and productions.
Applsci 11 00490 g009
Figure 10. Number of improved actions with OEE and MPSE.
Applsci 11 00490 g010
Table 1. Literature review about Overall Equipment Effectiveness (OEE) application and the multiproduct production system.
Author (Year)Research ObjectiveMain Finding
Hwang et al. (2017)OEE’s application based on the IoT and smart manufacturing environmentProposed model can be used to measure the real-time performance indicators.
Dovere et al. (2016)OEE’s application in tool managementThe RFID-based automatic processes are more accurate than the manual process, especially for the tool management and human errors.
Poorya et al. (2018)OEE’s application in manufacturing sustainabilityThe solution, including the intelligent system and control algorithm, has been provided to implement a sustainable, intelligent manufacturing system smoothly.
Maideen et al. (2016)OEE’s application in manufacturing process environmentA framework of implementing OEE method in manufacturing process environment is presented.
Domingo and Aguado (2015)OEE’s application in the lean and green manufacturing systemOEEE allows sustainability to be one part of the business decision.
Fung et al. (2003)Multiproduct aggregate production planningThese models can be used to improve the capability of an aggregate plan under fuzzy demands and capacity.
Mahmoud et al. (2019)Multiperiod Multiproduct Production planning systemNew optimization model for MPMP with seasonal demand is proposed.
Talay and Ozdemirakyildirim (2019)Production planning for multiproduct multistage production The improvements in different stages would contribute to the cost saving and production may not be improved by a higher demand.
Liu et al. (2017)Multiproduct production and non-cyclical preventive maintenanceOptimal production plan and maintenance schedule are determined simultaneously. Optimal maintenance schedule is not cyclical.
Ettaye et al. (2018)Production and maintenance planning in multiperiod, multiproduct, single-line production systemGenetic algorithm is suitable for the integrated planning in the context of industrial sector.
Lu et al. (2019)Hybrid manufacturing and recovering system in a multiproduct multistage environment with carbon emissionThe control of carbon emission would reduce the recycling of material, thereby increasing the operation cost.
Rauf et al. (2020)Planning and scheduling of multiple manufacturing projects under resource constraintsRaccoon family optimization algorithm performs much better than the genetic algorithm, raccoon optimization algorithm and artificial bee colonial algorithm in terms of effectiveness and efficiency.
Oyebolu et al. (2019)Multiproduct continuous biopharmaceutical facilitiesThe tuned policies outperform a policy that estimates policy parameters and a policy based on a fixed cyclical sequence.
Du et al. (2018)Quality improvement of multiproduct multistage manufacturing systemTwo novel Markov models are proposed for the quality improvement of multiproduct multistage manufacturing system. Meanwhile, product flexibility and quality prorogation are taken into account by these models.
Zhao et al. (2020)Multistate manufacturing system with multiple production linesThe characteristic of multistate manufacturing system operation is concluded and a modeling method for the mission reliability of manufacturing system is conducted.
Table 2. Descriptions and disadvantages of mainstream OEE measurement methods.
ArithmeticDescriptionDisadvantages in Multiproduct Production System
OEEIntegrates different important aspects of production into a single algorithm.These methods focus on a single piece of equipment or single production line, and do not calculate product production effectiveness and losses, which means that they cannot accurately assess the overall system, and most detailed losses cannot be discovered.
PEEOffers a more flexible way than original OEE to measure production capacity.
Revised OEEProvides a way to exclude external factors and only focuses on the equipment itself.
TEEPMeasures time loss more accurately than the original OEE.
TEEAdds the costs associated with the production process to the arithmetic.
OAE and OPEExpand the range of losses calculated.Although they can measure production effectiveness from a holistic perspective, the flaws still remain in measuring each product, so the actual production effectiveness and losses measurements are still inaccurate.
OFECalculates and analyzes losses from a broader perspective (the entire factory).
Table 3. Information derived from multiproduct production system effectiveness (MPSE).
Information from MPSEEquation
Production capacity of each productEquation (16)
Actual production effectiveness of the overall manufacturing systemEquation (17)
Performance Effectiveness (PE) of each product P E   =   x i y i ; i   =   1 I , (18)
Performance Effectiveness Loss (PEL) of each product P E L   =   1 x i y i ; i   =   1 I , (19)
Availability Rate (AR) of each product A R   =   t i z i   ; i   =   1 I , (20)
Availability Rate Loss (ARL) of each product A R L   =   1 t i z i ; i   =   1 I , (21)
Quality Rate (QR) of each product Q R   =   x i   ×   t i q i x i   ×   t i ; i   =   1 I , (22)
Quality Rate Loss (QRL) of each product Q R L   =   1 x i   ×   t i q i x i   ×   t i ; i   =   1 I , (23)
Overall Performance Effectiveness (OPE) of the factory O P E   =   i   =   1 n x i i   =   1 n y i ; i   =   1 I , (24)
Overall Performance Effectiveness Loss (OPEL) of the factory O P E L   =   1 i   =   1 n x i i   =   1 n y i ; i   =   1 I , (25)
Overall Availability Rate (OAR) of the factory O A R   =   i   =   1 n t i i   =   1 n z i   ; i   =   1 I , (26)
Overall Availability Rate Loss (OARL) of the factory O A R L   =   1 i   =   1 n t i i   =   1 n z i   ; i   =   1 I , (27)
Overall Quality Rate (OQR) of the factory O Q R   =   i   =   1 n x i   ×   t i q i i   =   1 n x i   ×   t i ; i   =   1 I , (28)
Overall Quality Rate Losses (OQRL) of the factory O Q R L   =   1 i   =   1 n x i   ×   t i q i i   =   1 n x i   ×   t i ; i   =   1 I , (29)
Theoretical Contribution Rate (TCR) of product in multiproduct production system T C R   =   y i   ×   z i i   =   1 n y i   ×   z i ; i   =   1 I , (30)
Actual Contribution Rate (ACR) of product in multiproduct production system A C R   =   x i   ×   t i q i i   =   1 n x i   ×   t i q i ; i   =   1 I , (31)
Contribution Changes (CC) of product in multiproduct production system C C   =   A C R T C R ; i   =   1 I , (32)
Minus Contribution Rate (MCR) of product in multiproduct production system M C R   =   C C i i   =   1 n | C C i | ; i   =   1 I , (33)
Performance Effectiveness Loss Rate (PELR) of each product in overall performance effectiveness losses P E L R   =   y i x i i   =   1 n y i x i ; i   =   1 I , (34)
Availability Loss Rate (ALR) of each product in overall time losses A L R   =   z i t i i   =   1 n z i t i ; i   =   1 I , (35)
Quality Loss Rate (QLR) of each product in overall quality losses Q L R   =   q i i   =   1 n q i (36)
Table 4. Part of the computation results in the statistical time by MPSE.
MPSE x 224 x 218 x 293 x 2102 x 248 A x 249
S T 1 0.580.650.690.530.710.400.60
S T 2 0.620.710.580.690.570.390.66
S T 3 0.73 0.580.780.64
S T 4 0.630.570.420.680.460.380.70
S T 5 0.550.660.430.590.860.530.69
S T 89 0.580.50 0.710.490.620.53
S T 90 0.590.570.620.590.570.450.56
S T 91 0.690.660.640.67 0.670.69
S T 92 0.610.560.600.75 0.590.68
S T 93 0.570.520.580.68 0.550.61
Publisher’s Note: MDPI stays neutral with regard to jurisdictional claims in published maps and institutional affiliations.